Potential Impact of Meat Replacers on Nutrient Quality and Greenhouse Gas Emissions of Diets in Four European Countries

 , ,
, ,  ,
,  ,
,  , and
, and 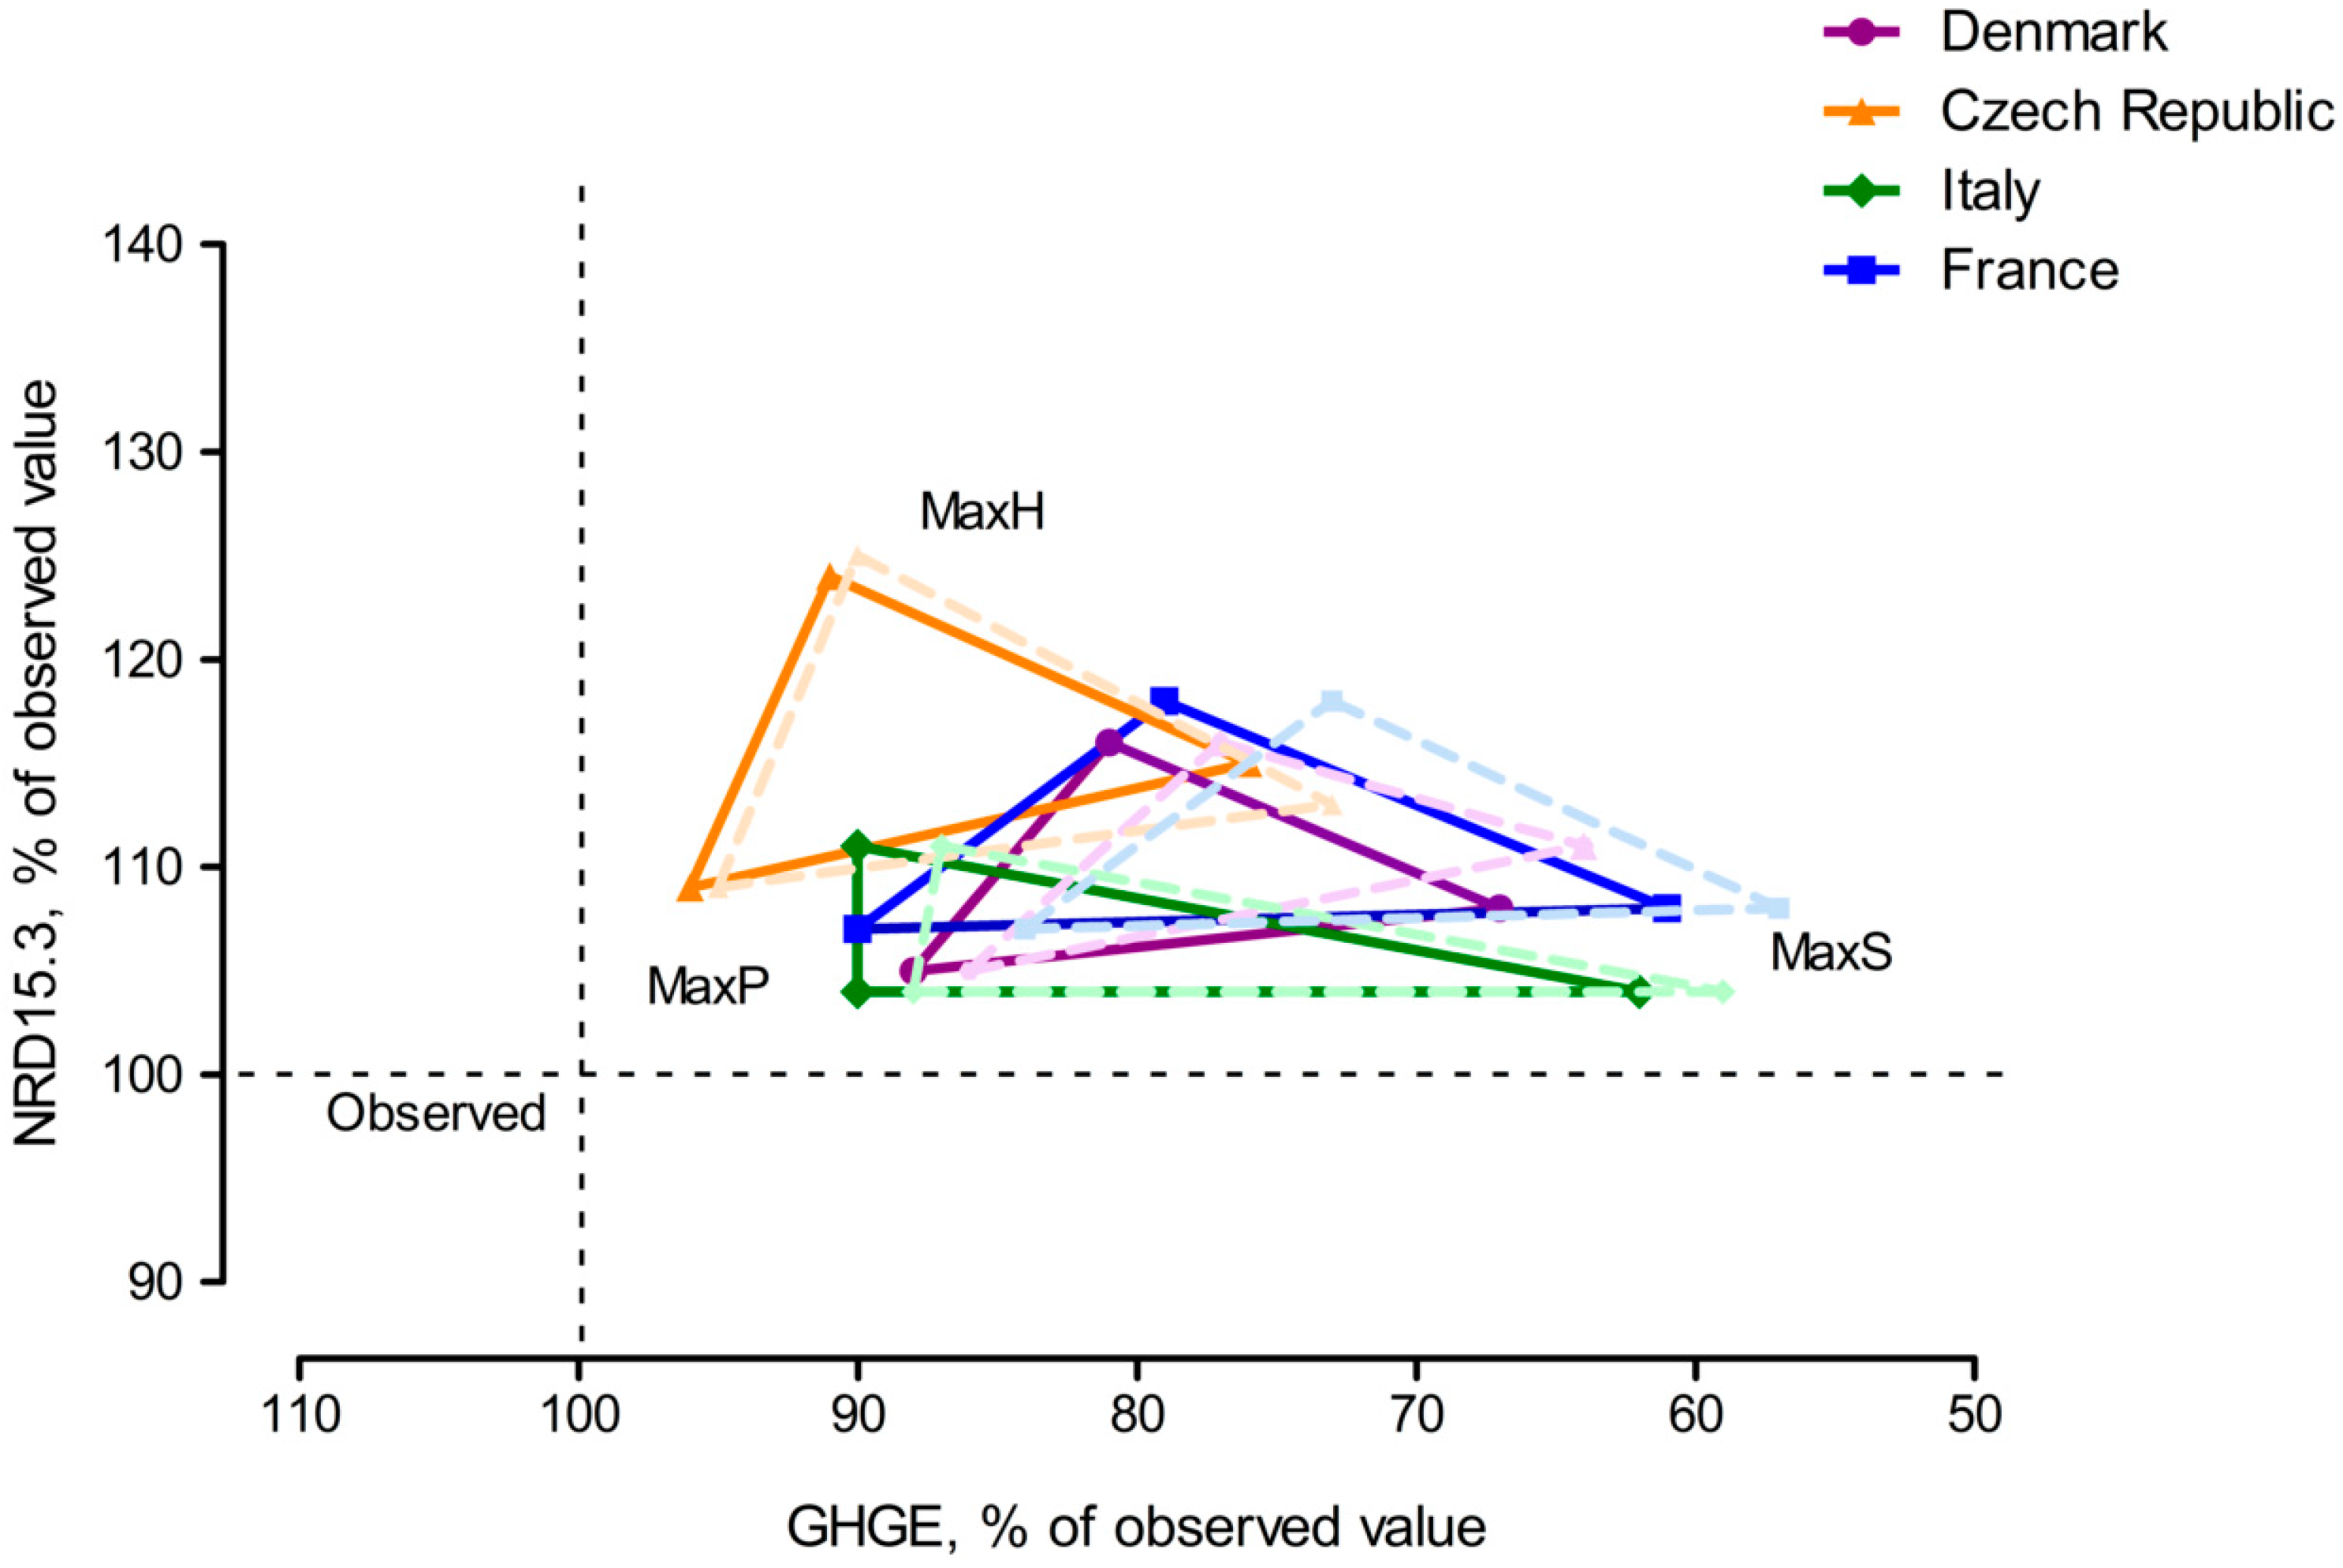
Abstract
1. Introduction
2. Materials and Methods
2.1. Study Population and Observed Dietary Data
2.2. Meat-Replacement Diets
2.3. The Benchmarking Diet Model
2.4. Identification of Efficient Diets
2.5. Modelled Diets
3. Results
3.1. Dietary Preferences, Nutrient Quality and Environmental Impact of the Modelled Diets
3.2. Meat Consumption in Observed and Modelled Diets
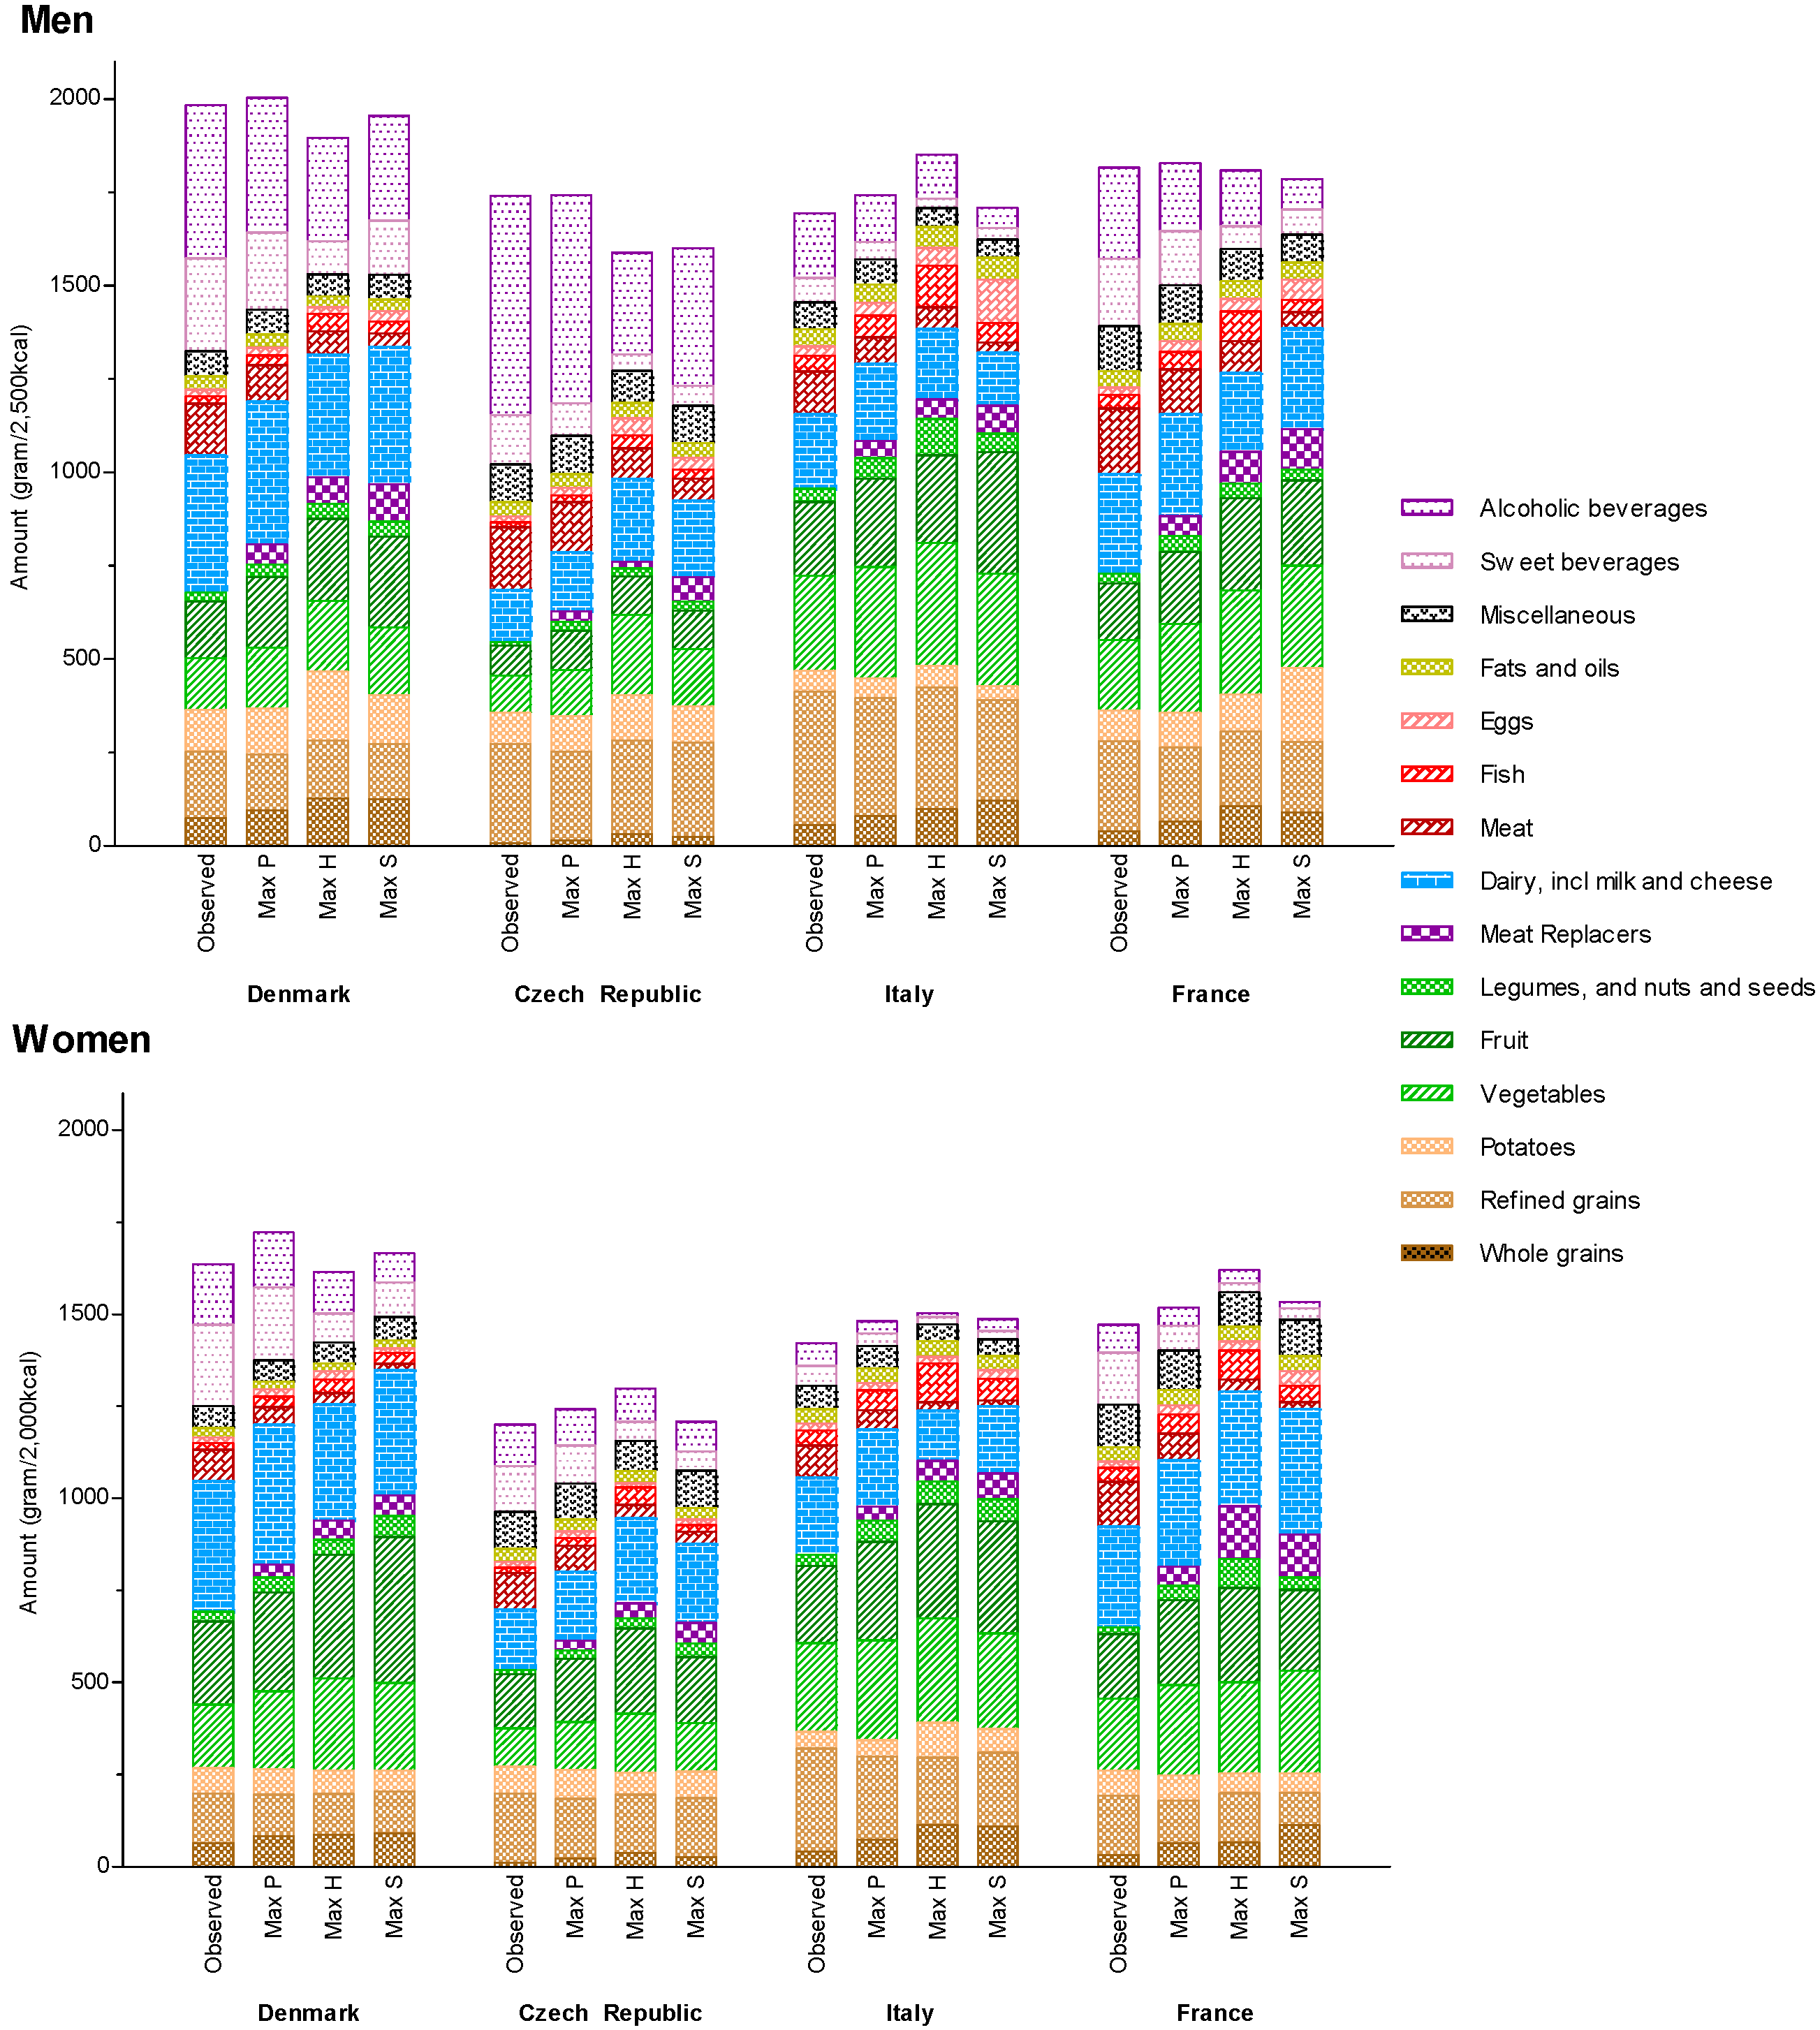
3.3. Overall Dietary Pattern in Observed and Modelled Diets
3.4. Nutrient Quality of Observed and Modelled Diets
4. Discussion
5. Conclusions
Supplementary Materials
Author Contributions
Funding
Conflicts of Interest
References
- FAO and WHO. Sustainable Healthy Diets—Guiding Principles; Food & Agriculture Org.: Rome, Italy, 2019. [Google Scholar]
- Intergovernmental Panel on Climate Change. Global Warming of 1.5 °C—An IPCC Special Report on the Impacts of Global Warming of 1.5 °C above Pre-Industrial Levels and Related Global Greenhouse Gas Emission Pathways, in the Context of Strengthening the Global Response to the Threat of Climate Change, Sustainable Development, and Efforts to Eradicate Poverty; World Meteorological Organization: Geneva, Switzerland, 2018. [Google Scholar]
- Willett, W.; Rockström, J.; Loken, B.; Springmann, M.; Lang, T.; Vermeulen, S.; Garnett, T.; Tilman, D.; DeClerck, F.; Wood, A. Food in the Anthropocene: The EAT–Lancet Commission on healthy diets from sustainable food systems. Lancet 2019, 393, 447–492. [Google Scholar] [CrossRef]
- Hu, F.B.; Otis, B.O.; McCarthy, G. Can plant-based meat alternatives be part of a healthy and sustainable diet? JAMA 2019, 1–3. [Google Scholar] [CrossRef] [PubMed]
- World Economic Forum. White Paper. Meat: The Future Series—Alternative Proteins; World Economic Forum: Geneva, Switzerland, 2019. [Google Scholar]
- Bohrer, B.M. An investigation of the formulation and nutritional composition of modern meat analogue products. Food Sci. Hum. Wellness 2019, 8, 320–329. [Google Scholar] [CrossRef]
- Smetana, S.; Mathys, A.; Knoch, A.; Heinz, V. Meat alternatives: Life cycle assessment of most known meat substitutes. Int. J. Life Cycle Assess. 2015, 20, 1254–1267. [Google Scholar] [CrossRef]
- Broekema, R.; Paassen, M.v. Environmental Impact of Meat and Meat Replacers (Milieueffecten van Vlees en Vleesvervangers); Blonk Consultants: Gouda, The Netherlands, 2017. [Google Scholar]
- Mertens, E.; Kuijsten, A.; Kanellopoulos, A.; Dofková, M.; Mistura, L.; D’Addezio, L.; Turrini, A.; Dubuisson, C.; Havard, S.; Trolle, E.; et al. Improving health and carbon footprints of European diets using a benchmarking approach. Public Health Nutr.l 2020. accepted. [Google Scholar]
- Mertens, E. Towards Healthy and Environmentally Sustainable Diets for European Consumers. Ph.D. Thesis, Wageningen University, Wageningen, The Netherlands, 2020. [Google Scholar]
- Pedersen, A.; Fagt, S.; Groth, M.V.; Christensen, T.; Biltoft-Jensen, A.; Matthiessen, J.; Andersen, N.L.; Kørup, K.; Hartkopp, H.; Ygil, K.; et al. Danskernes Kostvaner 2003–2008. DTU Fødevareinstituttet: 2009; Rosendahls-Schultz Grafisk A/S: Herstedvang, Denmark, 2010. [Google Scholar]
- Ruprich, J.; Dofkova, M.; Rehurkova, I.; Slamenikova, E.; Resova, D. Individual Food Consumption—The National Study SISP04. Available online: http://www.chpr.szu.cz/spotrebapotravin.htm (accessed on 1 September 2019).
- Leclercq, C.; Arcella, D.; Piccinelli, R.; Sette, S.; Le Donne, C.; Turrini, A. The Italian national food consumption survey INRAN-SCAI 2005-06: Main results in terms of food consumption. Public Health Nutr. 2009, 12, 2504–2532. [Google Scholar] [CrossRef] [PubMed]
- Agence Française de Sécurité Sanitaire des Aliments (AFSSA). Report of the 2006/2007 Individual and National Study on Food Consumption 2 (INCA 2). In Synthèse de L’étude Individuelle Nationale des Consommations Alimentaires 2 (INCA 2), 2006–2007; AFSSA: Maisons-Alfort, Val-de-Marne, France, 2009; pp. 1–44. [Google Scholar]
- Goldberg, G.; Black, A.; Jebb, S.; Cole, T.; Murgatroyd, P.; Coward, W.; Prentice, A. Critical evaluation of energy intake data using fundamental principles of energy physiology: 1. Derivation of cut-off limits to identify under-recording. Eur. J. Clin. Nutr. 1991, 45, 569–581. [Google Scholar] [PubMed]
- Black, A.E. Critical evaluation of energy intake using the Goldberg cut-off for energy intake: Basal metabolic rate. A practical guide to its calculation, use and limitations. Int. J. Obes. Relat. Metab. Disord. 2000, 24, 1119–1130. [Google Scholar] [CrossRef] [PubMed]
- EFSA (European Food Safety Authority). The food classification and description system FoodEx2 (revision 2). In EFSA Supporting Publication 2015; European Food Safety Authority: Parma, Italy, 2015. [Google Scholar]
- EFSA (European Food Safety Authority). Use of the EFSA Comprehensive European Food Consumption Database in Exposure Assessment. EFSA J. 2011 2011, 9, 2097. [Google Scholar]
- Møller, A.; Christensen, A.T.; Hartkopp, H. Fødevaredatabanken Version 6.0, 2005th ed.; Fødevareinformatik, Afdeling for Ernæring, Danmarks Fødevareforskning: Kopenhagen, Denmark, 2005. [Google Scholar]
- Saxholt, E.; Christensen, A.T.; Møller, A.; Hartkopp, H.B.; Hess Ygil, K.; Hels, O.H. Fødevaredatabanken, Version 7, 2008th ed.; Fødevareinformatik, Afdeling for Ernæring, Danmarks Fødevareforskning: Kopenhagen, Denmark; Fødevareinstituttet, Danmarks Tekniske Universitet: Copenhagen, Denmark, 2008. [Google Scholar]
- Czech Centre for Food Composition Database. Czech Food Composition Database Version 6.16; Institute of Agricultural Economics and Information: Prague, Czech Republic, 2016. [Google Scholar]
- Food Research Institute. Slovak Food Composition Data Bank; Department of Risk Assessment Food Composition Data Bank and Consumer’s Survey VUP Food Research Institute: Bratislava, Slovakia, 2016. [Google Scholar]
- Istituto Nazionale di Ricerca per gli Alimenti e la Nutrizione (INRAN). Food Composition Database of the National Research Institute for Food and Nutrition/Banca Dati di Composizione; Alimenti Istituto Nazionale di Ricerca per gli Alimenti e la Nutrizione: Roma, Italy, 2016. [Google Scholar]
- Feinberg, M.; Favier, J.C.; Laussucq, C. Répertoire Général des Aliments (General Inventory of Foods); Institut National de la Recherche Agronomique, Technique & Documentation: Lavoisier, Paris, 1995. [Google Scholar]
- Ireland, J.; Oseredczuk, M. French Food Composition Table, Version 2008; French Food Safety Agency (AFSSA): Maisons-Alfort, France, 2008. [Google Scholar]
- Mertens, E.; Kaptijn, G.; Kuijsten, A.; van Zanten, H.; Geleijnse, J.M.; van’t Veer, P. SHARP-Indicators Database towards a public database for environmental sustainability. Data Brief 2019, 27, 104617. [Google Scholar] [CrossRef] [PubMed]
- Mertens, E.; Kuijsten, A.; van Zanten, H.H.; Kaptijn, G.; Dofková, M.; Mistura, L.; D’Addezio, L.; Turrini, A.; Dubuisson, C.; Havard, S. Dietary choices and environmental impact in four European countries. J. Clean. Prod. 2019, 237, 117827. [Google Scholar] [CrossRef]
- RIVM. Dutch Food Composition Table; NEVO-Online Version 2016; National Institute for Public Health and the Environment: Bilthoven, The Netherlands, 2016. [Google Scholar]
- European Commission. Regulation (EU) No 116/2011 of the European Parliament and of the Council on the provision of food information to consumers: Document 32011R1169. Off. J. Eur. Union 2011, 34, 18–63. [Google Scholar]
- Kanellopoulos, A.; Gerdessen, J.C.; Ivancic, A.; Geleijnse, J.M.; Bloemhof-Ruwaard, J.M.; van’t Veer, P. Designing healthier and acceptable diets using data envelopment analysis. Public Health Nutr. 2020, 23, 2290–2302. [Google Scholar] [CrossRef] [PubMed]
- Drewnowski, A. Defining nutrient density: Development and validation of the nutrient rich foods index. J. Am. Coll. Nutr. 2009, 28, 421S–426S. [Google Scholar] [CrossRef] [PubMed]
- Fulgoni, V.L., III; Keast, D.R.; Drewnowski, A. Development and validation of the nutrient-rich foods index: A tool to measure nutritional quality of foods. J. Nutr. 2009, 139, 1549–1554. [Google Scholar] [CrossRef] [PubMed]
- EFSA. Overview on Dietary Reference Values for the EU population as derived by the EFSA Panel on Dietetic Products, Nutrition and Allergies (NDA). In Summary of Dietary Reference Values—Version 4 (September 2017); European Food Safety Authority: Parma, Italy, 2017. [Google Scholar]
- Hallström, E.; Carlsson-Kanyama, A.; Börjesson, P. Environmental impact of dietary change: A systematic review. J. Clean. Prod. 2015, 91, 1–11. [Google Scholar] [CrossRef]
- Tyszler, M.; Kramer, G.; Blonk, H. Just eating healthier is not enoug: Studying the environmental impact of different diet scenarios for the Netherlands by linear programming. In Proceedings of the 9th International Conference LCA of Foods, San Francisco, CA, USA, 8–10 October 2014. [Google Scholar]
- Weinrich, R. Opportunities for the Adoption of Health-Based Sustainable Dietary Patterns: A Review on Consumer Research of Meat Substitutes. Sustainability 2019, 11, 4028. [Google Scholar] [CrossRef]
- Schösler, H.; De Boer, J.; Boersema, J.J. Can we cut out the meat of the dish? Constructing consumer-oriented pathways towards meat substitution. Appetite 2012, 58, 39–47. [Google Scholar] [CrossRef] [PubMed]
- Van Mierlo, K.; Rohmer, S.; Gerdessen, J.C. A model for composing meat replacers: Reducing the environmental impact of our food consumption pattern while retaining its nutritional value. J. Clean. Prod. 2017, 165, 930–950. [Google Scholar] [CrossRef]


© 2020 by the authors. Licensee MDPI, Basel, Switzerland. This article is an open access article distributed under the terms and conditions of the Creative Commons Attribution (CC BY) license (http://creativecommons.org/licenses/by/4.0/).
Share and Cite
Mertens, E.; Biesbroek, S.; Dofková, M.; Mistura, L.; D’Addezio, L.; Turrini, A.; Dubuisson, C.; Havard, S.; Trolle, E.; Geleijnse, J.M.; et al. Potential Impact of Meat Replacers on Nutrient Quality and Greenhouse Gas Emissions of Diets in Four European Countries. Sustainability 2020, 12, 6838. https://doi.org/10.3390/su12176838
Mertens E, Biesbroek S, Dofková M, Mistura L, D’Addezio L, Turrini A, Dubuisson C, Havard S, Trolle E, Geleijnse JM, et al. Potential Impact of Meat Replacers on Nutrient Quality and Greenhouse Gas Emissions of Diets in Four European Countries. Sustainability. 2020; 12(17):6838. https://doi.org/10.3390/su12176838
Chicago/Turabian StyleMertens, Elly, Sander Biesbroek, Marcela Dofková, Lorenza Mistura, Laura D’Addezio, Aida Turrini, Carine Dubuisson, Sabrina Havard, Ellen Trolle, Johanna M. Geleijnse, and et al. 2020. "Potential Impact of Meat Replacers on Nutrient Quality and Greenhouse Gas Emissions of Diets in Four European Countries" Sustainability 12, no. 17: 6838. https://doi.org/10.3390/su12176838
APA StyleMertens, E., Biesbroek, S., Dofková, M., Mistura, L., D’Addezio, L., Turrini, A., Dubuisson, C., Havard, S., Trolle, E., Geleijnse, J. M., & van ’t Veer, P. (2020). Potential Impact of Meat Replacers on Nutrient Quality and Greenhouse Gas Emissions of Diets in Four European Countries. Sustainability, 12(17), 6838. https://doi.org/10.3390/su12176838