Article

On the Performance of Small-Scale Horizontal Axis Tidal Current Turbines. Part 1: One Single Turbine

by
Ramin Alipour
1,
Roozbeh Alipour
1,*,
Seyed Saeid Rahimian Koloor
2,*,
Michal Petrů
2 and
Seyed Alireza Ghazanfari
3
1
Department of Mechanical Engineering, Mahshahr Branch, Islamic Azad University, Mahshahr, Iran
2
Institute for Nanomaterials, Advanced Technologies and Innovation, Technical University of Liberec, Studentska 2, Liberec 461 17, Czech Republic
3
High-Speed Reacting Flow Laboratory, Faculty of Mechanical Engineering, Universiti Teknologi Malaysia, UTM Skudai 81310, Malaysia
*
Authors to whom correspondence should be addressed.
Sustainability 2020, 12(15), 5985; https://doi.org/10.3390/su12155985
Submission received: 19 June 2020 / Revised: 16 July 2020 / Accepted: 22 July 2020 / Published: 24 July 2020

Abstract

:
The blade number of a current tidal turbine is one of the essential parameters to increase the stability, performance and efficiency for converting tidal current energy into rotational energy to generate electricity. This research attempts to investigate the effect of blade number on the performance of a small-scale horizontal tidal current turbine in the case of torque, thrust coefficient and power coefficient. Towards this end and according to the blade element momentum theory, three different turbines, i.e., two, three and four-bladed, were modeled using Solidworks software based on S-814 airfoil and then exported to the ANSYS-FLUENT for computational flow dynamics (CFD) analysis. SST-K-ω turbulence model was used to predict the turbulence behavior and several simulations were conducted at 2 ≤ tip speed ratio ≤ 7. Pressure contours, turbulence kinetic energy contours, cut-in-speed-curves, and streamlines around the blades and rotors were extracted and compared to provide an ability for a deep discussion on the turbine performance. The results show that in the case of obtainable power, the optimal value of tip speed ratio is around 5, so that the maximum power was achieved for the four-bladed turbine. Out of optimal condition, higher blade number and lower blade number turbines should be used at less than and greater than the optimal values of tip speed ratio, respectively. The results of simulations for the three-bladed turbine were validated against the experimental data with good agreement.

1. Introduction

Global air pollution is becoming more severe day to day due to the extreme use of petroleum derivations or fossil fuels as non-renewable energy resources [1]. Commercial energy in many developed and developing countries depends on imported petroleum, which increases this air pollution [2]. So, employing renewable energy which considerably helps to prevent climate change and to ensure energy security in the coming century is unavoidable [3]. Renewable energy resources are reliable alternative energy sources because of their availability, environmental friendliness, predictability and potential to minimize both visual and noise pollution [4]. These renewable sources include bio-flues, solar, wind, geothermal, marine, and hydropower energy, and others [5,6].
Tidal current energy is a type of marine energy which is completely reusable due to the ebb and flow of a tide owing to the gravitational effect of the moon. The attractiveness of tidal current energy is because of its abundance and ease and cost-effectiveness of extraction [7,8]. Recent studies [9,10] discovered that a large amount of available tidal energy remains unexploited, while it is an extremely dense source which can be a major contributor to global energy markets. Tidal current turbines (TCTs) of both types, namely horizontal and vertical, are such devices which have been actively designed and developed to take advantage of the tidal resource potential for converting tidal current energy to electricity [11]. Nevertheless, horizontal axis tidal current turbines (HATCTs), have been reported to harness more energy for producing power [4,12,13].
There are several reported studies contributing to the HATCTs via different points of view [13,14,15,16,17]. The existing literature includes studies on the performance of unidirectional and bi-directional HATCTs, through computational, pilot model tests and full-scale trials. Some researchers investigated the thrust and power outputs of scaled turbines subjected to regular waves superposed on the current [18,19,20,21]. Although the mean values were found to be analogous to current-only situations, standard deviations were considerably greater; up to 40% of their mean values. Pilot experimental studies to investigate the influences of turbine yaw and wave frequency and amplitude on HATCTs performance were presented in [22]. The results given in the recent work are in good agreement with [23,24,25], which also considered the effects of wave loading based on the advanced blade element momentum theory codes. Xiaorong et al. [26] developed a computational flow dynamics (CFD) model based on an experimental setup to evaluate the influences of HATCT on surface wave dynamics. Around 3% decrement in wave height was estimated under the effect of a standalone turbine located 0.4 m from the free water surface. Another CFD study for a full scale HATCT was conducted to survey the impact of waves and speed profiles on the turbine performance. It was observed that varying sea state may lead to a smoothing effect in this HATCT response, but that with further structural evaluation, it may be that some measuring and mitigation techniques are required in the event of a predominantly single long period in-phase wave. Recently, an advanced fluid solid interaction (FSI) turbulent model based on coupling a combined finite-discrete element solid model with a finite element CFD model was reported to investigate the interaction between the moving solids and turbulent flow [27,28]. This interaction was modeled as a thin shell mesh surrounding the solid surface and acted as a delta function to apply the boundary conditions for both the fluid momentum equation and turbulence model. The other developments in the case of FSI can be found in [29,30,31,32,33,34].
There are some studies in the literature that focused on the HATCTs geometry variations. Henriques et al. [35] investigated the influence of blade pitch angle on HATCTs’ performance and realized that the extracted power and thrust decrease in parallel with the deviation of the blade pitch angle from the optimum value. A three-bladed HATCT was designed by Goundar et al. [13] with hydrofoils placed in different locations. The hydrodynamic characteristics of this HATCT were analyzed and the configuration with the best performance was introduced. Huang et al. [36] showed that using a symmetric hydrofoil to design a bi-directional counter-rotating HATCT improves its performance considerably. A more detailed investigation reported that a higher tilt and depth of the turbine axis leads to reaching a maximal power coefficient up to 0.93 [37]. Chul Hee Jo et al. [14,16] showed that an appropriate calculation of chord length and twist angle of blades considering tip loss has a significant effect on achieving a max power coefficient. Recently, the application of HATCTs surrounded by ducts to increase their performance was reported in the literature [37,38].
Pluralization of the literature shows that a modern geometry of blades should have stability and efficiency with economic justification to manufacturing and usage. The prevailing belief is to use the three-bladed HATCTs for avoiding the vibrations due to the gyroscopic imbalances and decreasing the wake phenomenon effect. However, in the case of two-bladed HATCTs, the cost of turbine production is lower and the installation process becomes more straightforward. In addition, it has a high tip speed ratio (TSR) when maximum efficiency is achieved, and thus the gear box and generator prices and sizes may be reduced. On the other hand, with the economic approach, it is not necessary to design a turbine with more than four blades [16]. The effect of scalability of two-bladed HATCTs on their performance and under different operation conditions has been recently reported [39]. Nevertheless, the authors could not find a comprehensive report in which the HATCTs’ performance with different blade numbers under different operation conditions were compared. The first reason that comes to mind is the high costs of experimental model tests with a wide range of measurement equipment, despite its advantage to obtain reliable information. So, switching to numerical simulation approaches, e.g., CFD, can achieve diverse results at far lower cost in several different fields, such as power, wake, TSR etc.
This study provided two, three and four-bladed small-scale HATCTs’ performance using CFD analysis subjected to different TSRs. To perform a comprehensive study, the authors compared the thrust coefficient (CT), torque, power coefficient (Cp), pressure contours, turbulence kinetic energy (TKE) contours, streamlines around the blades airfoil, rotors’ streamline distributions, streamline and velocity distribution on the blades, and velocity distribution curves along the vertical axis at the pressure side, and finally the differences in the power diagram for different turbines were extracted and compared as the output parameters. This study focused on one small-scale single turbine; nonetheless, the present outcomes may be of high interest to those engineers who intend to investigate HATCT farms in a vertical array design, such as shown in [40]. This research is one of the rare reports in which a comprehensive CFD result is presented, and shows why, where, and how a HATCT must be used based on the number of blades. In addition, the article’s outcomes are useful for researchers who are interested in designing a turbine based on the different functional conditions.

2. Numerical Procedure

In the present research, the combination of the momentum and the blade element theory equations [41], which is called the blade element momentum theory (BEMT), was applied to design three types of a 36 W HATCT, i.e., 2, 3 and 4-bladed turbines. S-814 airfoil (Figure 1), which is utilized in marine current turbines [14], such as the SeaGen project [42], was selected for the design, and the airfoil data were the input of BEMT to generate the blades profile. Several researchers have assessed the turbine performance by S-814 airfoil and reported accepted efficiency due to its appropriate lift [14,16,43,44]. Figure 2 shows the arrangement of airfoils at equal intervals that forms the HATCTs’ blades.
Based on the BEMT, the twist angle and the cord length required to visualize a 3D blade model were determined and the frameworks were plotted using Solidworks modeling software, as displayed in Figure 3. The 3-bladed turbine previously investigated numerically and experimentally by Hee Jo et al. [16] and in this research was adapted and used to model validation. The rotor diameter, (D), was considered as 500 mm and the free stream velocity was 1 m/s. Since the design rotational speed is a variable of turbines TSR, it is different for each simulation condition and needs to be calculated separately.

2.1. Computational Domain and Boundary Condition

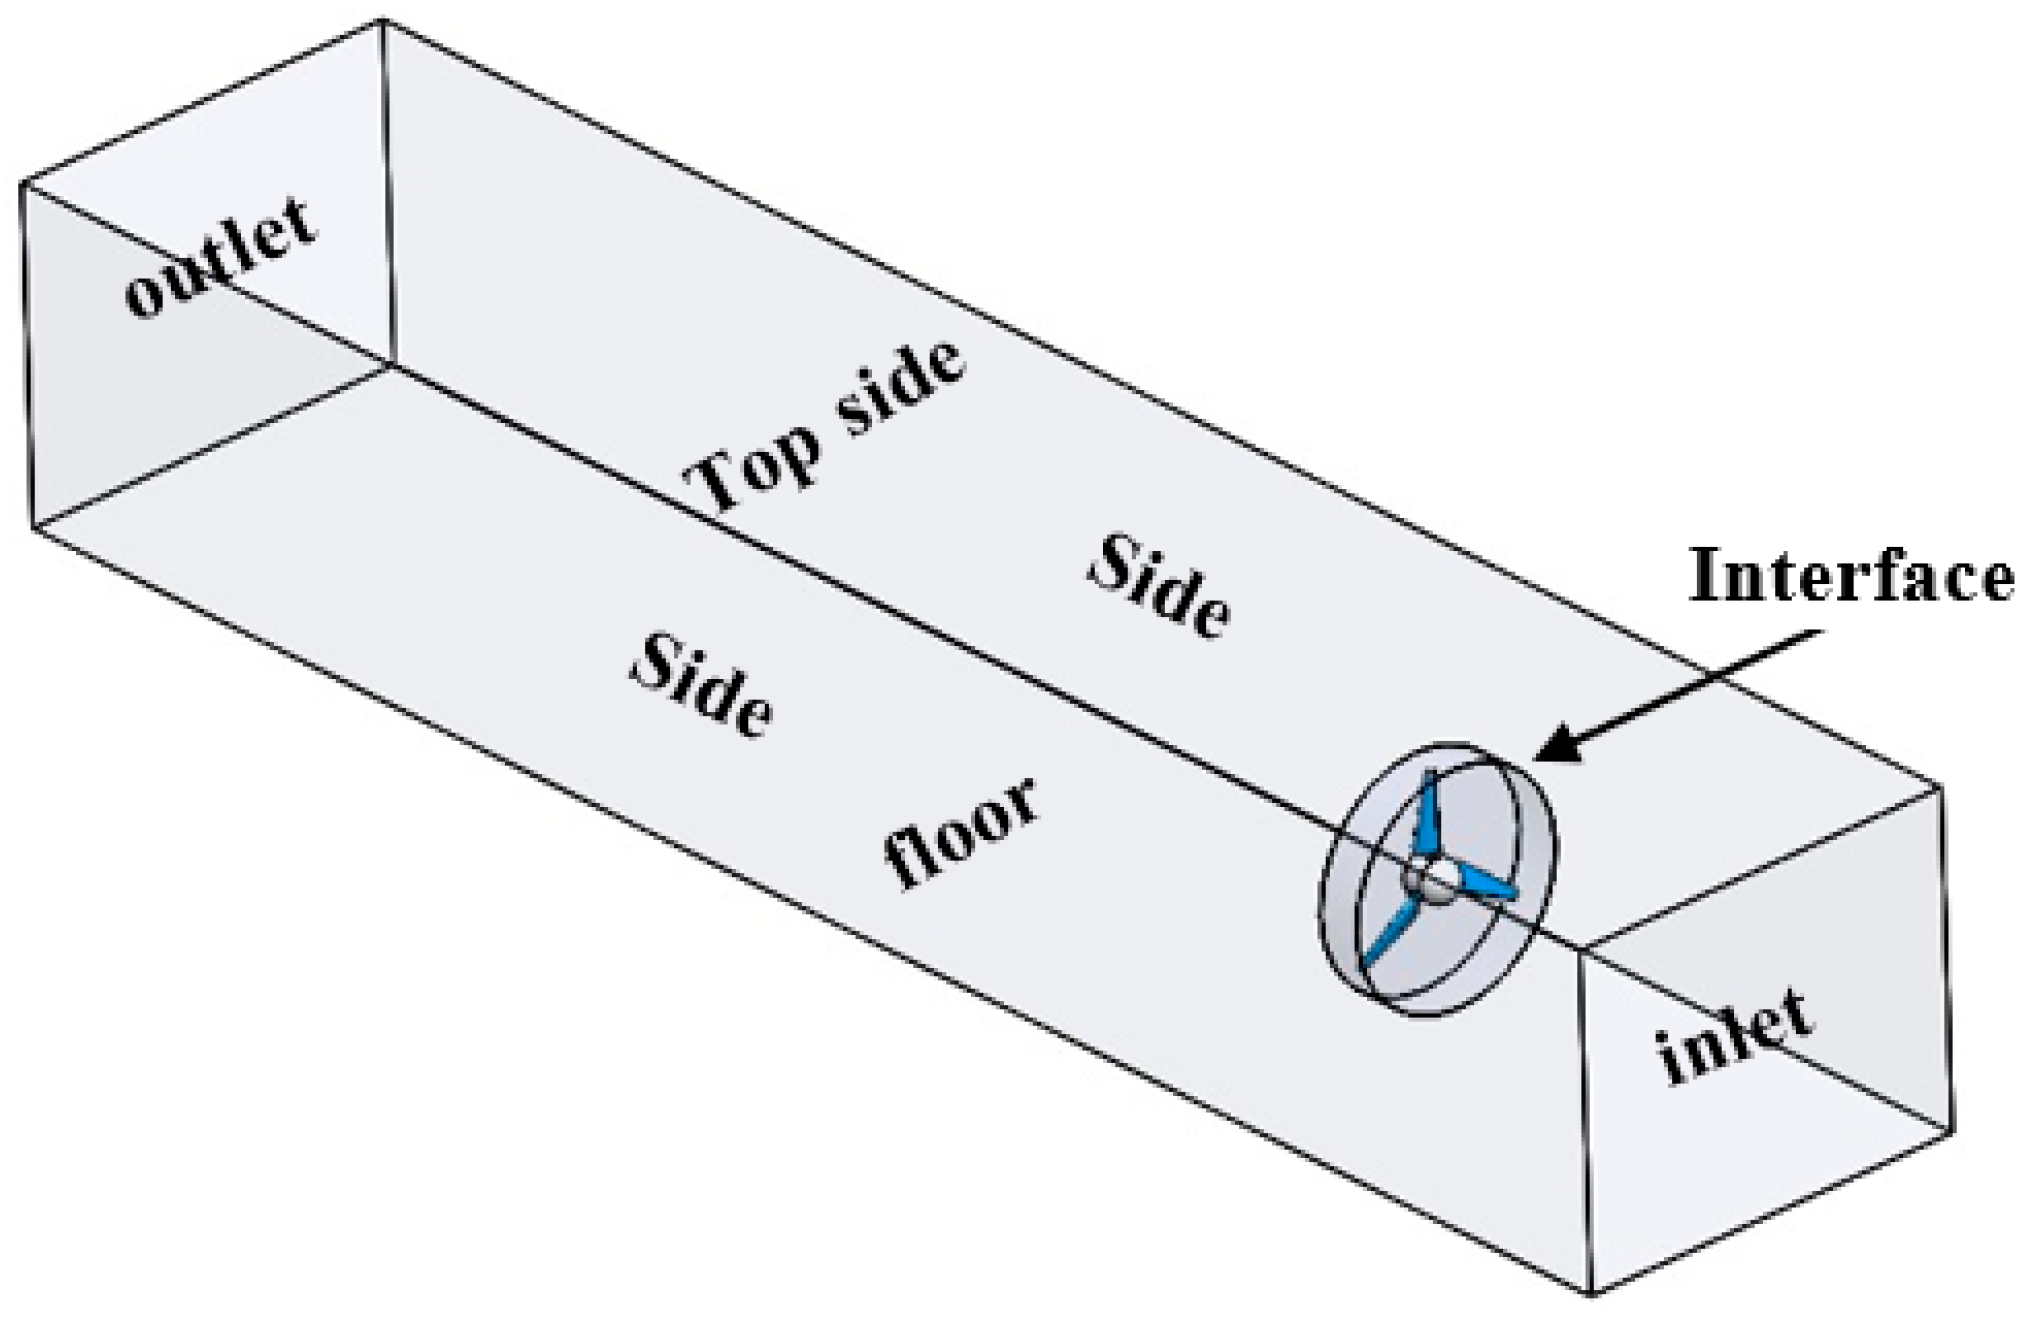
Figure 4 displays the computational domain adopted according to the experimental condition in [16]. It includes the HATCT and its frame as the internal domain, the external domain in which the fluid flows, and also the boundary conditions. The external domain is a rectangular channel which is the same as that for the laboratory flume in [16]. The related dimensions of this external domain are 4750, 1000, and 800 mm for the length, width, and height, respectively, and the cylindrical internal domain has a diameter of 500 mm and its width is 150 mm.
The inlet velocity condition was considered as the inlet condition of the external domain, with the value of 1.0 m/s meaning the design speed. The external domain outlet area was assigned the pressure outlet condition so that it can be computed based on the flux variations due to the distance from the turbine. Wall condition was applied to the sides and floor of the external domain, which was similar to the environment of the flume, and the top side employed the symmetry boundary condition. The frame motion condition was applied as the interface condition between the fluid and the turbine. All the mentioned boundary conditions were reported as being used by other researchers in similar investigations [16,45,46].

2.2. Mesh Generation

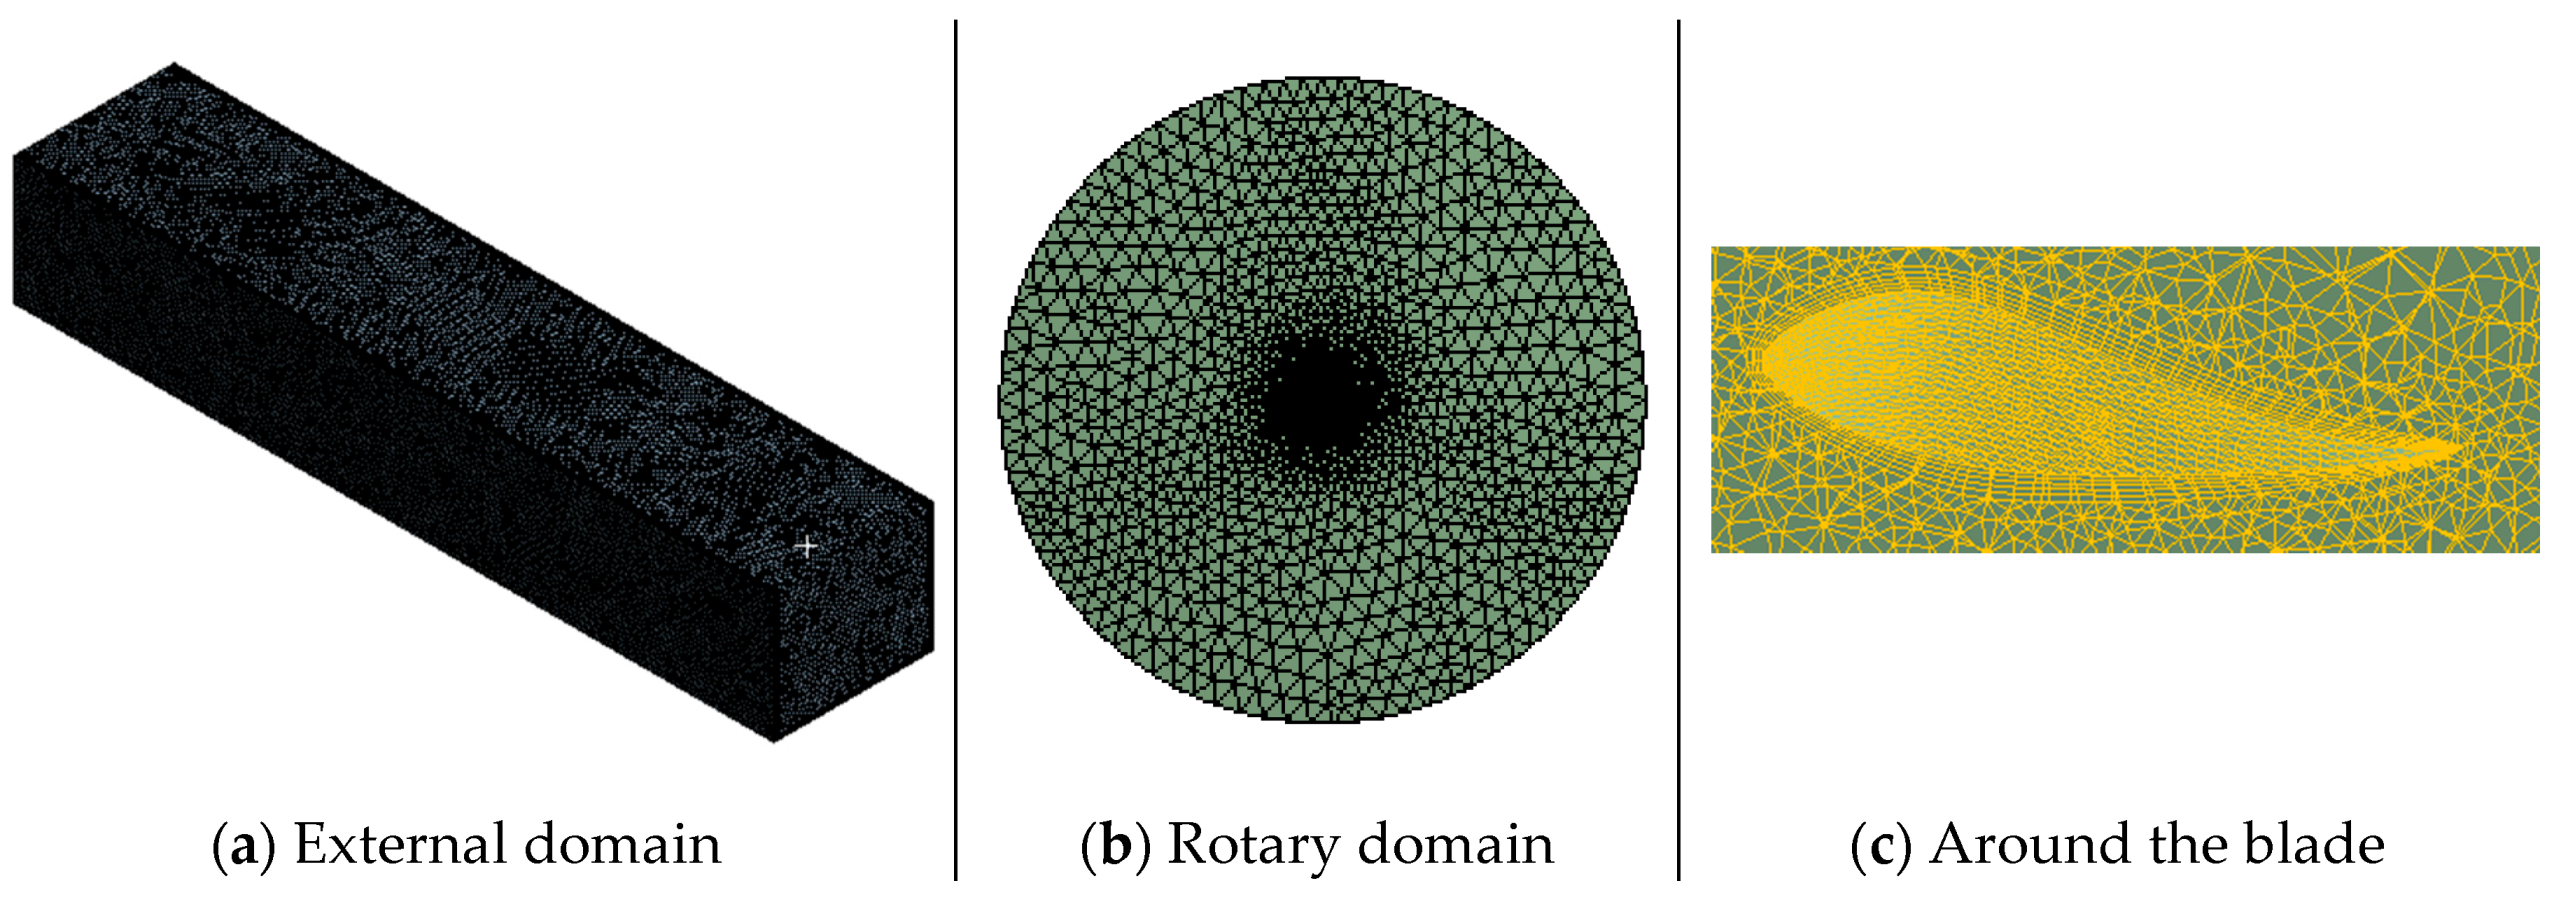
An unstructured mesh was used for the external computational domain. To predict the results around the turbine blades, a dense layer of structured meshes was generated and the rest of the area was composed of coarse meshes. For the turbine, inflation was used and tested for different simulations to ensure Y+ ≤ 1 with respect to the turbulence model. Figure 5 shows the composed grid system in the different parts of the computational domain.
A grid convergence study was conducted for simulations through several steps for ensuring that the answers converge to the resampling of the meshes. The number of meshes used for the 3-bladed turbine model and difference between the achieved Cp is shown in Table 1. In addition, the number of meshes for different models to obtain a converged analysis is tabulated in Table 2.

2.3. CFD Analysis

The finite volume method was employed to simulate the fluid flow in the computational domain. The SST-K-ω turbulence model [47,48] was used to implement analysis around the turbines. This turbulence model combined the K-ω and standard K-ω models to simultaneously consider the free flow and flow limited to the wall. Hence, it is more accurate and reliable for more extensive classifications of streams around the airfoils, such as conventional sound waves and negative gradient fluxes [10], with acceptable precision [14,16,45]. Therefore, this model was employed to run the simulations under CFD analysis through the ANSYS-FLUENT software. The SIMPLE algorithm was utilized to express the relationship between speed and pressure in which the pressure was discretized based on the second order method and the other terms were discretized as the first order upwind. Density of water was considered as 1025 kg/m3, equal to seawater with a viscosity of 0.001.

3. HATCT Performance Indicators

HATCTs convert fluid energy into electrical power through rotative motion. So, factors such as fluid velocity, angular velocity, thrust force (T), and turbine size are of particular importance. TSR is one of the parameters which includes the abovementioned factors and is defined as:
T S R = ω R V
where V, ω, and R are the fluid velocity at the input, angular velocity, and the rotor radius, respectively. Another important and influential factor to determine the turbine performance is Cp, which can be calculated as follows:
C P = P 0.5 ρ A V 3
where A is the cross-sectional area of the rotor, ρ is the fluid density, and P is the amount of power that is obtained by multiplication of torque (t) by ω. Therefore, Equation (2) can be rewritten as:
C p = t   ω 0.5 ρ A V 3
The other non-dimensional parameters which are required for performance analysis of HATCT are Ct and CT. These parameters can be described through the following equations [35,49]:
C t = t 0.5 ρ A V 2
C T = T 0.5 ρ A V 2

4. Results and Discussion

4.1. Model Validation

To compare the precision of the employed modeling technique, the results of simulations for three-bladed HATCT are tabulated against the experimental data presented in [16]. Table 3 shows the comparison of Cp obtained from the present and Hee Joo et al. [16] CFD simulations and the reported experiments for TSR = 5 and also Jing et al. [43]. The discrepancy between the experimental and numerical values of Cp for both the present and Hee Joo et al. [16] models was less than 27%. However, the present CFD model predicted a more precise value of Cp (around 10% error) than that predicted by the models in [16] and [43].
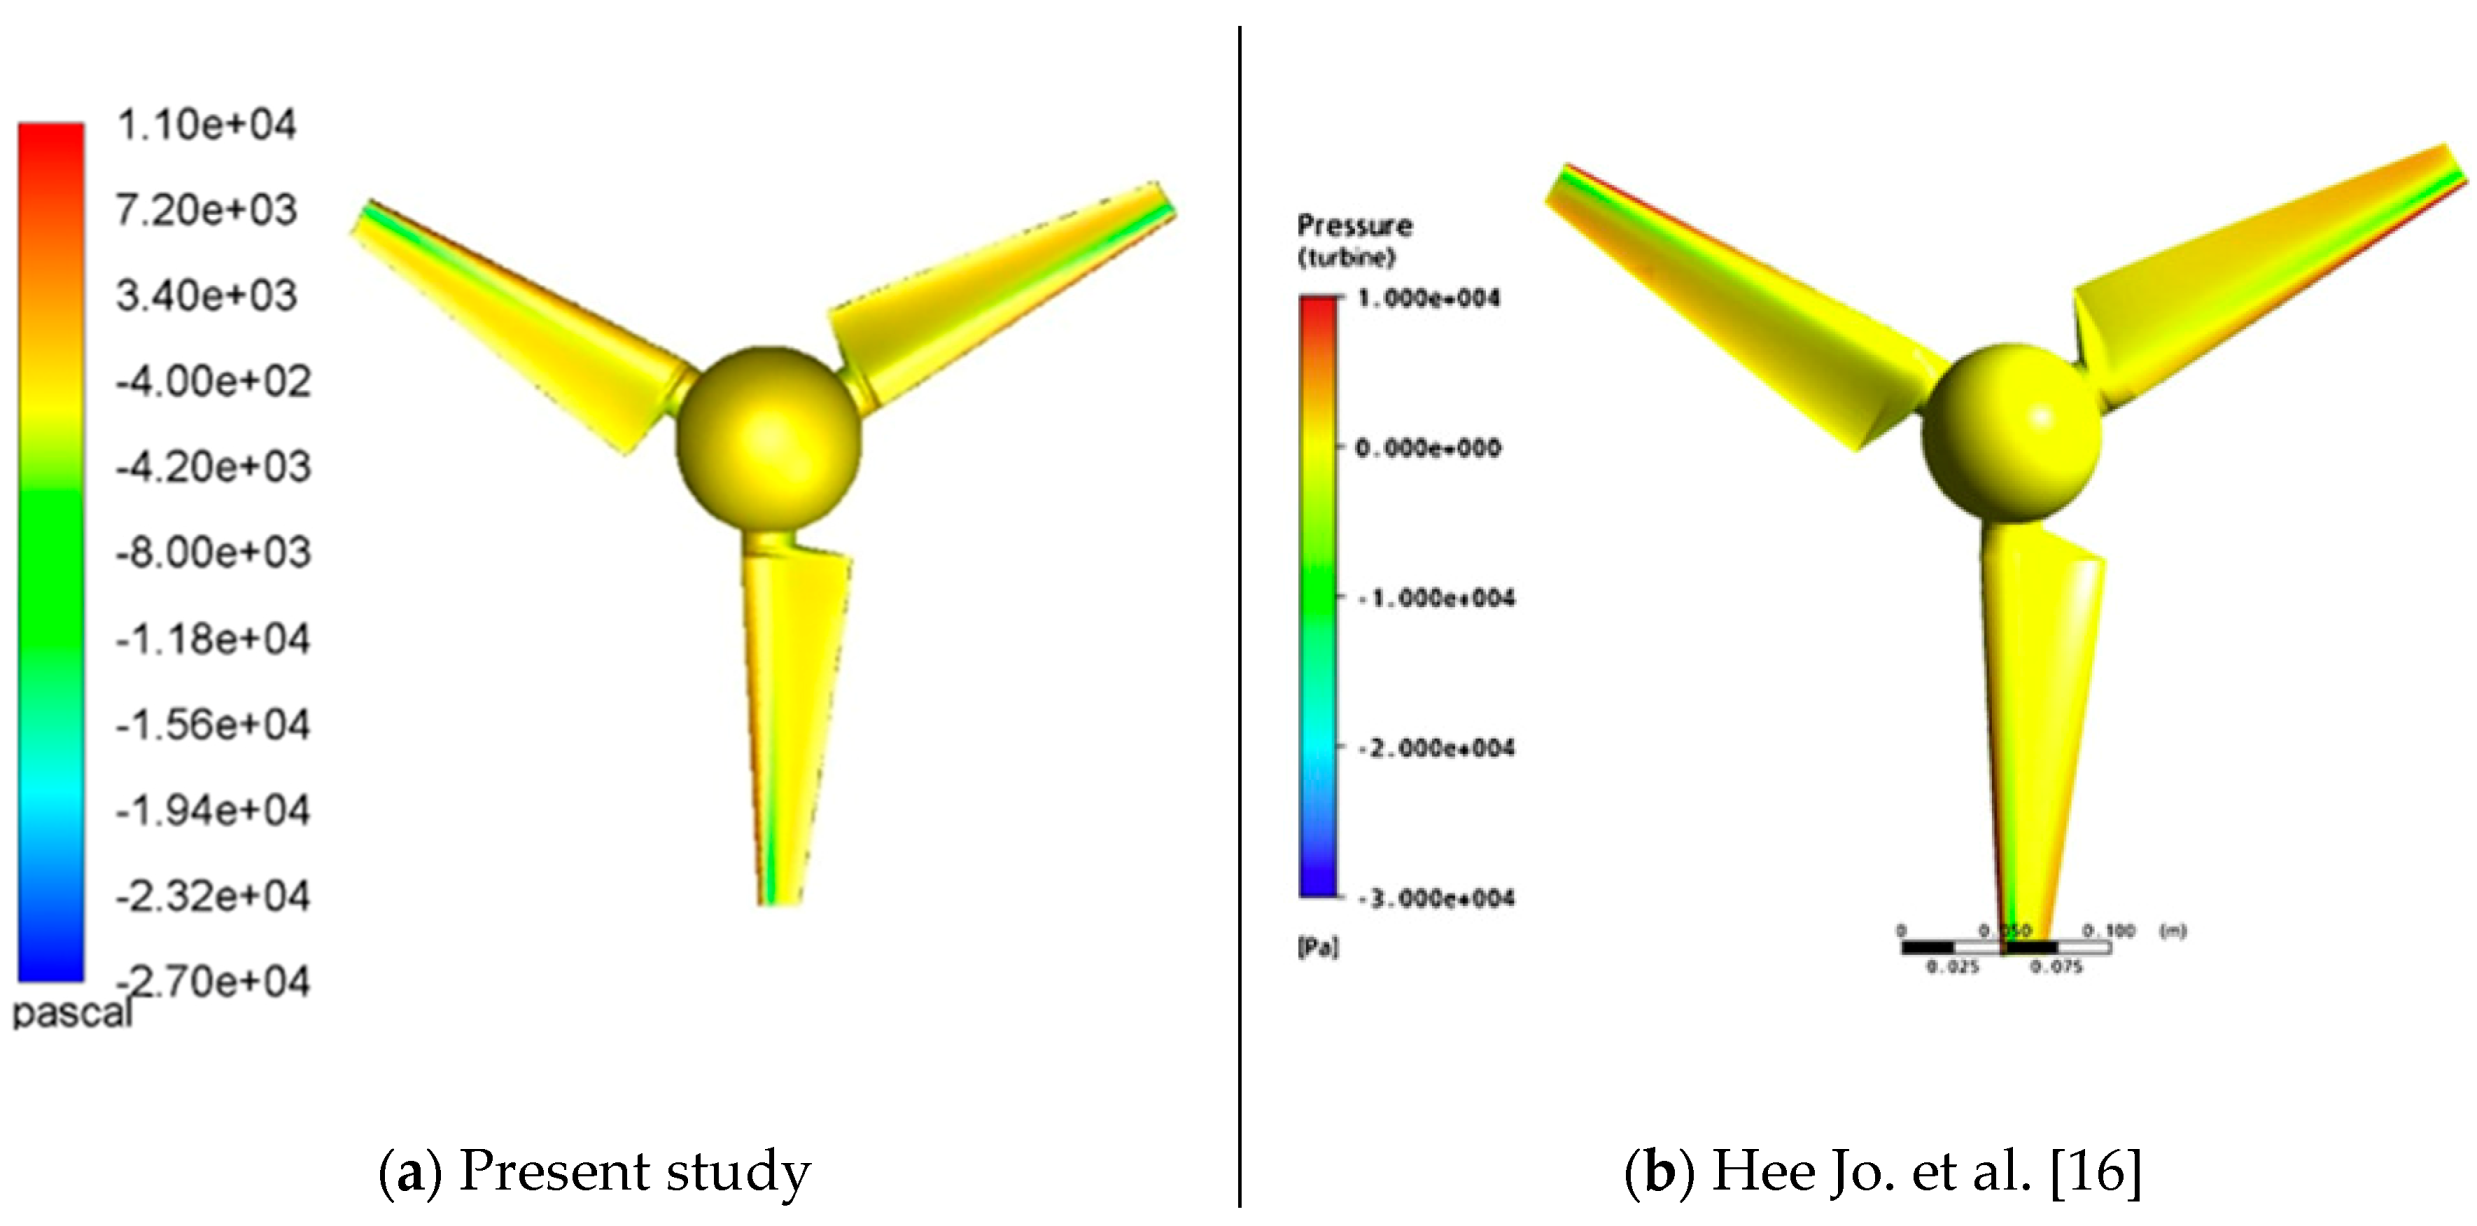
To further investigate the model validation, pressure contours at TSR = 5 are plotted in Figure 6 for both present and Hee Joo et al. [16] CFD models. As it is clear, the trend predicted by both models is very close, especially in the case of surfaces with positive and minus pressure distribution. Therefore, considering the Cp and pressure contour estimated by the present model, it can be expressed that this model is adequate to obtain an accurate representation of the HATCT performance.

4.2. Pressure Contours

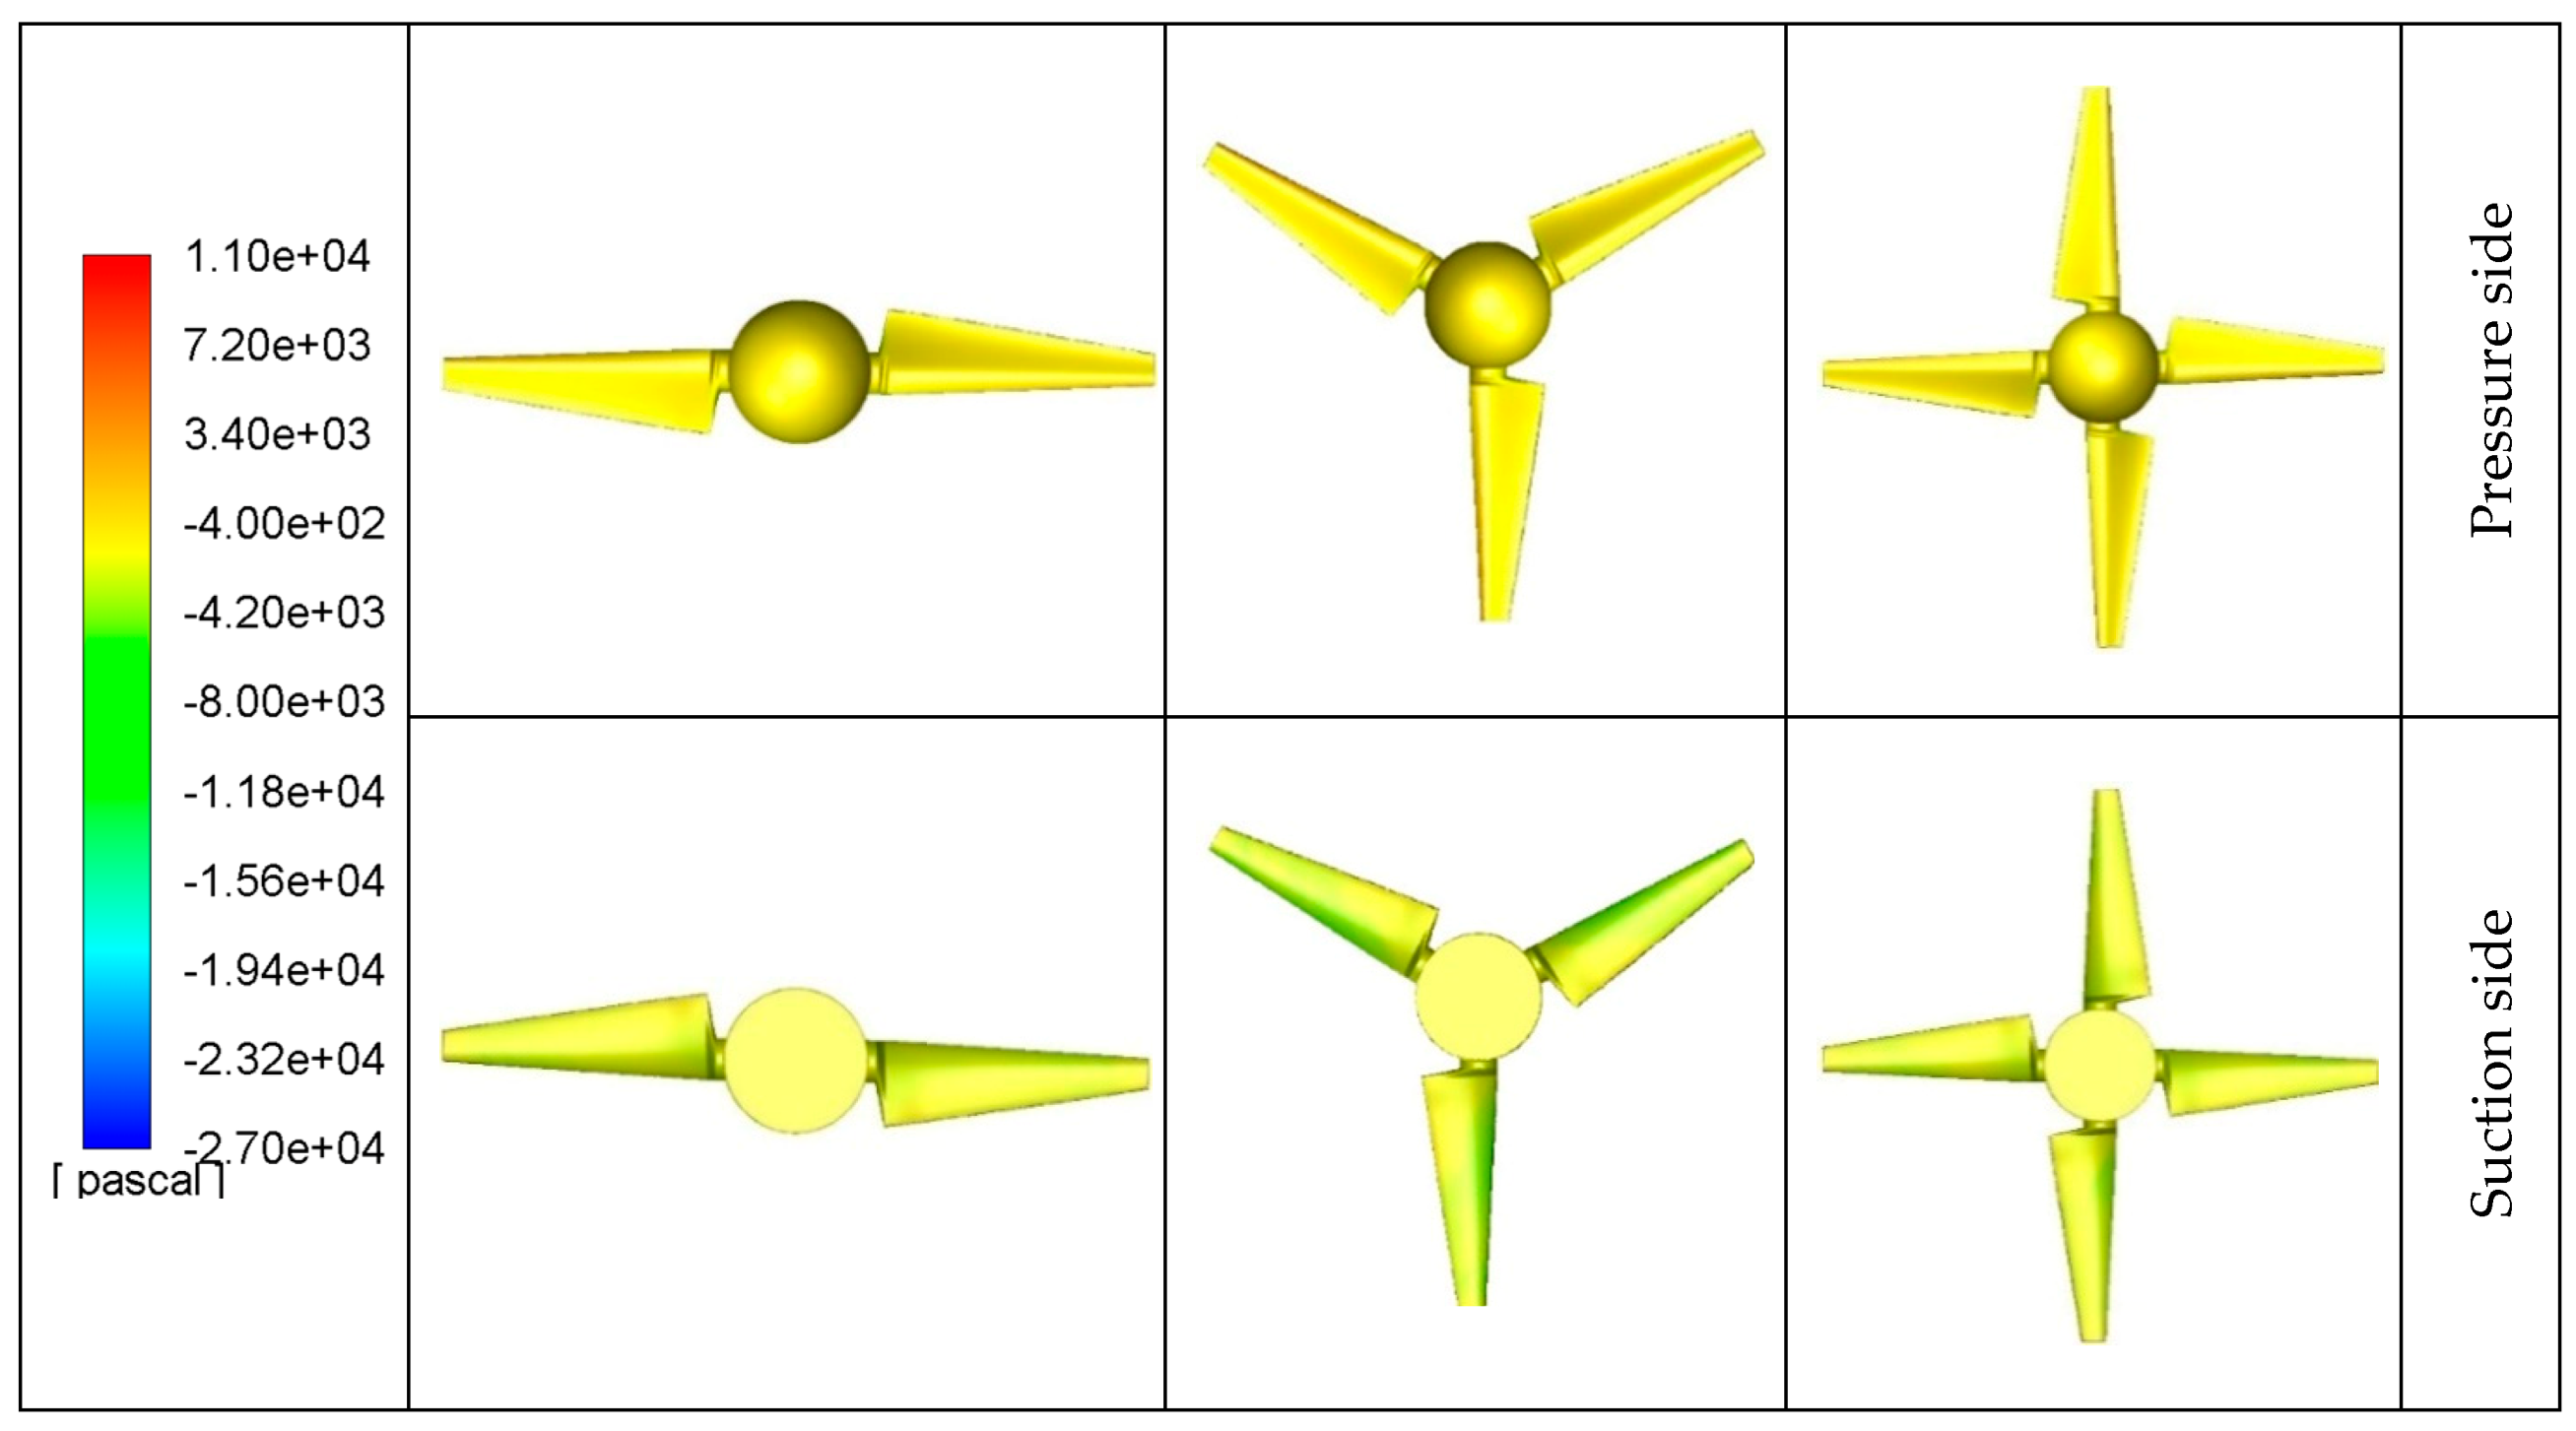
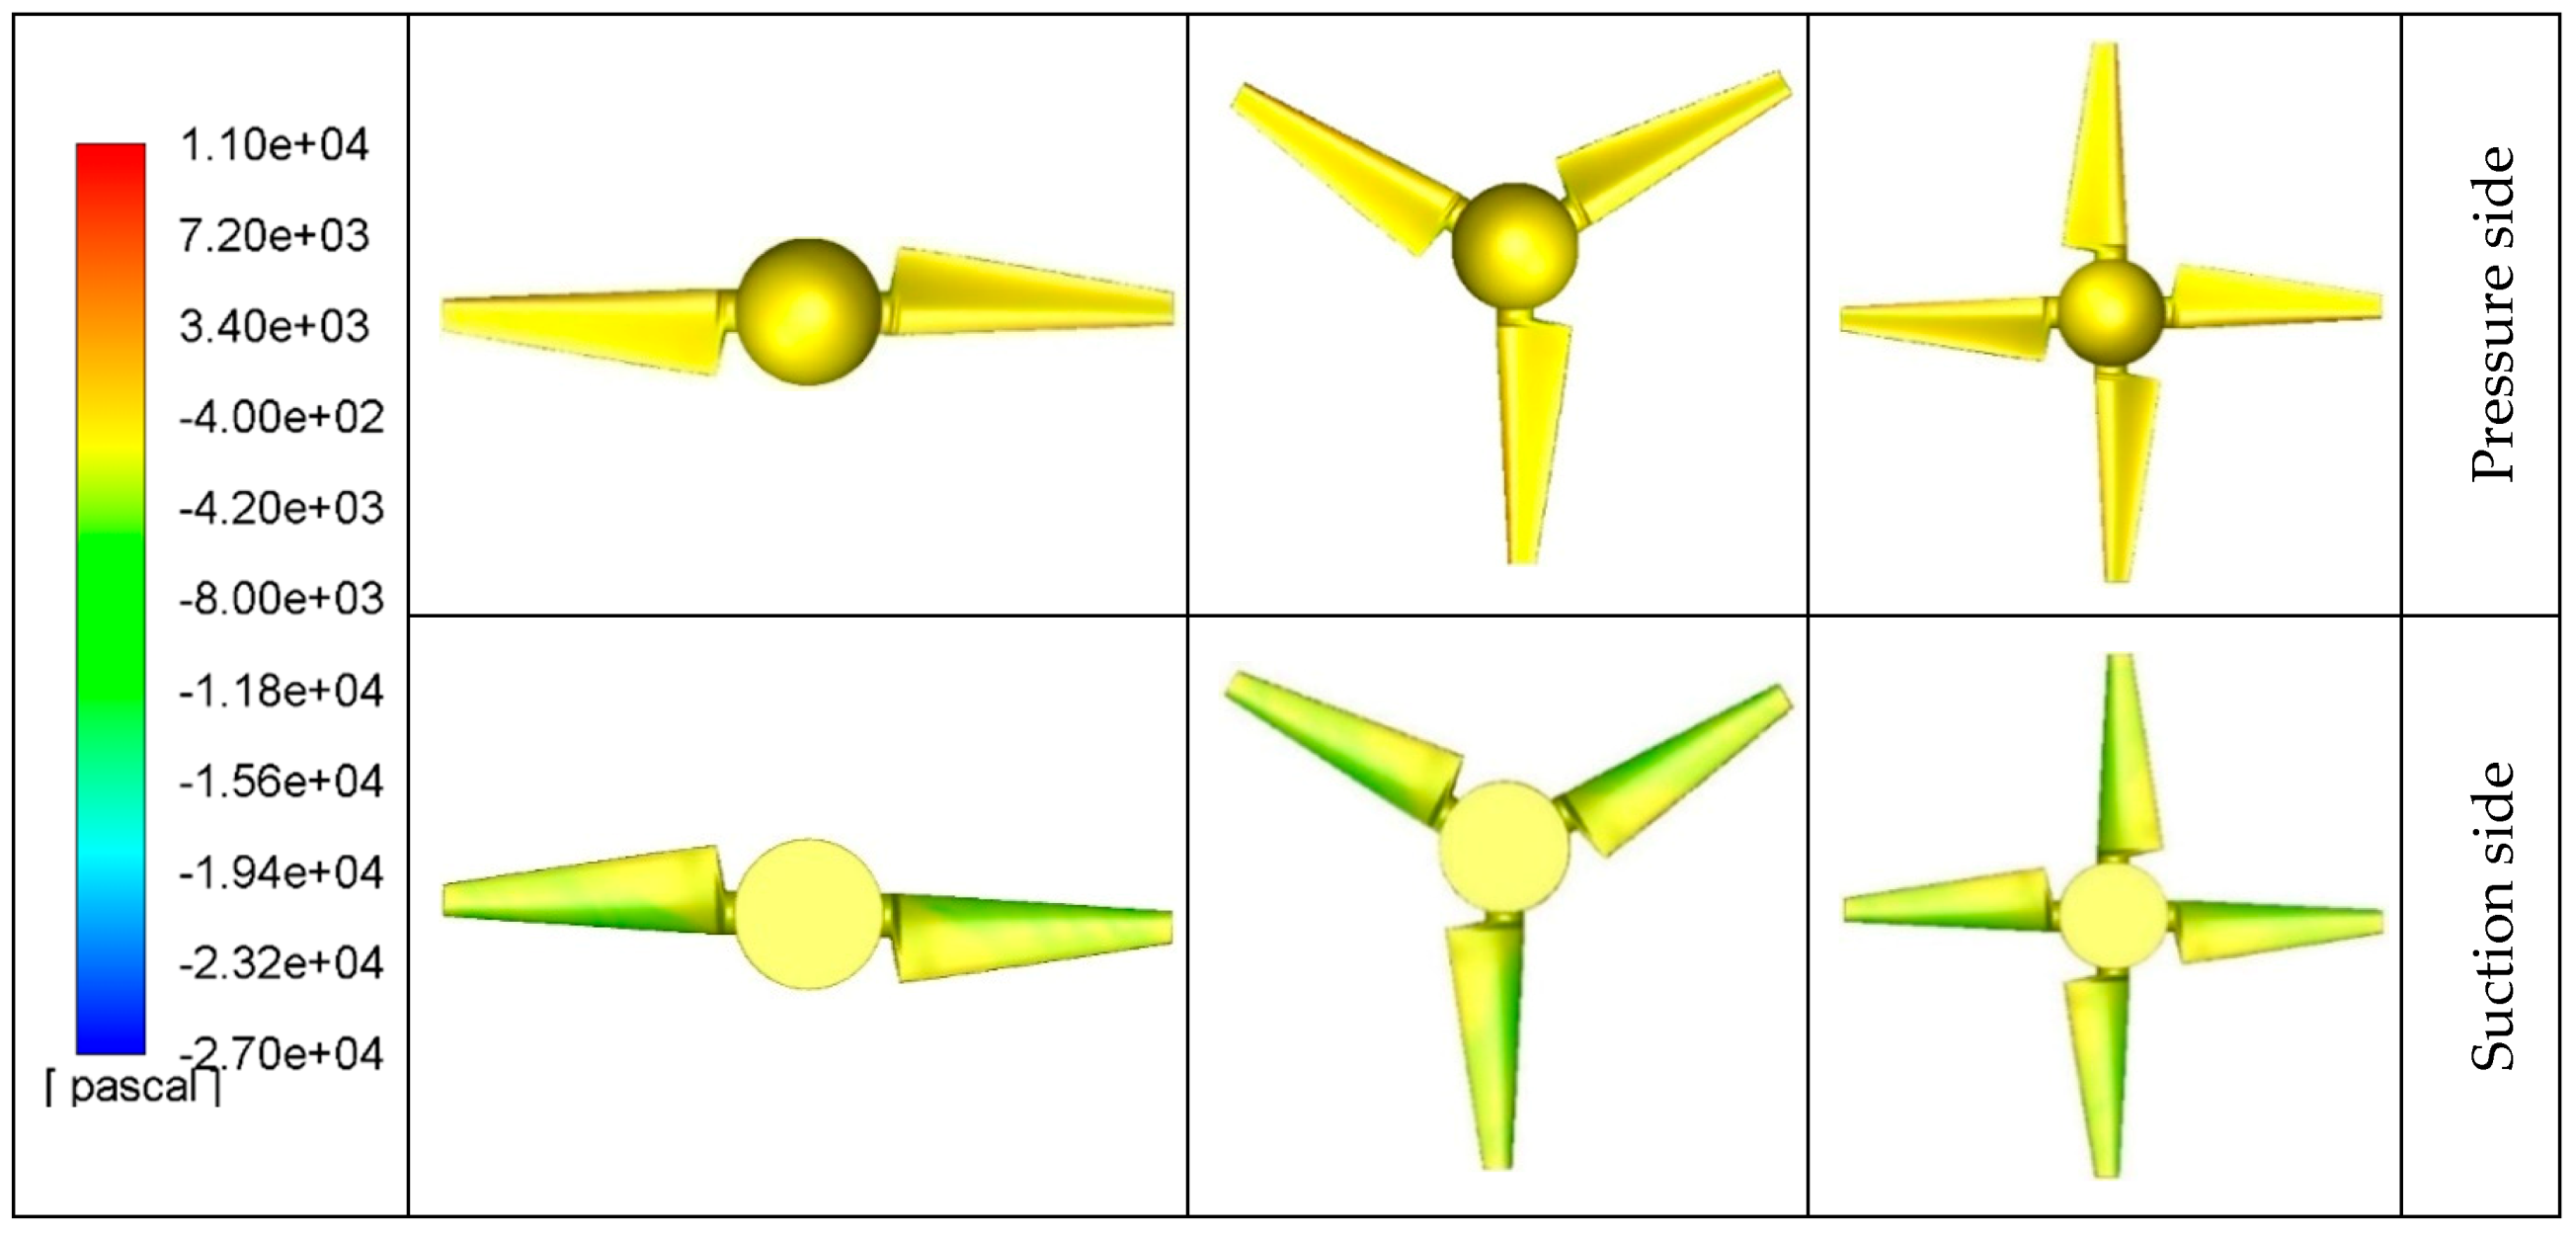
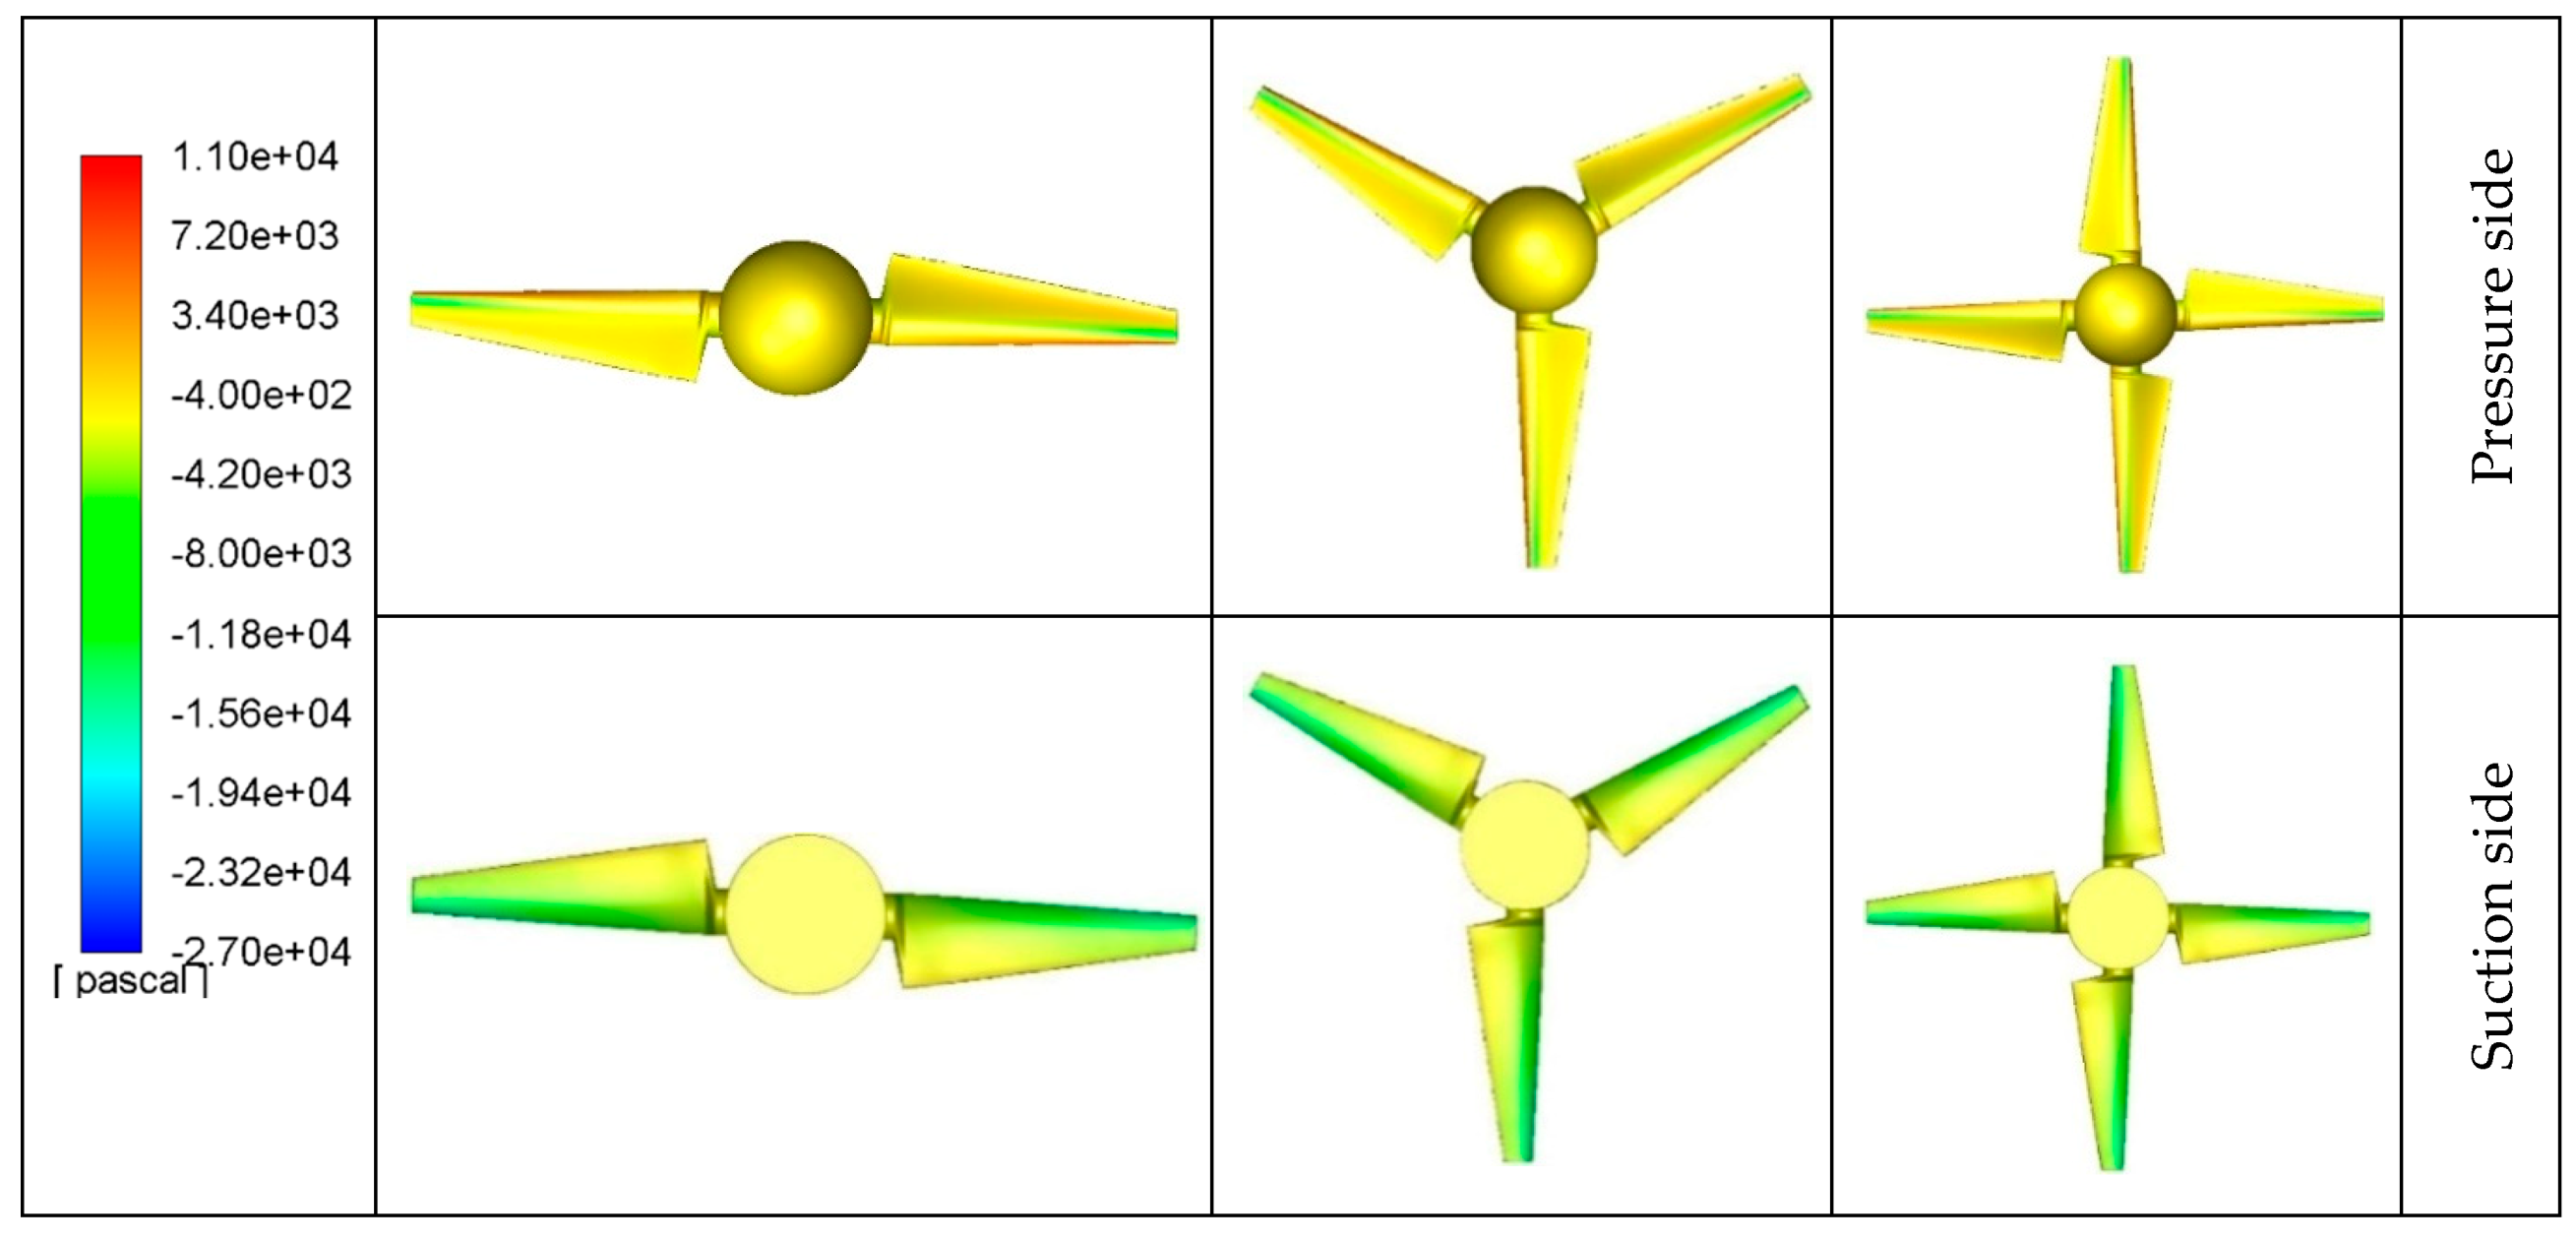
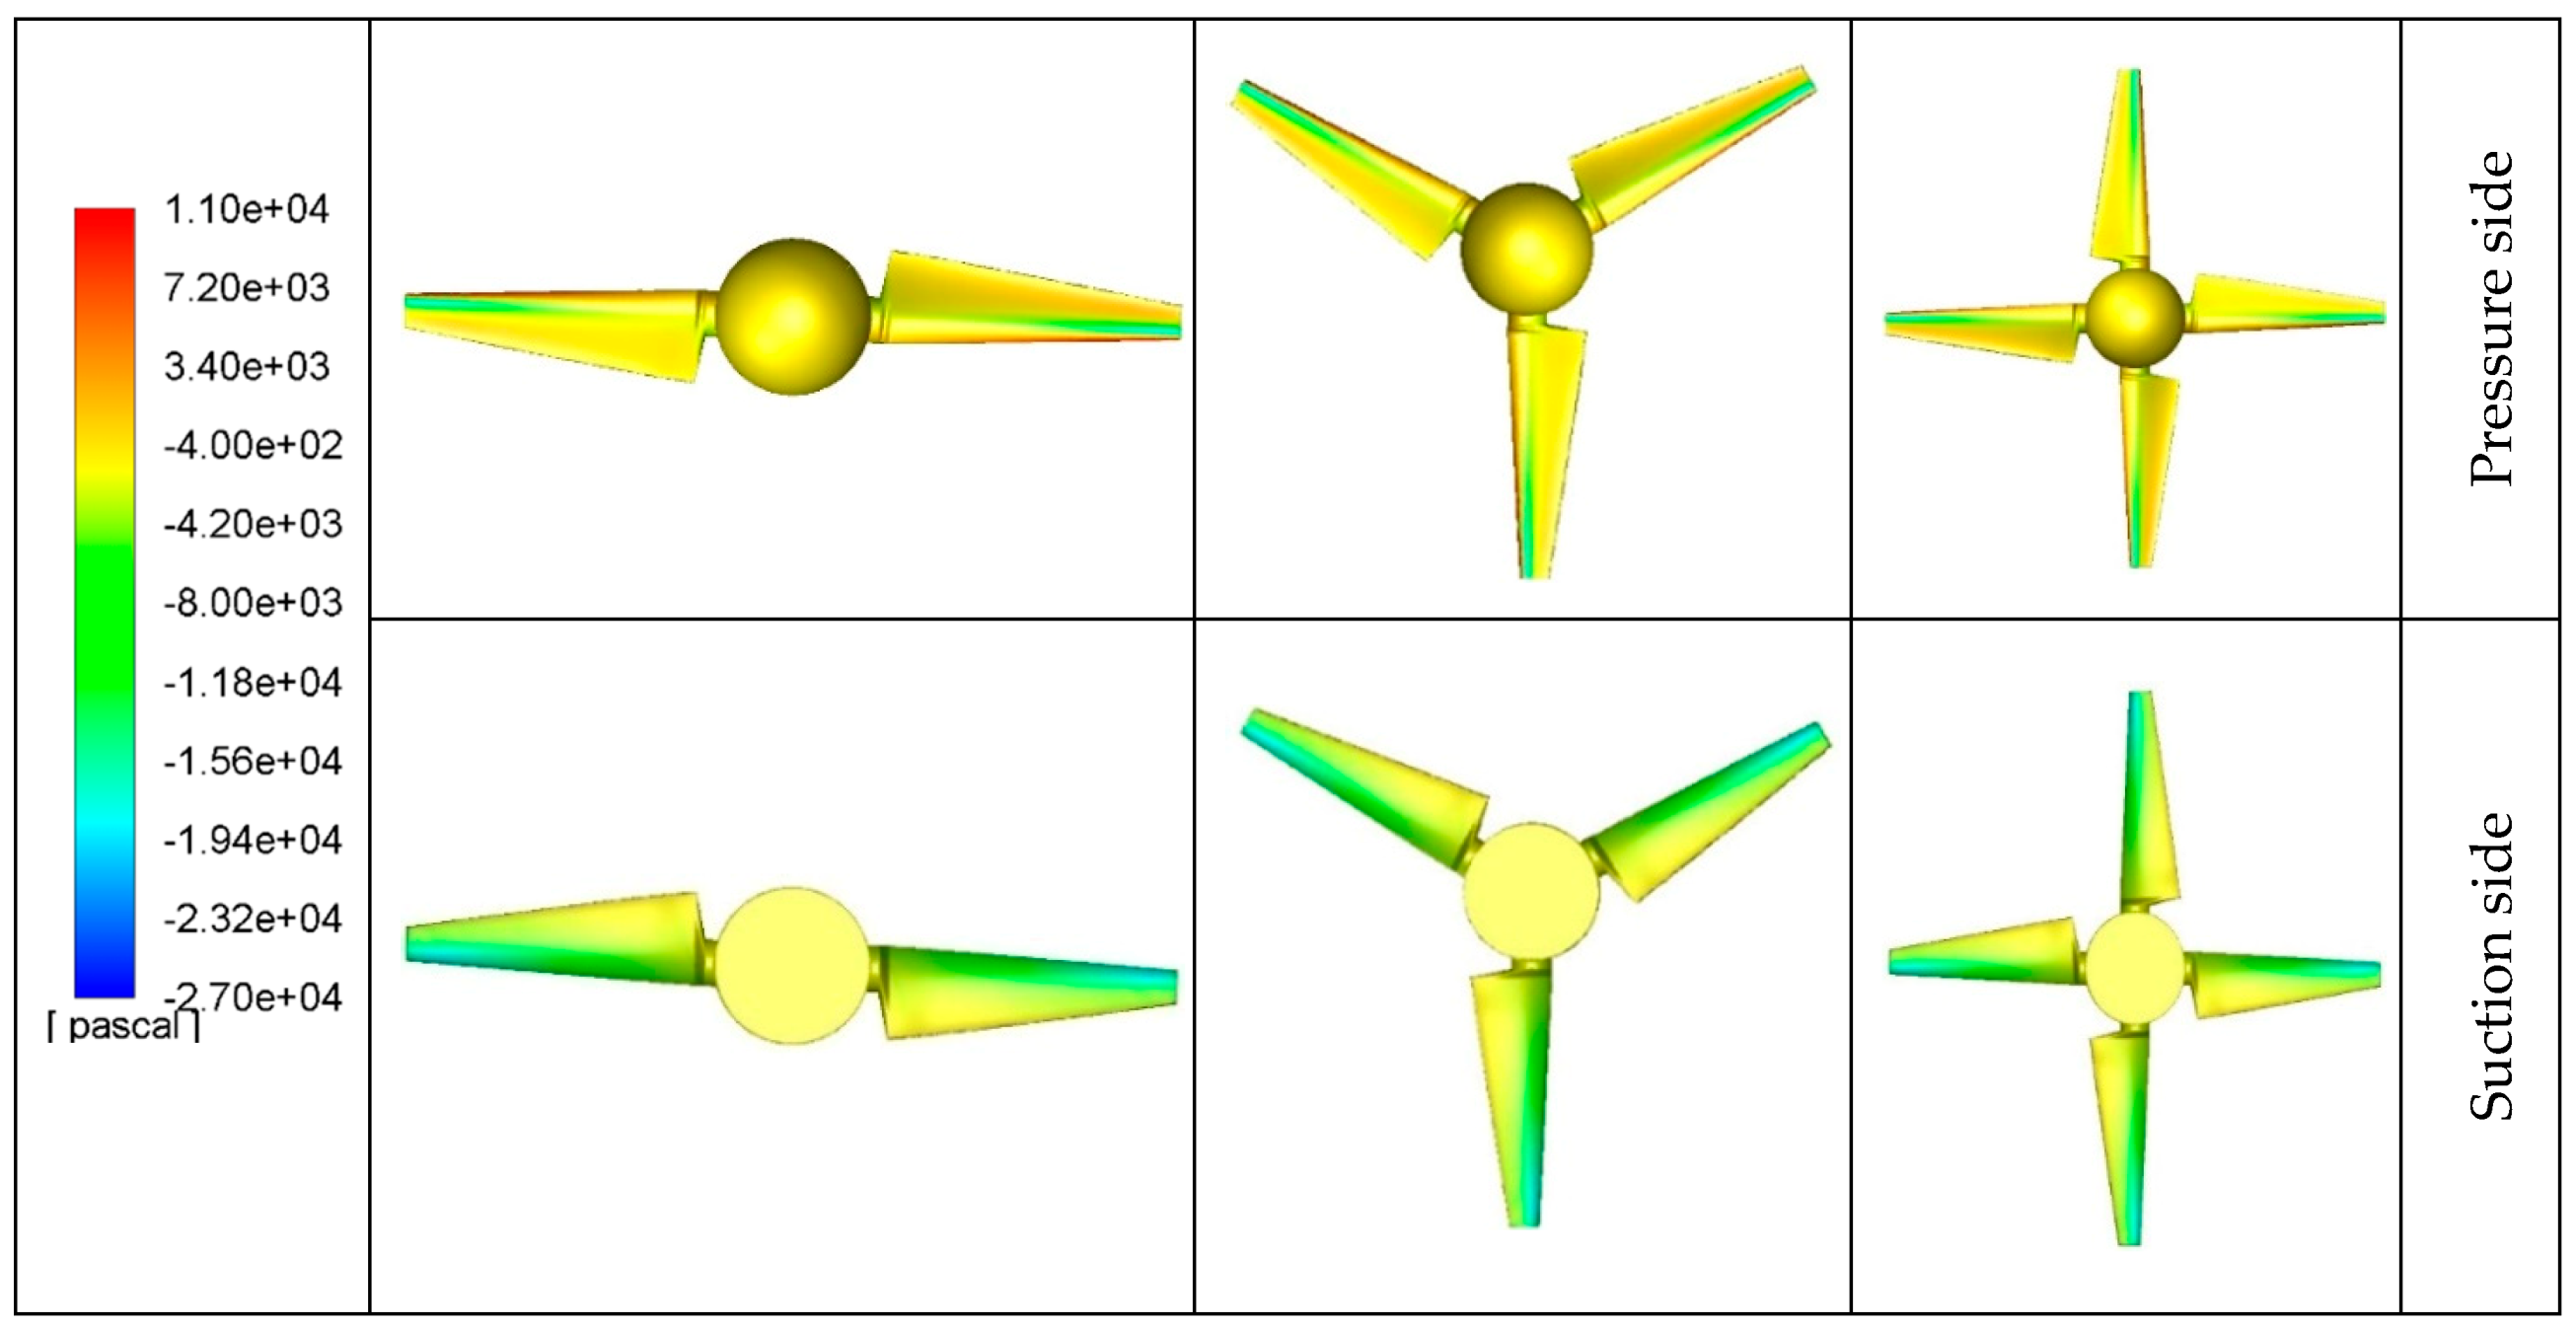
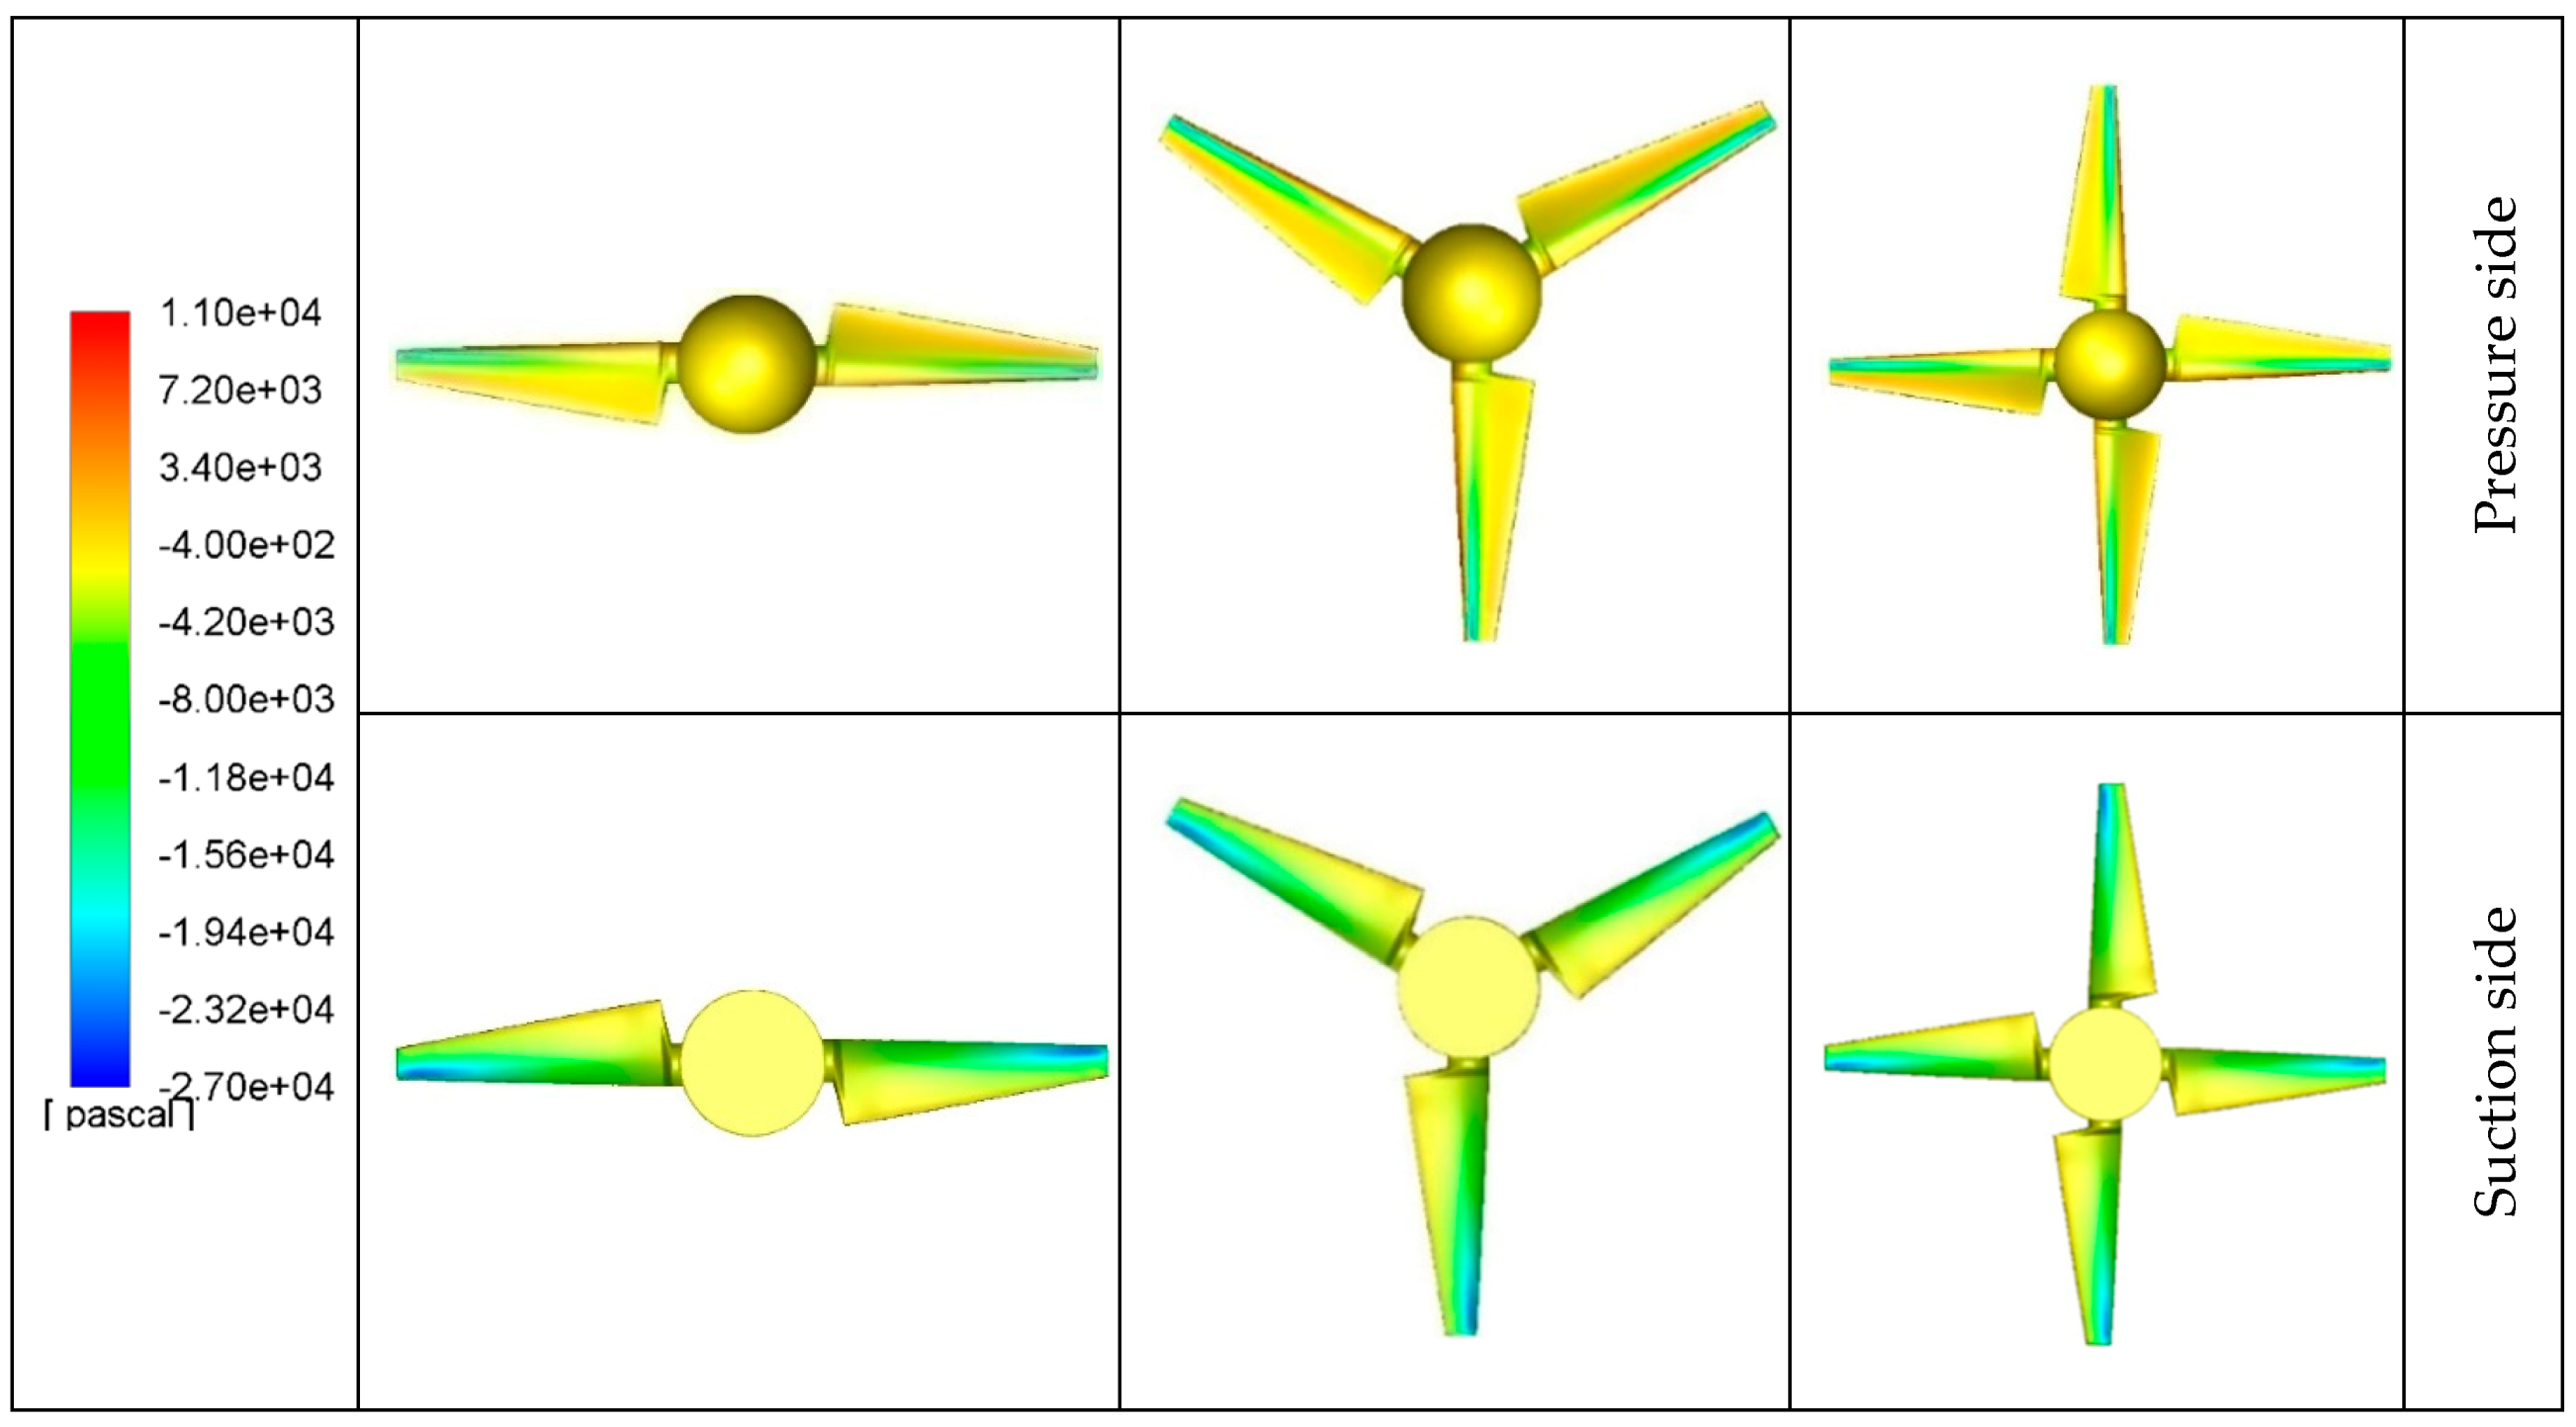
The pressure distribution contours on the pressure and suction sides of the turbines blade for all types of HATCTs presented in this study at different amounts of TSR are shown in Figure 7, Figure 8, Figure 9, Figure 10, Figure 11 and Figure 12. From these figures, it can be realized that the value of pressure drops for all types of HATCTs and in a different amount of TSR is around 3.8 × 10⁴ Pa. For all cases, the maximum pressure occurred in the leading edge, because when the blades are flush with the fluid, the velocity of the fluid becomes zero, which leads this area to obtain a higher value of pressure than the other areas.
In Figure 7, Figure 8, Figure 9, Figure 10, Figure 11 and Figure 12, it is also revealed that the pressure values in the leading-edge region for the tip area were increased with an increase in the amount of TSR. In fact, when TSR increases, the value of blade velocity enhances due to the fluid impact and, consequently, the amount of force continues to increase. Hence, the value of the pressure increases in the leading edge. However, when the flow passes the leading edge, the flow velocity along the airfoil increases and causes a drop in pressure at the arc-shaped area of airfoils.
On the other hand, an increase in the attack angle, especially in 2 ≤ TSR ≤ 3, at the arc-shaped area causes the flow to not easily pass through the suction side curvature of the airfoil. Thus, a separation occurs and the pressure drop is less than that expected for the other amounts of TSR. As is obvious from Figure 7, Figure 8, Figure 9, Figure 10, Figure 11 and Figure 12, for the values of TSR between 4 and 5, the pressure difference significantly rises for all types of HATCTs.
Figure 7, Figure 8, Figure 9, Figure 10, Figure 11 and Figure 12 also indicate that a negative pressure is generated at the suction and pressure sides of the turbines for 6 ≤ TSR ≤ 7, which is due to a decline in the attack angle and thus the pressure drop reduces. As a result, the obtained torque and subsequently the performance of HATCTs decrease. Thus, based on pressure contours for 4 ≤ TSR ≤ 5, the maximum performance is able to be achieved.

4.3. Performance Exploration: TKE, Cut-in-Speed and Streamlines Approaches

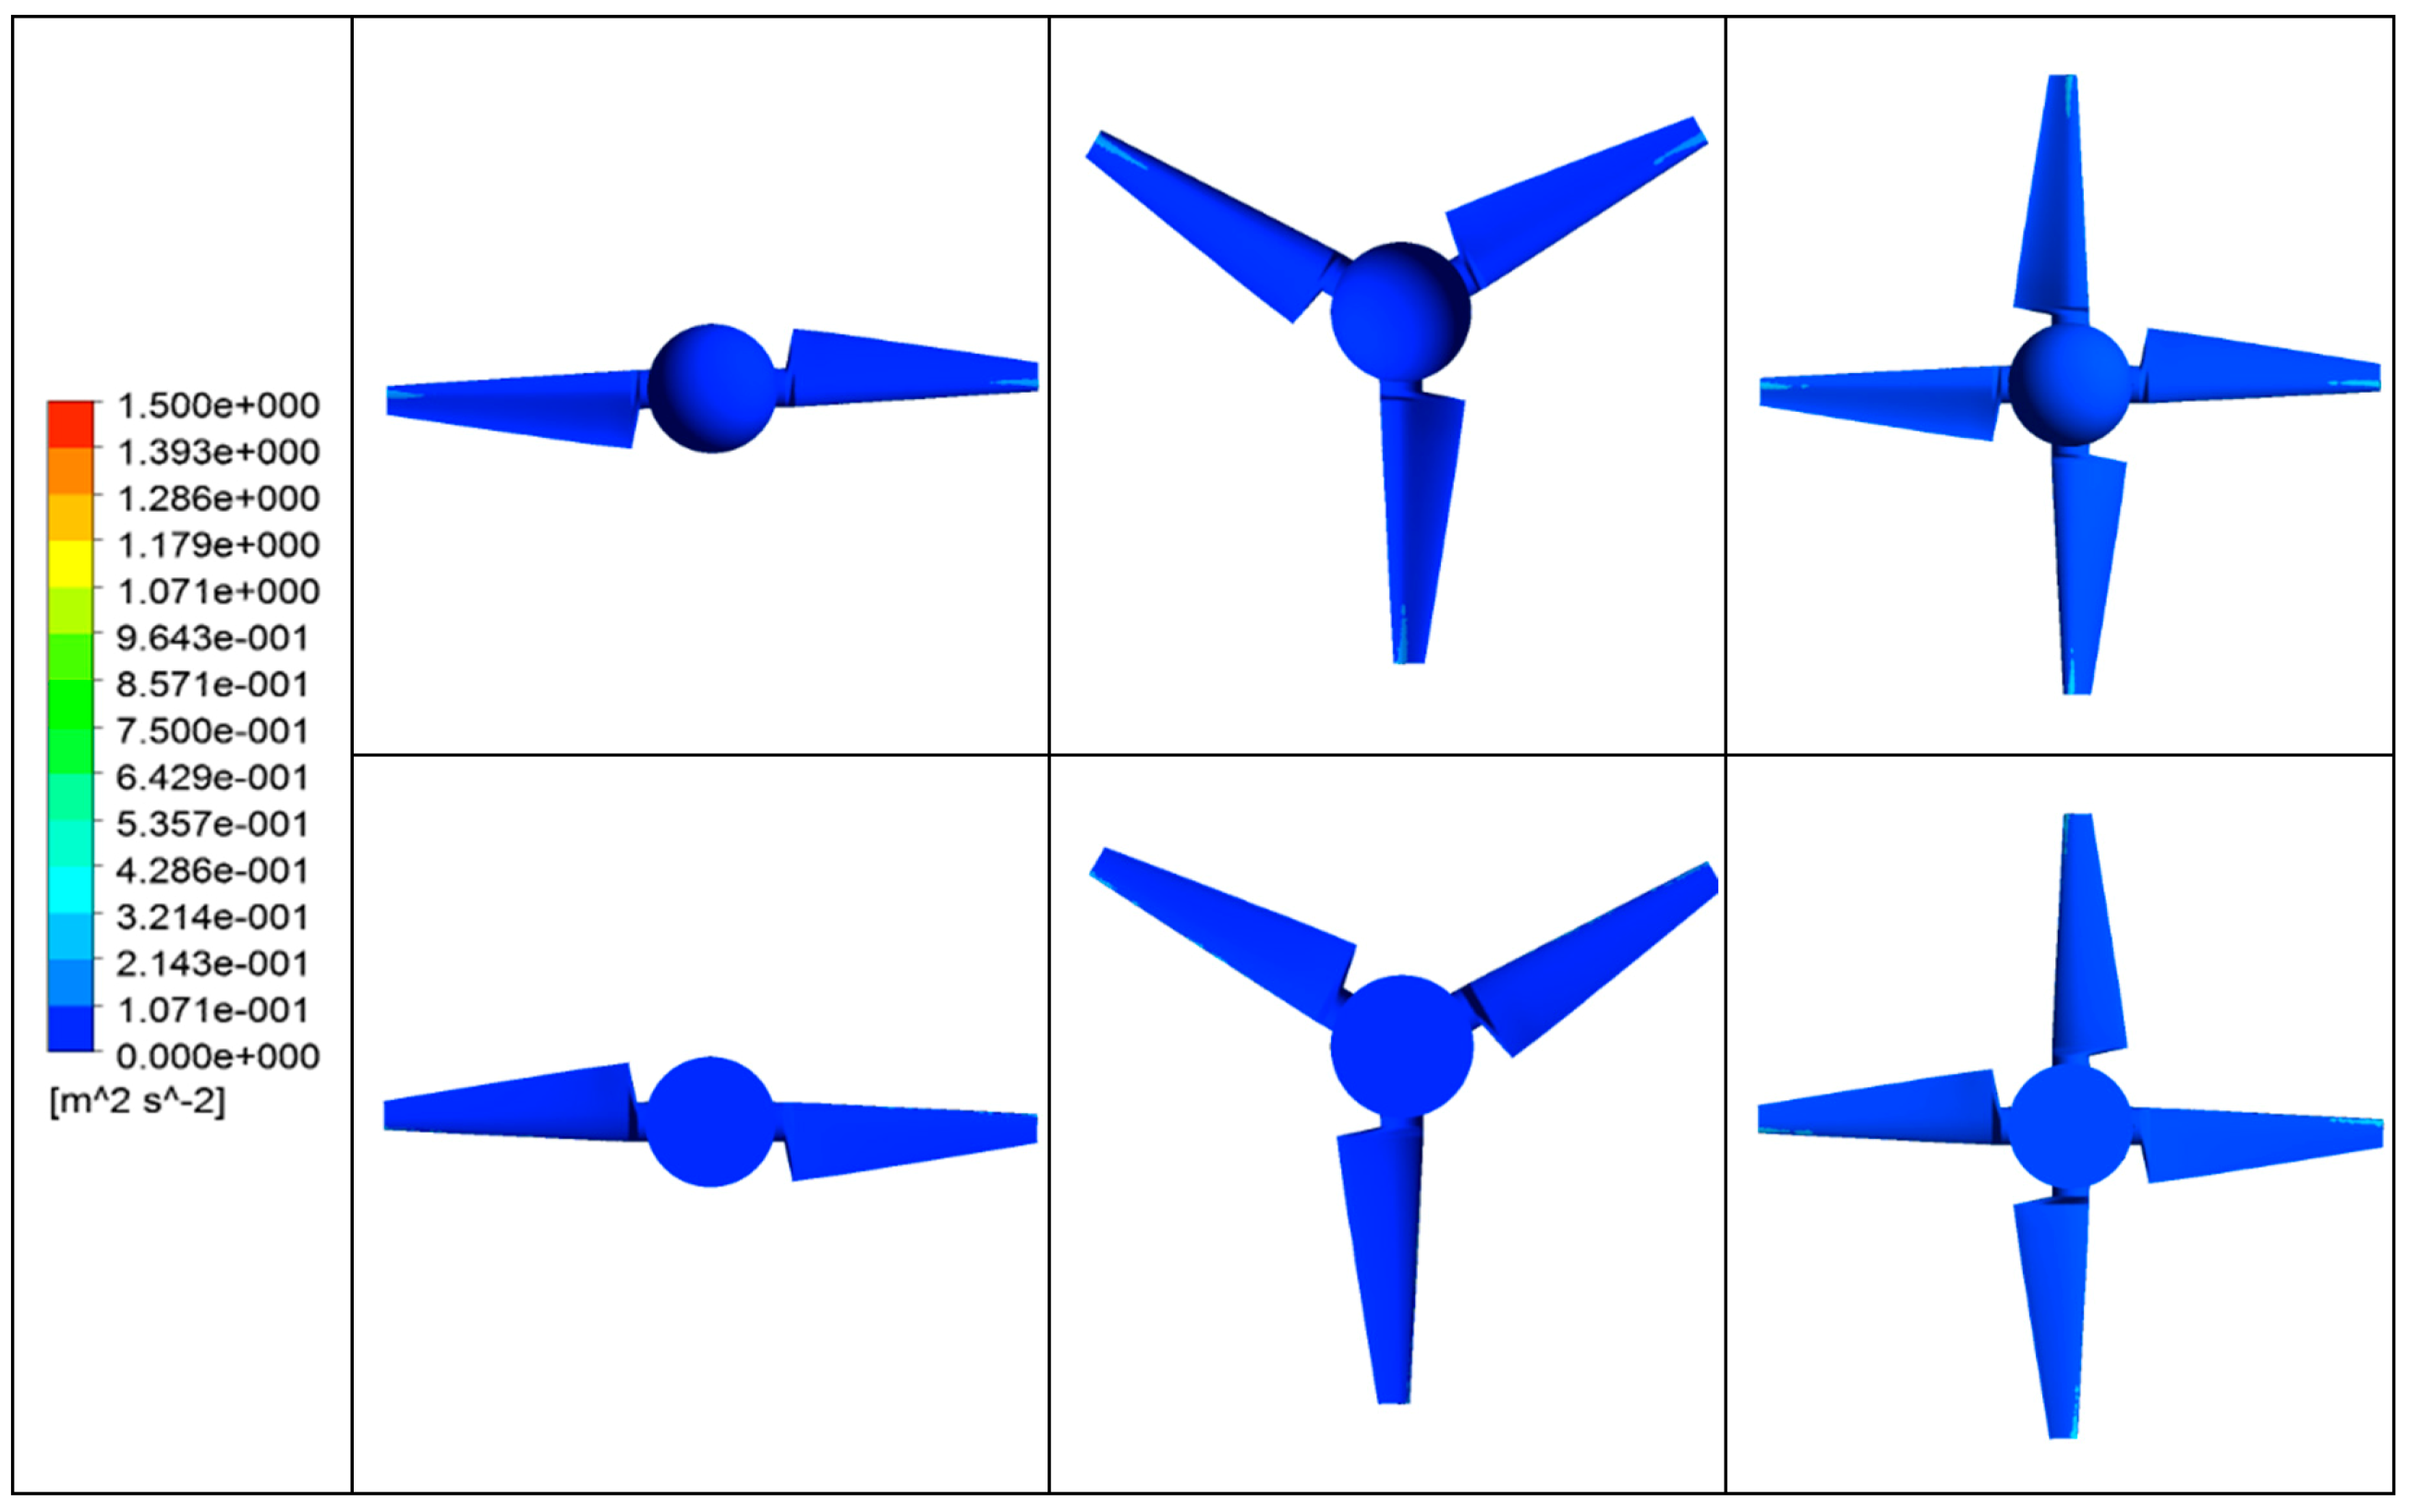
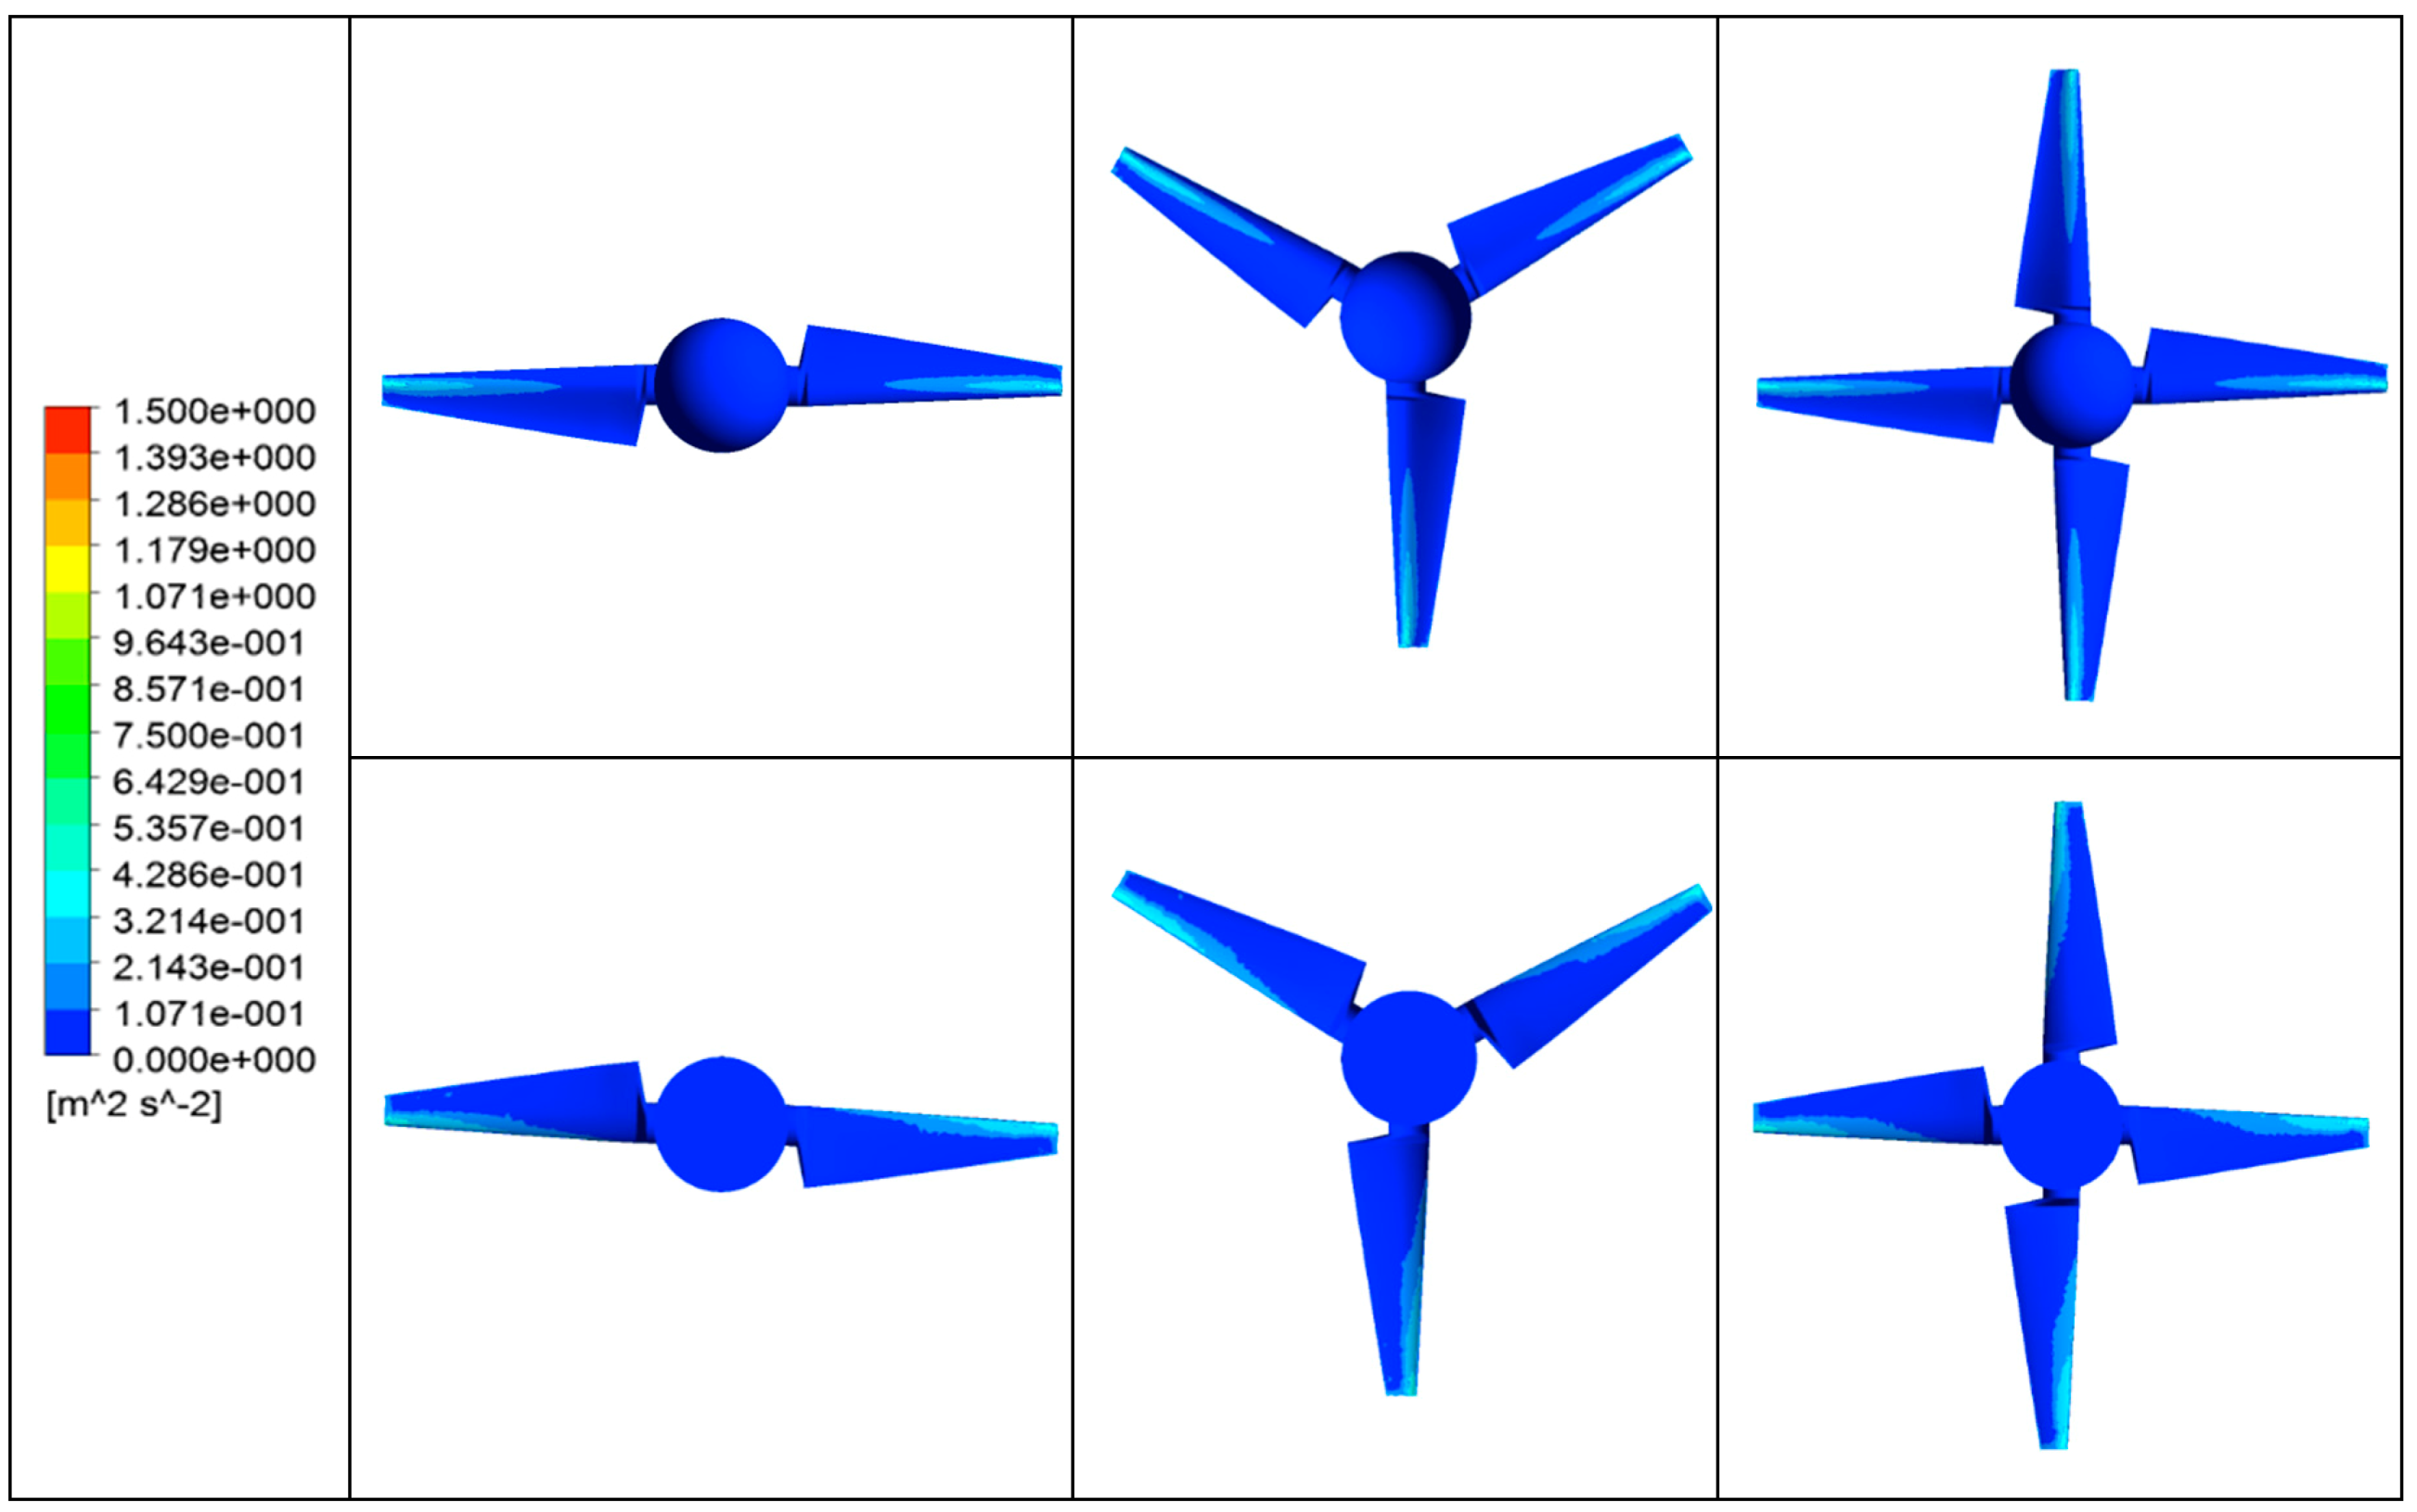
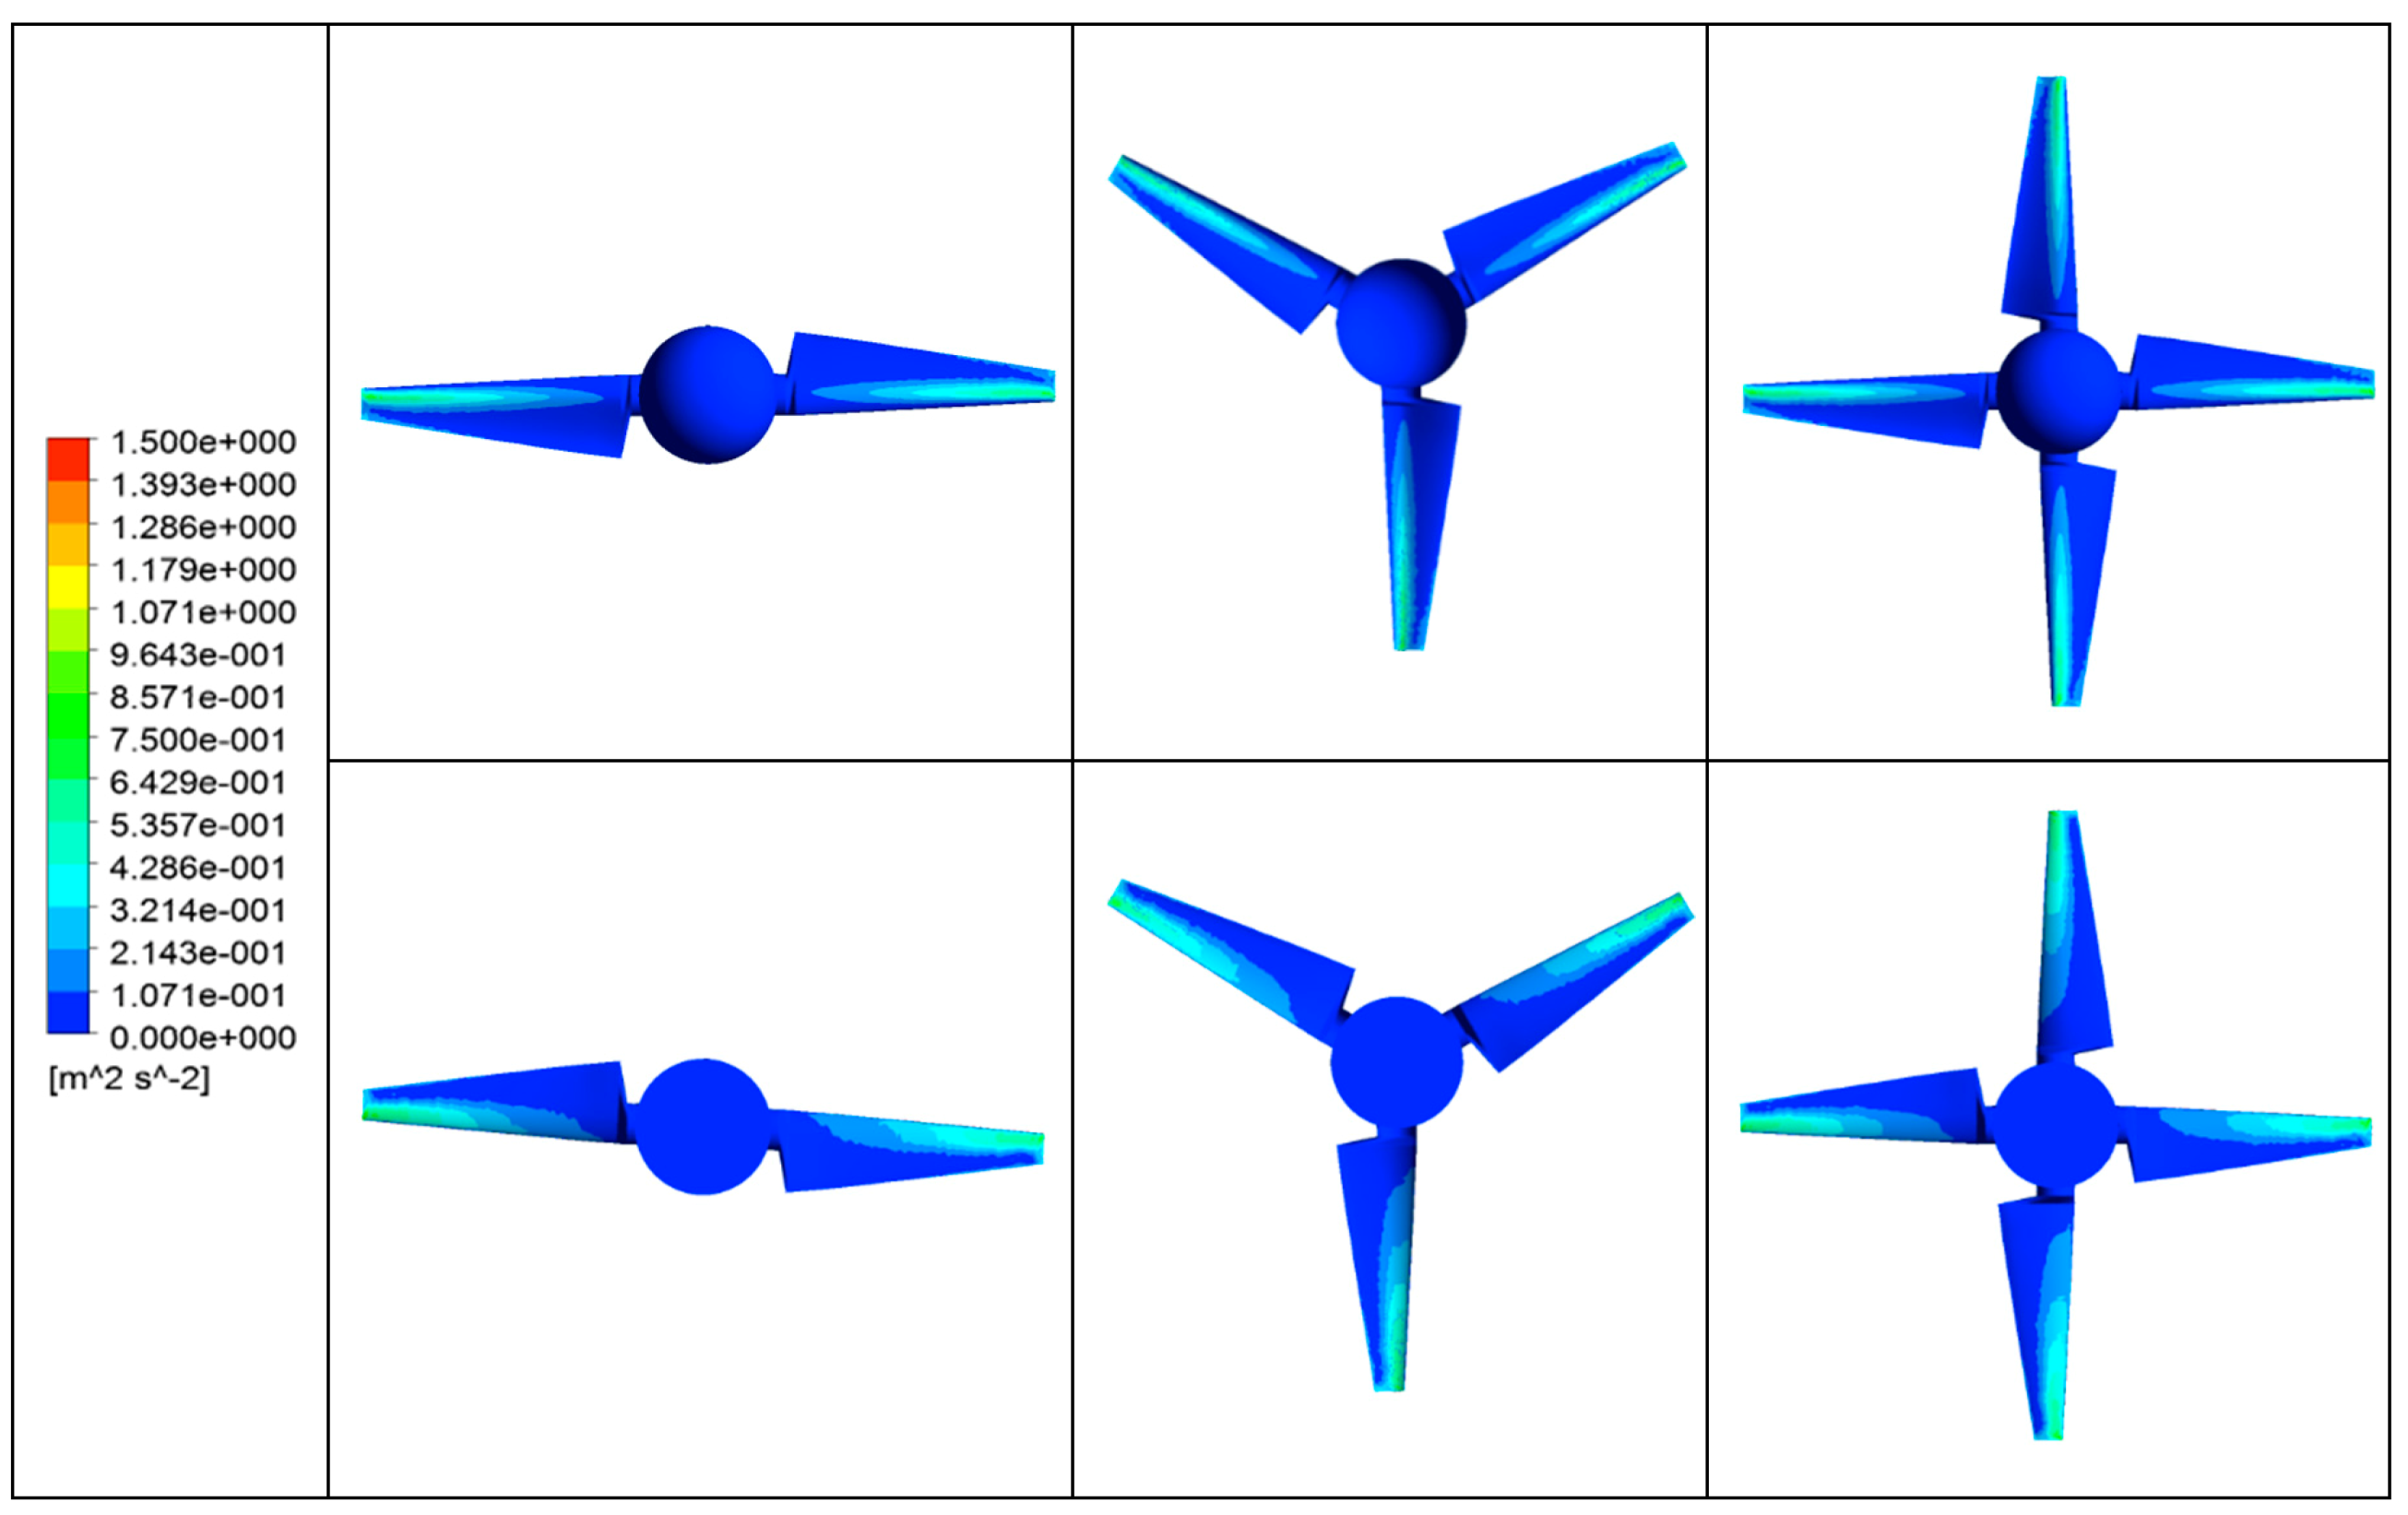
Figure 13, Figure 14 and Figure 15 show the TKE contours for different values of TSR. These figures reveal that the enhancement trend of TKE is proportional to the TSR for all types of HATCTs. In fact, in the higher values of TSR, the attack angle reduces and, consequently, turbulence occurs because the fluid does not smoothly flow along the airfoil surface and falls off. Thus, drag caused by this turbulence reduces the torque and performance of the HATCT. Although the contours shown in Figure 13, Figure 14 and Figure 15 are able to explain the relationship between the TKE and TSR, they are not an appropriate criterion to interpret the role of blade numbers contributing to the issue of performance in different situations. Therefore, to further investigate the effect of blade numbers on the performance of HATCTs, cut-in-speed curves and streamline contours need to be plotted and evaluated.
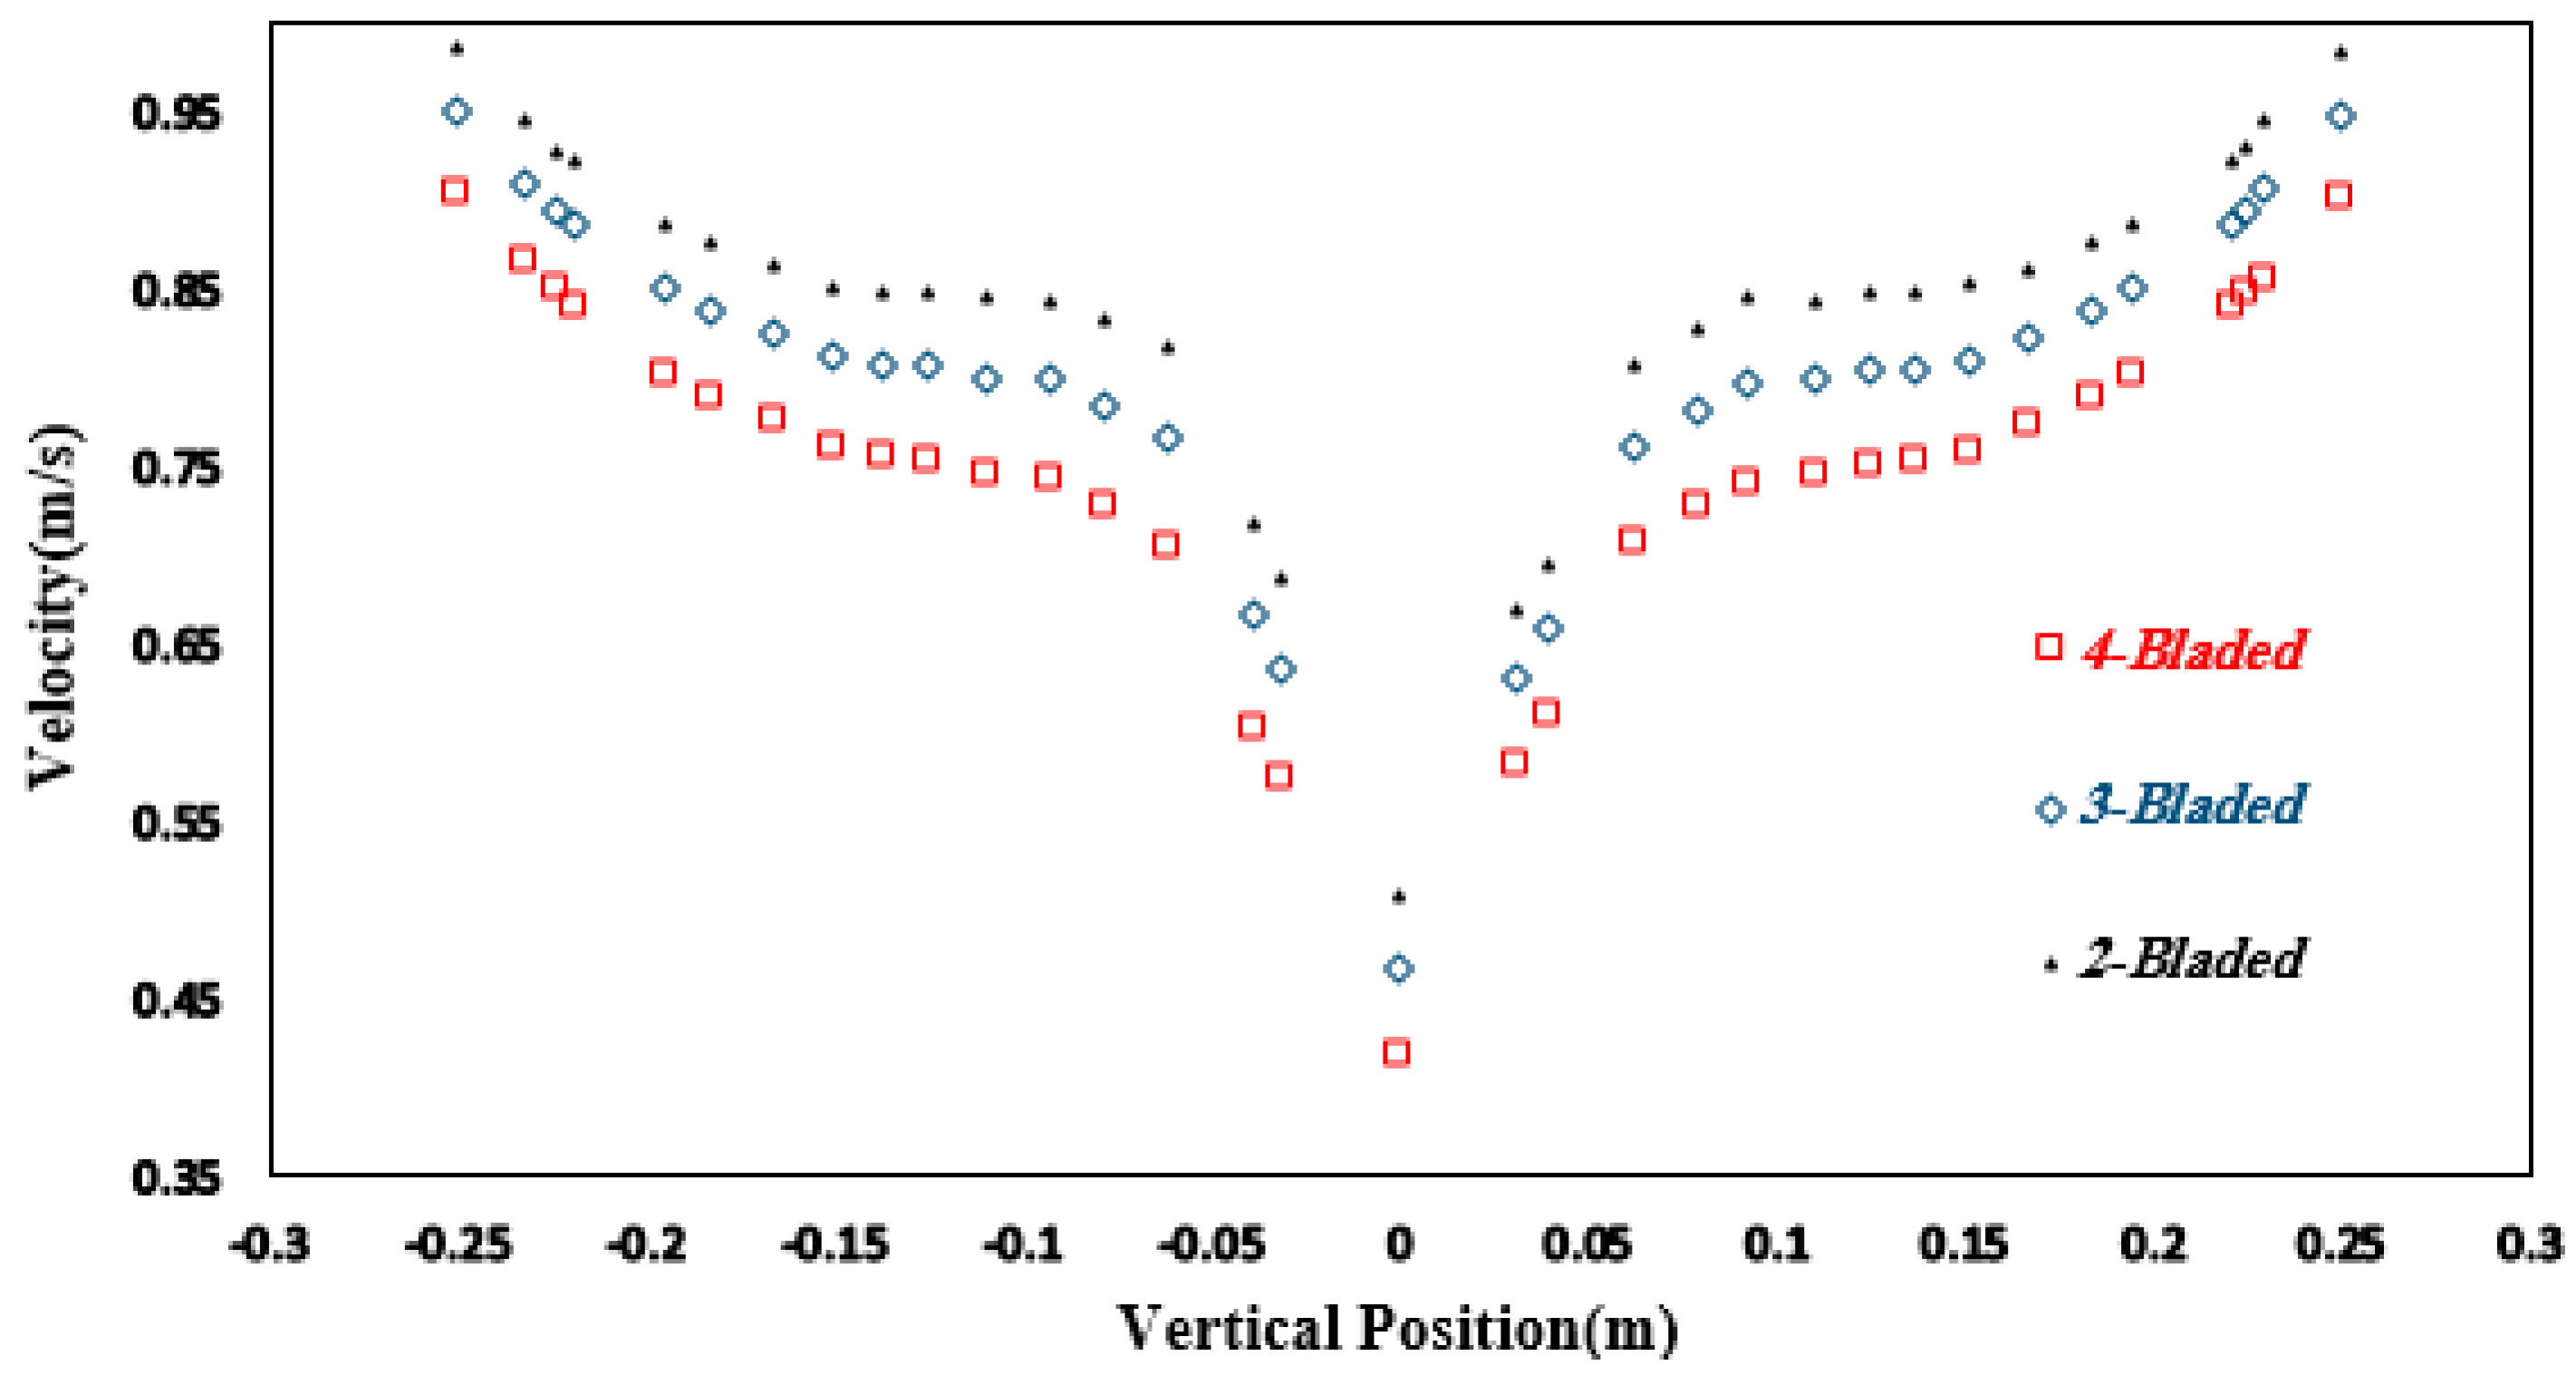
Figure 16 shows the velocity distribution profile for a region near the turbine for different models. It can be observed that the maximum velocity occurs close to the tip, equaling 0.9, 0.94, and 0.98 m/s for four-bladed, three-Bladed, and two-bladed HATCTs, respectively. This indicates that the cut-in-speed value for the four-bladed HATCT was more than those for the other HATCTs. This issue is also certified by considering Figure 17, in which the maximum cut-in-speed values were 9.7%, 5.2%, and 1.6% for four-bladed, three-bladed and 2-bladed HATCTs, respectively. This trend implies that by increasing the number of blades, more cut-in-speed occurs. This may be related to the blockage factor due to an increase in the number of blades. Likewise, using more blades leads to a decrease in the attack angle, which can influence the performance results of the turbine. This is in good agreement with the results presented in [50].
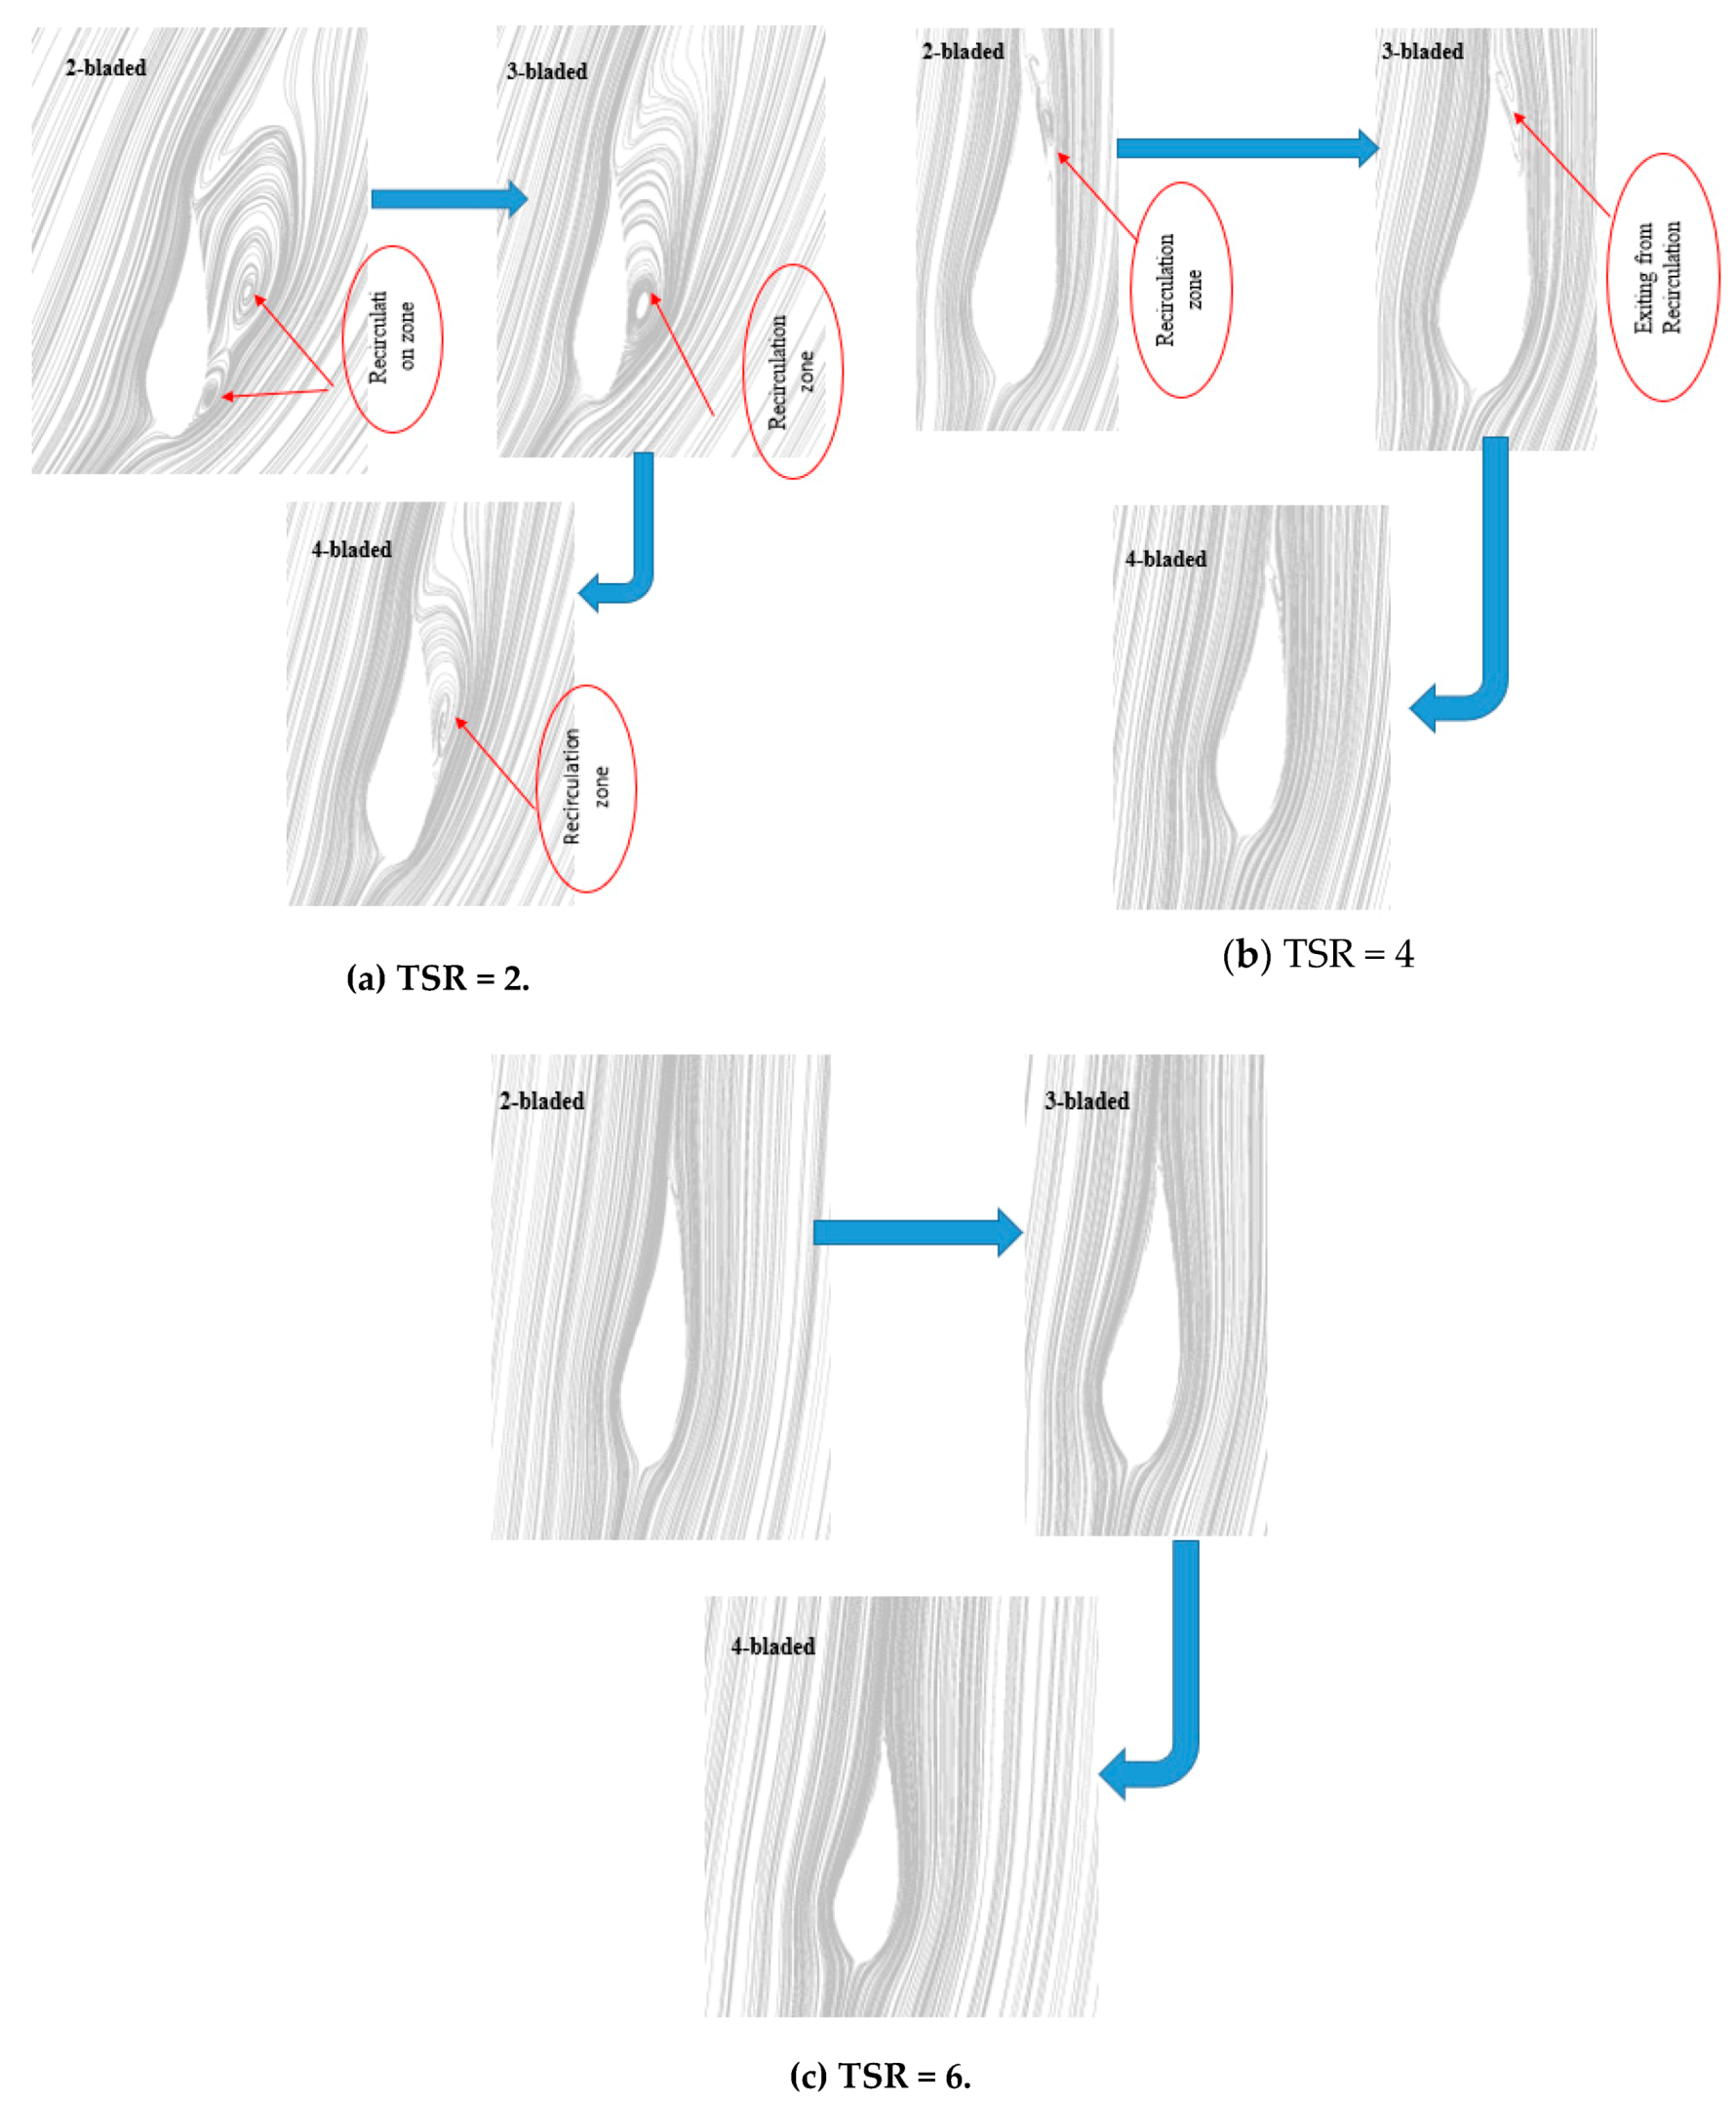
To clarify the effect of cut-in-speed on the attack angle at different values of TSR and blade numbers, the streamline contours need to be investigated. Figure 18 displays the streamline contours for different blade numbers under various TSRs. From Figure 18a, it can be observed that, at TSR = 2, due to the low angular velocity, the attack angle becomes higher and hence, the lift to drag ratio (LDR) reduces and stalling occurs. By increasing the blade number, these stalls gradually take some distance from the airfoil. From Figure 18b, it is clear that, with increasing the TSR to 4, the recirculation zone becomes smaller, so that no trace of it can be observed, at least for the four-bladed HATCT. The reasons for decreasing the recirculation zone for four-bladed HATCT lies in the cut-in-speed which leads to the reduction in the attack angle and increase in the solidity of the turbine. This attack angle reduction, especially in low TSRs, is a reason to increase the LDR and the torque. By increasing the TSR to 4, the attack angle continues to decrease, and somehow reaching an optimum value of LDR and torque becomes more possible.
For the higher values of TSR as shown in Figure 18c, the attack angle continues to reduce, and then the decrease in lift speeds up. Comparing the streamline contours, it is obvious that the reduction trend of attack angle is steeper for the higher blade numbers turbines due to the surviving from the occurred stalls. So, the HATCTs with the more blades sooner achieve the maximum value of LDR, and consequently, the related torque increases to the maximum value. However, as TSR increases and reaches a value of 6, the attack angle for the HATCTs with the higher blade numbers has more reduction and thus, the related drag increases remarkably. This leads to a decrease in the LDR, and then the torque reduces.
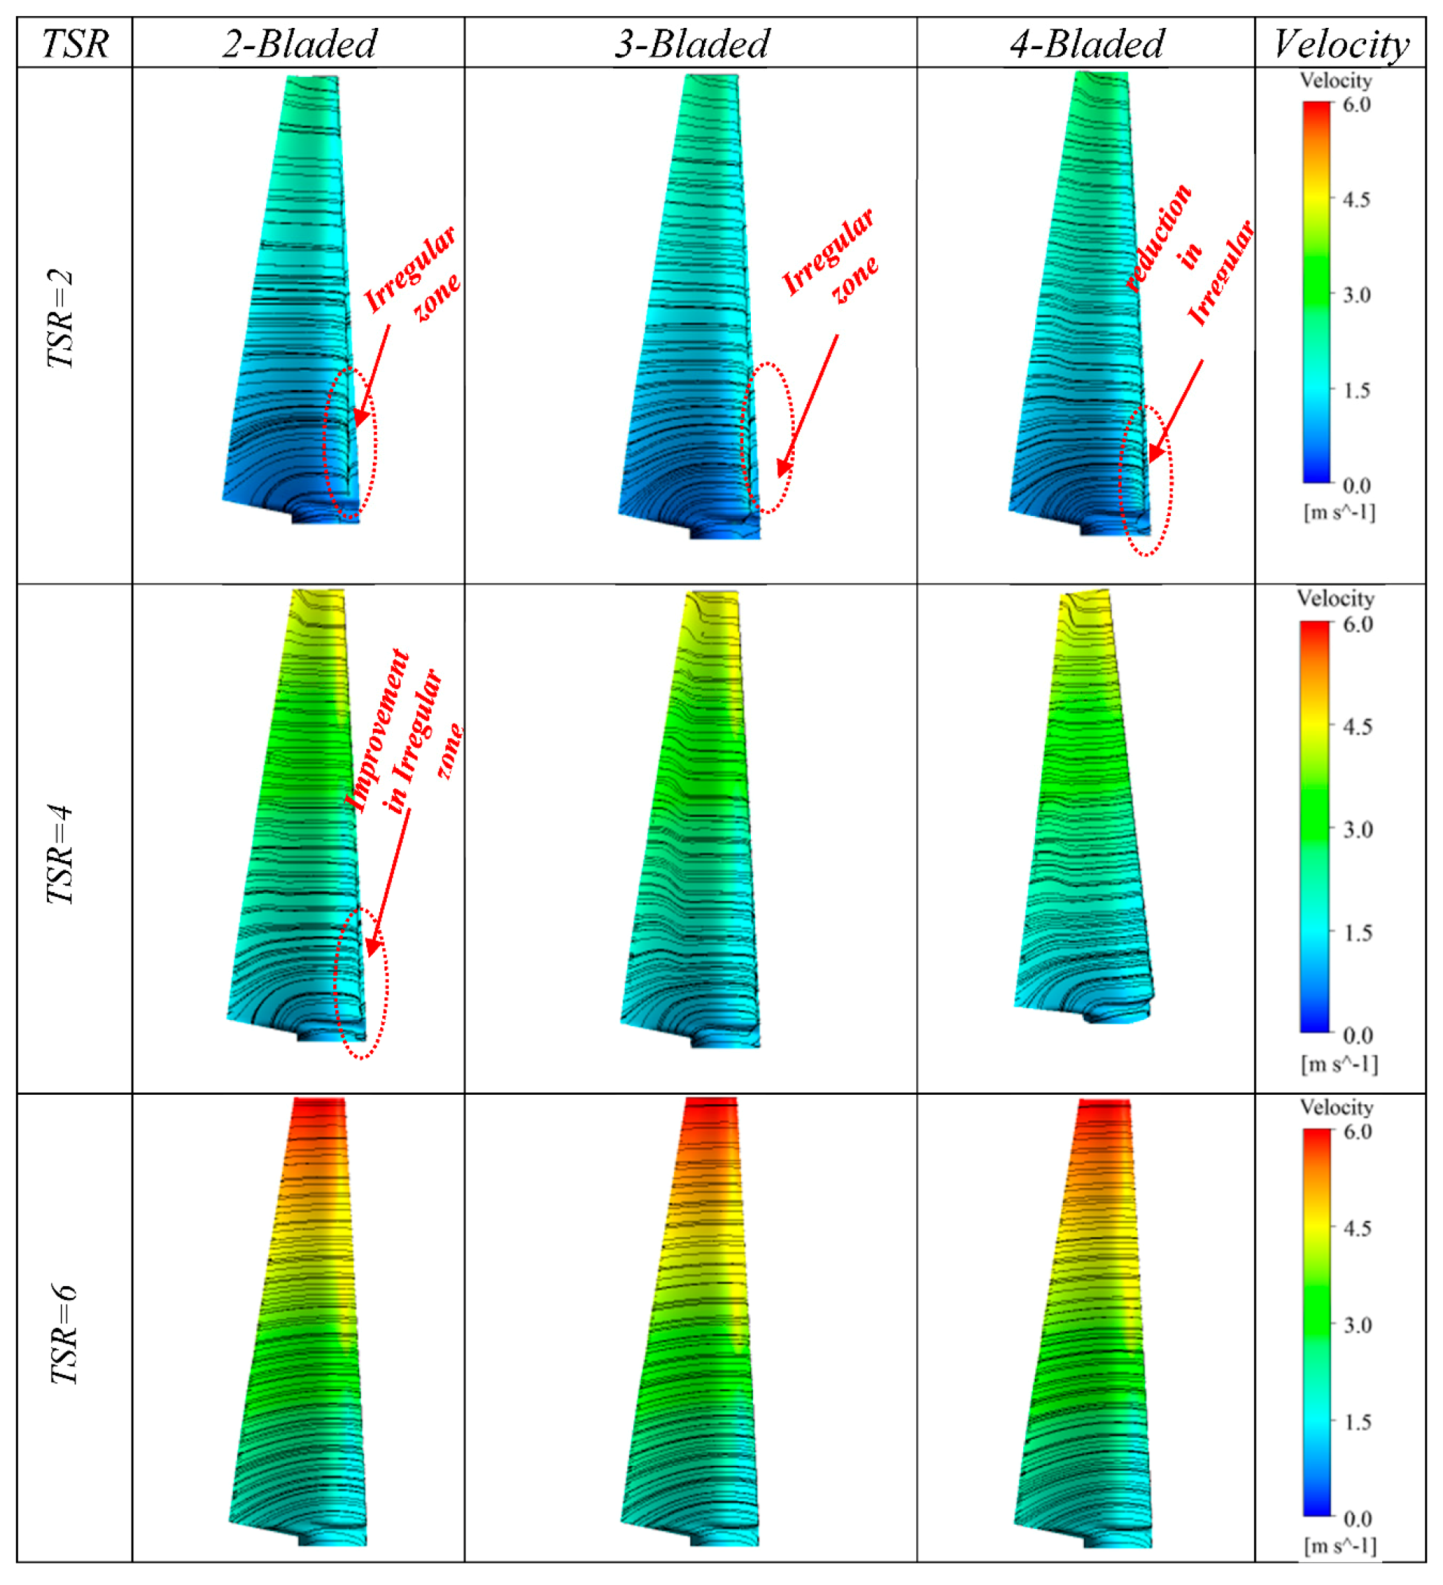
Figure 19 and Figure 20 depict the velocity distributions and streamlines on the turbine blade versus the TSR for different models in both suction and pressure sides. As the TSR increases, the amount of velocity increases, due to the enhancement of the angular velocity. It is also obvious that the value of velocity increases from root to tip by increasing the radius of the blade, meaning that the trend is similar to other studies [51,52].
By reviewing other research [51,52], it is found the created streamlines are more irregular for the lowers TSRs and leads to radial flow, as seen in this investigation. In addition, more regular streamlines observed on the pressure side respect to the suction side similar to other investigations [53,54]. On the other hand, by increasing the TSR, streamlines tend to become more regular (Figure 19 and Figure 20). Therefore, by increasing the TSRs as the angle of attack decreases, the irregular zone on the suction and pressure sides decreases [55], and this causes an increase in the power coefficient. As this investigation has proved, increasing the number of blades causes a cut-in-speed (Figure 16 and Figure 17), and leads to a decrease in the angle, and hence improvement in the area of regular zone is observed, as Figure 19 and Figure 20 show.
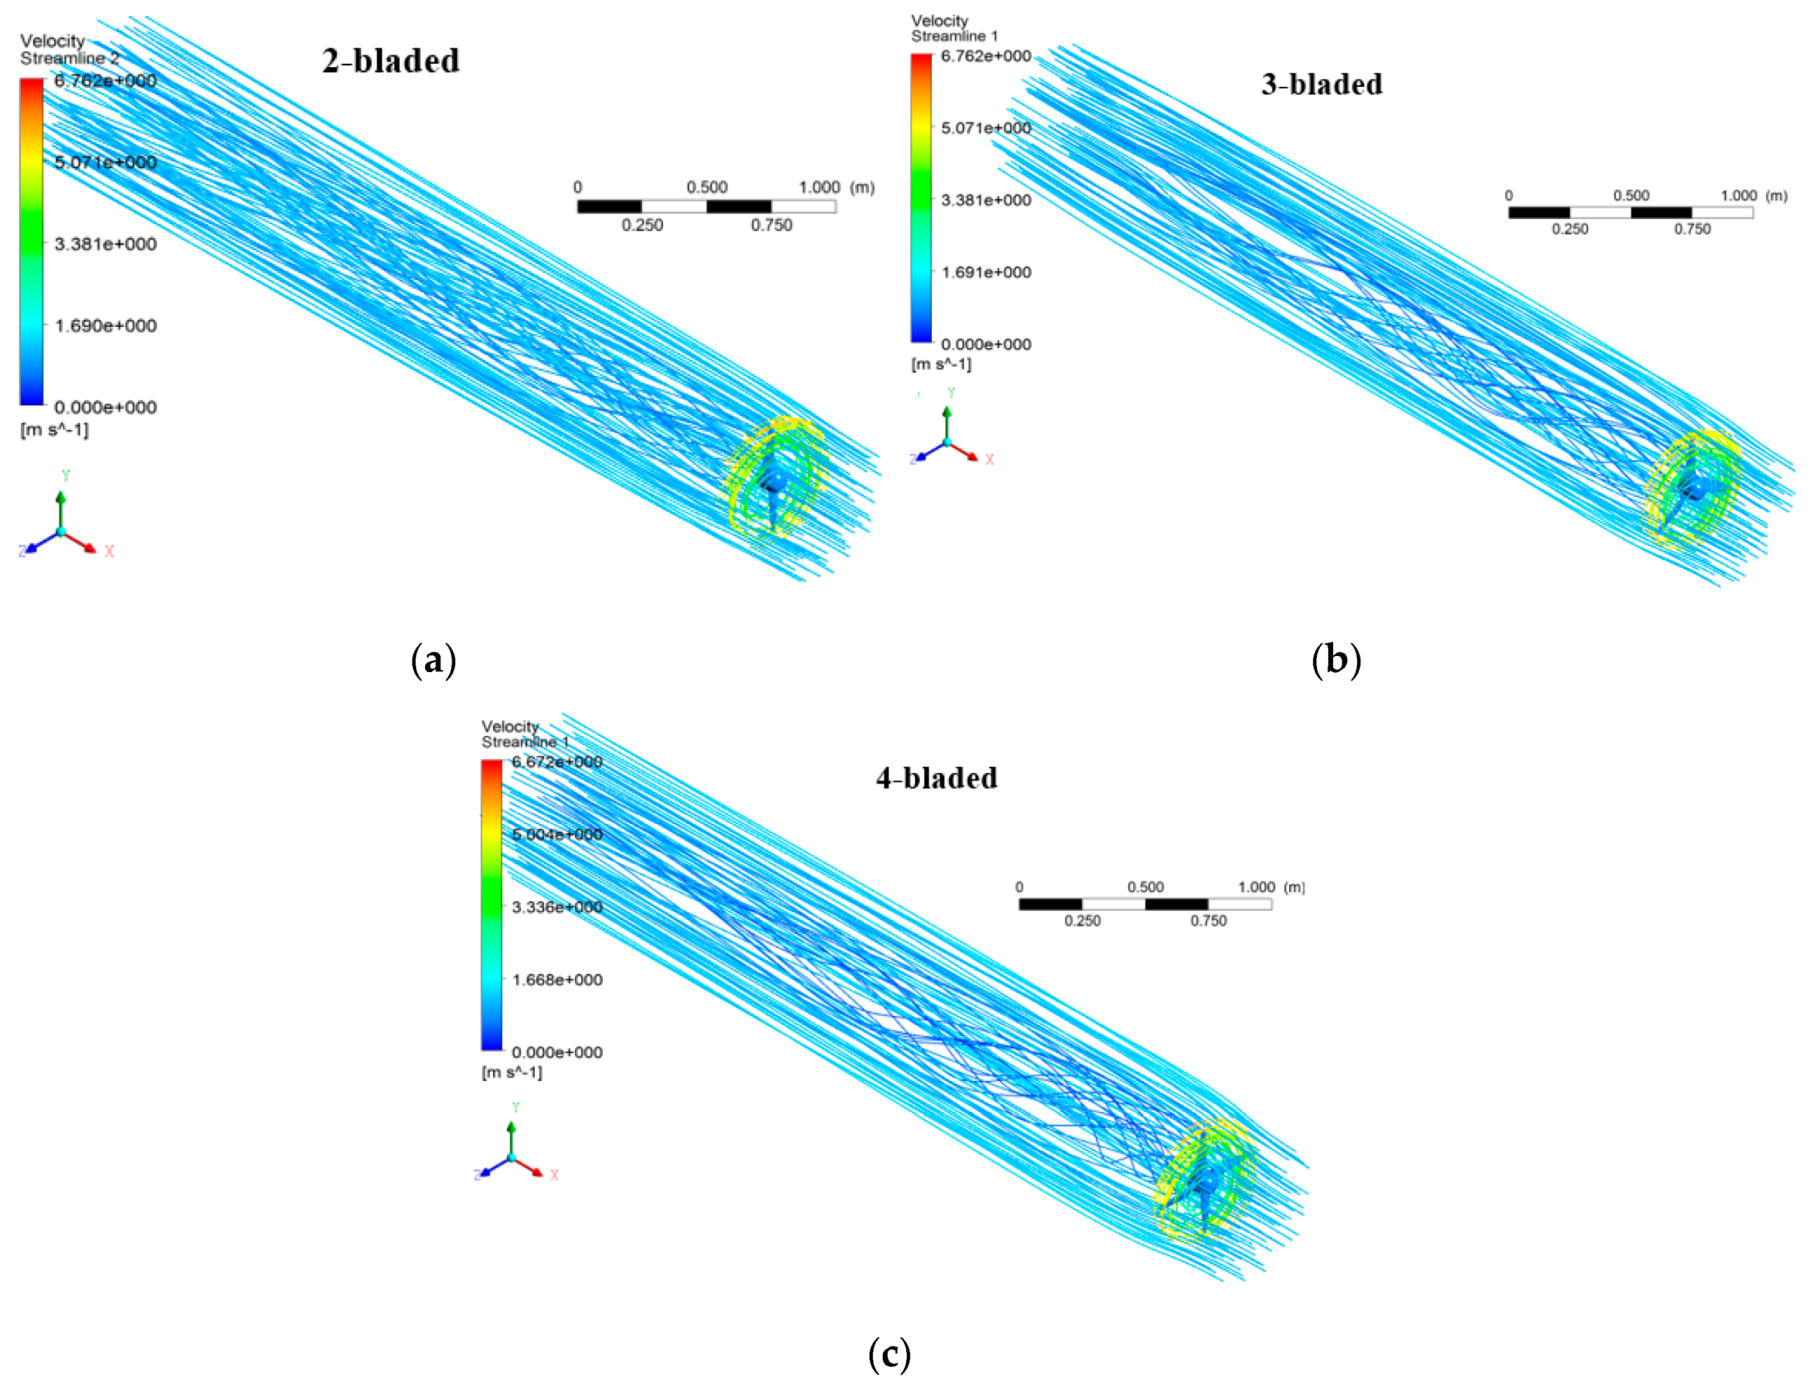
Figure 21 shows the rotor streamlines distribution for all types of HATCTs at TSR 5 where the optimal condition appeared in the present study. From this figure, it is verified that, for all types of turbines, the rotor streamlines expand once passing through the HATCTs. Nevertheless, this expansion for four-bladed and three-bladed HATCTs is more than that for two-bladed HATCT and causes the turbine to generate a wider wake area. As it is found from Figure 19, a velocity reduction can be considered for the wake area, such that it is more for four-bladed than that of two- and three-bladed turbines. The wake caused by the HATCT makes the performance analysis cumbersome and needs further investigation, which does not fall within the scope of the present research.

4.4. Performance Indicators: Torque, CT and CP Evaluation

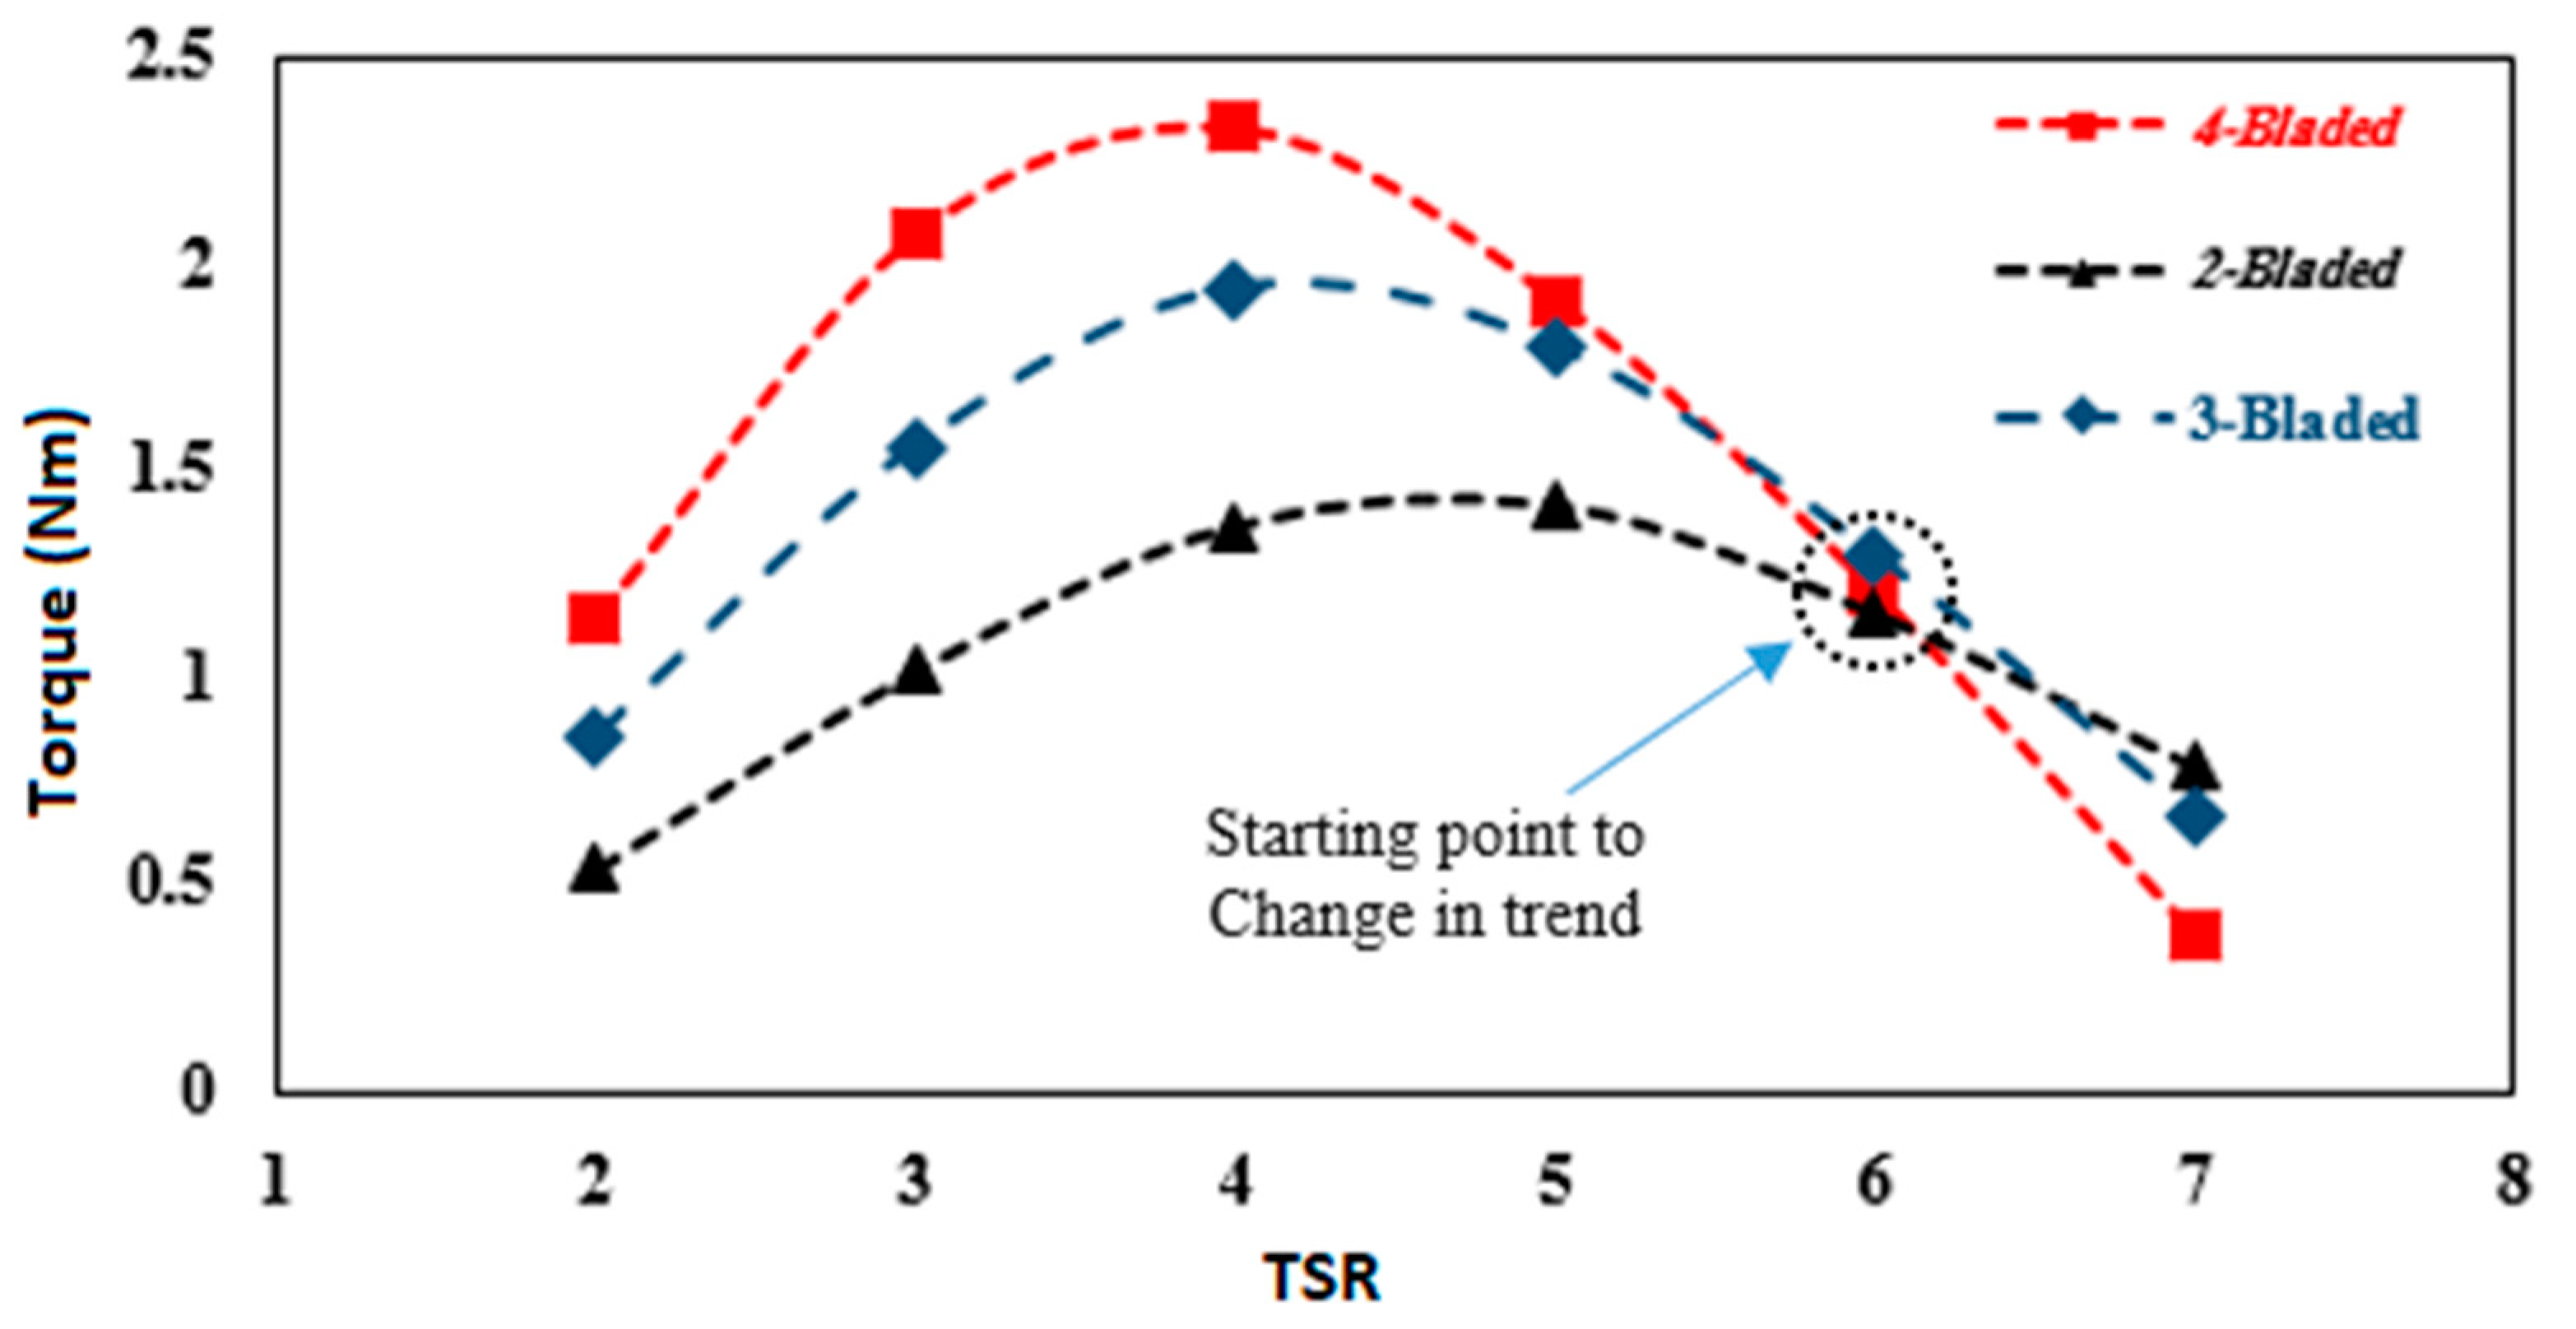
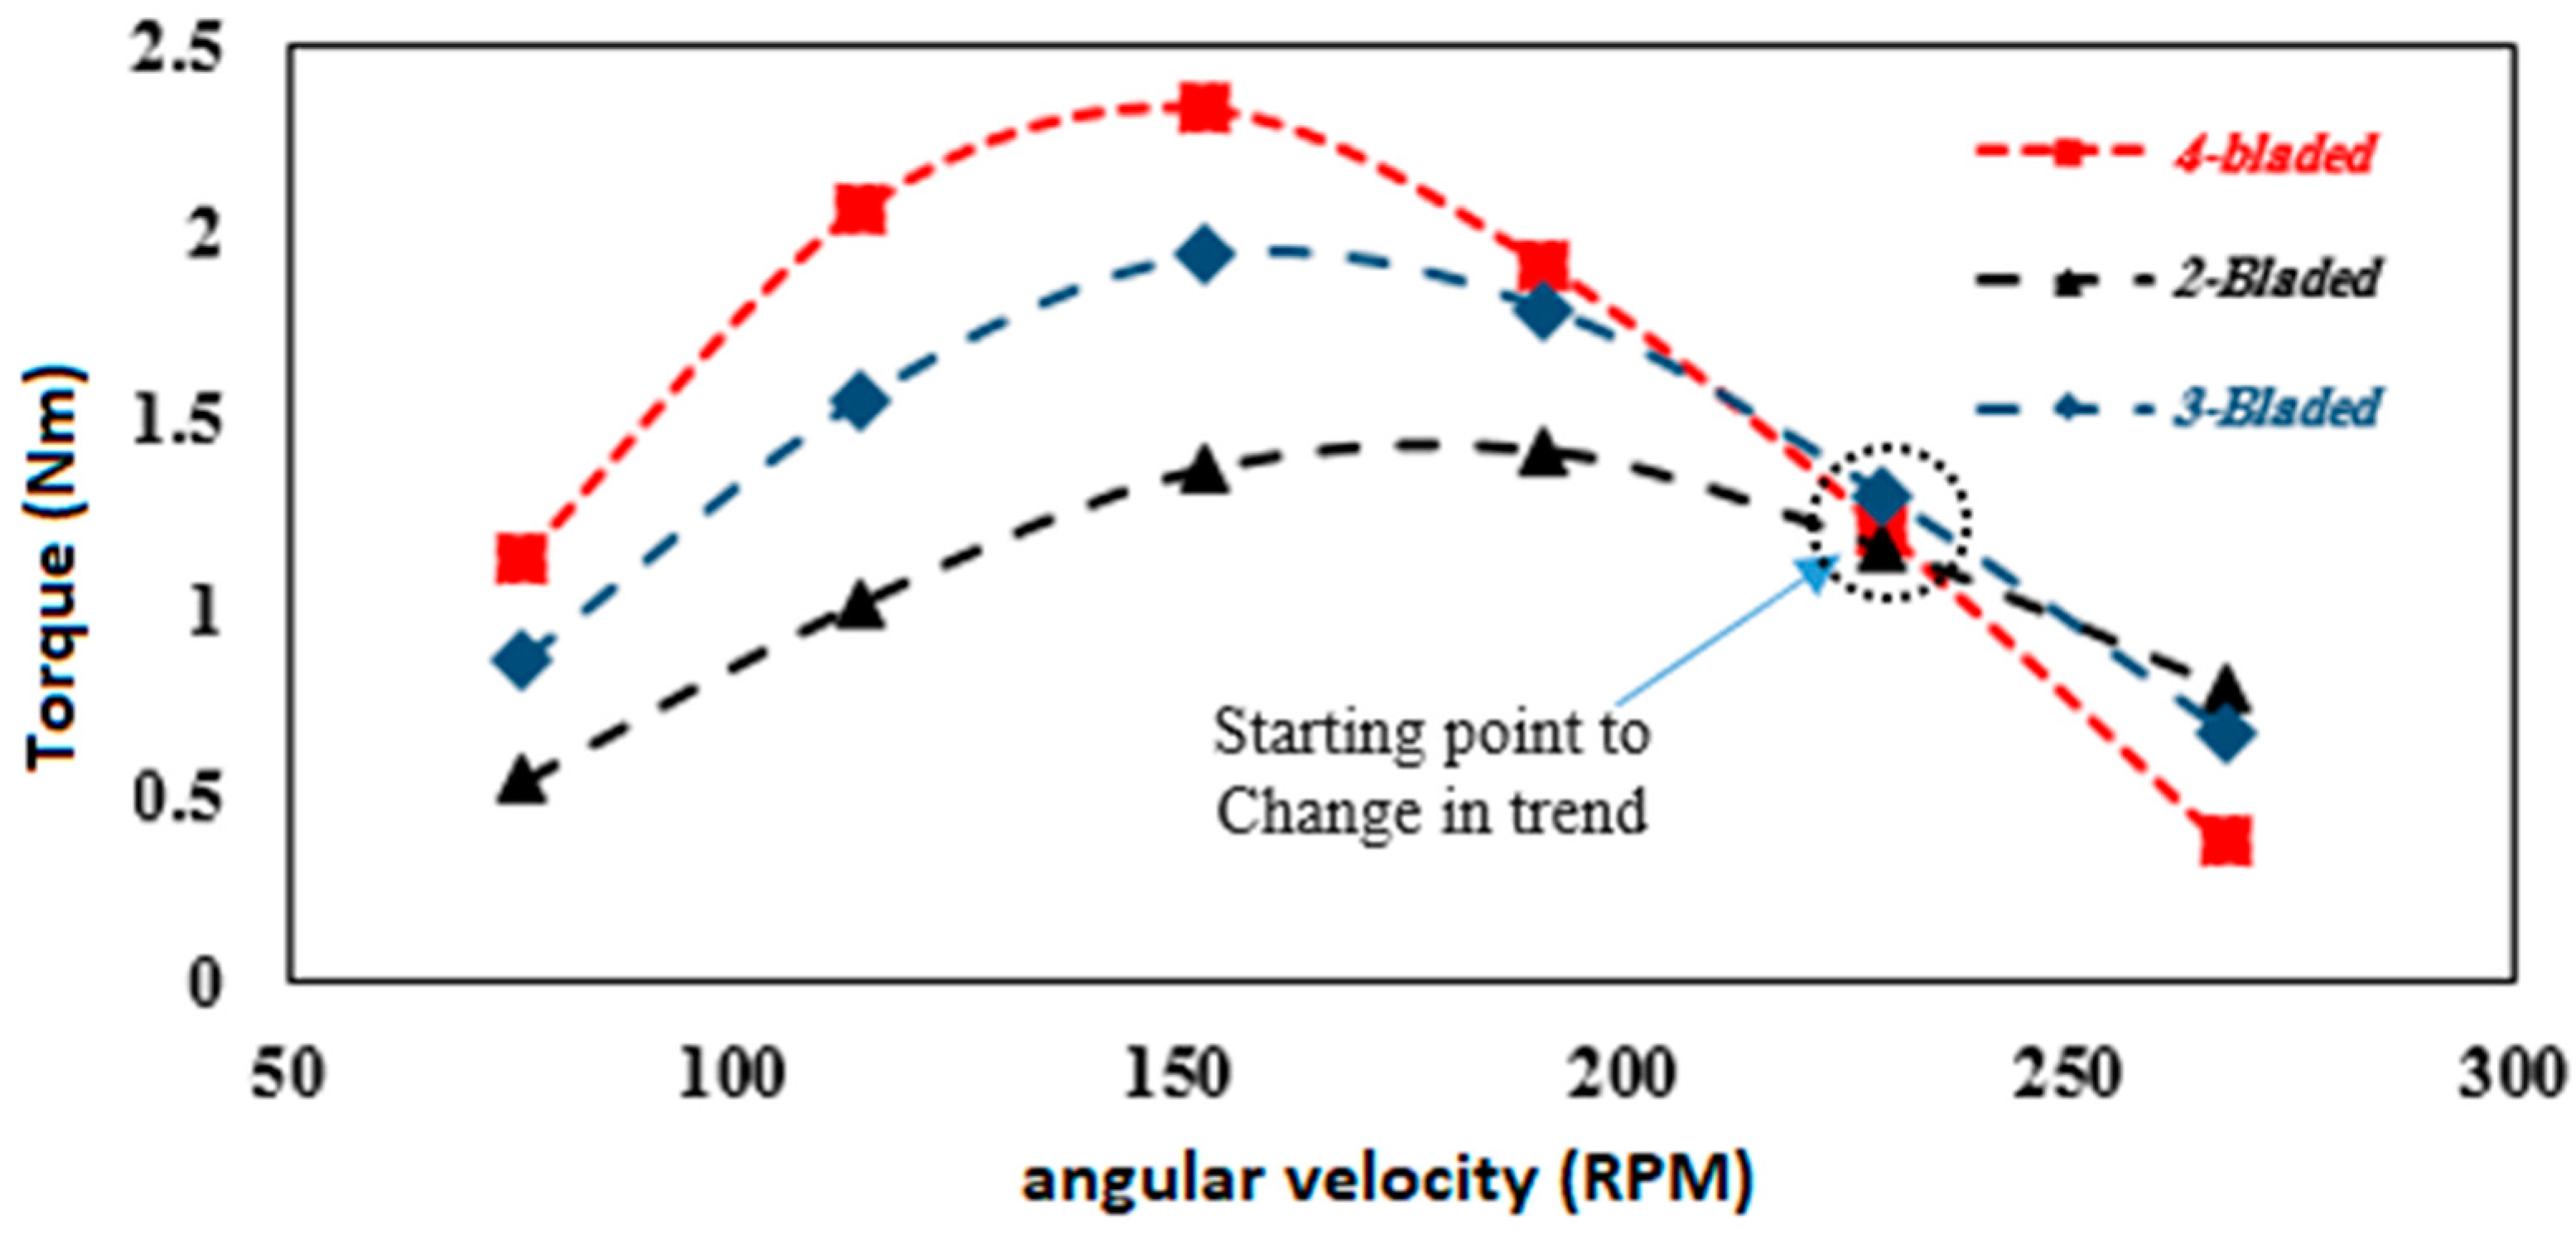
Figure 22 shows the torque achieved at the different values of TSR. As it is revealed, for four-bladed HATCT, with an increase in TSR, the value of torque continues to increase up to TSR 4, at which the torque equals 2.33 Nm, and then this manner is changed. There is an analogous situation for the other models, i.e., three-bladed and two-bladed HATCTs. The maximum torques are 1.47 Nm at TSR 5 and 1.94 Nm at TSR 4 for two-bladed and three-bladed HATCTs, respectively. A similar trend can be observed in the obtained torque versus angular velocity, as shown in Figure 23. By increasing the angular velocity, the maximum torque values achieved for four-bladed and three-bladed turbines are 2.33 and 1.94 Nm, respectively; both were obtained at 152.8 RPM. However, the maximum torque obtained for the two-bladed HATCT is 1.47 Nm at an angular velocity of 191 RPM.
From Figure 22 and Figure 23, it is obvious that decreasing the TSR leads to a decrease in angular velocity. As a result, the LDR decreases, stalling occurred and, consequently, the obtained torque dramatically decreases for all types of HATCTs. By increasing the TSR to 5, the angular velocity increases, and an improvement in LDR is achieved. After passing TSR 5, as the angular velocity increases, the attack angle faces further decline and turbulence occurs because the fluid does not flow along the airfoil surface and falls off, and the drag generated by turbulence reduces the torque of HATCTs. The other issue which is observed, the torque enhancement for four-bladed HATCT up to TSR 5, is more than those of two- and three-bladed HATCTs. In fact, passing TSR 5, more drag is generated due to the increase in blade numbers, which reduces the LDR and torque for four-bladed HATCTs. Similarly, increasing the TSR to 7, the mentioned drag and its consequences become more and more, and thus the obtained torque reduces considerably for all types of HATCTs.
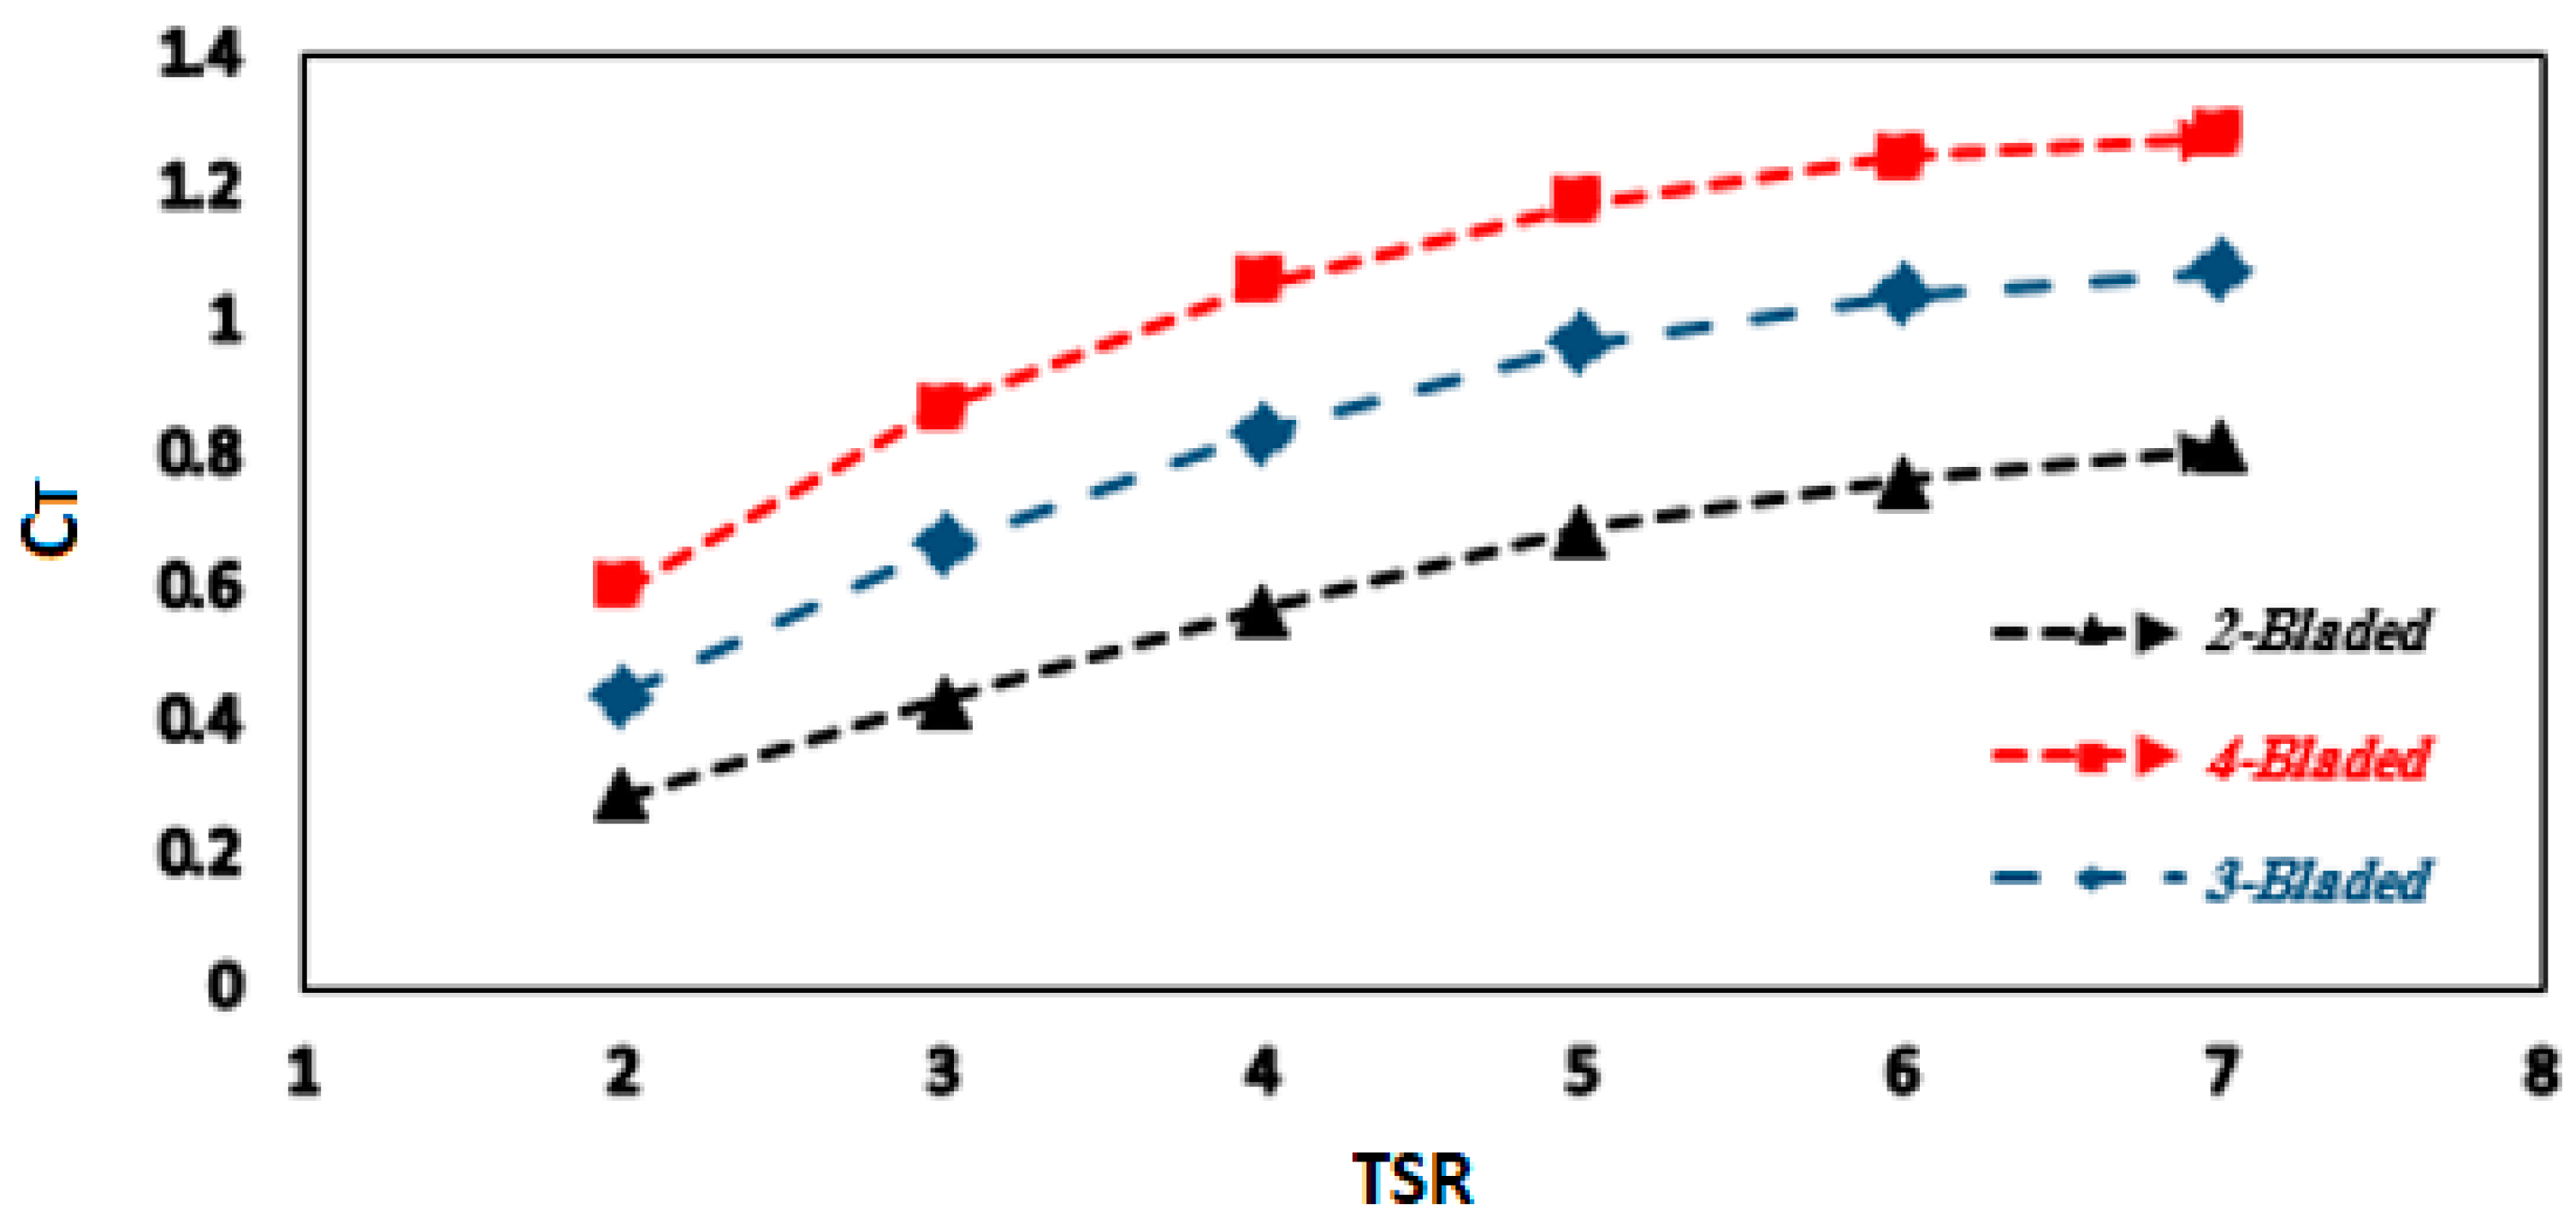
Figure 24 shows the CT obtained at the different values of TSR for all types of HATCTs. As is clear, the value of CT increases proportionally to the blade numbers and TSR. This trend is in good agreement with the trends reported in [18,35,54,56,57].
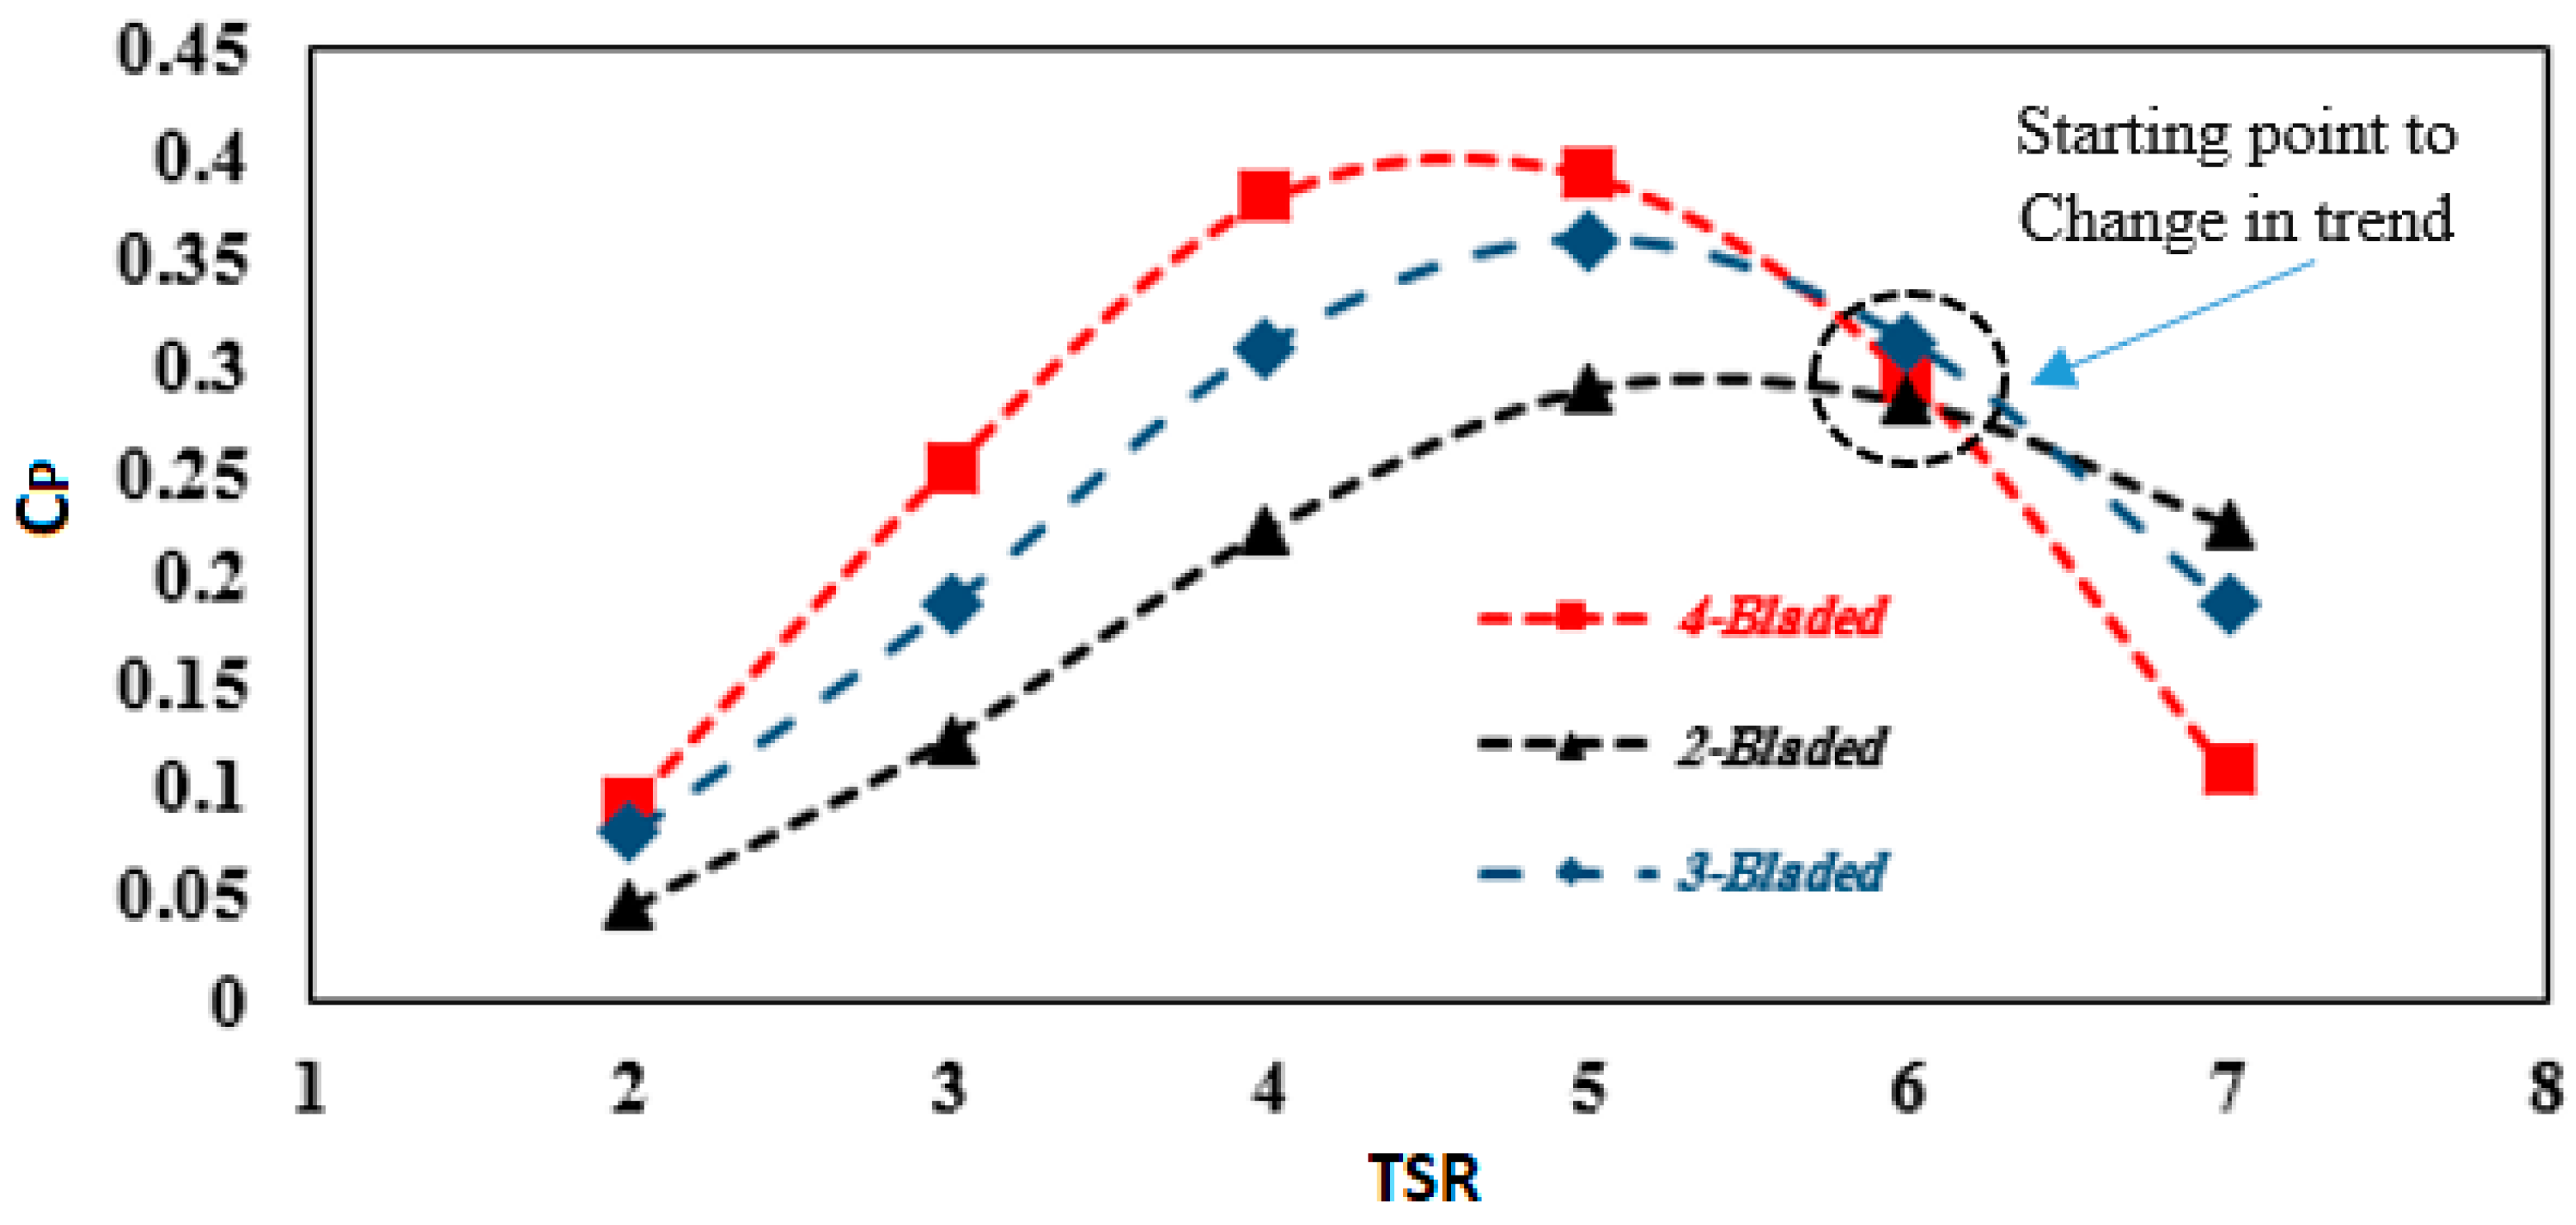
Figure 25 shows the achieved CP against different values of TSR for all types of HATCTs. The maximum CP for all types of HATCTs was obtained at TSR 5. It is evident that in the lower TSRs, the value of CP, for four-bladed HATCT, is more than those of the other types of HATCTs as the solidity increases. Moreover, considering the fact that angular velocity and torque influence CP, the maximum CP is obtained for the four-bladed HATCT at TSR 5, while the maximum torque for this HATCT (Figure 22) was achieved at TSR 4. This difference might arise from the increase in angular velocity at TSR 5. The same trend can be observed for the three-bladed HATCT for both cases of torque and CP. However, for the two-bladed turbine, the maximum value of torque and Cp occurs at TSR 5. Comparing all HATCTs, it is realized that, although the four-bladed turbine has more Cp than the two- and three-bladed turbines at TSR 5, the trend becomes reversed at TSR 6, such that the two- and three-bladed turbine overtake the four-bladed turbine. At TSR 6, the maximum Cp belongs to the two-bladed turbine due to its solidity and also the lower value of lift produced by three- and four-bladed HATCTs. This change in trend, in the case of wind turbines, was also reported in [58]. The reason for this opposite behavior is that a steeper change in streamlines for the four-bladed turbine (comparing to the two- and three-bladed turbines) leads to creating less lift and consequently less LDR at similar TSRs. So, in the large TSR region where the effects of lift components diminish, therefore, the torque for the rotors with higher solidity decreases rapidly.
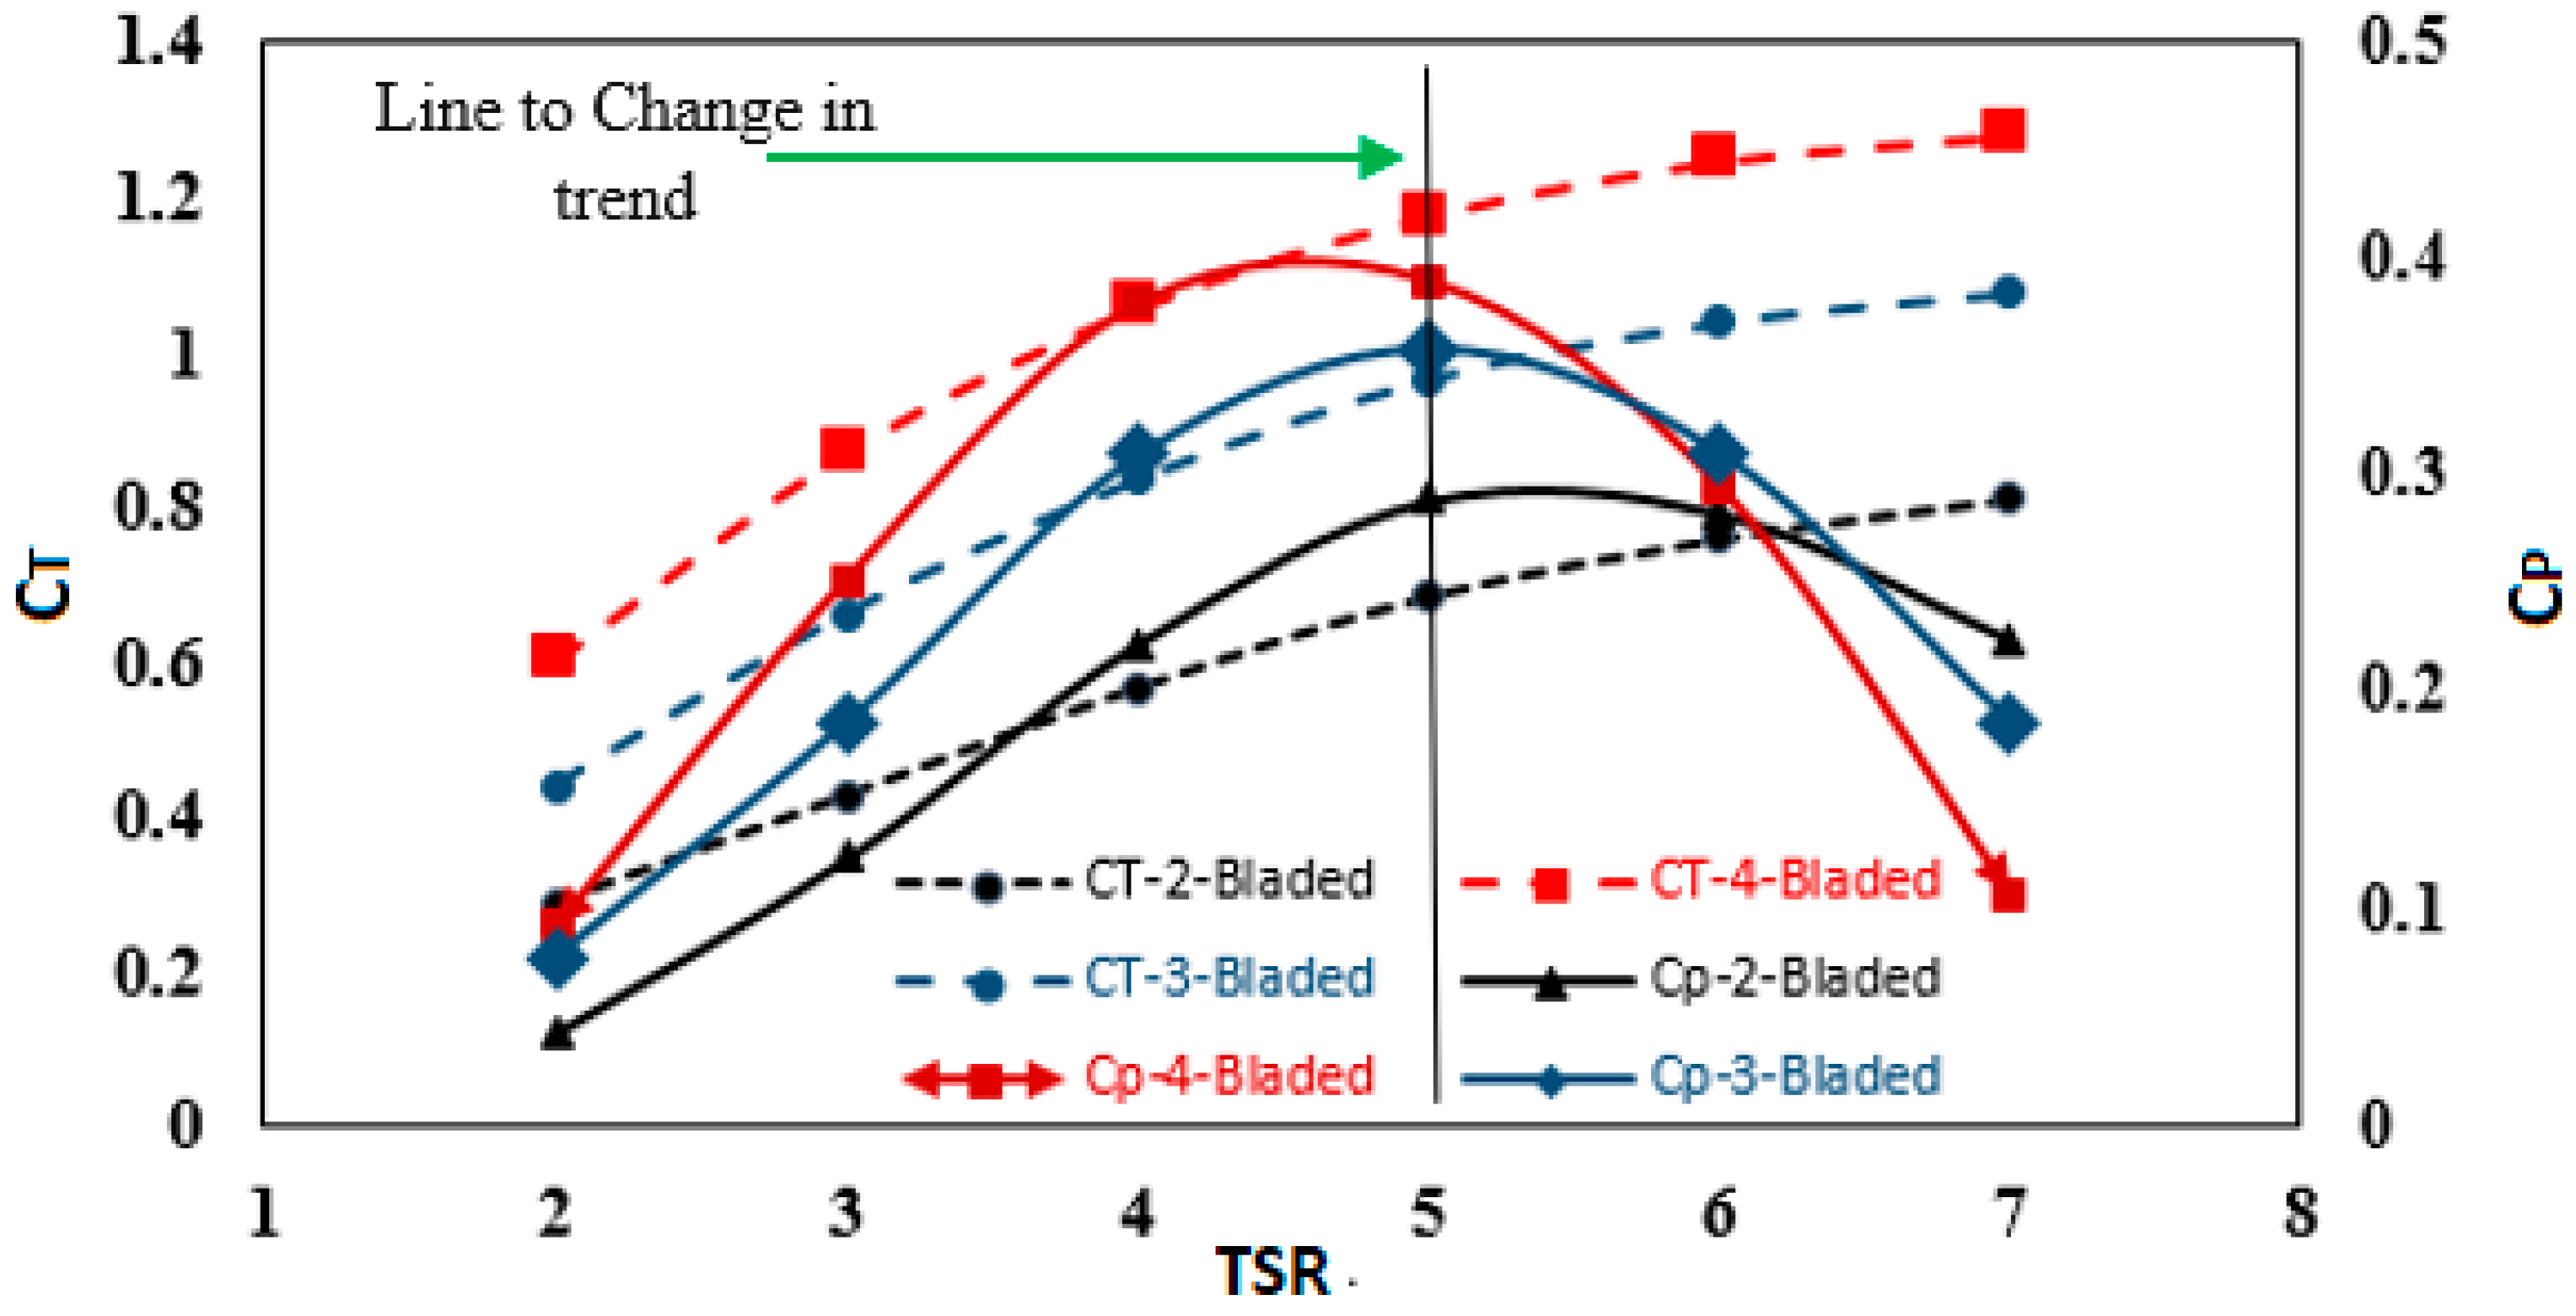
Figure 26 shows the variation of CT and CP versus TSR. It is clear that TSR 5 is a point for changing the trend for both CT and CP. From TSR 2 to TSR 5, an increase in CT leads to enhanced torque; however, after that, generating a higher amount of TKE and also less lift production are the significant parameters related to the declining performance of the turbine. Moreover, through the simultaneous checking of CT and CP, it is given that to achieve optimum conditions for four-bladed HATCTs, more thrust is required.
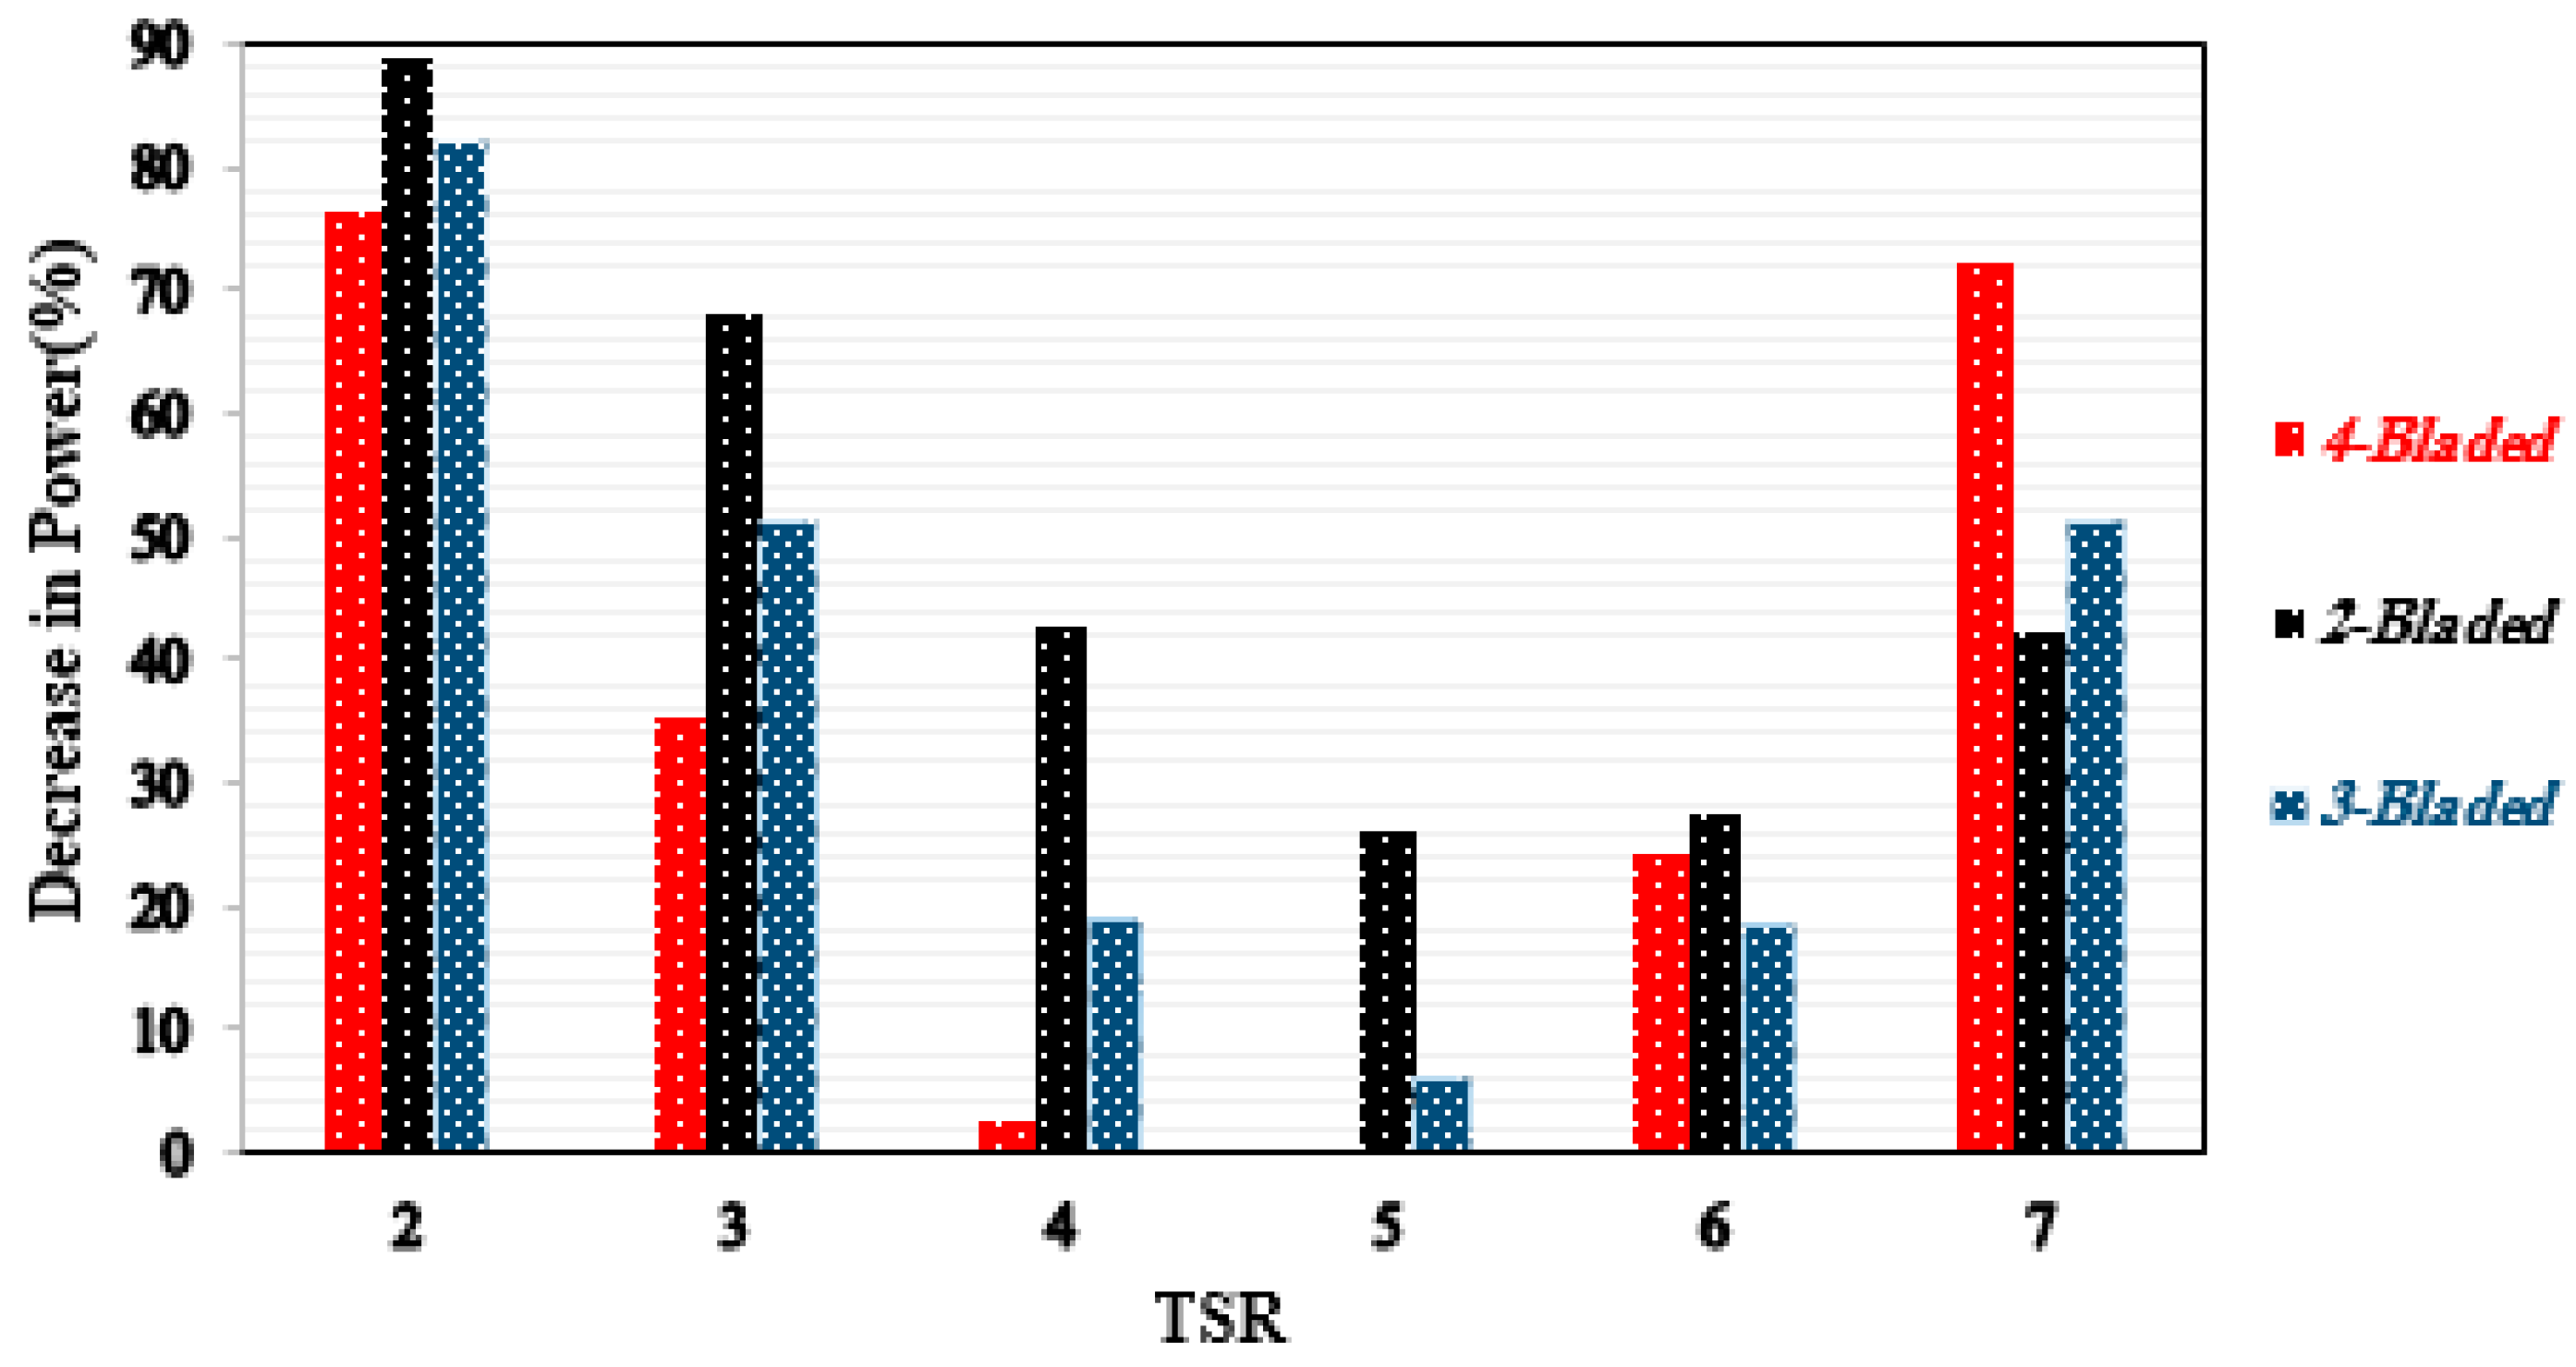
Figure 27 shows the percentage change in the power output compared to the maximum available power output (four-bladed turbine at TSR 5) for all HATCTs as the TSR moved away from the optimum condition (TSR 5). It can be realized that for all types of HATCT, the maximum and minimum decrease in power occur at TSR 2 and TSR 5, respectively. The results indicate that the use of TSRs higher than 5 can effectively reduce the turbine performance while still allowing significant power extraction compared to the TSRs lower than 5.

4.5. Performance Comparison with Some Existing Literature

Table 4 tabulates some of the reported results on the other type of HATCTs existing in the literature based on the maximum obtained CP. It can be observed clearly that increasing the blade number does not necessarily lead to an increase in the power coefficient. For instance, Hee Jo et al. [16] and Morandi et al. [61] both experimentally determined the CPmax for the HATCTs. While the former used a three-bladed HATCT, the latter designed a six-bladed one. However, the value of CPmax achieved by Hee Jo et al. [16] was higher than that of Morandi et al. [61]. More interestingly, the flow velocity applied by Morandi et al. [61] was around 2.76 times greater than that applied by Hee Jo et al. [16]. The same trend can be observed when, for example, the result of the present study and that of Tian et al. [54] in the case of two-bladed and three-bladed HATCTs are compared. It seems that the turbine diameter and also adjusted TSR have more significance on the CPmax in comparison with flow velocity and blade number. This can also be revealed, for example, if the results of Tian et al. [54] and Kolekar et al. [60] are compared. This argument is in good agreement with the results extracted from the present study.

5. Conclusions

In order to analyze the performance of the small-scale HATCTs, three different configurations, two-, three-, and four-bladed single turbines designed based on S-814 airfoil, were compared using the numerical method. The method employed here was based on CFD analysis and the numerical results for the three-bladed HATCT were validated with the previously reported experiments. The mentioned numerical results were found to be in good agreement with the experimental results. The effects that the flow phenomenon, i.e., pressure, velocity, streamline and rotor streamline distributions around all HATCTs, has on the performance were investigated by analyzing the flow around the blades and the following results were obtained.
As TSR increases, the thrust coefficient enhances continually, while if the power achieved by a HATCT is considered, the optimal TSR is around 5. In fact, at a greater amount of TSR, a reversed trend can be observed for all types of HATCTs due to TKE increases on both suction and pressure sides. In addition, at less than TSR 5, the power coefficient reduced because the blade is located with a greater attack angle than that of the maximum LDR and as the attack angle goes up, a stall happens and torque is decreased.
The computations also indicated that, at TSRs over optimal, a HATCT with a higher blade number has a steeper drop in power coefficient due to the increase in blockage ratio. So, to enhance the torque and power obtained, higher blade number and lower blade number HATCTs are recommended at less than the optimal value and greater than the optimal value of TSR, respectively. It is worth mentioning that increasing the blade numbers may incur additional capital costs in commercial deployments and thus a business plan needs to be designed to make an appropriate decision.
This study focused on the performance of small-scale HATCTs where a single turbine is utilized. Investigation of the concept of employing vertical arrays of small-scale HATCTs substituted for a single large HATCT can further be implemented in future works.

Author Contributions

Conceptualization, R.A. (Ramin Alipour) and R.A. (Roozbeh Alipour); methodology, R.A. (Ramin Alipour) and R.A. (Roozbeh Alipour); software, R.A. (Ramin Alipour) and R.A. (Roozbeh Alipour); validation, R.A. (Roozbeh Alipour), S.S.R.K., M.P. and S.A.G.; formal analysis, R.A. (Ramin Alipour); investigation, R.A. (Ramin Alipour), R.A. (Roozbeh Alipour), S.S.R.K., M.P. and S.A.G.; resources, M.P., and S.S.R.K.; data curation, R.A. (Ramin Alipour); writing—original draft preparation, R.A. (Roozbeh Alipour) and R.A. (Ramin Alipour); writing—review and editing, R.A. (Ramin Alipour), R.A. (Roozbeh Alipour), S.S.R.K. and M.P.; visualization, R.A. (Ramin Alipour); supervision, R.A. (Roozbeh Alipour), S.S.R.K., and M.P.; project administration, R.A. (Roozbeh Alipour), S.S.R.K., and M.P., and S.A.G.; funding acquisition, S.S.R.K. and M.P. All authors have read and agreed to the published version of the manuscript.

Funding

The research was supported by the Ministry of Education, Youth, and Sports of the Czech Republic and the European Union (European Structural and Investment Funds Operational Program Research, Development, and Education) in the framework of the project “Modular platform for autonomous chassis of specialized electric vehicles for freight and equipment transportation”, Reg. No. CZ.02.1.01/0.0/0.0/16_025/0007293, as well as the financial support from internal grants in the Institute for Nanomaterials, Advanced Technologies and Innovations (CXI), Technical University of Liberec (TUL).

Conflicts of Interest

The authors declare no conflicts of interest.

Nomenclature

VFree stream velocity(m/s)
ARotor Area(m2)
RRotor radius(m)
ρDensity(kg/m3)
ωAngular velocity(rpm)
tTorque(N.m)
TThrust(N)
CtCoefficient of torque
CTCoefficient of thrust
CPPower coefficient
TKETurbulence Kinetic Energy
TSRTip speed ratio
LDRLift to Drag ratio

References

  1. Zhang, X.; Yang, C.; Li, S. Influence of Low-Level Jet intensity on aerodynamic loads of horizontal axis wind turbine rotor. Eng. Appl. Comput. Fluid Mech. 2019, 13, 300–308. [Google Scholar] [CrossRef] [Green Version]
  2. Yang, P.; Xiang, J.; Fang, F.; Pain, C. A fidelity fluid-structure interaction model for vertical axis tidal turbines in turbulence flows. Appl. Energy 2019, 236, 465–477. [Google Scholar] [CrossRef]
  3. Nabipour, N.; Mosavi, A.; Hajnal, E.; Nadai, L.; Shamshirband, S.; Chau, K.-W. Modeling climate change impact on wind power resources using adaptive neuro-fuzzy inference system. Eng. Appl. Comput. Fluid Mech. 2020, 14, 491–506. [Google Scholar] [CrossRef] [Green Version]
  4. Lee, J.H.; Park, S.; Kim, D.H.; Rhee, S.H.; Kim, M.-C. Computational methods for performance analysis of horizontal axis tidal stream turbines. Appl. Energy 2012, 98, 512–523. [Google Scholar] [CrossRef]
  5. Chen, W.-H.; Chen, C.-Y.; Huang, C.-Y.; Hwang, C.-J. Power output analysis and optimization of two straight-bladed vertical-axis wind turbines. Appl. Energy 2017, 185, 223–232. [Google Scholar] [CrossRef]
  6. Alipour, R.; Najarian, F. A FEM study of explosive welding of double layer tubes. World Acad. Sci. Eng. Technol. 2011, 73, 954–956. [Google Scholar]
  7. Draycott, S.; Nambiar, A.; Sellar, B.; Davey, T.; Venugopal, V. Assessing extreme loads on a tidal turbine using focused wave groups in energetic currents. Renew. Energy 2019, 135, 1013–1024. [Google Scholar] [CrossRef] [Green Version]
  8. Alipour, R.; Nejad, A.F. Creep behaviour characterisation of a ferritic steel alloy based on the modified theta-projection data at an elevated temperature. Int. J. Mater. Res. 2016, 107, 406–412. [Google Scholar] [CrossRef]
  9. Draycott, S.; Payne, G.; Steynor, J.; Nambiar, A.; Sellar, B.; Venugopal, V. An experimental investigation into non-linear wave loading on horizontal axis tidal turbines. J. Fluids Struct. 2019, 84, 199–217. [Google Scholar] [CrossRef]
  10. Estate, C. UK Wave and Tidal Key Resource Areas Project—Summary Report; Crown Estate: London, UK, 2012. [Google Scholar]
  11. Meana-Fernández, A.; Fernández Oro, J.M.; Argüelles Díaz, K.M.; Galdo-Vega, M.; Velarde-Suárez, S. Application of Richardson extrapolation method to the CFD simulation of vertical-axis wind turbines and analysis of the flow field. Eng. Appl. Comput. Fluid Mech. 2019, 13, 359–376. [Google Scholar] [CrossRef] [Green Version]
  12. Yan, J.; Deng, X.; Korobenko, A.; Bazilevs, Y. Free-surface flow modeling and simulation of horizontal-axis tidal-stream turbines. Comput. Fluids 2017, 158, 157–166. [Google Scholar] [CrossRef]
  13. Goundar, J.N.; Ahmed, M.R. Design of a horizontal axis tidal current turbine. Appl. Energy 2013, 111, 161–174. [Google Scholar] [CrossRef]
  14. Jo, C.-H.; Lee, J.-H.; Rho, Y.-H.; Lee, K.-H. Performance analysis of a HAT tidal current turbine and wake flow characteristics. Renew. Energy 2014, 65, 175–182. [Google Scholar] [CrossRef]
  15. Uihlein, A.; Magagna, D. Wave and tidal current energy–A review of the current state of research beyond technology. Renew. Sustain. Energy Rev. 2016, 58, 1070–1081. [Google Scholar] [CrossRef]
  16. Hee Jo, C.; Young Yim, J.; Hee Lee, K.; Ho Rho, Y. Performance of horizontal axis tidal current turbine by blade configuration. Renew. Energy 2012, 42, 195–206. [Google Scholar] [CrossRef]
  17. Ghefiri, K.; Garrido, I.; Bouallègue, S.; Haggège, J.; Garrido, A.J. Hybrid Neural Fuzzy Design-Based Rotational Speed Control of a Tidal Stream Generator Plant. Sustainability 2018, 10, 3746. [Google Scholar] [CrossRef] [Green Version]
  18. de Jesus Henriques, T.; Tedds, S.; Botsari, A.; Najafian, G.; Hedges, T.; Sutcliffe, C.; Owen, I.; Poole, R. The effects of wave–current interaction on the performance of a model horizontal axis tidal turbine. Int. J. Mar. Energy 2014, 8, 17–35. [Google Scholar] [CrossRef]
  19. Gaurier, B.; Davies, P.; Deuff, A.; Germain, G. Flume tank characterization of marine current turbine blade behaviour under current and wave loading. Renew. Energy 2013, 59, 1–12. [Google Scholar] [CrossRef] [Green Version]
  20. Lust, E.E.; Luznik, L.; Flack, K.A.; Walker, J.M.; Van Benthem, M.C. The influence of surface gravity waves on marine current turbine performance. Int. J. Mar. Energy 2013, 3, 27–40. [Google Scholar] [CrossRef]
  21. Luznik, L.; Flack, K.A.; Lust, E.E.; Taylor, K. The effect of surface waves on the performance characteristics of a model tidal turbine. Renew. Energy 2013, 58, 108–114. [Google Scholar] [CrossRef]
  22. Galloway, P.W.; Myers, L.E.; Bahaj, A.S. Quantifying wave and yaw effects on a scale tidal stream turbine. Renew. Energy 2014, 63, 297–307. [Google Scholar] [CrossRef]
  23. Guo, X.; Yang, J.; Gao, Z.; Moan, T.; Lu, H. The surface wave effects on the performance and the loading of a tidal turbine. Ocean Eng. 2018, 156, 120–134. [Google Scholar] [CrossRef]
  24. Alipour, R.; Izman, S.; Tamin, M.N. Estimation of charge mass for high speed forming of circular plates using energy method. Adv. Mater. Res. 2014, 845, 803–808. [Google Scholar] [CrossRef]
  25. Barltrop, N.; Varyani, K.; Grant, A.; Clelland, D.; Pham, X. Wave-current interactions in marine current turbines. Proc. Inst. Mech. Eng. Part M J. Eng. Marit. Environ. 2006, 220, 195–203. [Google Scholar] [CrossRef] [Green Version]
  26. Li, X.; Li, M.; Jordan, L.-B.; McLelland, S.; Parsons, D.R.; Amoudry, L.O.; Song, O.; Comerford, L. Modelling impacts of tidal stream turbines on surface waves. Renew. Energy 2019, 130, 725–734. [Google Scholar] [CrossRef]
  27. Yang, P.; Xiang, J.; Fang, F.; Pavlidis, D.; Pain, C. Modelling of fluid-structure interaction for moderate reynolds number flows using an immersed-body method. Comput. Fluids 2019, 179, 613–631. [Google Scholar] [CrossRef]
  28. Yang, P.; Xiang, J.; Fang, F.; Pavlidis, D.; Latham, J.-P.; Pain, C.C. Modelling of fluid–structure interaction with multiphase viscous flows using an immersed-body method. J. Comput. Phys. 2016, 321, 571–592. [Google Scholar] [CrossRef]
  29. Young, Y.L.; Motley, M.R.; Yeung, R.W. Three-dimensional numerical modeling of the transient fluid-structural interaction response of tidal turbines. J. Offshore Mech. Arct. Eng. 2010, 132, 011101. [Google Scholar] [CrossRef]
  30. Nicholls-Lee, R.; Turnock, S.; Boyd, S. A Method for Analysing Fluid Structure Interactions on a Horizontal Axis Tidal Turbine. In Proceedings of the 9th European Wave and Tidal Energy Conference (EWTEC 2011), Southampton, UK, 3–8 September 2011; Volume 8, p. 2011. [Google Scholar]
  31. Jo, C.-H.; Kim, D.-Y.; Rho, Y.-H.; Lee, K.-H.; Johnstone, C. FSI analysis of deformation along offshore pile structure for tidal current power. Renew. Energy 2013, 54, 248–252. [Google Scholar] [CrossRef] [Green Version]
  32. Khalid, S.-S.; Zhang, L.; Zhang, X.-W.; Sun, K. Three-dimensional numerical simulation of a vertical axis tidal turbine using the two-way fluid structure interaction approach. J. Zhejiang Univ. Sci. A 2013, 14, 574–582. [Google Scholar] [CrossRef]
  33. Tatum, S.; Frost, C.; Allmark, M.; O’doherty, D.; Mason-Jones, A.; Prickett, P.; Grosvenor, R.; Byrne, C.; O’Doherty, T. Wave–current interaction effects on tidal stream turbine performance and loading characteristics. Int. J. Mar. Energy 2016, 14, 161–179. [Google Scholar] [CrossRef] [Green Version]
  34. Badshah, M.; Badshah, S.; Jan, S. Comparison of computational fluid dynamics and fluid structure interaction models for the performance prediction of tidal current turbines. J. Ocean Eng. Sci. 2019, 5, 167–172. [Google Scholar] [CrossRef]
  35. de Jesus Henriques, T.A.; Hedges, T.S.; Owen, I.; Poole, R.J. The influence of blade pitch angle on the performance of a model horizontal axis tidal stream turbine operating under wave–current interaction. Energy 2016, 102, 166–175. [Google Scholar] [CrossRef] [Green Version]
  36. Huang, B.; Zhu, G.; Kanemoto, T. Design and performance enhancement of a bi-directional counter-rotating type horizontal axis tidal turbine. Ocean Eng. 2016, 128, 116–123. [Google Scholar] [CrossRef]
  37. Münch-Alligné, C.; Schmid, J.; Richard, S.; Gaspoz, A.; Brunner, N.; Hasmatuchi, V. Experimental assessment of a new kinetic turbine performance for artificial channels. Water 2018, 10, 311. [Google Scholar] [CrossRef] [Green Version]
  38. Goundar, J.N.; Ahmed, M.R.; Lee, Y.-H. Design and Optimization of a Ducted Marine Current Savonius Turbine for Gun-Barrel Passage, Fiji. J. Offshore Mech. Arct. Eng. 2019, 141, 2. [Google Scholar] [CrossRef]
  39. Rahimian, M.; Walker, J.; Penesis, I. Performance of a horizontal axis marine current turbine—A comprehensive evaluation using experimental, numerical, and theoretical approaches. Energy 2018, 148, 965–976. [Google Scholar] [CrossRef]
  40. Tarver, B.T.; Chan, J.C.; Jo, C.H. A new concept in tidal turbines. Int. J. Energy Res. 2016, 40, 579–586. [Google Scholar] [CrossRef]
  41. Manwell, J.F.; McGowan, J.G.; Rogers, A.L. Wind Energy Explained: Theory, Design and Application; John Wiley & Sons: Hoboken, NJ, USA, 2010. [Google Scholar]
  42. Savidge, G.; Ainsworth, D.; Bearhop, S.; Christen, N.; Elsaesser, B.; Fortune, F.; Inger, R.; Kennedy, R.; McRobert, A.; Plummer, K.E. Strangford Lough and the SeaGen tidal turbine. In Marine Renewable Energy Technology and Environmental Interactions; Springer: Berlin, Germany, 2014; pp. 153–172. [Google Scholar]
  43. Jing, F.-M.; Ma, W.-J.; Zhang, L.; Wang, S.-Q.; Wang, X.-H. Experimental study of hydrodynamic performance of full-scale horizontal axis tidal current turbine. J. Hydrodyn. Ser. B 2017, 29, 109–117. [Google Scholar] [CrossRef]
  44. MY, N.; Denni, K.; Najarian, F.; Alipour, R.; Nejad, A.F. Solenoid characterization on tool entrance in horizontal twist drilling process. In Proceedings of the 2nd International Materials, Industrial, and Manufacturing Engineering Conference, MIMEC2015, Bali, Indonesia, 4–6 February 2015. [Google Scholar]
  45. Abuan, B.E.; Howell, R.J. The performance and hydrodynamics in unsteady flow of a horizontal axis tidal turbine. Renew. Energy 2019, 133, 1338–1351. [Google Scholar] [CrossRef]
  46. Marsh, P.; Ranmuthugala, D.; Penesis, I.; Thomas, G. Three-dimensional numerical simulations of straight-bladed vertical axis tidal turbines investigating power output, torque ripple and mounting forces. Renew. Energy 2015, 83, 67–77. [Google Scholar] [CrossRef] [Green Version]
  47. Menter, F.R. Two-equation eddy-viscosity turbulence models for engineering applications. AIAA J. 1994, 32, 1598–1605. [Google Scholar] [CrossRef] [Green Version]
  48. Zhang, H.; Wu, Y.; Li, L. Evaluation of RANS turbulence models in simulating the corner separation of a high-speed compressor cascade. Eng. Appl. Comput. Fluid Mech. 2015, 9, 477–489. [Google Scholar]
  49. Ordonez-Sanchez, S.; Allmark, M.; Porter, K.; Ellis, R.; Lloyd, C.; Santic, I.; O’Doherty, T.; Johnstone, C. Analysis of a horizontal-axis tidal turbine performance in the presence of regular and irregular waves using two control strategies. Energies 2019, 12, 367. [Google Scholar] [CrossRef] [Green Version]
  50. Allmark, M.; Ordonez-Sanchez, S.; Wang, S.; Kang, Y.S.; Jo, C.-H.; O’Doherty, T.; Johnstone, C. An investigation into Reynolds scaling and solidity for a HATT tidal turbine. In Proceedings of the 13th European Wave and Tidal Energy Conference, Napoli, Italy, 1–6 September 2019. [Google Scholar]
  51. Singh, P.M.; Choi, Y.-D. Shape design and numerical analysis on a 1 MW tidal current turbine for the south-western coast of Korea. Renew. Energy 2014, 68, 485–493. [Google Scholar] [CrossRef]
  52. Chen, C.; Choi, Y.; Yoon, H. Blade design and performance analysis on the horizontal axis tidal current turbine for low water level channel. In Proceedings of the IOP Conference Series: Materials Science and Engineering, Beijing, China, 19–22 September 2013; Volume 52, p. 052020. [Google Scholar]
  53. Kim, S.-J.; Singh, P.M.; Hyun, B.-S.; Lee, Y.-H.; Choi, Y.-D. A study on the floating bridge type horizontal axis tidal current turbine fr energy independent islands in Korea. Renew. Energy 2017, 112, 35–43. [Google Scholar] [CrossRef]
  54. Tian, W.; Song, B.; VanZwieten, J.H.; Pyakurel, P.; Li, Y. Numerical simulations of a horizontal axis water turbine designed for underwater mooring platforms. Int. J. Nav. Archit. Ocean Eng. 2016, 8, 73–82. [Google Scholar] [CrossRef] [Green Version]
  55. Alipour, R. Finite element analysis of elongation in free explosive forming of aluminum alloy blanks using CEL method. Int. Rev. Mech. Eng. 2011, 5, 1039–1042. [Google Scholar]
  56. Mycek, P.; Gaurier, B.; Germain, G.; Pinon, G.; Rivoalen, E. Experimental study of the turbulence intensity effects on marine current turbines behaviour. Part I: One single turbine. Renew. Energy 2014, 66, 729–746. [Google Scholar] [CrossRef] [Green Version]
  57. Mycek, P.; Gaurier, B.; Germain, G.; Pinon, G.; Rivoalen, E. Experimental study of the turbulence intensity effects on marine current turbines behaviour. Part II: Two interacting turbines. Renew. Energy 2014, 68, 876–892. [Google Scholar] [CrossRef] [Green Version]
  58. Lee, S.; Kim, H.; Lee, S. Analysis of aerodynamic characteristics on a counter-rotating wind turbine. Curr. Appl. Phys. 2010, 10, S339–S342. [Google Scholar] [CrossRef]
  59. Tian, W.; Mao, Z.; Ding, H. Design, test and numerical simulation of a low-speed horizontal axis hydrokinetic turbine. Int. J. Nav. Archit. Ocean Eng. 2018, 10, 782–793. [Google Scholar] [CrossRef]
  60. Kolekar, N.; Hu, Z.; Banerjee, A.; Du, X. Hydrodynamic design and optimization of hydro-kinetic turbines using a robust design method. In Proceedings of the 1st Marine Energy Technology Symposium METS13, Washington, DC, USA, 10–11 April 2013. [Google Scholar]
  61. Morandi, B.; Di Felice, F.; Costanzo, M.; Romano, G.; Dhomé, D.; Allo, J. Experimental investigation of the near wake of a horizontal axis tidal current turbine. Int. J. Mar. Energy 2016, 14, 229–247. [Google Scholar] [CrossRef]
Figure 1. S-814 airfoil geometry.
Sustainability 12 05985 g001
Figure 2. View of the positioning of the airfoils beside each other.
Sustainability 12 05985 g002
Figure 3. Solid 3D models of horizontal axis tidal current turbines (HATCTs).
Sustainability 12 05985 g003
Figure 4. Computational domain for simulation.
Sustainability 12 05985 g004
Figure 5. Meshing system of the computational domain.
Sustainability 12 05985 g005
Figure 6. Pressure distributions contours (pressure side) in the 3-bladed turbines at tip speed ratio (TSR) = 5.
Sustainability 12 05985 g006
Figure 7. Pressure distribution contour; TSR = 2.
Sustainability 12 05985 g007
Figure 8. Pressure distribution contour; TSR = 3.
Sustainability 12 05985 g008
Figure 9. Pressure distribution contour; TSR = 4.
Sustainability 12 05985 g009
Figure 10. Pressure distribution contour; TSR = 5.
Sustainability 12 05985 g010
Figure 11. Pressure distribution contour; TSR = 6.
Sustainability 12 05985 g011
Figure 12. Pressure distribution contour; TSR = 7.
Sustainability 12 05985 g012
Figure 13. TKE contours; TSR = 3.
Sustainability 12 05985 g013
Figure 14. TKE contours; TSR = 5.
Sustainability 12 05985 g014
Figure 15. TKE contours; TSR = 7.
Sustainability 12 05985 g015
Figure 16. Velocity distribution along the vertical axis at the pressure side of HATCTs.
Sustainability 12 05985 g016
Figure 17. Cut-in-speed percentage along the vertical axis at the pressure side of HATCTs.
Sustainability 12 05985 g017
Figure 18. Streamline contours based on the blade numbers at different TSRs. (a) TSR = 2; (b) TSR = 4; (c) TSR = 6.
Sustainability 12 05985 g018
Figure 19. Distribution of velocity and streamline contours on the suction side of the blade surface based on the blade numbers at different TSRs.
Sustainability 12 05985 g019
Figure 20. Distribution of velocity and Streamline contours on the pressure side of the blade surface based on the blade numbers at different TSRs.
Sustainability 12 05985 g020
Figure 21. Rotor streamline distributions at TSR = 5.
Sustainability 12 05985 g021
Figure 22. Torque versus TSR variations for different HATCTs.
Sustainability 12 05985 g022
Figure 23. Torque versus angular velocity variations for different HATCTs.
Sustainability 12 05985 g023
Figure 24. CT versus TSR for different HATCTs.
Sustainability 12 05985 g024
Figure 25. CP versus TSR for different HATCTs.
Sustainability 12 05985 g025
Figure 26. Trends of CT and CP versus TSR for different HATCTs.
Sustainability 12 05985 g026
Figure 27. The difference in the power at different TSRs for all types of HATCTs.
Sustainability 12 05985 g027
Table 1. Result of convergence study for 3-Bladed turbine.
Element NumberCp
10439150.32
15813310.34
20557270.36
26721350.36
Table 2. Number of meshes and grids for different models used in the present study.
ModelNumber of MeshesNumber of Grids
2-bladed turbine1861361367503
3-bladed turbine2055727367503
4-bladed turbine2867242612926
Table 3. Quantitative comparison of computational flow dynamics (CFD) and experimental Cp.
Type of ModelFlume Width (m)Water Height (m)Velocity (m/s)ND (m)Ω (rpm)CpError (%)
Experimental [16]10.8130.51910.4-
CFD Model [16]10.8130.51910.5127
CFD Model (present study)10.8130.51910.3610
Experimental [43]73.5120.7136.410.3-
CFD Model (present study)73.5120.7136.410.26810.6
Table 4. Some reported studies on the other types of turbines.
ResearchBlade NumberDiameter (m)TSRVelocity (m/s)CPmaxType of Study
Jing et al. [43]22.004.002.000.39Experimental
present study20.505.001.000.29Simulation
Jing et al. [43]20.705.001.500.33Experimental
Yan et al. [12]30.80---1.500.41Simulation
present study30.505.001.000.36Simulation
Hee jo et al. [16]30.505.001.000.40Experimental
Tian et al. [54]30.805.001.730.32Simulation
Tian et al. [59]31.205.000.500.41Simulation
Kolekar et al. [60]32.006.362.000.52Experimental
present study40.505.001.000.39Simulation
Morandi et al. [61]60.402.252.760.39Experimental