Article

An Analysis of the Socio-Economic and Human Life Impact of Implementing the eCall In Vehicle System (IVS) in the Purpose of Ensuring Sustainable, Improved Rescue Operations on European Roads

by
Daniela Zirra
1,*,
Alexandra Perju-Mitran
2,
George Căruţaşu
3,4,
Alexandru Pîrjan
3,* and
Eugen Gabriel Garais
3
1
Department of Commerce, Economic Integration and Business Administration, Romanian-American University, 1B Expoziției Blvd., 1st District, 012101 Bucharest, Romania
2
Department of Management-Marketing, Romanian-American University, 1B Expoziției Blvd., 1st District, 012101 Bucharest, Romania
3
Department of Informatics, Statistics and Mathematics, Romanian-American University, 1B Expoziției Blvd., 1st District, 012101 Bucharest, Romania
4
Doctoral School, University Politehnica of Timișoara, Piața Victoriei 2, 300006 Timișoara, Romania
*
Authors to whom correspondence should be addressed.
Sustainability 2020, 12(13), 5341; https://doi.org/10.3390/su12135341
Submission received: 4 June 2020 / Revised: 26 June 2020 / Accepted: 30 June 2020 / Published: 1 July 2020
(This article belongs to the Section Economic and Business Aspects of Sustainability)

Abstract

:
Ensuring a higher degree of road safety contributes both to the quality of transport services and to the level of the costs involved in rescue operations. The initiation points of managing a rescue operation are situational awareness on accident detection and the appropriate assessment of the required resources. The eCall in Vehicle System (eCall IVS) for passenger vehicles aims to minimize rescue team arrival times to accident sites, and meet assignment needs in the rescue chain. Implementation costs and benefits for the eCall IVS have been investigated, providing implications for rescue operations management. The findings show that the benefits of eCall IVS implementation outweigh the costs, and savings achieved in the rescue operations are obtained by shortening the time to reach the place of the accident and by efficient intervention through a more accurate allocation of the necessary resources, due to timely and relevant information.

1. Introduction

Road transport is the most important component of the EU Transport System, for both freight and passenger transport. For this reason, the quality of road transport services is an essential ingredient for performance. But what are the elements that contribute to increasing the quality level of road transport? The answer can be expressed in a few words, namely: transport infrastructure; the means of transport used; human resources involved in transport activities; road traffic safety (which depends directly on the first three elements, but is also influenced by other factors such as roadside assistance, communication technology, or other support services).
Current issues of optimization of financial and physical resources pertaining to rescue operations management, with the final goal of safer public and commercial transportation on European roads, call for solutions from systems and applications research, combined with other dynamic domains such as information management and consumer behavior, to provide support for applications like monitoring, analysis, and planning.
Traffic rescue operations management is comprised of coordination activities meant to decrease the negative impact, i.e., recovery of the traffic flow to its original conditions [1]. Successful rescue operations management activities stem from the development of clear procedures, which are understandable and achievable by all parties involved in the rescue process, and efficient communication among these parties. The most important parameter of a rescue operations management process is accident detection time, as any delays in detection result in lives lost, traffic congestion, secondary incidents and other material or non-material costs which aggravate the incident that caused them [2,3,4].
According to 2020 Eurostat data [5], road traffic is the main support for the mobility of economic goods and people, as long as more than 90% of people and over 75% of goods are transported in 2018 using the road infrastructure. Therefore, increasing the safety of road traffic in the European Union is a central concern of all stakeholders who are directly or indirectly involved in transportation activities or who participate in rescue operations in the event of accidents resulting in fatalities and severe injuries [6]. With the penetration of technological progress in the automotive industry, significant progress has been made regarding the provision of road vehicles with devices that increase the safety of traffic participants. One of the devices that can have a significant impact on reducing the number of fatalities and severe injuries is the eCall In Vehicle System (IVS).
The concept of eCall was launched in Europe in 1999, as part of the Galileo project (launching the Global Navigation Satellite System in the EU). In 2005, the harmonized implementation at Union level of eCall was included on the European Commission agenda. In 2010, the need for the development of an EU-wide interoperable eCall service emerged, because of the increased mobility of goods and people within the territory of the Member States [7]. In 2015, the legislative framework for the installation of the eCall IVS device was defined on board all new vehicles intended for circulation on EU roads, in category M1 (passenger vehicles) and N1 (light trucks), starting in March 2018. Currently, eCall IVS it is the only device that shows its usefulness after a serious road accident has occurred, having a strong impact both on increasing the quality of rescue operations and on improving their management throughout the EU.

2. The Context

2.1. Road Transports in Europe

In the current context of globalization, the intensity of world economic exchanges is at an extremely high level. For this reason, the movement of economic goods and people put the transportation systems under heavy test, both in terms of road transport, as well as in air or naval transport. At European level, traffic intensity, distance of the transport, and quantity of goods or number of passengers increased as more and more countries became Members of the European Union, or were included in the European Economic Area, and the barriers on free movement were lifted. In addition, if we consider the increasingly complex economic relations between European countries and the rest of the world, the complexity of transportation development widens.
Thus, the number of participants in the transport activities in Europe has reached no less than 1.2 million operators (be they public or private), and the labour force involved in the transport activity has risen to over 11 million people in EU countries, based on Directorate-General for Mobility and Transport (DG MOVE) statistics [8], reported on March 2019. Therefore, we emphasize that the transport sector is of vital importance, both to facilitate the unrestricted mobility of goods and people, and to create the conditions for the harmonious development of all European economies, so as to achieve economic and social cohesion.
We must also not forget that the quality, availability, and price level of the transport services depend essentially on the competitiveness of commerce, the performance of production activities and, last but not least, the possibility of creating the best business partnerships. If we look at the relationship between transport and the other fields of activity even more, besides the impact on the economy, we must also add the social and environmental impact, generated by the volume and quality of transport services. Consequently, sustainable economic development is decisively influenced by the way in which the transport field evolves.
Therefore, a major challenge for decision makers at EU level is the creation and consolidation of a Single European Transport Area, so that: all regions of Europe are connected thanks to a multimodal, modern, and safe transport system for all participants; to create an infrastructure that favors the increase of the efficiency of the transport activities, with a positive impact on the society and the whole economy; to create the premises for the transition to a mobility of economic goods and people with low gas emissions while having a favorable impact on the environment, under conditions of climate change that concern us all.
Regarding the importance and weight of the various transport systems used at European Union level, it is necessary to make some clarifications. According to statistics, the most important mode of transport is via road, both in the case of freight transport and passenger transport. The latest data available in 2020 from Eurostat [5] are for 2017 and show that passenger transport has been achieved predominantly on EU roads. Of the total of about 124.7 billion passengers, 91.5% travelled using the road infrastructure, 7.7% used the railway system, and 0.8% used air transport. If we only refer to road transport, the most used means of transport were passenger vehicles (82.9%, the indicator being measured in Passenger-kilometres), followed by motor coaches, buses, and trolley buses (9.4%).
Freight transportation is in a different situation, even if in this case road transport also has the highest weight. Thus, if we refer to all the types of transport used for the transport of goods in 2017 (except air transport), we observe that a 76.7% share in tonne-kilometres were achieved by road transport, 17.3% on railway, and 6% among inland waterways. In addition, if we compare with the situation in 2012, it turns out that the share of road transport increased by 2.8%, that of rail transport decreased by 6.5%, and inland waterways transport decreased by 11.8%.

2.2. The Importance of Road Safety in the European Union

According to the World Health Organization (2018) Global Status Report on Road Safety [9], in 2016 alone, there were 1.35 million deaths, resulting from road accidents, globally. Moreover, it is estimated that road accidents cause the most deaths of children and young people. In addition, taking into account the European Transport Safety Council (ETSC) data, published in April 2019 [10], the situation in the EU27+UK was relatively better than the global one, as in 2018 there were 25,386 deaths, and about 230,000 seriously injured people.
However, since experts of the European Commission estimate that the monetary value of the effects of road accidents on the participants in road traffic amounts to more than 250 Billion Euro, which accounts for almost 2% of EU27+UK GDP, we can say that the situation is unacceptable [11]. Yes, it is true that the amplitude of road transport shows that the mobility of goods and people in the EU27+UK is very high, but the human and social costs generated by road accidents are far higher.
Under these circumstances, it is understandable that efforts aimed at reducing the value of this indicator are increasingly broad. Regarding the situation in EU27+UK, we present some relevant developments regarding the evolution of the number of road deaths, based on the 13th Annual Road Safety Performance Index (PIN) Report of the European Transport Safety Council [10] and on the United Nations Economic Commission for Europe Statistics (UNECE) for 2019 [12], such as:
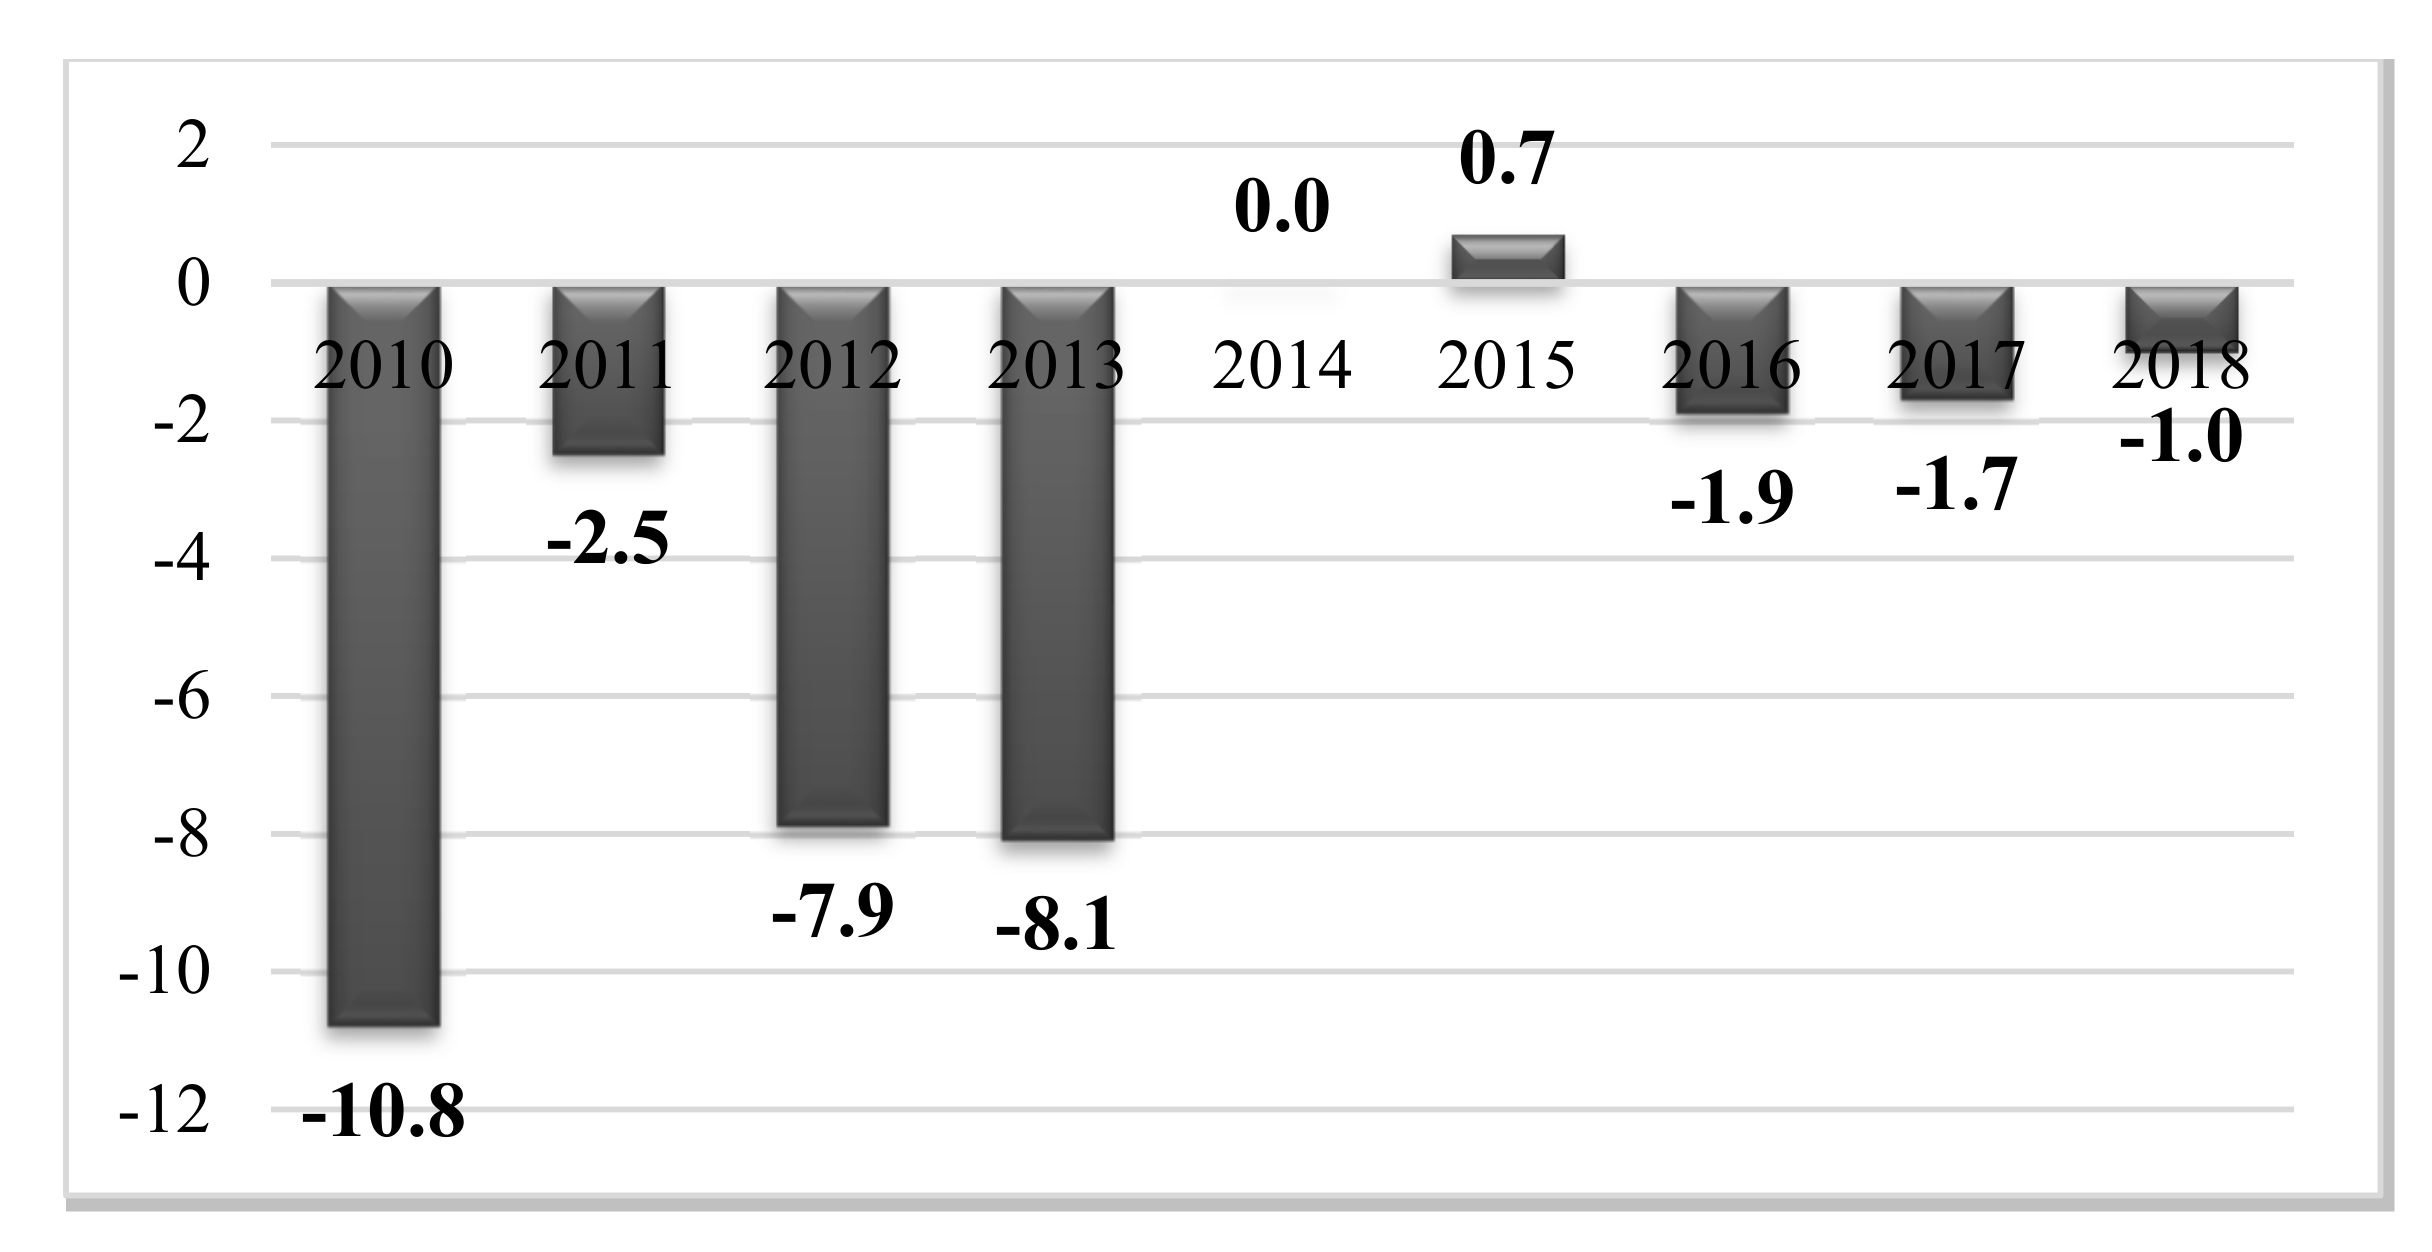
  • Between 2001 and 2010, the value of the indicator decreased continuously, a decrease of 42.6% in 2010 compared to 2001. The weakest progress was registered in 2002, compared to 2001, and the most favorable evolution was in 2009 and 2010, when the number of road deaths decreased by 10.7, respectively by 10.8%.
  • Between 2010 and 2018, the value of the indicator decreased continuously, except for 2014, when the number of road deaths remained constant compared to 2013. The indicator decreased by 20.7% in 2018 compared to 2010. The most favorable evolution was in 2012 and 2013, as the number of road deaths decreased by 7.9%, respectively by 8.1%. Otherwise, the progress made during this period was much weaker compared to the previous decade.
  • Comparing the situation of 2018 to that of 2001, the number of road deaths decreased by almost 54.3%, but we consider that the progress is not satisfactory; especially since 2014, the average annual rate of reduction of the number of road deaths was 1.06%.
If we refer to the number of people injured in road accidents in EU27+UK [12], we find that:
  • Between 2001 and 2010, the value of the indicator decreased, except for 2007, when there was an increase of 0.7%. The total reduction was almost 23.4%, from 1,967,977 in 2001, to 1,508,055 in 2010. The best situation was in 2008, when the value of the indicator decreased by 5.2% compared to the previous year.
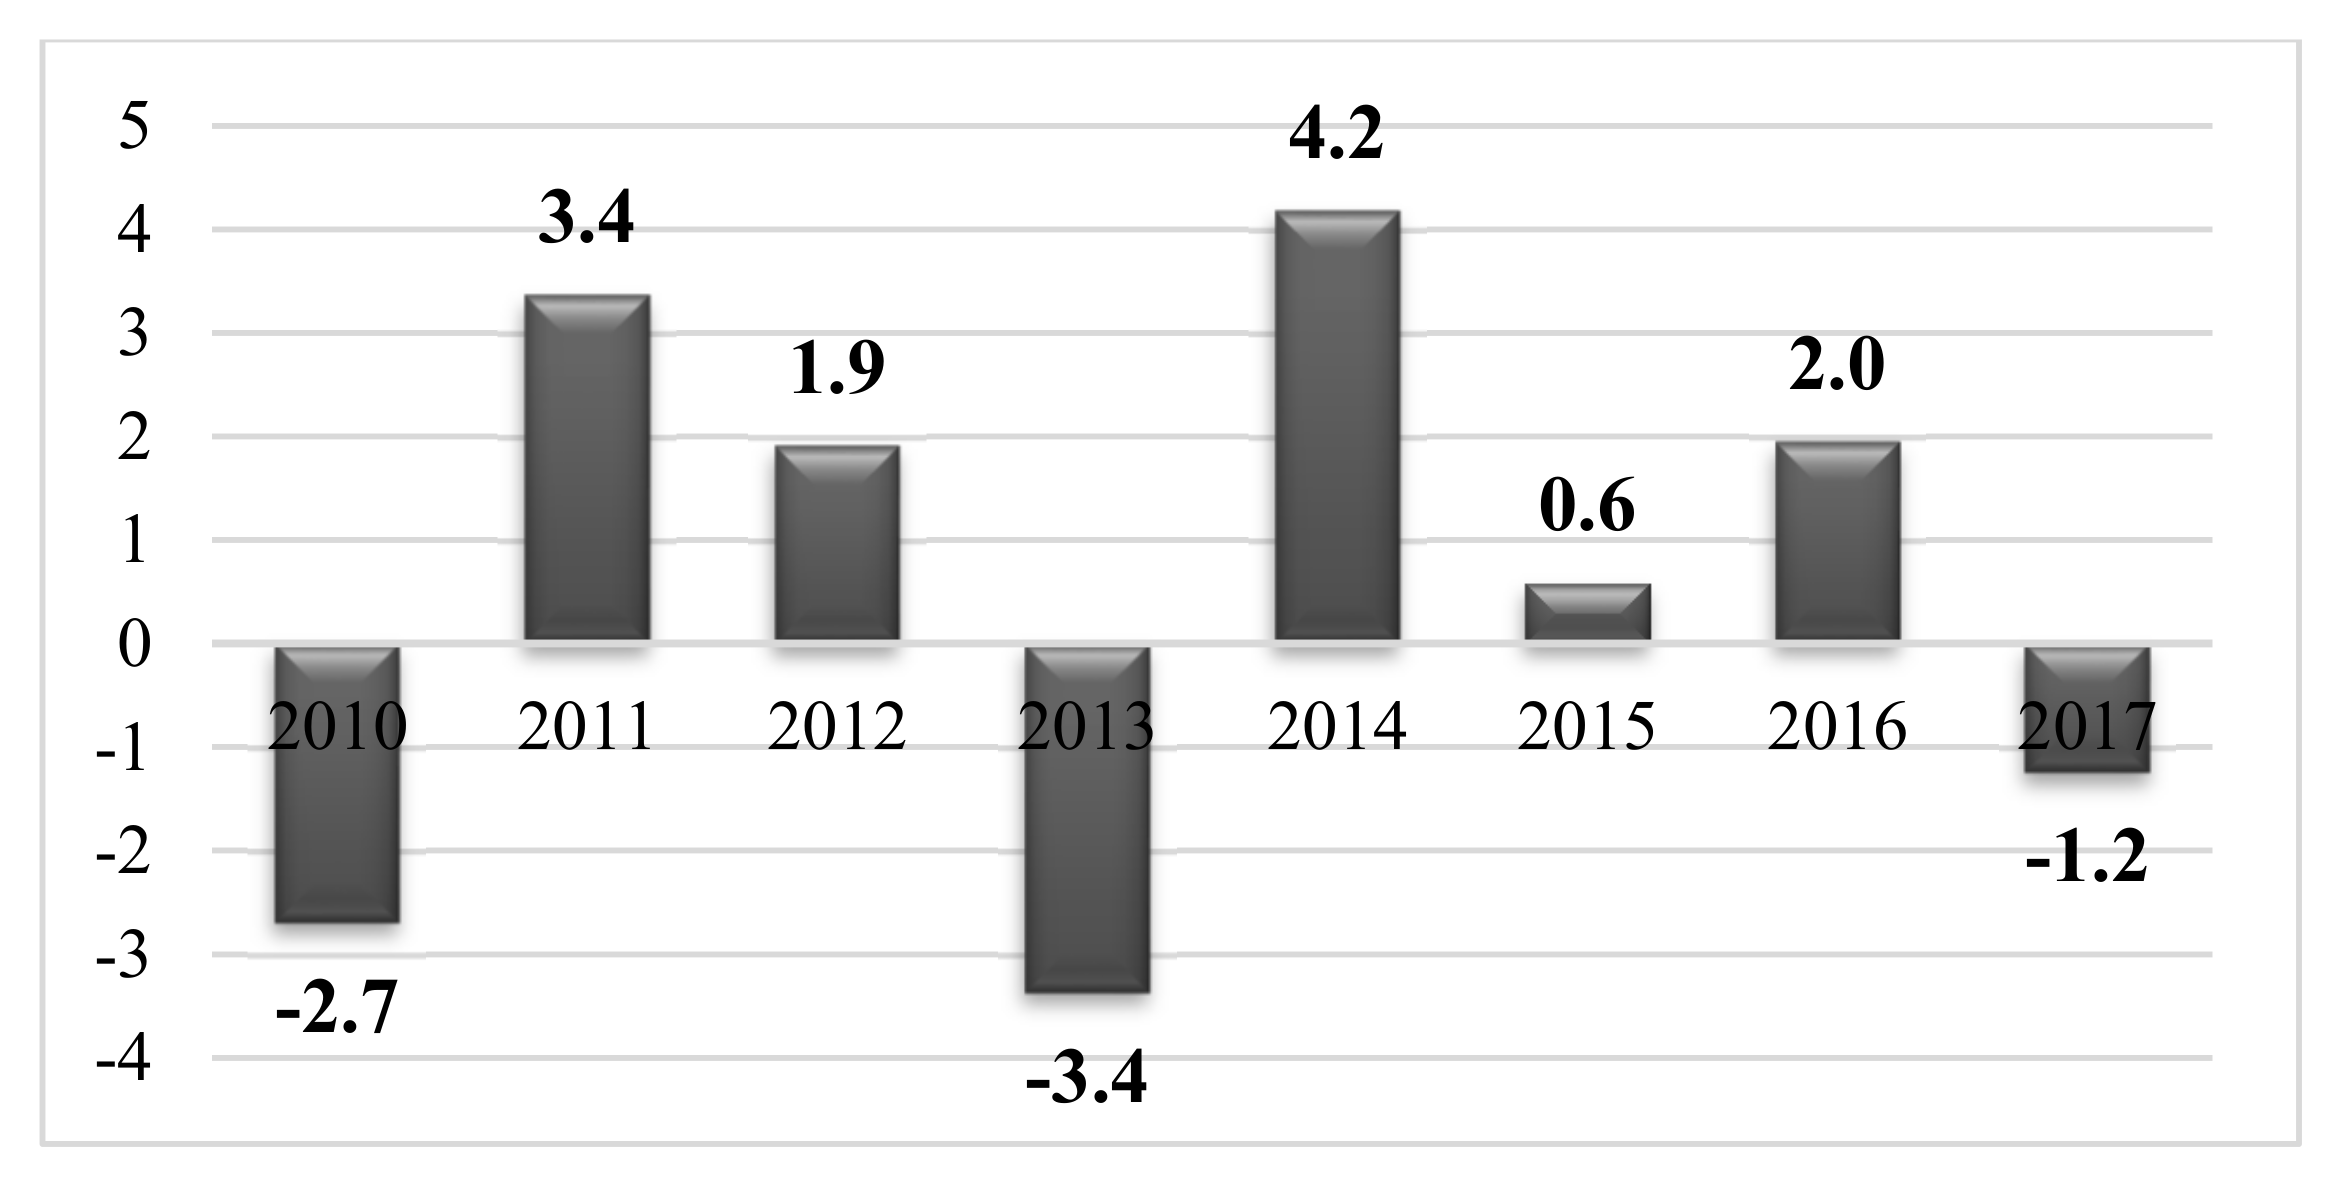
  • The evolution of the number of injuries in road accidents has deteriorated during the 2010 to 2017 timeframe (the last year for which there is complete data is 2015, as Ireland didn’t report the indicator in neither 2016 nor 2017). The number of people injured in road accidents decreased by only 6.5% in 2017, compared to 2010. The best evolution was in 2012, when the indicator decreased by 4%, then in 2014, 2015, and 2016 the indicator increased by an annual average of 0.9%.
  • If we look at the number of people injured in road accidents in 2017 (1,409,993 people) and in 2001 (1,967,977), we find that it decreased by almost 28.4%, which is also unsatisfactory.
Taking into account the situation presented, regarding the evolution of the number of road fatalities and injured in the EU27+UK between 2001 and 2018, some important issues emerge, such as: it is necessary to intensify the cooperation and efforts of the member countries to develop the existing policies in the field of road safety; it is necessary to increase the resources involved in research and innovation activities, in order to identify new solutions that contribute to the improvement of safety on European roads; it is imperious to increase the importance attached to this problem and the continuous improvement of the legislative framework, taking into account the fact that road safety is closely linked to the requirements of sustainable development, not only at European level, but at global level.
Regarding Europe, the European Commission developed the Europe in the Move package in May 2018, which contains the Strategic Action Plan (representing the Staff Working Document). Under this plan, new and much more ambitious targets have been set to offset the too slow decline of road fatalities and injured, especially between 2001 and 2018. These targets are the foundation of what has been called “Vision Zero” of the European Commission [13], because it is expected that in the period 2020–2030 the number of severe injuries in road crashes is to be reduced by 50% (i.e., with more than 67,500 cases) and the number of road fatalities to tend towards zero.
At the EU27+UK level, important steps have already been taken, considering the slowing down of the number of road fatalities and injured people. We can say, without too much mistake, that the effects of the measures and actions applied so far in this area have reached a stagnation stage. Of course, significant progress has been made in Europe in terms of road infrastructure, vehicle and human resources quality, communication technologies used; however, not enough progress has been made on improving road safety.

2.3. About eCall In Vehicle System (IVS)

Regarding the technical solutions applied or installed on vehicles (especially on the newest ones) in order to increase the safety of road traffic participants, considerable progress has been made, such as: devices dedicated to preventing collisions and to reducing the negative effects of road accidents; devices that help improve perception; devices related to speed control according to traffic conditions; devices related to the restraint system, regarding non-use and/or improper use of this; devices designed to verify tire pressure; devices that survey the behavior, and/or deficiencies of the drivers. From another point of view, the devices mentioned above are generically called Intelligent Vehicle Safety Systems [14] (p. 286), being classified into two main categories: vehicle-based systems and infrastructure-related systems. In addition, depending on the role they play in increasing the safety of road traffic participants, it is estimated that the devices can be part of: the class of active devices (they have the function of helping to prevent accidents); class of passive devices (intended to protect drivers and passengers during accidents, or immediately after, like the eCall device).
All devices are intended to prevent accidents and reduce the negative consequences that occur during a road accident. However, there is one exception, and this is the eCall In Vehicle System (IVS), which is part of the first group of devices, is one of the newest and most innovative, and it addresses events that occur after a road accident.
The eCall IVS is a device that directly and decisively contributes to reducing the time between the occurrence of a serious accident, resulting in deaths and severe injuries, and the time of arrival and intervention of rescue teams. Moreover, the eCall IVS is the only device that can contribute to improving traffic safety and reducing the negative impact of roadblocks after a traffic accident [15].
Currently, the need to install the eCall based on 112 IVS on all vehicles in circulation in Europe, regardless of their age (see sAFE—Aftermarket eCall For Europe project, 2018-EU-TM-0079-S), is being considered. We appreciate that the estimated impact generated by the installation of eCall IVS, on the entire EU fleet of road vehicles, can be analyzed from three different points of view, respectively:
  • Reducing the number of fatalities and injured persons shortening response time [16] and efficient rescue operations (by improving Rescue Operations Management at the European level).
  • Reducing the costs caused by roadblocks (by reducing the congestion time and the probability of secondary crashes on accident site) based on better traffic management.
  • Reducing the negative effect on the environment, thanks to shortening the duration of road congestions, caused by severe road accidents. Therefore, equipping all vehicles on public roads in Europe with eCall in-vehicle systems (eCall IVS) is not just a natural evolution in the automotive industry, to keep pace with the evolution of technology, but it is imperative. The number of road fatalities and severe injuries resulting from accidents on European roads is still unacceptably high, despite the efforts made by each Member State of the EU and the European forums.
As eCall IVS implementation on both new and aftermarket vehicles is an international new venture, it also involves stakeholders’ strategic orientation at European level. This means that being involved in the installation of eCall IVS is also an opportunity for international new ventures [17,18,19,20]. A company that showcases high entrepreneurial orientation is one that fosters product-market innovation, gets involved in new ventures, is innovative, and competitive [20].

2.4. Situational Awareness Generated by eCall IVS
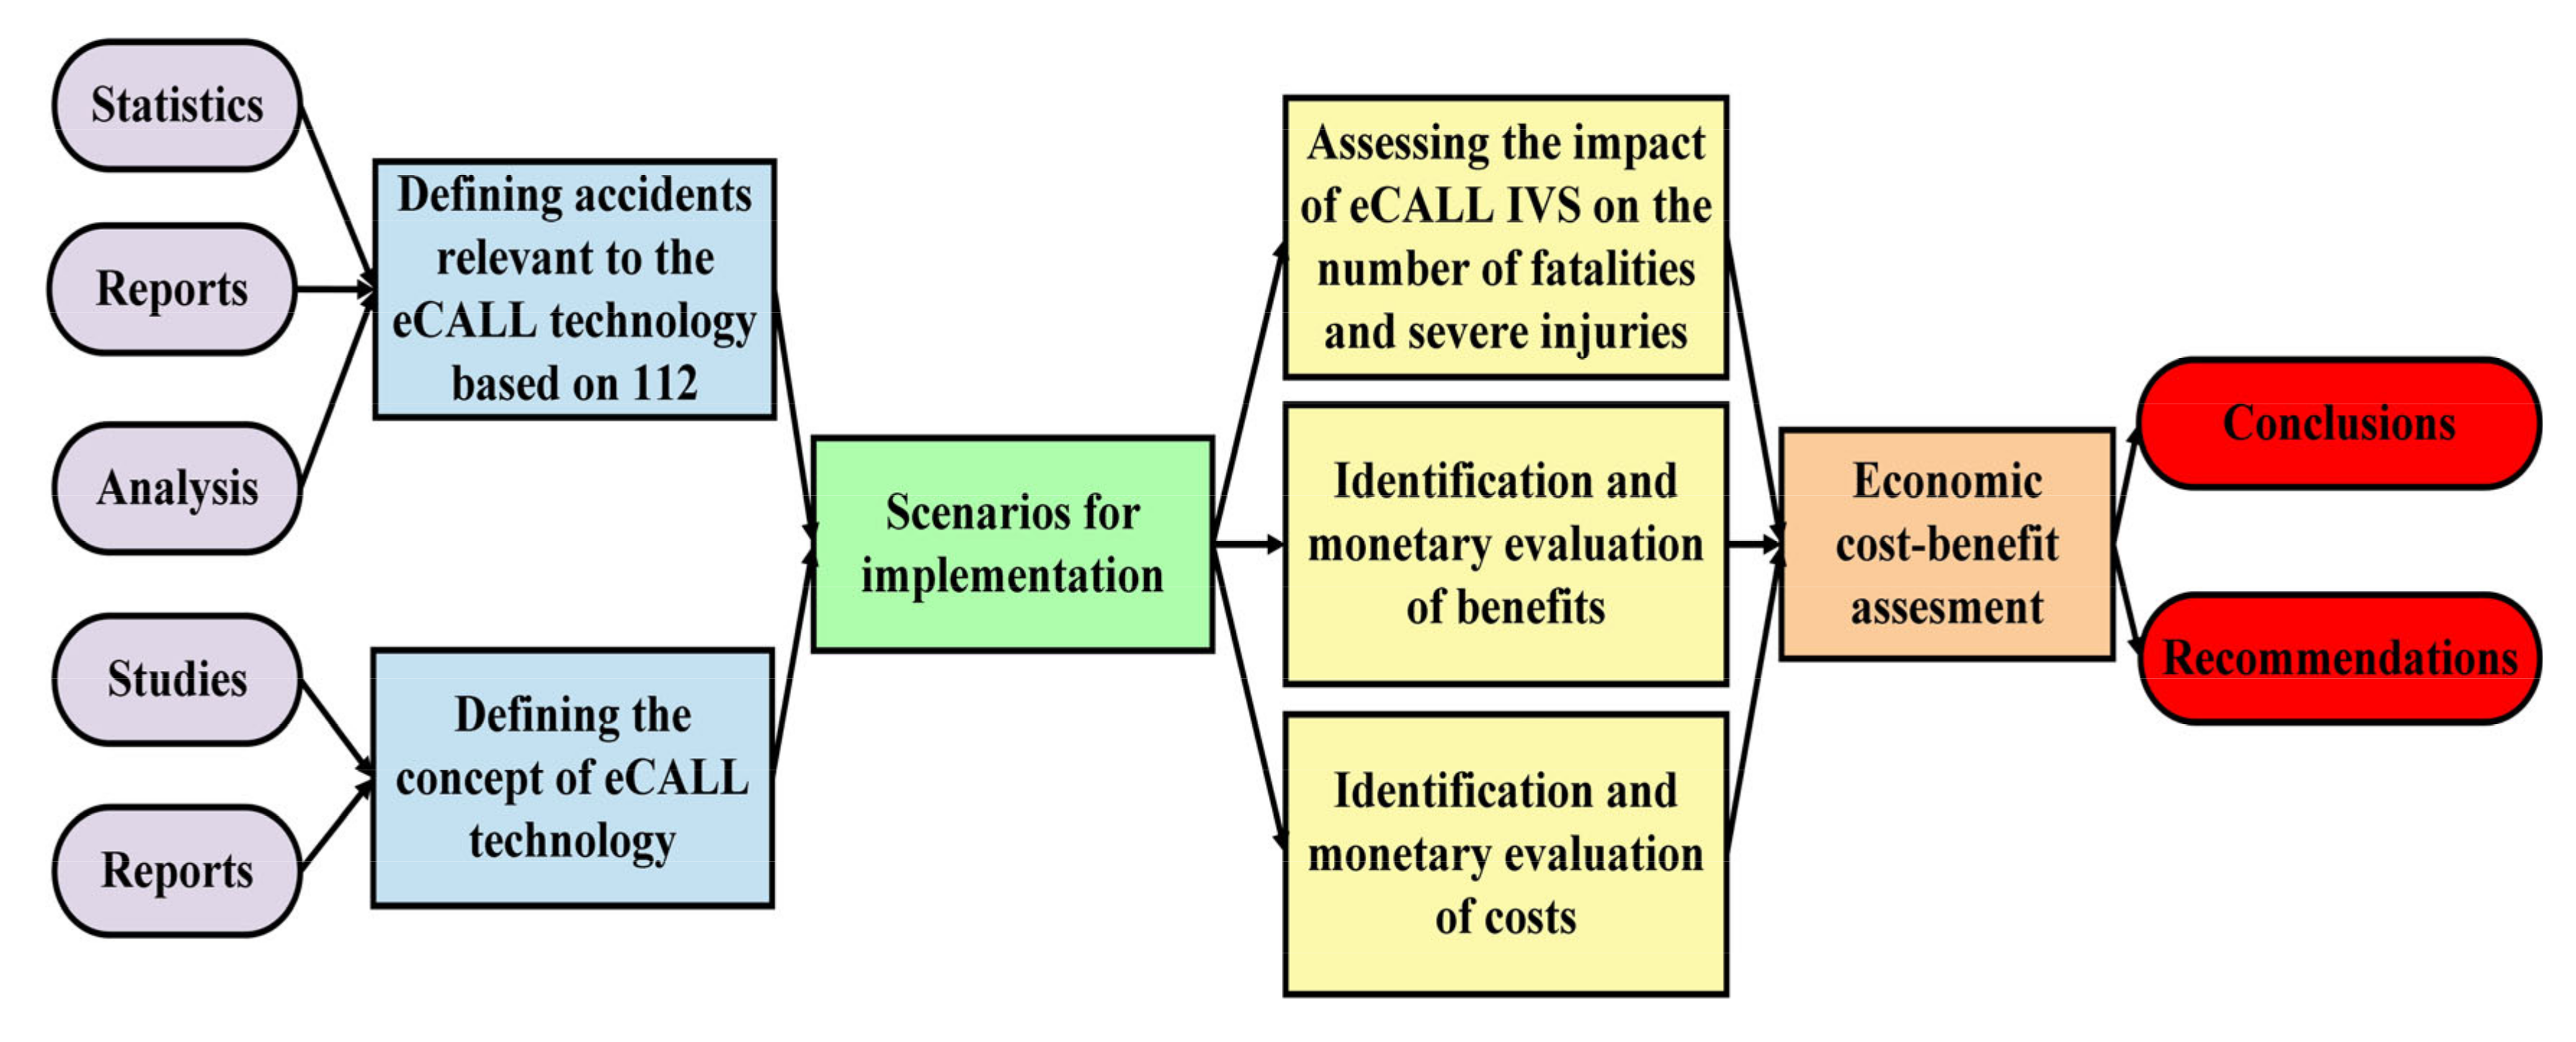
In different fields of research, expert decision-makers evaluate and classify a situation to be able to make an informed decision. Therefore, situational awareness is of extreme importance in collaborative environments since it improves the quality of management decisions and performance in general [21]. Road traffic rescue scenarios are a perfect example of the importance of situational awareness, with recent development of several systems and applications aimed at supporting coordination, cooperation, and communication within the entire managerial process [22].
An eCall IVS supports situational awareness by facilitating activities such as monitoring, analyzing, and planning. Unlike other measures that have already been implemented to increase road safety, which help prevent accidents or increase the safety of people in vehicles (like seat belts, headrests, airbags), the eCall technology brings an essential contribution to improving rescue operations management immediately after accident occurrence.
Situational awareness calls for different types of information. First, there is critical information, by which we mean the minimum information needs of the public safety answering point, such as accident location or vehicle type.
Second, there is action-triggering information, which describes information that decision makers need in order to perform core tasks, such as the number of casualties, accident severity, vehicle identification number, vehicle propulsion storage type, and vehicle direction.
Third, there is information to be created, which cannot be created in advance [23], as it encompasses analyses performed by professionals and suffers changes during the rescue operation [24]. In this category, the information already provided by the eCall system facilitates access to information to be created by providing access to quickly calculating accessibility, traffic control, the cause of the accident, vehicle extrication necessities, and other required emergency services [25] (p. 286).
At an operational level, situational awareness leads to the use of accessibility analysis in logistics and route, command, and control site planning. For example, information provided by the driver via the eCall in-vehicle system such as the number of victims, hazardous materials, and visibility, provided by the eCall system itself on vehicle characteristics and accident site, can free up resources and facilitate rescue operations management.

3. Methods

3.1. Analytic Approach

The purpose of the present study (cost benefit analysis) is to assess the impact of eCall IVS on reducing human costs, congestion costs, and pollution costs. To this end, we employ an analytic research approach, on primary and secondary statistical data, and perform a conclusive study to make a critical evaluation and chose the best means of action to save important resources used in rescue operations management.
A Block Chart summarizing the methodology of the Cost Benefit Analysis (CBA) is presented in Figure 1.
The main secondary data used, processed briefly and analyzed to substantiate the cost-benefit analysis, have as main sources Eurostat data, UNECE, ACEA reports (European Automobile Manufacturers Association), and ETSC Statistics (all these being organizations that provide data that are public and available without restrictions for all users). The rationale for using such a large number of secondary data sources is the need to ensure that a volume of data is as relevant as possible, necessary to estimate both the costs involved and the benefits that may result from the implementation of eCall IVS in passenger vehicles, at the level of the European Union. The unit of observation will be passenger vehicles, as 91.5% of passengers use the road infrastructure, of which 82.9% used passenger vehicles [5]. This implies that our conclusions will be drawn for the case of passenger vehicles alone (cars and taxis).
Considering the differences in types of costs generated by road accidents, the difficulty of estimating the value of human life or injury on a person, as well as the uncertainty of secondary disasters, the first relevant objective of the research is “O.1. To establish and evaluate the costs generated by road accidents at EU level.”
The reasoning behind this first objective is to also have a clear view of the highest costs generated by road accidents and their categories to have a working base for the second objective of the research, “O2. To establish the cost of eCall IVS implementation applied for the entire EU passenger vehicle fleet.” The reasoning behind the second objective is that eCall IVS implementation generates supplementary costs for end-users and manufacturers, together with aftermarket service providers. At the same time, extending eCall based on 112 technologies on all vehicles generates additional costs for public institutions involved in rescue operations.
As the proposed eCall in-vehicle system is intended to meet the decision making demand for rescue operations and allow dynamic adjustments in the case of secondary events, and with support from current research [26] aimed at developing high-performance algorithms to improve rescue operations in the case of emergencies, we formulate the third objective of the study, “O3. To assess the benefits that eCall IVS implementation has on the number of fatalities and severe injuries.”
We posit that reducing the number of fatalities and severe injuries by implementing eCall IVS on the entire EU passenger vehicle fleet decreases the costs generated by road accidents. By implementing eCall IVS the entire EU passenger vehicle fleet decreases congestion and pollution costs generated by road accidents. Situation awareness and response promptness are vital in measures aimed at emergency localization and rescue, and they require a united effort from corresponding managerial bodies, manpower and equipment [27] involved in the rescue operations to perform their tasks. As eCall IVS implementation aims to shorten intervention time and enrich situation awareness, we define the fourth objective of our study, “O4. To assess the effects that eCall IVS implementation has on rescue operations.” This last objective calls for a formalization of the relation between eCall IVS implementation benefits and the parties involved in the rescue chain.

3.2. Data Collection, Measurement and Analysis

The implementation of the eCall based on 112 devices in all passenger vehicles traveling on European roads requires several directions of action. First, we refer to the actual equipment of vehicles, either from the factory or after-market. Second, we refer to upgrading the equipment and software used in Public Safety Answering Points (PSAPs), which operate in the member states. Third, PSAP employees need to be involved in training programs to be able to receive and handle eCall IVS calls. Therefore, in the analysis of the impact generated by the large-scale installation of eCall IVS, we will consider, in turn, all three aspects. According to ACEA Report: Vehicles in use—Europe 2019 [28]—does not contain data for Bulgaria, Cyprus, Malta, and Iceland, because the values were not sent at the date of publication of the document), the total number of motor vehicles registered in Europe stands at 386,417,854 units, of which 84.59% represent passenger vehicles. For EU27+UK, the reporting is 308,392,804 vehicles, and the share of passenger vehicles is almost 87%.
Next, we will refer to the passenger vehicle fleet from the European Union countries, for two reasons. On the one hand, the data needed to analyze the impact of installing the eCall IVS device is complete and available, both in terms of number of vehicles and PSAPs. On the other hand, about 80% of the total number of motor vehicles are registered in the EU27+UK (Eurostat 2019), and the study looks at how the installation of the device can contribute to achieving the road safety objectives set for 2030. In addition, passenger vehicles are responsible for 46% of road fatalities in the European Union.
To evaluate the impact of installing the eCall IVS device, we considered all passenger vehicles up to 20 years old, which represent more than 90% of the total vehicles, as we can see in Table 1. The share of vehicles by age was based on the latest data published by Eurostat, for 2013–2017 (reports from Bulgaria, Greece, and Slovakia are missing).
The impact of installing the eCall IVS device on passenger vehicles on reducing the number of road fatalities and severe injuries is even greater, as the number of equipped vehicles increases. Therefore, the complete equipment of the passenger vehicle fleet in the EU within 10 years should result in a reduction of the current number of severe injuries by half, and the number of fatalities should be zero (Strategic Action Plan for 2030).
We consider that it is necessary to refer to the definitions used to characterize different situations in which a person affected by a traffic accident may fall [12], respectively: a fatality represents any person killed immediately or who loses her/his life within 30 days because of injuries due to a road accident; a seriously injured is a person injured because of a road accident and who was hospitalized for a period of more than 24 h; slight injury is a person injured because of a road accident but cannot be included in the category of serious injury.
To determine the size of the benefits of installing the eCall IVS, we need to have a clearer picture of the evolution of the number of road fatalities and severe injuries in EU27+UK, according to national definitions. Unfortunately, the reporting of statistics in this area is very late, so there are very large gaps between the current moment and the last year with complete data.
As shown in Table 2, the last year with complete data is 2017. Even so, there are countries that have communicated the values for severe injuries only until 2016, such as Italy. So, to ensure an acceptable level of relevance, we considered that for Italy the value of 2016 is preserved for the following year.
The evolution of road fatalities in EU27+UK between 2010 and 2018 is shown in Figure 2. We considered the fact that all countries reported this indicator, so that the total number of road deaths in 2018 is 25,386 persons. We point out again, that in 2018 compared to 2017, the indicator decreased by only 1%, which is a cause for concern for the decision makers in the field of transport and at EU level.
Figure 3 shows that in the case of severe road injuries, the situation is worse than in the case of deaths resulting from road accidents. Therefore, the faster the eCall device is adopted, the more positive effects will occur in road traffic safety.
We must mention that correction coefficients for the existence of unreported cases have been applied to the official data of UNECE and ETSC (Economic Research and Policy Consultancy, Switzerland, Ecoplan, 2002; Harmonized European Approaches for Transport Costing, HEATCO Project, 2006). Thus, the statistics were corrected with a coefficient of 1.25 for seriously injured people and 2 for slightly injured.
Based on literature review, and on relevant reports of international institutions interested in road safety, like the World Health Organization (WHO), UNECE, DG MOVE, Eurostat, ETSC, Organisation for Economic Cooperation and Development (OECD), EU Road Accidents Database (CARE), it is appreciated that:
  • In the case of severe injuries, after exceeding an hour since the injury occurred, the survival rate decreases from 26% to 5% (the Golden Hour Principle).
  • Due to eCall, the response time of rescue crews can be reduced by 50% (from 21 to 12 min) in rural areas and by about 40% (from 13 to 8 min) in urban areas [29].
  • This can have the effect of reducing the number of road fatalities with average values between 2% and 10% and of reducing the number of severe injuries by 2% to 15% (the situation is different at national level, as the values may be lower or higher than the EU average).
  • According to E-MERGE/STORM project Germany, Finnish Ministry of Transport and Swedish Road Administration, the mentioned intervals are reduced to 3.7%–9% for road fatalities, and to 6.5%–9.5% for severe injuries [30].
Worth mentioning on the role and necessity of installing the eCall IVS aftermarket [31] (pp. 9–16): a very high number of fatalities and severe injuries on European roads, compared to initial target (15,750 road deaths for 2020); delays that occur with regard to alerting emergency services; delays regarding the presence of emergency crews at the accident site; the length of time required for rescue operations at the accident site; the number of secondary accidents, which occur after the main accident; and traffic jams.
Another important aspect is that the negative consequences of road accidents are due to communication deficiencies, which occur either because the victims cannot communicate, or because of language barriers, or because those involved do not know what information to request or communicate, etc. The greatest time savings are achieved in terms of communication (6.8 min are saved due to faster communication) and search for accident location (savings of up to one minute).
In investment projects, by benefits we mean income realized from the sale of economic goods (or services), during the effective exploitation period [32]. In the case of the large-scale implementation of the eCall IVS project, the benefits are quantified in savings achieved in the rescue operations, on account of the reduction of the associated costs. This is achieved, on the one hand, by shortening the time to reach the place of the accident and by efficient intervention, and on the other hand by improving the management of rescue operations, through a more accurate allocation of the necessary resources (personnel, equipment, materials, and means of transportation), due to timely and relevant information.

4. Results

4.1. Accident Costs Establishment and Evaluation

At the global level, there is no unitary approach to the costs associated with road accidents, neither in terms of cost categories nor in terms of their amount [33]. The explanations are many and varied. On the one hand, there are regulatory differences. On the other hand, the traffic conditions are very diverse, along with the quality of transport infrastructure and road transport vehicles. There are also differences in the type of road accidents, their frequency and severity. Finally, the unit medical cost of road accident patients differs greatly from country to country.
For this reason, in order to ensure a satisfactory level of relevance of the results of the cost-benefit analysis for stakeholders in the field of road transport safety at European level, we decided to use the data provided by studies conducted under the auspices of the European Commission. One such document is Handbook on the external costs on transports. Version 2019. The information on unit costs associated with road accidents provided in the study is harmonized (their calculation is based on statistical data collected from 31 European countries) and therefore relevant for the purpose of cost-benefit analysis that is the subject of this paper.
There are several categories of costs, which are considered in determining the total cost of a death or injury resulting from road accidents. A complete picture of them is presented in Table 3.
The immediate effect of installing the eCall IVS device is to streamline and increase the quality of rescue operations. Therefore, the impact will be manifested in the persons affected by the road accidents, respectively a case of fatality can be transformed into severely injured, and one of severely injured in slightly injured, on account of shortening the total duration of the rescue operations and improving their management at the European Union level. As the mobility of people in Europe is very high, citizens from different countries can be involved in road accidents in any other country, and the harmonized implementation of eCall based on 112 benefits all citizens.

4.2. Costs of eCall IVS Implementation

Regarding the annual costs associated with the installation of the eCall IVS on all passenger vehicles registered in the EU, in the 10-year forecast (2020–2029), their calculation is based on the following elements:
  • The current number of passenger vehicles circulating in the European Union (based on Eurostat, 2019).
  • The estimation of the annual number of passenger vehicles for the period 2018–2029 was made by applying an annual average value of the renewal index on the number of vehicles from the previous year (Appendix A). The renewal index was calculated on the basis of annual renewal rates for each member state and for the total EU27+UK, for a period of 10 previous years (from 2008 to 2017—data available, according to Eurostat records for 2019).
  • Nine percent of the total number of passenger vehicles is equipped each year (Figure 4 and Table 4).
  • Based on the information obtained from the studies carried out in the field of road safety, which we mentioned above, the unit cost of equipping a vehicle with the eCall device will be €75 in the first year of forecasting, following that from the second year it will decrease to €50, due to economies of scale (as the number of installed devices will increase, their unit price will decrease). We mention that the device has already been installed in all new vehicles circulating in the EU, since March 2018, so it is normal that the price of the device will decrease, as implementation is extended (Table 5).
  • At the end of the forecasting period, the total number of vehicles equipped with eCall IVS technology, in various construction options, will reach 267,971,557 units (the entire fleet of passenger vehicles, with an age of less than or equal to 20 years).
  • The total cost of updating all EU27+UK PSAPs units with modern technology, and of employees and staff training is evaluated at €30.8 Mill, which means €3.08 Mill per year [34] (p. 71).
As we have seen, installing the eCall device entails both costs and benefits. It is quite difficult for all aspects to be considered in their identification and evaluation [35]. For example, not all the costs associated with fatalities and severe injuries, or the provision of car services with the equipment necessary for the aftermarket installation of the eCall device, were considered. What is important is that this aspect brings a degree of uncertainty but does not decisively influence the results of the analysis performed. We will continue to see that the same is true of benefits.

4.3. Benefits of eCall IVS Implementation

To determine the monetary value of the annual benefits generated by eCall IVS in the EU (considering that all passenger vehicles will be equipped), the following elements are to be taken into consideration:
  • The current number of road fatalities and severe injuries, mentioned in the official statistics (25,567 fatalities, and 231,857 severely injured)—we again indicate that the data are available for both indicators for 2017.
  • The targets set for the next decade, regarding the annual reduction of the value of these indicators, i.e., 9% of fatalities will become severely injured (2301 cases per year), and 9.5% of severely injured will become slightly injured (22,026 cases per year).
  • The unit value of human costs in the case of death (€2,907,921), of a severe injury (€464,844), and of a slight injury (€35,757)—we will only consider this cost category, as it is 100% outsourced and it is the only cost that can be correlated with the impact of eCall technology, according to EC documents (Handbook on the external costs on transports. Version 2019).
  • The unit value of the benefits achieved by reducing of a fatality to a severe injury, i.e., €2,443,077 (€2,907,921–€464,844), and by reducing a severe injury to a slight injury, i.e., €429,087 (€464,844–€35,757).
  • The unit value of the benefits generated by the reduction of roadblocks by reducing of fatality to a severe injury, i.e., €13,050 (€19,263–€6213), according to other official studies [36] (p. 46).
  • The annual benefits obtained because of reducing pollution by reducing roadblocks are estimated at €100,080,000, which represents 0.3% of the total pollution costs caused by passenger vehicles [11] (p. 51).
  • The value of the total annual benefits, calculated based on the previous information, amounts to €15,202,698,489, which is 2301 reduced fatalities × €2,443,077 + 22,026 reduced fatalities × €429,087 + 2301 reduced fatalities × €13,050 + €100,080,000.
We considered a 10-year forecast period, starting in 2020, with constant annual benefits. The opportunity calculations for this project envisage a cautious (even pessimistic) approach because it is based on the fact that only 10% of the total annual benefits can be directly accounted for by the installation of the eCall IVS device in all vehicles, respectively €1,520,269,848.

5. Discussion

In this part of the paper we will refer to the potential benefits of eCall IVS implementation on rescue operations management. The evaluation of the opportunity of installing the eCall IVS device in all passenger vehicles should consider the influence of the time factor on the investment decision [37]. Therefore, the calculation of the benefit-cost ratio (BCR, Table 6) will be done using the discounted values of costs (C’) and Benefits (B’), taking into account an annual discount rate of 5% (according to Guide to Cost-Benefit Analysis of Investment Projects—Economic appraisal tool for Cohesion Policy 2014–2020, December 2014). The annual discounting factor is z = (1+0.05)-h, where h = year (h from 1 to 10).
Based on the annual BCR evolution in the forecast range, the following assessments can be made: except for the first analyzed year, where BCR is less than 1 (respectively 0.8), which means that the benefits do not cover the associated costs, during the rest of the period the BCR value is over unit; BCR decreases as the forecast range nears the end, which is natural, given that annual benefits have been kept constant and annual costs increase slowly (as the number of vehicles in which the eCall IVS is installed grows).
The cumulated BCR for the entire period will be 1.1 (11,741,044,036/10,891,679,518), which means that the installation of eCall IVS technology in all passenger vehicles registered in the EU is at the same time:
  • Advantageous for investors because the benefits are greater than the costs.
  • It is beneficial for the entities involved in the rescue chain, as the eCall technology provides them with the necessary elements both for increasing the quality of rescue operations and for improving their management.
  • Useful to society, by reducing the number of fatalities and severe injuries, because of the increase in the level of road safety.
Rescue operations management benefits are hard to quantify before the implementation of the eCall IVS, as humanitarian logistics differs in dynamic, both regarding demand and supply from other types of logistics (i.e., commercial and military) [38]. We can, however, highlight three benefits of eCall IVS implementation in the case of passenger vehicle accidents. First of all, risk avoidance and mitigation by facilitating a quicker response time, thus avoiding secondary accidents and traffic congestion. Secondly, urgent needs mitigation by lowering response time, and third, increased preparedness, due to the automated vehicle data sent by the IVS, which allows for a quicker assessment of the resources required on the accident site. Our research also demonstrates that implementation of the device provides instant reliable information of the accident conditions, thus eliminating one of the limits of humanitarian logistics.
Another benefit for rescue operations management is that implementation of the eCall IVS for the entire passenger vehicle fleet (new and aftermarket) allows for some extent of standardization, a key requirement for supply chain excellence. Therefore, we consider that the prior knowledge of the standard data (transmitted by the device at the time of the accident) generates a decrease in the cost of operations and contributes to the harmonization of the actions of the participants in the rescue chain. The increase in available data for decision making provided by the eCall IVS also allows rescue chain managers to be flexible in dynamic scenarios.

6. Conclusions and Implications

Considering both the complexity of the investigated field and the multiple implications of the harmonized extension of eCall IVS implementation in the European Union countries, we will highlight some relevant conclusions and some directions for future action.
Achieving sustainable improved rescue operations by installing the eCall IVS involves consistent efforts of all stakeholders involved in: the decision-making and regulatory process (at national and EU level) in the field of road transport; the automotive industry; increasing road safety; and initiating and carrying out rescue operations in the event of an accident. According to the European Commission data (CARE, 19 December 2018), the number of road accidents resulting in fatalities and severe injuries is very different from one country to another, as well as the type of vehicles responsible for the negative effects of accidents.
The most important conclusions resulting from the cost-benefit analysis can be summarized as follows:
  • In order for the positive impact of eCall technology to be as high as possible, in particular on the efficiency and management of rescue operations, efforts should be focused mainly on vehicles registered in the country’s most contributing to the negative statistics on fatalities and severe injuries (according to CARE data, 2018, over 70% of deaths occurred in countries such as France, Italy, Germany, Poland, Romania, United Kingdom, and Spain in 2017).
  • Regarding the types of motor vehicles, there are three categories that contribute substantially to the number of fatalities in EU countries, namely passenger vehicles (cars and taxis) with 65.2%, motorcycles and mopeds together with 25.1% (a total of over 90.3%). Under these conditions, the implementation of eCall technology must firstly focus on passenger vehicles, and secondly on motorcycles and mopeds.
  • The constructive solutions of the eCall IVS devices must be adapted to the technical specifications of each category of motor vehicles envisaged, without affecting their quality or functionality.
  • A cost benefit analysis was performed in order to assess the opportunity of deploying the eCall IVS on the European Union member states, based on existing data already generated from existing analyses for eCall based on 112 at European level, and updated data from secondary statistical sources (Eurostat, EUCARIS, national databases), providing consequences and implications for rescue operations.
  • Although opportunity calculations for eCall IVS envisage a pessimistic approach, since only 10% of the total annual benefits can be directly accounted for by the installation of the eCall IVS device in all vehicles, respectively €1,520,269,848. Therefore, installation of the device is beneficial for investors, entities involved in the rescue chain and society in general.
One of the main benefits of installing eCall IVS for rescue operations management is the opportunity for knowledge sharing and standardization. On one hand, eCall IVS generated information will be used to ensure common situation representation between actors. On the other hand, when employees engage with each other across the rescue chain, sharing vital information across the rescue process, they develop trans active memory of who knows, and who to ask [39], thus making the entire process more efficient.
In terms of sustainability, the investment approach that has been subjected to the cost-benefit analysis can be characterized as follows: it involves the technological renewal of the organizations involved in rescue operations; contributes to the creation of conditions that facilitate the increase of the quality of the human resources that carry out their activity in different organizations involved in the rescue chain; contributes to the improvement of rescue services in case of road accidents, which can be carried out with increased efficiency, for a long period of time; it can have a significant positive impact on a large number of people (here we refer both to people affected by road accidents and to the personnel involved in rescue operations); it can generate significant savings for public health systems, which would allow for a better allocation and use of resources in this sector, which is so important for society as a whole. Rescue operations management benefits are hard to quantify before the implementation of the eCall IVS, due to the multitude of actors, unpredictable and dynamic situations, and perception differences between one party of the rescue chain and another. However, since eCall implementation allows for some extent of data standardization, this increase of data available for decision making can positively influence rescue chain managers’ performance.
Now, we must make some references to the limitations associated with this analysis, even if they did not affect the rigor of the research or the results obtained. First, we mention that there is a gap of about two years (or even greater) between the time of publication of the statistical data on the number of passenger vehicles, road fatalities and severe injuries (2017), and the time of the study. The data associated with the number of passengers for the years 2018 and 2019 were calculated based on the average renewal index, used for the forecast period, thus obtaining a coherent and correctly substantiated data set. In the case of statistics on fatalities and severe injuries, historical data from 2017 were used. Therefore, the research results were not adversely affected, but on the contrary.
A second aspect relates to the fact that, in forecasting the number of passenger vehicles, the number of vehicles in the UK was considered. We also consider that in this case we cannot talk about a limitation that can affect the rigor of the analysis. The UK is a country that has been a member of the EU until recently and will represent a significant potential market for eCall technology in the future. We also do not believe that the mobility of goods and people in Europe across the UK and vice versa will suffer significant reductions in the future, so the expected beneficial impact of the eCall IVS will be approximately the same.
Finally, other limitations are that not all cost categories and benefits of eCall based on 112 can be identified and evaluated. At the same time, due to the high degree of novelty of eCall IVS technology, we have not noticed the existence of relevant studies regarding the extent to which the installation of the eCall IVS device directly contributes to the reduction of fatalities and severe injuries. For this reason, we appreciated that the pessimistic option, to consider for the eCall device only 10% of the benefits was the most appropriate.
We consider that a continuation of research in this field is not only welcome but also necessary. We consider that the extension of the project to the level of all types of vehicles, and then of all European countries, in a first stage, and then globally, in a second stage, is an approach that will have a decisive contribution to the reduction of the number of road fatalities and severe injuries globally, with beneficial effects both economically and socially.
As future work, it would be relevant to study the after-implementation effects on rescue chain participants, to provide a better understanding of the newly created rescue chain environments at European level. We also consider conducting a comparative analysis in the future (EU countries versus USA, Australia, Asian countries, etc.), in order to identify the extent to which eCall technology (or other variants thereof) has beneficial effects on increasing the efficiency of rescue operations in case of road accidents, with a positive impact on the organizations that are part of the rescue chain.

Author Contributions

Conceptualization, D.Z. and G.C.; data curation, A.P.; formal analysis, D.Z. and A.P.-M.; investigation, A.P. and E.G.G.; methodology, D.Z. and G.C.; supervision, G.C.; writing—original draft, D.Z. and A.P.-M.; writing—review & editing, D.Z., A.P. and E.G.G. All authors have read and agreed to the published version of the manuscript.

Funding

The research described in this paper was founded by the sAFE—Aftermarket eCall For Europe project, implemented under the Connected Europe Fund Annual Programme, Grant agreement Number 2018-EU-TM-0079-S, which aims to define the standards and specifications to pave the way for deployment of after-market systems for eCall.

Acknowledgments

The article processing charge (APC) was discounted integrally by the Multidisciplinary Digital Publishing Institute (MDPI).

Conflicts of Interest

The authors declare no conflicts of interest.

Appendix A

To predict the number of passenger vehicles for 2020–2029, a calculation method was elaborated. To begin with, we mention that the impediment to a most accurate forecast was the fact that the statistical data are delayed, compared to the time of the CBA.
When there was missing data in the beginning or middle part of a data string, we decided not to complete the data string by approximation methods, in order not to introduce new errors. Thus, we decided to ignore those calendars years in the subsequent calculations, for countries with currently unreported data.
If the missing values were on the last positions in the range of values for the period 2008–2017, these data were generated using the average of the renewal rate of passenger vehicles. We mention that, in the case of Italy, we also considered the value already known for 2016, obtaining the value of 1.0087 for the Increasing Index (Table A1). The same technique was applied to fill in the missing data for Romania, from 2016 and 2017 and for Italy from 2017.
Table A1. Computing the Increasing Indexes.
EU28 Countries2009201020112012201320142015201620172018–2029
Belgium1.01211.01601.02481.00681.00911.01131.01231.01571.01281.0134
Bulgaria1.05751.04001.03571.04161.03681.03561.04920.99420.88141.0423
Czechia1.00271.01381.01911.02711.00491.02201.05831.03761.04341.0254
DenmarkN/AN/AN/AN/AN/A1.02261.02631.03131.02621.0266
Germany1.01011.01351.01481.01171.00971.01261.01501.01631.01471.0131
Estonia0.98881.01301.03861.04901.04401.03881.03621.03921.03241.0364
Ireland0.98560.98241.01310.99421.01711.01701.02071.02071.01891.0179
Greece1.02151.01650.99750.99310.99160.99740.99941.01031.01471.0158
Spain0.99271.00751.00580.99870.99001.00021.01481.02331.02731.0131
FranceN/A1.00841.00311.01191.02260.99000.99370.99230.99781.0115
Croatia0.99360.98700.99800.95191.00211.01801.01751.03541.02781.0202
Italy *1.00741.01041.00990.99910.99691.00321.00731.01411.00871.0087
Cyprus1.03831.00431.01511.01060.99911.00831.01921.04221.03611.0218
Latvia0.96940.70400.96181.00971.02641.03661.03230.97811.03821.0286
Lithuania1.01450.99801.01271.02341.03170.66651.03181.04391.04491.0290
Luxembourg1.01071.01721.02491.02981.02061.02641.02221.02581.03161.0232
Hungary0.98650.99020.99461.00611.01831.02201.02871.03641.04791.0266
Malta1.02121.02821.02581.00991.02601.03851.03551.02741.03091.0270
Netherlands1.01061.01501.01591.00731.00211.00591.01531.01511.01831.0117
Austria1.01751.01861.01621.01571.01251.01161.01131.01551.01601.0150
Poland1.02581.04521.05131.03421.03441.03171.03601.04591.03821.0381
PortugalN/AN/A1.00430.90391.01611.08601.00501.02691.04311.0302
Romania **1.05411.01771.00351.03511.04661.04511.05031.03611.03611.0361
Slovenia1.01311.00261.00460.99960.99791.00431.00971.01651.01951.0100
Slovakia1.02851.05041.04801.04281.03051.03691.04391.04291.04781.0413
Finland1.02851.03601.03511.01981.02271.02151.01961.02711.02301.0259
Sweden1.00491.00801.01531.01041.01091.02001.01821.02121.01631.0139
UK0.99501.00621.00161.0090N/AN/AN/A1.01981.01131.0096
Source: Own calculations method, applied on Eurostat data, 2019. * In the case of Italy, the values for 2017 have been forecasted as no official data were available. ** In the case of Romania, the values for 2016 and 2017 have been forecasted as no official data were available.
Having complete data for each country until 2017, we used the mentioned technique to calculate the number of passenger vehicles in 2018 and 2019 (Table A2). Then, we forecasted the number of passenger vehicles for the period 2020–2029, for all EU member countries, using each time a constant Increasing Index, calculated at the level of 2018, valid for the entire analysis horizon of ten years (Table A3).
Why do we consider that we can apply the constant Increasing Index?
Because we considered x 1 , , x n   a string of n numbers, so that their average is equal to M . So x 1 + + x n / n = M , meaning x 1 + + x n = n M . If we build a new string, consisting of the same n numbers and we complete it with a new term, represented by the average of M , meaning x 1 , , x n , x n + 1 = M . In this case, the average of the numbers in the new string will be:   x 1 + + x n + M / n + 1 = n M + M / n + 1 = M n + 1 / n + 1 = M . Therefore, the average of the numbers in the second row is the same as the average of the first row.
For this reason, if the Increasing Index in 2018 is calculated as the average of the previous years, then from 2019 to 2029 (or for any other year for which the forecast is desired), the Increasing Index (calculated as an average of indexes from previous years), will be constant and equal to that of 2018. Therefore, we can apply a constant Increasing Index.
In this calculation method, we assume that it starts from a certain number of passenger vehicles, denoted n, corresponding to the last year for which there is data, denoted by A. If x is the Increasing Index (calculated with the method mentioned above), then according to the method, the following variation in the number of passenger vehicles occurs from year to year:
  • in year A: n
  • in year A+1: n x
  • in year A+2: n x x = n x 2
  • in year A+3: n x 2 x = n x 3  
Basically, the string of values corresponding to the years A, A+1, A+2, ... represents a geometric progression, having the first term n and the ratio x . Since the values of x for all countries are over unit, the number of passenger vehicles determined by this method will increase from year to year, with no possibility of any decrease occurring (as there were in the past, as can be seen in Table A2; for example in the case of Greece, the number of passenger cars decreased in 2011, 2012,..., 2015).
Moreover, given this situation, by this method it was possible to calculate the number of passenger vehicles in year A + T , without having to calculate intermediate values, between year A and year A+T, because it is sufficient to calculate n x T .
Table A2. Number of passenger cars in EU28 Countries 2012–2017, approximations for 2018–2019, and forecasted values for 2020–2021.
EU28 Countries2012201320142015201620172018201920202021
Belgium5,444,0005,493,4725,555,4995,623,5795,712,0615,785,4475,863,1995,941,9966,021,8536,102,782
Bulgaria2,807,0002,910,2353,013,8633,162,0373,143,5682,770,6152,887,8913,010,1313,137,5453,270,352
Czechia4,706,0004,729,1854,833,3865,115,3165,307,8085,538,2225,679,1325,823,6275,971,7996,123,741
DenmarkN/A2,278,1212,329,5782,390,8232,465,5382,530,0472,597,2782,666,2962,737,1482,809,883
Germany43,431,00043,851,00044,403,00045,071,00045,803,56046,474,59447,085,61447,704,66748,331,86048,967,298
Estonia602,100628,565652,950676,596703,151725,944752,362779,742808,118837,527
Ireland1,951,1301,984,5502,018,3102,060,1702,102,7202,142,3902,180,7662,219,8292,259,5922,300,067
Greece5,167,5575,124,2085,110,8735,107,6205,160,0565,235,9285,318,4155,402,2015,487,3085,573,755
Spain22,248,00022,025,00022,029,51222,355,54922,876,83023,500,40123,809,29324,122,24624,439,31224,760,545
France32,132,00032,858,00032,531,00032,326,00032,076,00032,005,98632,373,57332,745,38233,121,46133,501,859
Croatia1,445,0001,448,0001,474,0001,499,8021,552,9041,596,0871,628,2481,661,0581,694,5281,728,673
Italy37,078,00036,963,00037,080,75337,351,23337,876,13838,205,65138,538,03138,873,30339,211,49139,552,621
Cyprus475,000474,561478,492487,692508,284526,617538,083549,799561,770574,001
Latvia618,270634,600657,799679,048664,177689,536709,280729,590750,481771,970
Lithuania1,753,4071,808,9821,205,6681,244,0631,298,7371,356,9871,396,3241,436,8011,478,4521,521,310
Luxembourg355,900363,247372,827381,103390,935403,282412,655422,246432,060442,101
Hungary2,986,0303,040,7323,107,6953,196,8563,313,2063,471,9973,564,2903,659,0363,756,3013,856,152
Malta249,612256,096265,950275,380282,921291,664299,549307,648315,965324,508
Netherlands7,916,0007,932,2907,979,0838,100,8648,222,9748,373,2448,471,1968,570,2948,670,5518,771,981
Austria4,584,0004,641,3084,694,9214,748,0484,821,5574,898,5784,971,9765,046,4735,122,0865,198,833
Poland18,744,00019,389,44620,003,86320,723,42321,675,38822,503,57923,360,46324,249,97525,173,35826,131,900
Portugal4,259,0004,327,4784,699,6454,722,9634,850,2295,059,4725,212,4295,370,0105,532,3555,699,608
Romania4,487,0004,696,0004,908,0005,155,0005,340,8665,533,4335,732,9435,939,6476,153,8036,375,681
Slovenia1,066,0301,063,8001,068,3601,078,7401,096,5231,117,9351,129,1631,140,5041,151,9591,163,529
Slovakia1,824,2001,879,8001,949,1002,034,5742,121,7742,223,1172,314,9172,410,5082,510,0472,613,696
Finland3,037,0003,105,8343,172,7353,234,8603,322,6723,398,9373,487,0573,577,4613,670,2103,765,362
Sweden4,446,3494,494,6614,584,7114,668,2624,767,2624,844,8234,912,2084,980,5305,049,8025,120,038
United Kingdom28,722,000N/AN/A30,250,29430,850,44031,200,18231,499,15631,800,99532,105,72732,413,378
Total EU28242,535,585218,402,171220,181,573253,720,895258,308,279262,404,695266,725,493271,141,997275,656,942280,273,154
Source: Eurostat 2012–2017 and own calculation method for 2018–2021 applied on Eurostat data.
Table A3. Forecasted number of passenger vehicle in EU28, for 2020–2029.
EU Countries2020202120222023202420252026202720282029
Belgium6,021,8536,102,7826,184,7996,267,9186,352,1556,437,5236,524,0396,611,7176,700,5746,790,625
Bulgaria3,137,5453,270,3523,408,7813,553,0703,703,4663,860,2284,023,6254,193,9394,371,4624,556,499
Czechia5,971,7996,123,7416,279,5486,439,3206,603,1576,771,1626,943,4427,120,1067,301,2647,487,031
Denmark2,737,1482,809,8832,884,5502,961,2023,039,8903,120,6703,203,5963,288,7263,376,1183,465,832
Germany48,331,86048,967,29849,611,09050,263,34750,924,17951,593,70052,272,02352,959,26453,655,54054,360,971
Estonia808,118837,527868,006899,594932,332966,2611,001,4251,037,8691,075,6391,114,783
Ireland2,259,5922,300,0672,341,2682,383,2062,425,8952,469,3502,513,5822,558,6072,604,4382,651,091
Greece5,487,3085,573,7555,661,5645,750,7575,841,3545,933,3796,026,8546,121,8016,218,2446,316,206
Spain24,439,31224,760,54525,086,00125,415,73525,749,80326,088,26226,431,16926,778,58427,130,56527,487,173
France33,121,46133,501,85933,886,62734,275,81334,669,46935,067,64635,470,39635,877,77236,289,82636,706,613
Croatia1,694,5281,728,6731,763,5061,799,0411,835,2921,872,2731,910,0001,948,4861,987,7492,027,802
Italy39,211,49139,552.62139,896,71940,243,81140,593,92340,947,08041,303,30941,662,63842,025,09342,390,701
Cyprus561,770574,001586,499599,269612,317625,650639,272653,191667,413681,945
Latvia750,481771,970794,075816,813840,202864,260889,007914,463940,648967,583
Lithuania1,478,4521,521,3101,565,4101,610,7891,657,4831,705,5311,754,9721,805,8461,858,1951,912,061
Luxembourg432,060442,101452,377462,891473,649484,658495,922507,448519,242531,310
Hungary3,756,3013,856,1523,958,6574,063,8864,171,9134,282,8114,396,6574,513,5304,633,5094,756,677
Malta315,965324,508333,281342,292351,546361,050370,812380,837391,133401,708
Netherlands8,670,5518,771,9818,874,5988,978,4159,083,4479,189,7079,297,2109,405,9719,516,0049,627,325
Austria5,122,0865,198,8335,276,7295,355,7935,436,0415,517,4915,600,1625,684,0725,769,2395,855,682
Poland25,173,35826,131,90027,126,94228,159,87329,232,13630,345,22731,500,70332,700,17633,945,32335,237,882
Portugal5,532,3555,699,6085,871,9176,049,4356,232,3206,420,7346,614,8456,814,8237,020,8477,233,100
Romania6,153,8036,375,6816,605,5596,843,7257,090,4787,346,1287,610,9967,885,4148,169,7268,464,289
Slovenia1,151,9591,163,5291,175,2161,187,0191,198,9411,210,9831,223,1461,235,4311,247,8391,260,372
Slovakia2,510,0472,613,6962,721,6242,834,0102,951,0363,072,8953,199,7853,331,9163,469,5023,612,771
Finland3,670,2103,765,3623,862,9823,963,1334,065,8804,171,2914,279,4344,390,3824,504,2064,620,980
Sweden5,049,8025,120,0385,191,2515,263,4545,336,6625,410,8875,486,1455,562,4505,639,8165,718,259
United Kingdom32,105,72732,413,37832,723,97833,037,55433,354,13433,673,74933,996,42634,322,19534,651,08534,983,128
Total EU28275,656,942280,273,154284,993,556289,821,164294.759,100299,810,586304,978,955310,267,653315,680,239321,220,397
Source: Own calculation method, applied on Eurostat data, 2019.

References

  1. Škorput, P.; Mandžuka, S.; Jelušić, N. Real-time Detection of Road Traffic Incidents. Promet Traffictransportation 2012, 22, 273–283. [Google Scholar] [CrossRef] [Green Version]
  2. Lisi, M. Saving human lives on European roads by eCall with EGNOS and Galileo. MediaGEO 2016, 20, 12–15. [Google Scholar]
  3. Ponte, G.; Ryan, G.A.; Anderson, R.W.G. An estimate of the effectiveness of an in-vehicle automatic collision notification system in reducing road crash fatalities in South Australia. Traffic Inj. Prev. 2016, 17, 258–263. [Google Scholar] [CrossRef] [PubMed]
  4. Öörni, R.; Hautala, R.; Hänninen, T.; Lumiaho, A. eCall Implementation Roadmap for Finland. In Proceedings of the 13th International Conference on ITS Telecommunications, Tampere, Finland, 5–7 November 2013; IEEE: Piscataway, NJ, USA, 2013; pp. 356–361. [Google Scholar] [CrossRef]
  5. Eurostat. 31 January 2020. Modal split of freight transport and Modal split of passenger transport. Available online: tran_hv_frmod,antrand_hv_psmod (accessed on 5 February 2020).
  6. Kaltenegger, A.; Salamon, B.; Furian, G. European road safety policy 2016–2020: A forecast on topics and activities. Acad. Res. Communities Publ. 2018, 2, 8. [Google Scholar] [CrossRef] [Green Version]
  7. Mladineo, N.; Knezic, S.; Jajac, N. Decision Support System for emergency management on motorway networks. Transportmetrica 2011, 7, 45–62. [Google Scholar] [CrossRef]
  8. European Commission. Directorate-General for Mobility and Transport (DG MOVE). In Transport in the European Union—Current Trends and Issue. March 2019. Available online: https://ec.europa.eu/transport/themes/infrastructure/news/2019-03-13-transport-european-union-current-trends-and-issues_en (accessed on 31 October 2019).
  9. World Health Organization. Global Status Report on Road Safety 2018; World Health Organization: Geneva, Switzerland, 2018. [Google Scholar]
  10. European Transport Safety Council (ETSC). Ranking EU Progress on Road Safety. 13th Road Safety Performance Index Report. Adminaité-Fodor, D., Heilpern, C., Jost, G., Eds.; June 2019. Available online: https://etsc.eu/wp-content/uploads/AR_2019-Final.pdf (accessed on 2 October 2019).
  11. European Commission. Handbook on the External Costs of Transport, Version 2019; van Essen, H., van Wijngaarden, L., Schroten, A., Sutter, D., Bieler, C., Maffii, S., Brambilla, M., Fiorello, D., Fermi, F., Parolin, R., et al. January 2019. Available online: https://ec.europa.eu/transport/sites/transport/files/studies/internalisation-handbook-isbn-978-92-79-96917-1.pdf (accessed on 31 October 2019).
  12. United Nation Economic Commission for Europe. Road Traffic Fatalities and Injuries. Available online: https://w3.unece.org/PXWeb2015/pxweb/en/STAT/STAT__40-TRTRANS__01-TRACCIDENTS/01_en_TRAccTotal_r.px/ (accessed on 15 November 2019).
  13. European Commission (19 June 2019). EU Road Safety Policy Framework 2021–2030—Next Steps towards “Vision Zero”. Commission Staff Working Document. Staff working paper. Available online: https://ec.europa.eu/transport/sites/transport/files/legislation/swd20190283-roadsafety-vision-zero.pdf (accessed on 23 September 2019).
  14. Jarašūnienė, A.; Jakubauskas, G. Improvement of road safety using passive and active intelligent vehicle safety systems. Transport 2007, 22, 284–289. [Google Scholar] [CrossRef] [Green Version]
  15. Vaitkus, A.; Strumskys, M.; Jasiuniene, V.; Jateikienė, L.; Andriejauskas, T.; Skrodenis, D. Effect of Intelligent Transport Systems on Traffic Safety. Baltic J. Road Bridge Eng. 2016, 11, 136–143. [Google Scholar] [CrossRef]
  16. Weinlich, M.; Kurz, P.; Blau, M.B. Significant acceleration of emergency response using smartphone geolocation data and a worldwide emergency call support system. PLoS ONE 2018, 13, e0196336. [Google Scholar] [CrossRef] [PubMed] [Green Version]
  17. Jones, M.V.; Coviello, N.; Tang, Y.K. International entrepreneurship research (1989–2009): A domain ontology and thematic analysis. J. Bus. Ventur. 2011, 26, 632–659. [Google Scholar] [CrossRef]
  18. Rasmussen, E.S.; Madsen, T.K.; Servais, P. On the foundation and early development of domestic and international new ventures. J. Manag. Gov. 2012, 16, 543–556. [Google Scholar] [CrossRef]
  19. Madsen, T.K.; Sørensen, H.E.; Torres-Ortega, R. The market orientation of domestic and international new ventures. In Entrepreneurship in International Marketing; Emerald Group Publishing Limited: Bingley, UK, 2015; pp. 21–44. [Google Scholar] [CrossRef]
  20. Crespo, N.F.; Aurélio, D. Between domestic and international new ventures: The relevance of entrepreneurs and firms characteristics. Eur. J. Int. Manag. 2020, 14, 28–54. [Google Scholar] [CrossRef]
  21. Chehade, S.; Matta, N.; Pothin, J.B.; Cogranne, R. Situation representation and awareness for rescue operations. In Proceedings of the 16th International Conference on Information Systems for Crisis Response and Management, Valencia, Spain, 19–22 May 2019; pp. 1–12. [Google Scholar] [CrossRef]
  22. Mladineo, N.; Knezic, S.; Jajac, N. Systemic approach to the integration of motorway networks into European emergency number 112. Int. J. Emerg. Manag. 2007, 4, 72–87. [Google Scholar] [CrossRef]
  23. Seppänen, H.; Mäkelä, J.; Luokkala, P.; Virrantaus, K. Developing shared situational awareness for emergency management. Saf. Sci. 2013, 55, 1–9. [Google Scholar] [CrossRef]
  24. Urbano, M.; Alam, M.; Ferreira, J.; Fonseca, J.; Simíões, P. Cooperative Driver Stress Sensing Integration with eCall System for Improved Road Safety. In Proceedings of the IEEE EUROCON—17th International Conference on Smart Technologies, Ohrid, North Macedonia, 6–8 July 2017; IEEE: Piscataway, NJ, USA, 2017; pp. 883–888. [Google Scholar] [CrossRef]
  25. Gelmini, S.; Panzani, G.; Savaresi, S. Analysis and development of an automatic eCall for motorcycles: A one-class cepstrum approach. In IEEE International Conference on Intelligent Transportation Systems-ITSC Proceedings of the 2019 IEEE Intelligent Transportation Systems Conference (ITSC), Auckland, New Zealand, 27–30 October 2019; IEEE: Piscataway, NJ, USA, 2019; pp. 3025–3030. [Google Scholar]
  26. Zhang, S.; Guo, H.; Zhu, K.; Yu, S.; Li, J. Multistage assignment optimization for emergency rescue teams in the disaster chain. Knowl. Based Syst. 2017, 137, 123–137. [Google Scholar] [CrossRef]
  27. Matveev, A.; Maksimov, A.; Vodnev, S. Methods improving the availability of emergency-rescue services for emergency response to transport accidents. Transp. Res. Procedia 2018, 36, 507–513. [Google Scholar] [CrossRef]
  28. ACEA European Automobile Manufacturers Association (5 December 2019). ACEA Report Vehicle in Use—Europe 2019. Available online: https://www.acea.be/publications/article/report-vehicles-in-use-europe-2019 (accessed on 3 January 2020).
  29. European Commission (8 September 2011). Impact Assessment—Commission Recommendation on support for an EU-wide eCall service in electronic communication networks for the transmission of in-vehicle emergency calls based on 112 (‘eCalls’). Commission Staff Working Paper, Part 1, European Commission, Brussels, 8.9.2011. Available online: https://edz.bib.uni-mannheim.de/edz/pdf/sek/2011/sek-2011-1019-1-en.pdf (accessed on 26 September 2019).
  30. Ryberg, T. eCall—A Socioeconomic Benefit Cost Analysis. Industry Research Whitepaper Berg Insight 2007. Available online: http://www.lbsinsight.com/filearchive/9/913/Berg%20Insight%20eCall%20socioeconomic%20analysis.pdf (accessed on 21 September 2019).
  31. McClure, D.; Forestieri, F.; Rooke, A. Achieving a Digital Single Market for Connected Cars. eCall–Implementation Status, Learning and Policy Recommendations, 2016. Available online: https://www.vodafone.com/content/dam/vodcom/files/public-policy/ecall-report-final.pdf (accessed on 15 October 2019).
  32. Boardman, A.; Greenberg, D.; Vining, A.; Weimer, D. Cost Benefit Analysis. In Concepts and Practice, 5th ed.; Cambridge University Press: Cambridge, UK, 2018; ISBN 9781108401296. [Google Scholar]
  33. Corazza, M.V.; Musso, A.; Finikopoulos, K.; Sgarra, V. An analysis on health care costs due to accidents involving powered two wheelers to increase road safety. Transp. Res. Procedia 2016, 14, 323–332. [Google Scholar] [CrossRef] [Green Version]
  34. HeERO, Harmonised eCall European Pilot. D6.4 Implementation Roadmap and Guidelines for eCall Deployment in Europe. Öörni, R. 2014. Available online: http://www.heero-pilot.eu/ressource/static/files/heero_d6.4-ecall-guidelines_v1.1.pdf (accessed on 29 November 2019).
  35. Posner, E.A.; Adler, M.D. Rethinking Cost-Benefit Analysis. Journal Articles 1999. University of Chicago Law School, Chicago Unbound, Faculty Scholarship. Available online: https://chicagounbound.uchicago.edu/cgi/viewcontent.cgi?article=2755&context=journal_articles (accessed on 21 October 2019).
  36. Directorate-General for Mobility and Transport; Directorate DG—MOVE; Unit C2—Road Safety; European Commission B-1049 Brussels. Study on the Inclusion of eCall in the Periodic Roadworthiness Testing of Motor Vehicles: Final Report. MOVE/C2/SER/2017-282-SI.772101. Schulz, W.H.; Schröder, R.; Bönninger, D.; Fernández, E.; Gaillet, J.F.; Sogodel, V.; Scheler, S. Eds. 2019; Available online: https://citainsp.org/wp-content/uploads/2019/02/eCall.pdf (accessed on 8 October 2019).
  37. Persky, J. Retrospectives. Cost-Benefit Analysis and the Classical Creed. J. Econ. Perspect. 2001, 15, 199–208. [Google Scholar] [CrossRef] [Green Version]
  38. Van Wassenhove, L.N.; Pedraza Martinez, A.J. Using OR to adapt supply chain management best practices to humanitarian logistics. Int. Trans. Oper. Res. 2010, 19, 307–322. [Google Scholar] [CrossRef]
  39. Ahmad, F.; Widén, G. ‘Knowledge sharing and language diversity in organisations: Influence of code switching and convergence. Eur. J. Int. Manag. 2018, 12, 35–372. [Google Scholar] [CrossRef]
Figure 1. Block Chart summarizing the methodology of CBA.
Sustainability 12 05341 g001
Figure 2. Rate of road fatalities in EU27+UK, related to previous year (%). Source: UNECE and ETSC Statistics, 2019.
Sustainability 12 05341 g002
Figure 3. Rate of severe road injuries in EU27+UK, related to previous year (%). Source: UNECE and ETSC Statistics, 2019.
Sustainability 12 05341 g003
Figure 4. Forecasted number of passenger vehicles EU27+UK, 2020–2029 (Million). Source: Own calculation method, applied on Eurostat data, 2019.
Sustainability 12 05341 g004
Table 1. Average weight of passenger vehicles, by age, in EU25 (2013–2017).
No.Age of Passenger Vehicles (Years)Average Weight (%)
1Less than two years11
2From two to five years16
3From five to ten years27
4From ten to twenty years37
5Over twenty years9
6Total100
Source: Own calculations, based on Eurostat data, 2019.
Table 2. Road fatalities and severe injuries in EU27+UK (2010–2018).
Year2010201120122013
Fatalities31,98031,18328,74126,379
Total injured1,508,0551,485,0401,4256421,395,432
Severe injuries *215,870223,146227,415219,738
Slight injured1,292,1851,261,8941,198,2271,175,694
Year2014201520162017
Fatalities26,46026,64526,07225,567
Total injured1,419,9801,428,9911,433,3011,409,993
Severe injuries *228,939230,293234,784231,857
Slight injured1,191,0411,198,6981,198,5171,178,136
Note: Without Italy. Source: UNECE and ETSC Statistics, 2019 and own calculations for slightly injured. * The “Severe injuries” are reported by each country, according to their own national definitions.
Table 3. Cost categories associated with road fatalities and injuries.
No.Cost TypeSignificance
1OutsourcedAssociated with the expenses of stakeholders involved in rescue chain (firefighters, police, medical services, others). Only a part of this category is introduced in total cost, to calculate the benefits.
2InternalizedGenerally, they are supported by the payment of insurance premiums. This category is not included in total cost.
3HumanThe pain and suffering that are caused on the people affected by the accident.
4MedicalExpenditures for medical care in hospitals and rehabilitation centers, until the full recovery of the person severely injured, or death (50% are outsourced).
5AdministrativeExpenditures for non-medical emergency services involved in operations and legal assistance (30% are outsourced).
6ProductionGenerated by the temporary or permanent inability to carry out an economic activity (as owner or employee) or other types of activities. It affects both the injured person and the company he/she owns, or where he/she is employed (55% are outsourced).
7MaterialGenerated by the destruction of vehicles, roads, street decorations, goods from vehicles, etc. (100% are internalized).
8Other costsGenerated by traffic jam, the impossibility of using the vehicles for a period, because they are damaged, the transport and the funeral of the deceased person, etc. Not included separately in total cost.
Source: European Commission (EC), Handbook on the external costs on transports. Version 2019 (pp. 32–33).
Table 4. Annual equipped vehicles with eCall IVS, in EU27+UK, 2020–2029.
Year20202021202220232024
Equipped vehicles24,809,12525,224,58425,649,42026,083,90526,528,319
Year20252026202720282029
Equipped vehicles26,982,95327,448,10627,924,08928,411,22228,909,836
Source: Own calculation method, applied on Eurostat data, 2019.
Table 5. Annual costs of eCall IVS and PSAPs modernization (€), in EU27+UK, 2020–2029.
Year20202021202220232024
Costs1,863,764,3591,264,309,1931,285,551,0021,307,275,2381,329,495,950
Year20252026202720282029
Costs1,352,227,6371,375,485,2981,399,284,4391,423,641,0761,448,571,787
Source: Own calculations, based on Table 4 and HeERO, Harmonized eCall European Pilot [21].
Table 6. BCR of eCall IVS and PSAPs modernization, EU27+UK, 2020 – 2029.
Year20202021202220232024
Costs1,863,764,3591,264,309,1931,285,551,0021,307,275,2381,329,495,950
Benefits1,520,269,8481,520,269,8481,520,269,8481,520,269,8481,520,269,848
z0.9520.9070.8640.8230.784
C’ (€)1,774,303,6691,146,728,4381,110,716,0661,075,887,5211,042,324,825
B’ (€)1,520,269,8481,520,269,8481,520,269,8481,520,269,8481,520,269,848
BCR0.81.21.21.21.1
Year20252026202720282029
Costs1,352,227,6371,375,485,2981,399,284,4391,423,641,0761,448,571,787
Benefits1,520,269,8481,520,269,8481,520,269,8481,520,269,8481,520,269,848
z0.7460.7110.6770.6450.614
C’ (€)1,008,761,817977,970,047947,315,565918,248,494889,423,077
B’ (€)1,520,269,8481,520,269,8481,520,269,8481,520,269,8481,520,269,848
BCR1.11.11.11.11.0
Source: Own calculations, based on Table 4.

