Abstract
Since total factor productivity growth plays an essential role in China’s economic growth, the source of this growth has been a critical issue over the past decades. Hence, this paper applies an input slack-based productivity (ISP) index to investigate the contributors (i.e., labor and capital inputs) to China’s total factor productivity growth. The ISP index, combining the features of the directional distance function and Luenberger productivity index, can calculate the productivity change of each input factor under the total factor framework. According to the decomposition analyses, we find that China is confronting a dual challenge in total factor productivity growth: first, capital productivity growth exhibits a remarkable slowdown after the mid-1990s; second, although labor productivity continually expands, the relative labor efficiency among provinces has deteriorated since the 2000s. The results imply that the government should not only advocate upgrading industrial structure, but also consider balanced regional development policies for China’s sustainable growth.
1. Introduction
Since the beginning of its economic reforms in 1978, China has experienced persistently high growth and has created a well-known economic miracle. To date, China is the world’s second largest country in terms of GDP, and according to the estimate provided by IMF (International Monetary Fund), China will transcend the United States to become the largest country based on a purchasing-power-parity (PPP) valuation in 2019. Holz [1] forecasts that, under most scenarios, China’s GDP will surpass that of the U.S. in the next decade, though the time period may be delayed when calculated in terms of per capita GDP. Hence, over the last few decades the literature has widely investigated what has been driving China’s strong economic growth.
One main strand of the literature considers that total factor productivity growth (TFPG) plays an important role in China’s economic growth. For instance, Chow and Li [2], Islam et al. [3] and Li and Liu [4] find that the contribution from TFPG to economic growth accounts for over 30% in the case of China. Using panel data at the industrial level, Chen et al. [5] suggest that the contribution share of TFPG is higher than 50% during 1981–2008. More recently, Shen et al. [6] present that China’s TFPG increases by 4.6% annually and the corresponding contribution rate is 42.6% after 1978. Some researchers further note a periodic fluctuation in the contribution from TFPG to economic growth, such as [4]. In fact, Tian and Yu [7] review 150 studies on TFPG in China and conclude that from 1978 there have been three cycles in which each cycle lasts about 10 years. You and Sarantis [8] also detect two structure breaks in China’s TFPG (one in 1989 and the other in 1995). Therefore, research on TFPG is quite meaningful in order to better understand how it has influenced China’s economic growth.
Although input growth contributes to China’s economic growth much more than TFPG, there are two potential risks related to sustainable input growth documented in recent years. First, since the mid-to-late 1990s China’s government policy has supported extraordinary investment growth, such as spending on large-scale infrastructure projects and encouraging both domestic and foreign investments [9]. Using a longer panel dataset from 1978–2014, Shen et al. [6] found out that the contribution from capital accumulation to economic growth accounts for 45.35%. Hence, they conclude that capital accumulation is the primary contributor to China’s economic growth. However, Zheng et al. [9] argue that after the mid-1990s China’s economic growth increasingly relies on capital accumulation, yet since the mid-2000s the government has started to cool off the investment boom. With respect to economic restructuring during the 12th Five-Year Plan period (2011–2015), the central government’s targets are to promote domestic consumption and ensure a reasonable capital formation rate. Therefore, the extensive growth of capital in the future may not be sustained as it was in the past.
The second potential risk relates to population dynamics (or demographic transition), which have played an essential role in the East Asian miracle during 1965–1990 [10]. The recent literature sheds light on the diminishing “demographic dividend” in China, with Cai and Lu [11] suggesting its decline started from 2010. Ogawa and Chen [12] further find that the demographic dividend will actually turn negative in 2014. Wang et al. [13] present that population aging has a positive impact on equality. As a consequence, labor growth has also become a potential risk for sustainable input growth. One way to offset the potentially unfavorable slowdown of input growth is to enhance the contributive share of TFPG to economic growth [11,14]. This is another reason motiving us to investigate TFPG’s structural changes in China.
There are two widely used approaches to empirically estimate TFPG. The first is the Solow residual method that estimates TFPG by removing the contributions from all inputs to output growth [15]. Based on the Solow residual method, TFPG is equal to the residual after subtracting the growth rate of aggregate input from the growth rate of total output. The second method refers to the frontier production function approach, which allows an inefficiency effect in the production function estimation. More specifically, the frontier production function can be estimated by a non-parametric approach, called data envelopment analysis (DEA), or a parametric approach, called stochastic frontier approach (SFA). The advantages and drawbacks of the Solow residual method and the frontier production function approach are well-documented in many articles [7,16,17].
Instead of measuring TFPG, there is a more important question: What are the sources of TFPG in China? In terms of the Solow residual method, TFPG should be equal to the technical progress based on the method’s assumptions. The frontier production function approach can further decompose TFPG into technical progress, efficiency improvement, and the effect from economies of scale [18]. In the case of China, most studies conclude that technical progress is the major contributor to TFPG, while technical efficiency improvement has a very low impact and may even be a negative factor [4,19]. However, the above-mentioned methods are aggregation measurements, meaning that these methods cannot deal with the productivity change of a single factor (such as labor and capital inputs) under the total factor framework. As such, these methods may fall short of some insights if we want to further attribute TFPG to the productivity change of each input factor.
The present paper applies a new decomposition method first proposed by Chang et al. [20] and aims to re-estimate TFPG and the productivity change of each input factor in China simultaneously. The method used, which is the so-called input slack-based productivity (ISP) index, combines the features of the input-oriented directional distance function and the Färe–Lovell efficiency measure to extend the Luenberger productivity index (LPI). The ISP index is deemed to be one kind of frontier production function approach, improving the conventional DEA methods through its more flexible settings. To our best knowledge, no study in the literature has employed the ISP index to investigate the detailed components of TFPG in China’s economic miracle.
The present paper fills this gap in the literature through three aspects. First, previous studies discuss the trends of (partial) capital and labor productivity growth in China. This paper simultaneously estimates capital and labor productivity growth under a total factor framework. Second, we not only realize the technical progress and efficiency improvement behind TFPG, but also answer the question about which input factor is the main source of TFPG in China. Hence, using the new decomposition technique, this paper can find whether China’s TFPG is driven by labor or capital productivity growth. Third, with provincial-level panel data, this study explicitly analyzes national, regional, and provincial TFPGs and their corresponding components in order to explore the sources of each province’s TFPG, efficiency change, and technical progress.
2. Methodology
2.1. Decomposing Total Factor Productivity Growth
The input slack-based productivity (ISP) index, proposed by [20], extends a well-known Luenberger productivity index via combining the input-oriented directional distance function and the Färe–Lovell efficiency measure. The key feature of the ISP index is that it can evaluate TFPG and each input productivity growth simultaneously. In the following, we introduce the conventional Luenberger productivity index and then illustrate how to compute the ISP index by using a linear programming method.
We first assume a two-input and one-output production process following the previous literature. In other words, each province employs labor (L) and capital (K) inputs to generate GDP (Y). The possible technology set, Pt, can be defined as the transformation of inputs into output at time t:
The Luenberger productivity index, initially proposed by [21], is built on the feature of the directional distance function. Because this paper investigates input-oriented productivity growth, we define the input-oriented directional distance function as:
where (gL, gK) is the directional vector with non-zero elements. Hence, this function implies the contraction of the directional vector by a scalar β in order to catch up with the production frontier. Note that is always larger than or equal to zero. Moreover, if and only if (Lt,Kt) is on the production frontier. Thus, according to Boussemart et al. [22], we measure TFPG based on the input-oriented LPI by:
Here, () denotes the directional distance function measured by the input–output combination at time t + 1 (t) under the technology set Pt (Pt+1). If the LPI is less than, equal to, or greater than zero, then it represents TFPG declines, does not change, or expands from period t to period t + 1, respectively.
The directional distance function is empirically calculated by solving a linear programming problem, but one critical issue is how to choose an appropriate directional vector. Most existing studies assume a special case, i.e., (gL, gK) is equal to (Lt, Kt). Hence, a directional distance function is equivalent to a proportional distance function, which is not able to find a strong efficient vector on the production frontier [20]. To deal with this concern, Chang et al. [20] construct an input slack-based productivity (ISP) index that integrates the Färe–Lovell efficiency measure into the calculation of the directional distance function. Färe–Lovell efficiency has been proven to possess higher discrimination than traditional measures [23]. In addition, the ISP index can compute the growth of total factor productivity and input factor productivity simultaneously.
Following the input–output setting mentioned above, we suppose there are N provinces and define the input and output variables for the j-th province in time t as , , and , respectively. According to [20], the input-oriented directional distance functions for the o-th province in time t are stated as the following linear programming problems:
Here, λj is the intensity variable that serves to form a convex combination of observed input and output variables. Thus, βL and βK represent the contraction ratio for labor and capital inputs in order to catch up to the frontier on each dimension. Moreover, it implies that = 0 if and only if βL = βK = 0.
When all components in Equation (3) are obtained, a Luenberger productivity index with a Färe–Lovell efficiency measure has been established. It is noteworthy that the other three directional distance functions in Equation (3) can be calculated in the same manner based on Equation (4). Furthermore, since is the arithmetic mean of βL and βK, βL and βK can be respectively defined as and . Hence, we simultaneously evaluate labor and capital productivity growths (LPG and KPG hereafter) through the following calculations:
The literature addresses two good behaviors of this decomposition. First, each input’s productivity growth can be further decomposed into its efficiency improvement and technical progress For example, the efficiency improvement of each input can be calculated by . Hence, one can recognize the main force behind LPG and KPG, respectively. Second, it is proven that TFPG is equivalent to the arithmetic mean of LPG and KPG. The efficiency improvement (technical progress) of TFPG is also equal to the arithmetic mean of the efficiency improvement (technical progress) of LPG and KPG. Therefore, we represent these advantages as follows:
where EFFCH and TECHCH, respectively, denote efficiency change and technical change. The subscript L and K represent the efficiency change or technical change for LPG and KPG. It is noteworthy that Equation (7) implies that the elasticities of labor and capital are both 0.5. One can modify the objective function of Equation (4) to adjust the elasticities of labor and capital.
2.2. Data Sources
This paper collects a balanced panel dataset for China’s 29 provinces covering the period from 1985 to 2009. We exclude Tibet due to unavailable data and Chongqing is combined with Sichuan since data on its capital stock is unavailable before 1997. Provincial GDP denotes the only output variable, while labor input and capital stock are the two input variables used in this study. The data for provincial GDP come from the China Compendium of Statistics and China Statistical Yearbook. Although some reports argue that the official GDP data is overly optimistic and invalid. For example, the Financial Times argues that China’s economy is 12% smaller than official data say. However, the proposed approach calculates the relative efficiency and productivity growth among provinces. Hence, we consider that our conclusions would be unchanged even if the data present a systematically upward bias. Labor input is measured by the working population in each province and also collected from the China Compendium of Statistics and China Statistical Yearbook. Some studies in the literature argue that working time with standard labor intensity should be used rather than working population [7]. Unfortunately, China’s data for working time are unavailable. Thus, we use the working population as a proxy for labor input. There are no official statistics for capital stock. We thus acquire data for provincial capital stock from 1985 to 2006 from Shan [24], who estimates China’s capital stock at the province level from 1952 to 2006 via a perpetual inventory approach, and we then update the data to 2009 based on Shan’s approach. Wu et al. [25] review 28 studies dealing with the capital stock estimation of China. Based on their review, Shan [24] is the most important literature in estimating the provincial capital stock of China. Shan [24] uses a perpetual inventory method, and capital stock in year t (Kt) is calculated by Kt = Kt−1(1 − δ) + It. Where It is gross fixed capital formation in year t, and δ is the depreciation rate and assumed to be 10.96%.. It is noteworthy that all variables with a monetary unit (i.e., provincial GDP and capital stock) are transformed into 1999 prices with GDP deflators.
3. Empirical Results and Discussion
3.1. TFPG at the National Level
Figure 1 shows the annual growth rate of national-level TFP and two input productivity indices. Regarding China’s TFPG, we find that TFPG is always positive with an average growth rate of 3.49% over the research period. Specifically, TFPG is more volatile before the mid-1990s, with two impressive highs in 1988 (5.44%) and 1993 (8.23%). However, it exhibits a downward trend during 1993–1999 even though it becomes stable and displays a slightly upward trend after 2000, except during the recent global financial crisis. In general, the pattern of TFPG agrees with the findings of related literature [4,9,26]. Additionally, the fluctuation of TFPG is like a cycle phenomenon that is consistent with the conclusion of [7].
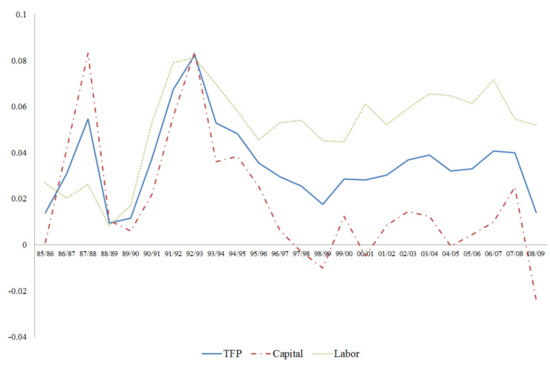
Figure 1.
Annual total factor productivity growth (TFPG) and the two input productivity growths.
This paper applies the ISP index to extract the contributors to TFPG, i.e., labor and capital productivity growths. Figure 1 shows the decomposition results. Over the research period, the average growth rate of labor productivity is 5.11% even though LPG presents a negative value in 1989. However, the average growth rate of capital productivity is only 1.90%. In fact, KPG is always lower than LPG and TFPG after the mid-1990s. Moreover, we find that the trends of LPG and KPG resemble one another before 1993, while there is a discrepancy in these two input productivity after 1993.
Labor productivity experiences sustained high annual growth rates ranging from 4.65% to 7.24% after 1993. One possible explanation is the shift of labor from low-productivity industries (primary industries) to high-productivity industries (e.g., secondary and tertiary industries) [1,9,27]. However, the average KPG from 1993 to 2009 is only 0.95%, indicating its adverse effect on TFPG in China. Therefore, this paper shows that LPG should be the main contributor to TFPG in China’s economy during the past few decades. Nevertheless, China could confront a challenge to near-zero growth in capital productivity, which may be induced by production overcapacity in recent years. This echoes the argument of [9], who consider that China’s growth strategy since the mid-1990s focuses on capital-intensive growth, resulting in a slowdown in TFPG.
With respect to the role of TFPG in China’s GDP growth, we summarize its TFPG to GDP growth during the whole research period and two sub-periods in Table 1. The last column of Table 1 shows the whole sample estimation. On average, GDP increases rapidly at an average rate of 9.95% per year, while average annual TFPG is 3.50% during 1985–2009. Thus, TFPG accounts for 35.24% of China’s growth, which is close to the findings in [3,4]. However, as noted, TFPG slows down after the mid-1990s. In fact, the contribution from TFPG has declined from 40.08% for 1985–1993 to 32.94% for 1993–2009.

Table 1.
Contributions of TFPG, labor productivity growth (LPG), and capital productivity growth (KPG) to GDP growth in China.
Based on our decomposition method, we provide new evidence on the contributions from KPG and LPG to GDP growth. As shown in Table 1, the contribution shares of KPG (19.77%) and LPG (20.31%) are quite close to one another during the first sub-period of 1985–1993. However, comparing the two sub-periods, the average growth rate of labor productivity increases from 3.91% to 5.71%, while the annual average KPG sharply deteriorates from 3.81% to 0.95%. As a result, KPG’s contribution becomes minor relative to that of LPG and accounts for only 4.68% of GDP growth in the second sub-period of 1993–2009. At the same time, the contribution from LPG to GDP growth increases to 28.26% during 1993–2009, once again revealing labor productivity’s importance to China’s economy.
In order to compare with conventional decomposition methods, we further decompose TFPG into technical progress and efficiency improvement and calculate the cumulative changes in Figure 2, which shows China’s TFP accumulatively growing by 127.86% over the research period. The fact that technical progress plays a dominant role in TFPG, i.e., the cumulative technical progress is 128.06%, means that China’s TFPG is mainly driven by technology advancement. Nevertheless, the cumulative efficiency change is negative, indicating that the “catch-up effect” does not exist in China and the imbalance among inefficient and efficient provinces has been serious. The results are in line with most of the literature, such as [4,19,28,29].
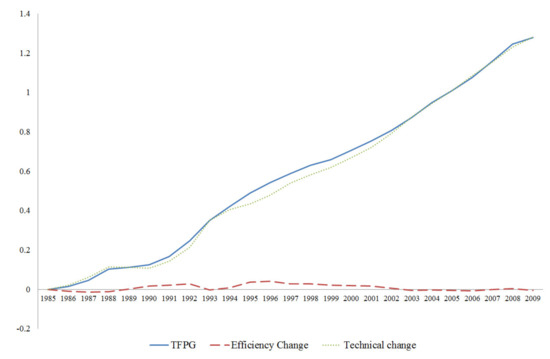
Figure 2.
Cumulative changes of TFP, efficiency improvement, and technical progress.
The ISP index allows us to decompose KPG and LPG into their own efficiency and technology changes, respectively, as listed in Table 2. The components of KPG show that the average efficiency change in capital productivity is −0.07% during 1985–2009. As mentioned by [9], China’s growth model has relied on capital accumulation after the mid-1990s. Our result reveals that there is a remarkable decline in capital efficiency during 1995–2005 that may be induced from the accumulation of capital stock at an extraordinary speed. Fortunately, the technical progress increases by 1.97% per year, which offsets the negative effect of efficiency change and results in positive growth for capital productivity. With respect to the components of LPG, the last two columns of Table 2 indicate that both annual efficiency improvement (0.04%) and technical progress (5.07%) have a positive growth on average. However, it is noted that there seems to be a structure change among two periods of pre- and post-2000s. More specifically, the average growth rate of labor efficiency declines from 0.39% for 1985–2000 to −0.53% for 2000–2009. It is suggested that the efficiency of labor usage has deteriorated in recent years, even though the technical progress of labor usage has continually advanced. Hence, labor efficiency may become a crucial problem for China’s sustainable growth in the near future. This finding implies that the labor efficiency problem cannot be detected if we use a conventional decomposition approach.
Table 2.
Annual changes in technical progress and efficiency improvement.
3.2. TFPG at the Regional Level
We now turn our emphasis to regional level analysis. Regional inequality has long been a well-documented problem in China [30,31,32,33,34]. Since Deng Xiaoping’s “South Trip” in 1992, the government has reinforced the process of China’s economic reforms, but official data present that regional inequality as measured by per capita GDP has gone up rapidly after 1992 [32]. From a productivity perspective, we apply the ISP index to re-examine the unequal growth pattern among different regions in China. Accordingly, 29 provinces are classified into three regions: east (Beijing, Tianjin, Shanghai, Shandong, Hebei, Liaoning, Jiangsu, Zhejiang, Fujian, Guangdong, and Hainan), central (Shanxi, Jilin, Heilongjiang, Anhui, Jiangxi, Henan, Hubei, and Hunan), and west (Inner Mongolia, Sichuan, Guizhou, Yunnan, Shaanxi, Gansu, Guangxi, Qinghai, Ningxia, and Xinjiang).
Figure 3 sketches the cumulative TPFG for each region from 1985 to 2009. As we look at the cumulative TPFG at the end of 2009, the disparity among the three regions is substantial. The east region experiences the highest cumulative TPFG with a total of 212.89%, followed by the central (91.00%) and west (83.99%) regions, in the period between 1985 and 2009. This finding is reasonable and consistent with the works of [7,29], but it is surprising that the west region presents the highest cumulative TPFG relative to the other two before 1990. One possible explanation is that China’s economic reform began in the west and central rural areas [7], but with the advantages of location (easy access to global markets) and policy (special economic zones), the east region accelerated its reform pace and then gained considerable TFPG after the early 1990s.
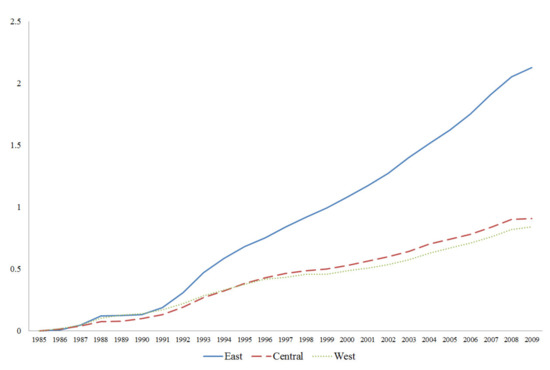
Figure 3.
Cumulative TFPG for the three regions.
As mentioned above, in terms of TFPG the east region presents the highest rate of TFPG, while the west region is the poorest performer. In order to realize the sources of TFPG, Figure 4 illustrates the average TFPG, KPG, and LPG for the three regions. As shown in the figure, with regard to the east region, the annual KPG and LPG, respectively, increase by 2.91% and 6.89% over the research period. The same pattern can be found in the cases of the central and west regions, i.e., LPG is the main contributor to TFPG. Both the average KPG and LPG for the east region are much higher than those for the central and west regions, resulting in a large disparity between the east and the other two regions. In addition, the central region shows the lowest average KPG, while its average LPG is higher than that for the west region. This paper concludes that a regional difference exists not only in TFPG, but also in different factor productivity growths. It is not surprising that the east region has experienced a higher degree of international openness, R&D intensity, and foreign direct investment as a result of higher TFPG. One more key factor is urbanization. Yu et al. [35] find out that urban compactness and TFPG are positively correlated in China, implying that the degrees of urban compactness in the central and west regions are low and result in worse TFPG.
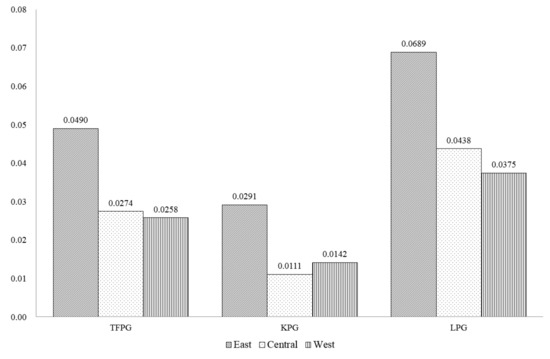
Figure 4.
Average TFPG, KPG, and LPG for the three regions. Source: Authors’ estimation.
Over the past two decades, the central government has implemented several policies to mitigate regional inequality. Two main strategies, called the China Western Development and the Rise of Central China plans, were launched in the 2000s. The China Western Development policy, formally executed in 2000, aims to accelerate the growth of the west region through developing infrastructure, augmenting ecological protection, adjusting industrial structure, promoting science education, and deepening openness [29]. Moreover, during the period of the 11th Five-Year Plan (2006–2010), the Rise of Central China plan was launched to raise the central region’s development, in which the core targets include agricultural modernization and promoting industrialization and urbanization [30]. To gain a better understanding about the benefits of these strategies, we further analyze TFPG and its components through three periods: the whole period (1985–2009), the post-2000 period (2000–2009), and the 11th Five-Year Plan period (2006–2009).
Table 3 lists the average TFPG and the contribution shares of LPG and KPG for the three regions across the three periods. With respect to the whole sample period, all the TFPGs in the three regions are largely driven by LPG, ranging from 70.26% for the east region to 79.80% for the central region. Only the east region presents a positive contribution of labor efficiency to LPG, implying the catch-up effect is only detected there. In addition, it is shown that the contributive share of KPG is lower than LPG for the three regions over the whole research period.
Table 3.
Average TFPG and the contributors’ shares for China’s three regions.
Panel B of Table 3 reports the calculation results in the post-2000 period to examine the benefits of the China Western Development policy. In this period, the west region experienced the lowest TFPG with an average of 2.38% per year. This growth rate is about half of that for the east region, indicating that the China Western Development policy provides limited benefit for the west region and does not harmonize the regional gap. However, one good result reveals that both technical progress and efficiency change of KPG for the west region are positive, even though the sizes are relatively low.
The last panel of Table 3 shows the effect of the Rise of Central China plan on the central region during 2006–2009. The result indicates that the annual TFPG of 2.35% in the central region is the worst relative to the east (4.37%) and west (2.48%) regions after the Rise of Central China plan was launched. As a result, the Rise of Central China plan provides a catch-up effect of KPG for the central region, but is unable to mitigate regional inequality. Thus, we conclude that these two major strategies both fail at regional growth harmonization in terms of TFPG.
The dual challenge in China’s TFPG mentioned above also presents a disparity pattern among the three regions. For the east region, the contribution of KPG to TFPG dramatically declines from 42.64% for 1985–2000 (not reported) to 6.26% for 2000–2009. Capital productivity for the central region presents zero growth during 2000–2009, while KPG accounts for 30.76% of the central region’s TFPG before 2000. As shown in Table 3, the declines of KPG for the east and central regions have become more serious in recent years (2006–2009). Moreover, the contributive shares of technical change in LPG for the two regions are higher than 100%, showing significant labor efficiency deterioration. This problem is more serious in recent years, except for the west region.
3.3. TFPG at the Provincial Level
Table 4 reports TFPG, input factor productivity growth, and their components for each province. We note that all values in Table 4 represent the average annual growth rate from 1985 to 2009. From the TFPG perspective, all 29 provinces enhance their TFP over the research period. Among them, Tianjin gains the highest TFPG at 7.13% annually, followed by Liaoning and Fujian with annual averages of 6.12% and 5.59%, respectively. The three slowest growth rates are earned by Guizhou (1.47%), Gansu (1.56%), and Qinghai (1.67%). It is not surprising that provinces with high (low) TFPG are located in eastern (western) China.
Table 4.
TFPG, input factor productivity growth, and their components for each province.
In regard to KPG at the provincial level, only two provinces experience large annual growth in capital productivity at over 5%. Shanghai has the highest KPG among the 29 provinces, whereby its KPG extremely improves at 10.44% per year on average. Beijing, with a 6.64% KPG annually, is the second best performer in China. However, there are four provinces whose annual KPG rates are less than 0.50%: Jiangsu (0.01%), Anhui (0.16%), Jiangxi (0.26%), and Gansu (0.46%). Furthermore, with respect to provincial LPG, 10 of 29 provinces present rapid growth in labor productivity by more than 5% per year, especially for Tianjin at an 11.60% annual growth rate. Most of them are in eastern China, which is in accordance with the result presented in Figure 4. Guizhou presents the worst LPG by increasing only 1.49% annually on average during 1985–2009.
These results also indicate that the TFPG, KPG, and LPG patterns among the 29 provinces are quite distinct from each other. It would be more meaningful if we pay greater attention to the detailed decomposition results. Liaoning, Shanghai, and Yunnan always stand on the frontiers of both capital and labor input dimensions, resulting in their efficiency changes in TFP, KPG, and LPG being equal to zero. It is reasonable that most innovators are eastern or coastal provinces, except Yunnan. In fact, Yunnan’s economy enormously benefits from the rapid growth of the tobacco industry, which is a high value-added industry. Therefore, Yunnan is calculated as a relative innovator, though its absolute output size is not huge. Twelve provinces’ TFPGs are attributed to both positive efficiency improvement and technical progress, but only four of twelve provinces (i.e., Tianjin, Fujian, Hainan, and Sichuan) present positive changes for capital efficiency, labor efficiency, and technical progress in capital and labor. Additionally, Anhui is the only province whose average technical change in capital is negative (−0.83%) during 1985–2009. It is interesting that LPG is the main driving force behind TFPG for most provinces, while KPG plays a dominating role in TFPG for Beijing and Shanghai. However, we cannot provide a specific explanation to this phenomenon and leave this question for future research.
3.4. A Rising Concern about Labor Efficiency
As mentioned earlier, this study detects a dual challenge in China’s TFPG. The slowdown of capital productivity growth has been well documented in the literature (e.g., [9]). Hence, this subsection further discusses the rising concern about labor efficiency found by our decomposition technique. Actually, labor productivity measured by a partial factor productivity index (such as GDP-to-labor ratio) presents a steadily upward trend in the post-reform period [9,36]. Thus, few studies in the literature emphasize the importance of China’s LPG in recent years, except for [27,33,37]. Unfortunately, their analyses still depend on a partial factor productivity index.
Our LPG measurement is based on a total factor framework and reports a similar upward pattern. However, as shown in Table 2; Table 3, we provide new evidence that labor efficiency has sharply deteriorated in China since 2000, even though the magnitude is not dramatic. Figure 5 sketches the cumulative changes of labor efficiency for the three regions during 2000–2009, showing that all regions present a clear downward trend in labor efficiency. Specifically, the east, central, and west regions have cumulatively decreased by 5.41%, 4.79%, and 3.99%, respectively, resulting in a 4.72% labor efficiency decline for the whole economy over 2000–2009. Furthermore, we can calculate the impact on China’s economic growth. Real GDP has expanded at an average growth rate of 10.50% since 2000, while labor efficiency has annually decreased by 0.53%, indicating a negative impact of −2.52% on economic growth.
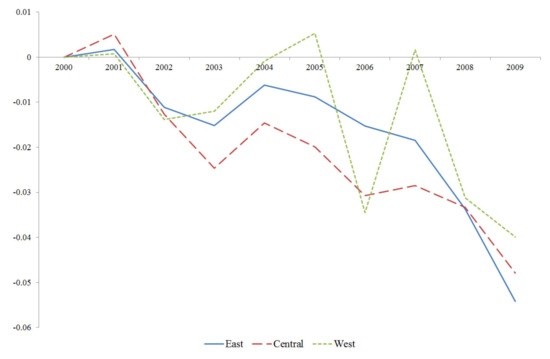
Figure 5.
Cumulative change of labor efficiency among the three regions. Source: Authors’ estimation.
Deterioration in labor efficiency means that labor productivity among the 29 provinces has diverged and gotten farther from the frontier—called the “falling behind effect”. Intuitively, this effect can be attributed to two sources: first, the efficient provinces drop off of the production frontier; second, the inefficient provinces cannot catch up to the frontier. With respect to the former situation, we first identify the “innovators” that really cause the frontier to shift according to the definition in [38] and then list the innovative provinces in Table 5. We find that the number of innovators decreases from seven for 2000–2001 to four for 2008–2009, confirming that the first suggestion is the source of the falling behind effect. Moreover, Beijing, Zhejiang, Fujian, and Guangdong are denoted as innovators in the early 2000s, while they become inefficient provinces in the late 2000s. Among them, Fujian and Zhejiang cumulatively decrease their labor efficiency by 16.15% and 13.38%, respectively. In regard to the second situation, the aforementioned four provinces are located in the east region, and all three regions confront a decline in labor efficiency according to Figure 5. In fact, in the period 2000–2009, only three provinces (Inner Mongolia, Jiangsu, and Sichuan) present a slight improvement in labor efficiency, ranging from 0.21% to 0.97% per year. Hence, we conclude that the deterioration in labor efficiency is a comprehensive problem for China’s whole economy.
Table 5.
Innovative provinces shifting the frontier in the labor dimension.
There are two possible ways to deal with this falling behind problem. The first way is reducing labor redundancy, whereby inefficient provinces can lower their surplus labor to catch up to the frontier. However, from policy makers’ and the government’s perspectives, this is not the best way, because cutting employment may derive all kinds of social problems. The second way is enhancing labor productivity without cutting employment, especially for inefficient provinces. Several actions can be used to improve labor productivity without reducing labor redundancy. For example, promoting education, or so-called human capital, can enhance labor workers’ knowledge so that they can migrate into higher technical and productive activities [39,40,41]. Moreover, Li et al. [39] estimate and show that the ratio of college graduates to population should exceed 32.3%, while only three provinces exceed this threshold value in 2016. It means that the human capital in China is still underdeveloped. Industrial restructuring should be another reasonable way to increase labor productivity. Empirically, employment transformation from low-productivity industries to high-productivity ones results in rapid labor productivity growth in a post-reform period [8,33,37,42]. To date, there is a large amount of labor workers in the primary industries, especially in western and central China. Hence, there is likely strong potential for the west and central regions to improve labor productivity through progressive industrial restructuring.
This paper finally tries to simply estimate how large a benefit the catch-up effect on labor productivity can generate. Since denotes the contraction level of labor input, this directional distance function can be deemed an inefficiency measure. The fact that average inefficiency in 2009 is 0.3786 means that the distance to the frontier in the labor dimension is about 37.86%. Thus, the maximum benefit from the catch-up effect equals 37.86%. Assume that the gap in labor efficiency can be eliminated in ten years, ceteris paribus. Labor efficiency will thus improve by 3.79% per year and result in an increase in TFPG by 1.90% annually. This incremental rise in TFPG is likely equivalent to a contribution from KPG, which accounts for 9.55% of GDP growth during 1985–2009. Moreover, if past trends continue into the future, China’s TFPG will optimistically grow from 3.50% for 1985–2009 to 5.40% for 2009–2019. Therefore, to ensure sustainably high average economic growth of 8%, the aggregate input factor needs to grow by 2.60% per year, which is only half the past growth rate (5.45%). This echoes the arguments of [11,14], whereby enhancing TFPG’s contributive share is an important way to compensate for a potential slowdown of input growth in the future. Notice that the benefit from the catch-up effect of capital productivity can be estimated, but we do not explicitly discuss it here. Actually, the average inefficiency of capital usage is 0.5563, which is higher than that of labor usage. It implies that the benefit from capital efficiency improvement should be larger than what we estimate for labor efficiency.
4. Conclusions
With persistent high growth over the past three decades, China’s economic miracle has attracted a lot of researchers’ attention to investigate the sources of such remarkable growth. The literature suggests that total factor productivity growth (TFPG) plays an important role in China’s economic growth. In addition, the rapid past increases in input factors (i.e., labor and capital) may not be sustainable in the future. Hence, an explicit understanding of the structure and changes of China’s total factor productivity is an essential and important work.
Despite commonly used approaches (such as the Solow residual method and the frontier production function approach), this paper adopts an input slack-based productivity index to estimate TFPG and further decompose it into each input factor’s productivity growth. Specifically, TFPG is simultaneously decomposed into capital and labor productivity growth under a total factor framework. Hence, this new decomposition technique allows us to realize the actual driving force behind China’s TFPG in greater detail.
This paper performs the analyses based on national, regional, and provincial-level data and presents several critical findings according to each level’s analysis. In general, we provide new evidence that China, in recent years, has been confronting a dual challenge in TFPG. One is near-zero growth in capital productivity, and the other is the deterioration of relative labor efficiency. The former challenge reflects an extreme slowdown of capital productivity growth during 1993–2009. We attribute this problem to over-investment and overcapacity after the mid-1990s. The latter challenge represents a falling behind effect in labor productivity during 2000–2009. This finding actually implies that labor productivity among the 29 provinces is diverging. It suggests that the proper solution for eliminating the gap in labor productivity is to promote education and industrial restructuring.
The conclusions presented herein are mainly derived from our decomposition of the model setting. There may be some weaknesses in our analysis that can be improved in the future. For example, first, this study only takes capital and labor as the conventional input factors, whereas some studies define human capital as an additional input in order to separate it from physical capital. Second, this paper assumes that technology exhibits constant returns to scale. Future works can easily extend this assumption into variable returns to scale, which would allow researchers to investigate the scale effect on TFPG. Third, in terms of TFPG decomposition, we assume that the weights of KPG and LPG to TFPG are equal (Equations (4) and (7)), while this assumption may not hold in the long-term. We suggest that unequal and dynamic weights should be a critical issue for future studies. Finally, due to the limitation of the database, this paper can estimate the TFPGs of the provincial level but may miss the information of industrial structure in each province. We suggest that future research uses micro-level data, such as the China Industry Business Performance Database, to precisely find out the problem of China’s TFPG.
Author Contributions
Conceptualization, S.Z., T.-P.C., L.-C.L.; methodology, T.-P.C.; software, T.-P.C.; validation, S.Z., L.-C.L.; formal analysis, T.-P.C.; investigation, S.Z., T.-P.C.; resources, S.Z.; data curation, S.Z., T.-P.C.; writing—original draft preparation, T.-P.C.; writing—T.-P.C.; visualization, T.-P.C.; supervision, L.-C.L.; project administration, S.Z. All authors have read and agreed to the published version of the manuscript.
Funding
The first author thanks partial financial support from the National Natural Science Foundation of China (Grant No. 71673253); The second author thanks financial support from Taiwan’s Ministry of Science and Technology (Grant No. 108-2410-H-224-010; 109-2634-F-126-001).
Conflicts of Interest
The authors declare no conflict of interest.
References
- Holz, C.A. China’s economic growth 1978–2025: What we know today about China’s economic growth tomorrow. World Dev. 2008, 36, 1665–1691. [Google Scholar] [CrossRef]
- Chow, G.C.; Li, K. China’s economic growth: 1952–2010. Econ. Dev. Cult. Chang. 2002, 51, 247–256. [Google Scholar] [CrossRef]
- Islam, N.; Dai, E.; Sakamoto, H. Role of TFP in China’s growth. Asian Econ. J. 2006, 20, 127–159. [Google Scholar]
- Li, K.W.; Liu, T. Economic and productivity growth decomposition: An application to post-reform China. Econ. Model. 2011, 29, 366–373. [Google Scholar] [CrossRef]
- Chen, S.; Jefferson, G.H.; Zhang, J. Structural change, productivity growth and 24 industrial transformation in China. China Econ. Rev. 2011, 22, 133–150. [Google Scholar] [CrossRef]
- Shen, X.; Lin, B.; Wu, W. R&D efforts, total factor productivity, and the energy intensity in China. Emerg. Mark. Financ. Trade 2019, 55, 2566–2588. [Google Scholar]
- Tian, X.; Yu, X. The enigmas of TFP in China: A meta-analysis. China Econ. Rev. 2012, 23, 396–414. [Google Scholar] [CrossRef]
- You, K.; Sarantis, N. Structural breaks, rural transformation and total factor productivity growth in China. J. Prod. Anal. 2013, 39, 231–242. [Google Scholar] [CrossRef]
- Zheng, J.; Bigsten, A.; Hu, A. Can China’s growth be sustained? A productivity perspective. World Dev. 2009, 37, 874–888. [Google Scholar] [CrossRef]
- Bloom, D.E.; Williamson, J.G. Demographic transitions and economic miracles in emerging Asia. World Bank Econ. Rev. 1998, 12, 419–455. [Google Scholar] [CrossRef]
- Cai, F.; Lu, Y. Population change and resulting slowdown in potential GDP growth in China. China World Econ. 2013, 21, 1–14. [Google Scholar] [CrossRef]
- Ogawa, N.; Chen, Q. End of the first demographic dividend and possible labor market response in China and other Asian countries. China World Econ. 2013, 21, 78–96. [Google Scholar] [CrossRef]
- Wang, X.; Chen, K.Z.; Robinson, S.; Huang, Z. Will China’s demographic transition exacerbate its income inequality? CGE modeling with top-down microsimulation. J. Asia Pac. Econ. 2017, 22, 227–252. [Google Scholar] [CrossRef]
- Cai, F. Demographic transition, demographic dividend, and Lewis turning point in China. China Econ. J. 2010, 3, 107–119. [Google Scholar] [CrossRef]
- Ye, G.; Wang, Y.; Zhang, Y.; Wang, L.; Xie, H.; Fu, Y.; Zuo, J. Impact of Migrant Workers on Total Factor Productivity in Chinese Construction Industry. Sustainability 2019, 11, 926. [Google Scholar] [CrossRef]
- Chen, E.K.Y. The total factor productivity debates: Determinants of economic growth in East Asia. Asian-Pac. Econ. Lit. 1997, 11, 18–38. [Google Scholar] [CrossRef]
- Ten Raa, T.; Shestalova, V. The Solow residual, Domar aggregation, and inefficiency: A synthesis of TFP measures. J. Prod. Anal. 2011, 30, 191–199. [Google Scholar] [CrossRef]
- Kumbhaker, S.C.; Lovell, C.A.K. Stochastic Frontier Analysis; Cambridge University Press: New York, NY, USA, 2000. [Google Scholar]
- Guillaumont Jeanneney, S.; Hua, P.; Liang, Z. Financial development, economic efficiency, and productivity growth: Evidence from China. Dev. Econ. 2006, 44, 27–52. [Google Scholar] [CrossRef]
- Chang, T.-P.; Hu, J.L.; Chou, R.Y.; Sun, L. The sources of bank productivity growth in China during 2002–2009: A disaggregation view. J. Bank. Financ. 2012, 36, 1997–2006. [Google Scholar] [CrossRef]
- Chambers, R.G.; Chung, Y.; Färe, R. Benefit and distance functions. J. Econ. Theory 1996, 70, 407–419. [Google Scholar] [CrossRef]
- Boussemart, J.P.; Briec, W.; Kerstens, K.; Poutineau, J.C. Luenberger and Malmquist productivity indices: Theoretical comparisons and empirical illustration. Bull. Econ. Res. 2003, 55, 391–405. [Google Scholar] [CrossRef]
- Briec, W. An extended Färe-Lovell technical efficiency measure. Int. J. Prod. Econ. 2000, 65, 191–199. [Google Scholar] [CrossRef]
- Shan, H. Reestimating the Capital Stock of China: 1952–2006. J. Quant. Tech. Econ. 2008, 10, 17–31. (In Chinese) [Google Scholar]
- Wu, J.; Li, N.; Shi, P. Benchmark wealth capital stock estimations across China’s 344 prefectures: 1978 to 2012. China Econ. Rev. 2014, 31, 288–302. [Google Scholar] [CrossRef]
- Wu, Y. Has productivity contributed to China’s growth? Pac. Econ. Rev. 2003, 8, 15–33. [Google Scholar] [CrossRef]
- Yang, L.; Lahr, M.L. Labor productivity differences in China 1987–1997: An interregional decomposition analysis. Rev. Reg. Stud. 2008, 38, 319–341. [Google Scholar] [CrossRef]
- Zheng, J.; Hu, A. An empirical analysis of provincial productivity in China (1979–2001). J. Chin. Econ. Bus. Stud. 2006, 4, 221–239. [Google Scholar] [CrossRef][Green Version]
- Chen, K.H.; Huang, Y.J.; Yang, C.H. Analysis of regional productivity growth in China: A generalized metafrontier MPI approach. China Econ. Rev. 2009, 20, 777–792. [Google Scholar] [CrossRef]
- Chen, J.; Fleisher, B. Regional income inequality and economic growth in China. J. Comp. Econ. 1996, 22, 141–164. [Google Scholar] [CrossRef]
- Chen, M.; Zheng, Y. China’s regional disparity and its policy responses. China World Econ. 2008, 16, 16–32. [Google Scholar] [CrossRef]
- Fleisher, B.; Li, H.; Zhao, M.Q. Human capital, economic growth, and regional inequality in China. J. Dev. Econ. 2010, 92, 215–231. [Google Scholar] [CrossRef]
- Andersson, F.N.G.; Edgerton, D.L.; Opper, S. A matter of time: Revisiting growth convergence in China. World Dev. 2013, 45, 239–251. [Google Scholar] [CrossRef]
- Wei, Z.; Kwan, F. Revisit China’s Lewis turning point: An analysis from a regional perspective. Asian Econ. J. 2018, 32, 333–357. [Google Scholar] [CrossRef]
- Yu, H.; Liu, Y.; Zhao, J.; Li, G. Urban total factor productivity: Does urban Spatial structure matter in China? Sustainability 2019, 12, 214. [Google Scholar] [CrossRef]
- Wei, Z.; Hao, R. The role of human capital in China’s total factor productivity growth: A cross-province analysis. Dev. Econ. 2011, 49, 1–35. [Google Scholar] [CrossRef]
- Yang, L.; Lahr, M.L. Sources of Chinese labor productivity growth: A structural decomposition analysis, 1987–2005. China Econ. Rev. 2010, 21, 557–570. [Google Scholar] [CrossRef]
- Färe, R.; Grosskopf, S.; Norris, M.; Zhang, Z. Productivity growth, technical progress, and efficiency change in industrialized countries. Am. Econ. Rev. 1994, 84, 66–83. [Google Scholar]
- Li, S.S.; Fu, L.; Ma, Y. Higher education and productivity in China. Educ. Sci. Theory Pract. 2018, 18, 1863–1875. [Google Scholar]
- Huang, J.; Cai, X.; Huang, S.; Tian, S.; Lei, H. Technological factors and total factor productivity in China: Evidence based on a panel threshold model. China Econ. Rev. 2019, 54, 271–285. [Google Scholar] [CrossRef]
- Liu, J.; Bi, C. Effects of higher education levels on total factor productivity growth. Sustainability 2019, 11, 1790. [Google Scholar] [CrossRef]
- Ho, C.C.; Lin, H.L.; Yang, C.H.; Lyu, Y.P. Productivity catch-up between Chinese and Taiwanese electronics firms. Pac. Econ. Rev. 2017, 22, 533–553. [Google Scholar] [CrossRef]
© 2020 by the authors. Licensee MDPI, Basel, Switzerland. This article is an open access article distributed under the terms and conditions of the Creative Commons Attribution (CC BY) license (http://creativecommons.org/licenses/by/4.0/).