4.1. Statistical Analysis of the Case Results
Case 1: The effect of the number of rotations on vibration, current fluctuation, and torque loss.
A complex regression analysis was used to evaluate the chatter vibration. Chatter vibration was found to increase with a higher number of no-load and fixed-load rotations per second. To establish whether the effects of the no-load or fixed-frame load rotation variables were statistically significant and whether one had more influence than the other, the
p-values (i.e., significance) of their combined 9.7% variation were evaluated (
Table 8). The combined
p-value of the two variables was 0.000 (
Table 9), indicating that at least one of the two variables had an effect on the vibration. Furthermore, the individual
p-values of both variables were 0.000, indicating that both variables had a significant and equivalent effect. The positive t-values were 6.679 for no-load rotation and 8.547 for fixed-load rotation, indicating that an increased number of no-load and fixed-load rotations led to increased chatter vibration.
The relationship between the 3.1% variation in current fluctuation and the number of no-load and fixed-load rotations was investigated using a complex regression analysis. The combined P-value of the two variables was 0.000 (
Table 10), while the individual P-values were 0.041 for no-load rotation and 0.000 for fixed-load rotation (
Table 11). This result shows that, although both variables were significant, the number of fixed-load rotations was more influential. The t-values were −2.049 for no-load rotation and 8.994 for fixed-load rotation. Therefore, an increased number of no-load rotations led to a decrease in current fluctuation, but an increased number of fixed-load rotations led to an increase in current fluctuation.
The relationship between the 3.4% variation in torque loss and the number of no-load and fixed-load rotations was considered. The combined P-value of the two variables was 0.000 (
Table 12), and the individual P-values of both variables were also 0.000 (
Table 13), indicating that both variables had a significant and equivalent effect. The t-values were 10.678 for no-load rotation and 10.329 for fixed-load rotation. Therefore, an increased number of no-load rotations led to a decrease in torque loss, whereas an increased number of fixed-load rotations led to an increase in torque loss.
Case 2: The effect of current on surge voltage and coil resistance.
The relationship between the 1.6% variation in surge voltage and the no-load, fixed-load, and starting currents was investigated using a complex regression analysis. The combined
p-value of the three variables was 0.000; thus, one or more variables had a significant effect on the surge voltage (
Table 14). The individual
p-values were 0.085, 0.002, and 0.000 for no-load current, fixed-load current, and starting current, respectively (
Table 15). Thus, only the fixed-load and starting currents were considered significant, although the starting current was more influential. The t-values were 3.074 for the fixed-load current and −7.238 for the starting current. Therefore, an increase in fixed-load current led to an increase in surge voltage, but an increase in starting current led to a decrease in surge voltage.
The relationship between the 76.5% variation in coil resistance and the no-load, fixed-load, and starting currents was considered. The combined
p-value was 0.000 (
Table 16), while the individual
p-values were 0.011, 0.007, and 0.000 for no-load current, fixed-load current, and starting current, respectively (
Table 17). Thus, all three variables were significant, although the starting current was the most influential. The t-values were 2.546, −2.698, and −102.806 for no-load current, fixed-load current, and starting current, respectively. Therefore, an increase in the no-load current led to increased coil resistance, but increased fixed-load and starting currents led to decreased coil resistance.
4.2. Research Hypotheses
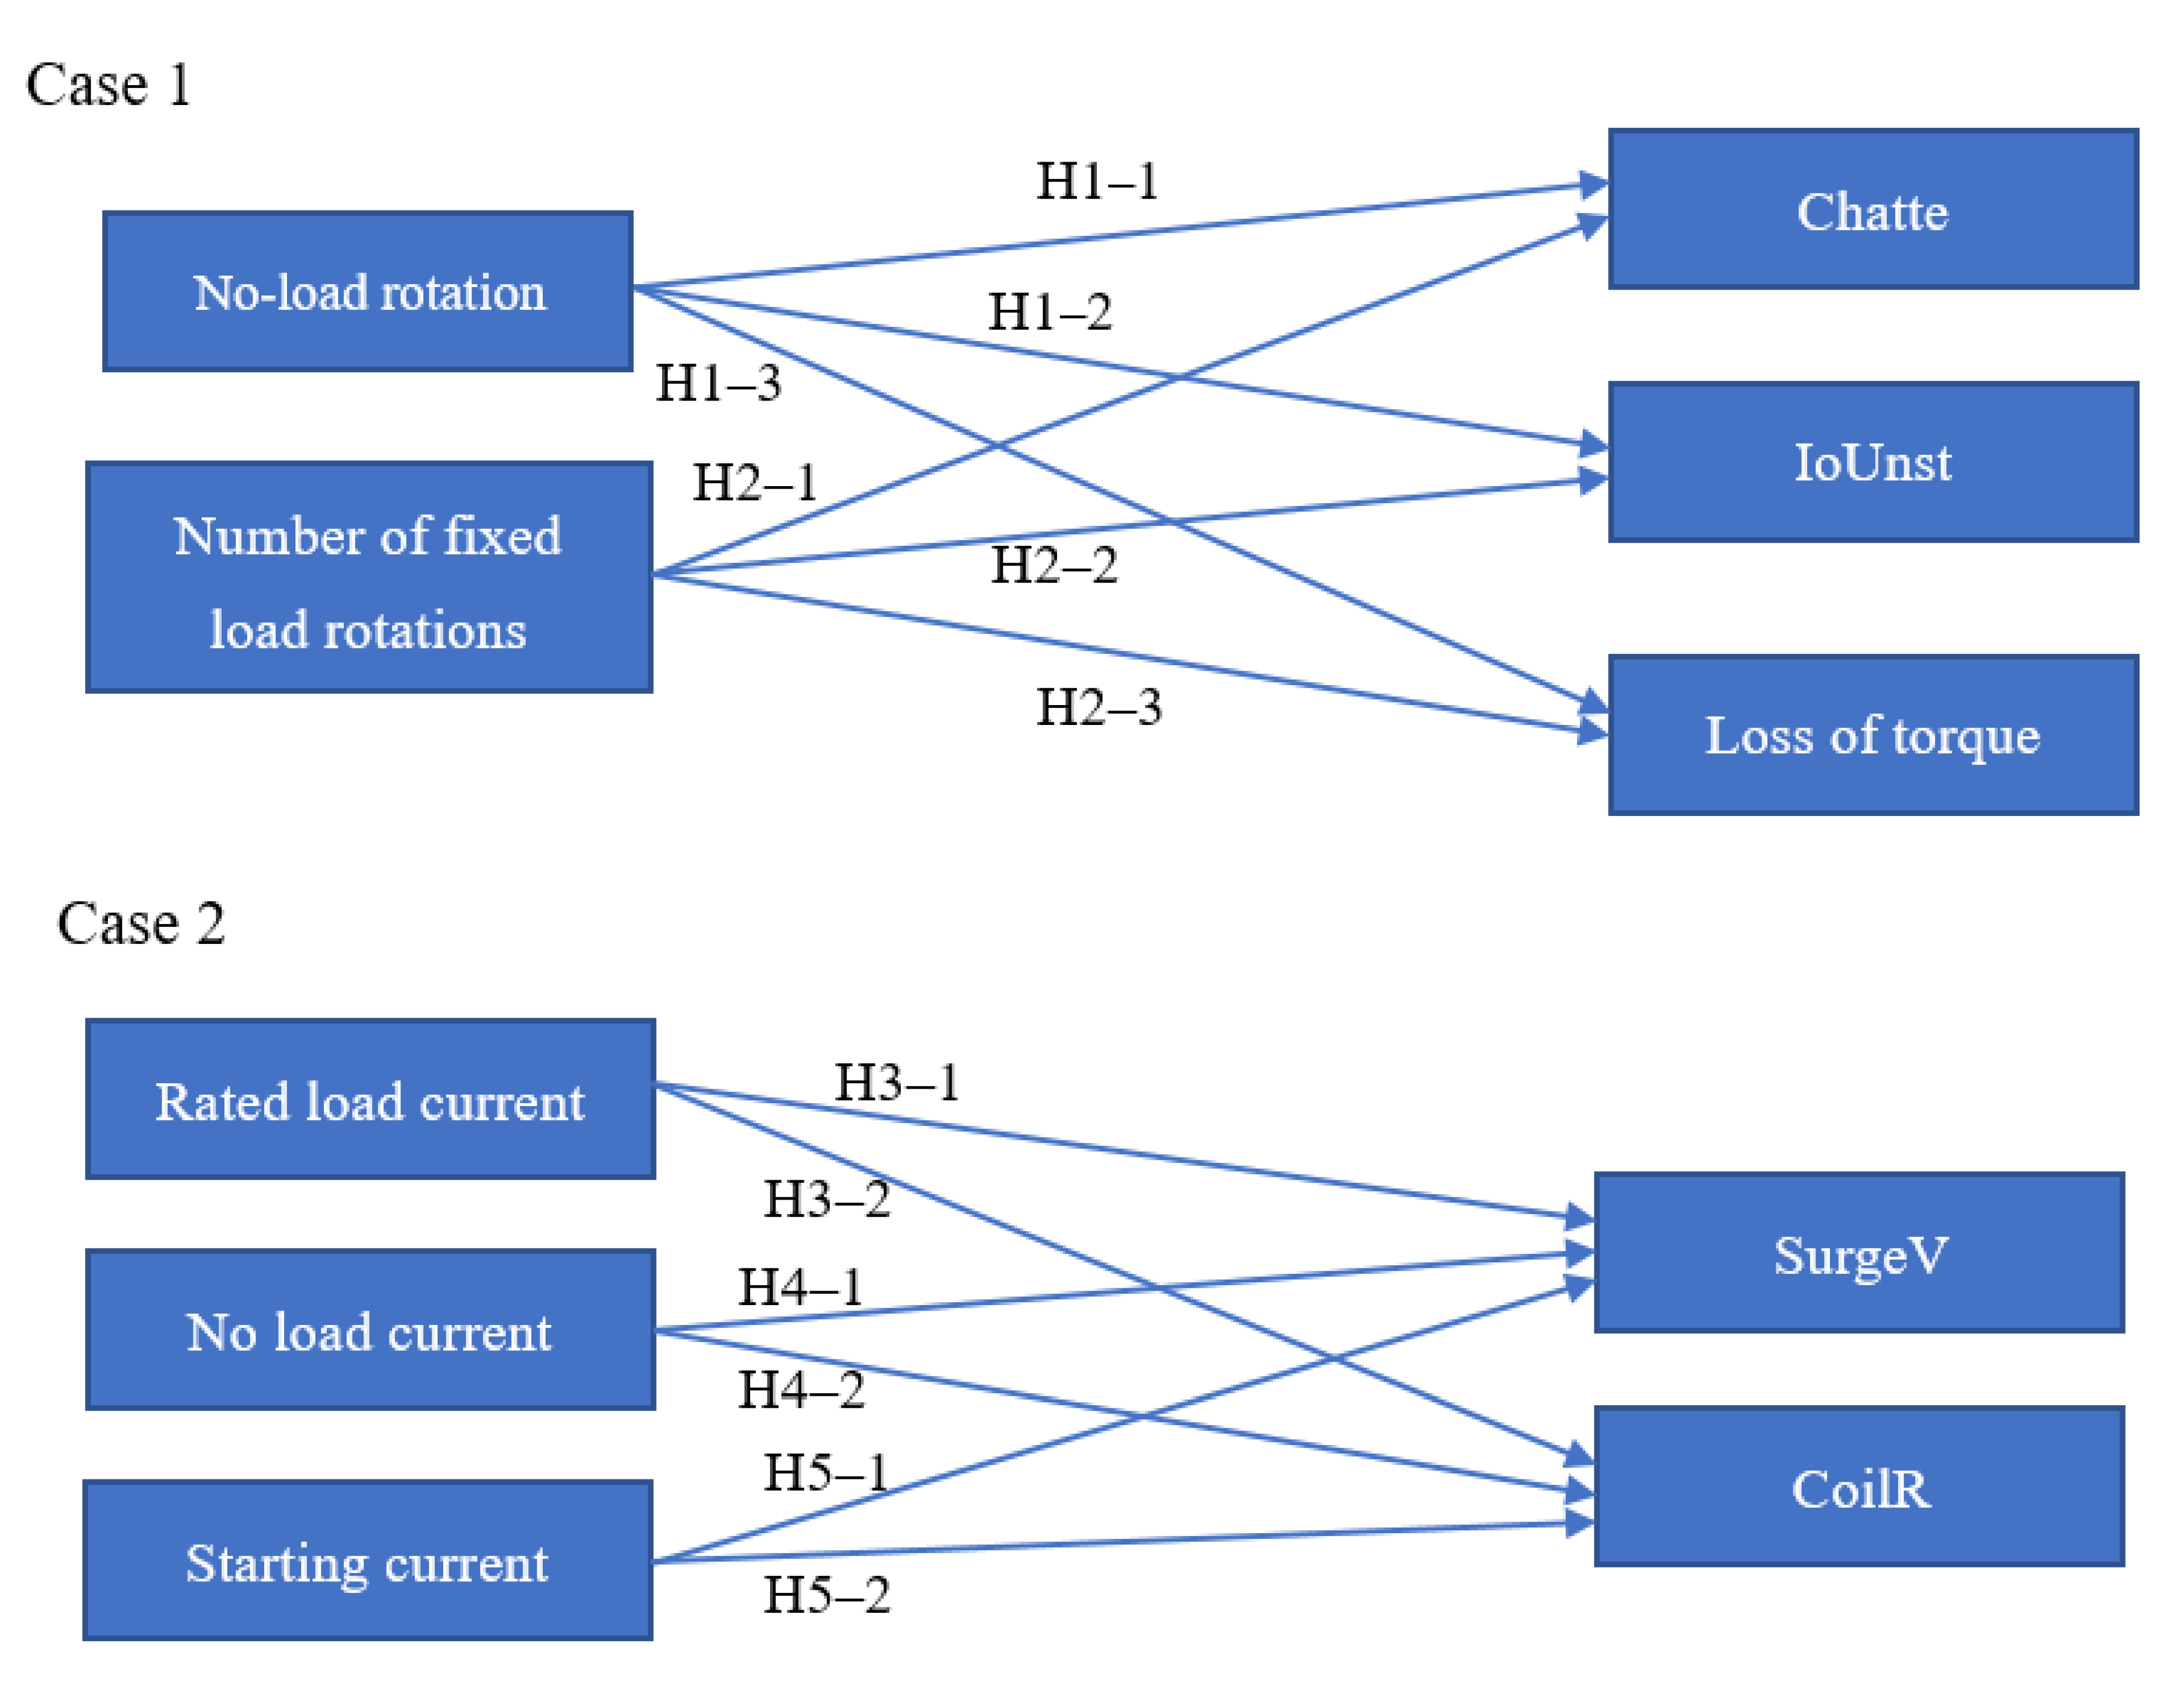
Case 1: The effect of the number of rotations on vibration, current fluctuation, and torque loss.
The hypothesis that the number of no-load rotations affected the vibration, current fluctuation, and torque loss (H1) was confirmed. Furthermore, the no-load rotation was positively correlated with chatter vibration (H1–1) and inversely correlated with torque loss (H1–3), but was not positively correlated with current fluctuation (H1–2).
The hypothesis that the number of fixed-load rotations affected the vibration, current fluctuation, and torque loss (H2) was confirmed. Furthermore, fixed-load rotation was positively correlated with vibration (H2–1) and current fluctuation (H2–2), but it was not inversely correlated with torque loss (H2–3).
Case 2: The effect of current on surge voltage and coil resistance.
The hypothesis that the no-load current affected the surge voltage and coil resistance was partially confirmed (H3), because no-load current affected the coil resistance but did not significantly affect the surge voltage. The no-load current was not positively correlated with the surge voltage (H3–1) and was also not inversely correlated with coil resistance (H3–2).
The hypothesis that the fixed-load current affected surge voltage and coil resistance (H4) was confirmed. Furthermore, the fixed-load current was positively correlated with surge voltage (H4–1) and inversely correlated to coil resistance (H4–2).
The hypothesis that the starting current affected surge voltage and coil resistance (H5) was confirmed. Furthermore, the starting current was inversely correlated to coil resistance (H5–1), but was not positively correlated to surge voltage (H5–2).
See
Table 18 for the research hypothesis test results.
Based on the validation results, there were five rejected hypotheses and several items in the manufacturing process that could indicate manufacturing errors. Through analysis, we could determine which parts lead to problems during assembly.
Based on the regression results, we established the following 5 relationships: (1) the no-load slewing number was positively correlated with vibration and negatively correlated with current fluctuation and torque loss; (2) the fixed-load rotation speed was positively correlated with vibration, current fluctuation, and torque loss; (3) the no-load current was positively correlated with coil resistance; (4) the fixed-load current was positively correlated with surge voltage and negatively correlated with coil resistance; and (5) the starting current was negatively correlated with the surge voltage and coil resistance. These relationships can be used to guide the investigations of manufacturing production staff.
When the no-load slewing number is not within a standard range, the value of chatter vibration, current fluctuation, and torque loss should be evaluated (
Appendix A). If the chatter vibration or current fluctuation value is outside the standard range, there is at least one error in the production process involving one of the following components: the coil, the terminal assembly, or the brush (
Table 7). If the torque loss value is outside the standard range, the manufacturing of at least one of the following parts has failed: the iron frame, the iron frame lid, or the magnet. If the chatter vibration, current fluctuation, and torque loss are all normal, then the manufacturing of the bearing parts was faulty.
When the number of fixed-load rotations is outside the standard range, the value of vibration, current fluctuation, and torque loss should be evaluated (
Appendix B). If there is an abnormality in the vibration or current fluctuation, there was at least one error in the production process of the components of the coil, terminal assembly, or brush (
Table 7). If the torque loss value is abnormal, the manufacturing of at least one of the following parts failed: the iron frame, the iron frame lid, or the magnet. If the chatter vibration, current fluctuation, and torque loss are all normal, then the bearing parts are at fault.
An abnormal no-load current indicates that the coil resistance should be evaluated. If the coil resistance is abnormal, then the production of either the copper wire or brush parts was defective. If the coil resistance is normal, then the iron frame, iron frame lid, magnet, or bearing are faulty.
When the value of the rated load current is abnormal, the value of the surge voltage and the coil resistance should be evaluated. If the surge voltage is abnormal, at least one of the components in the coil, terminal assembly, or brush production process failed. If the coil resistance is abnormal, the copper wire or brush production process failed. If neither is abnormal, one of the following parts failed: the iron frame, the iron frame lid, the magnet, or the bearing.
According to the research results, when the starting current value is outside the standard range, the surge voltage and the coil resistance values should be evaluated. If the surge voltage is abnormal, at least one of the components in the coil, terminal assembly, or brush production process failed. If the coil resistance is abnormal, the copper wire or brush failed, and at least one part of the production process went wrong. If neither is abnormal, the production process for the iron frame, iron frame lid, magnet, or bearing failed.


