Abstract
Construction projects are struggling to reach satisfactory performance in a context full of various and many risks. Despite the long-lasting study of performance in construction no universal approaches have emerged from numerous proposals. A mainstream in dealing with this issue is benchmarking methods with the use of appropriate indicators. This research work adopts such a group of indicators that address more aspects than the usual cost, schedule, and quality considerations. Following suggestions for proper adjustments and clarifications for the appropriate use of this group of indicators, this research proceeds by introducing the risk aspect to the calculation of project performance. Identified risks are modeled through fuzzy numbers to deal with data incompleteness and then they are appropriately added to compose risk coefficients for the performance dimensions expressed through the respective indicators. Then, the overall project’s performance is calculated addressing a risk-informed performance assessment of construction projects. The whole process is tested for verification with a theoretical example. The development of a simple yet inclusive and adjustable methodological framework for risk-informed performance assessment is expected to provide practitioners with a relatively easy approach for integrating both the risk and performance management in construction.
1. Introduction
A long-standing ascertainment in the construction industry is that a large number of projects does not achieve its objectives and goals, while only 40% of them are carried out in alignment with the objectives and goals set by the management [1]. Complexity in delivering, in combination with the large number of stakeholders that pursue their own—often competing—interests [2], along with the pressures of a highly competitive economic environment constitute a framework where efficient construction project management becomes essential for success.
Numerous academic and professional research efforts have focused on the key factors for successful delivery of construction projects [2,3,4,5,6,7,8,9,10,11,12,13,14,15]; however, it is evident that this is a hard task as it requires the integration of various stakeholders’ perspectives [16] that, furthermore, are volatile in terms of their significance in different projects and different environments. Therefore, the efforts to compile lists of commonly accepted key success factors or criteria or indicators, etc., are continuous without achieving, though, the creation of a robust, shared platform for appraising construction projects’ success. Table 1 supports this argument by summarizing the identified key success factors for construction projects based on a review of 14 recent studies. As it is shown there, researchers clearly agree on the consideration of time, cost, and quality as key success factors for construction projects; however, the recorded degree of agreement concerning the rest of the identified factors is considerably less. The findings of this review are consistent with similar findings of other research works that have been even more inclusive in terms of the reviewed literature [2].

Table 1.
Literature findings on key success factors for construction projects.
A probing observation of the listed factors in Table 1 leads to the conclusion that all of them with the exception of one are actually constituents of the performance notion, as the latter is perceived in the modern holistic context of performance management [17] that extends beyond the classical approaches [18,19]. The factor that, although relative, is not a constituent of performance is risk.
The notion of risk, which is excessively studied in numerous cases, is generally considered as an effect of the uncertainty and, consequently, as a measure of deviation from an anticipated outcome [20,21,22]. In this work, it is defined as the outcome of the uncertainty about several aspects of a problem in hand combined with the anticipated consequence of a hazard’s occurrence. This approach is generally accepted among those that have been proposed in the long period of the field’s development [23].
Managing performance and risks are, so far, two distinguished fields in the context of project management in terms both of content and orientation of the applied processes. Traditionally, risk management in the construction industry focuses rather on alleviating the adverse effect of potential risks, than exploiting the opportunities that may be associated with them [17,24,25]. This attitude ensures a safe operational environment that supports the existence of a minimum level of performance; however, it does not promote value creation through performance optimization [17]. On the other hand, performance management is largely perceived in practice as a sterile monitoring of the achievement level of objectives [10] through the application of measuring systems that quantify, ex post, the efficiency on achieving predetermined goals [17,26]. This practice does not support well-informed predictions for future performance as previous experience and knowledge is solely dependent on past conditions. At the same time, project development mechanisms and their inherent complexities remain largely unexplored, while the collected data during a project’s development are not adequately processed or even assessed for their accuracy and reliability [17,18]. These observations clearly indicate the potential of a full integration between performance and risk management not only aiming at aligning processes’ carrying out and objectives, but also at exploiting their complementarities to achieve a dynamic performance management approach that shall utilize risk management results for increasing performance and not only securing against performance reduction.
This paper aims at contributing to this course of research by building on previous works to propose a methodology for a risk-informed performance assessment of construction projects. The significance of this work lies mainly in the introduction of a structured mathematical approach for risk-informed performance assessment, which allows the revision of construction projects’ performance goals based on the success of managing risks in these projects. This integration is considered to be important as it systematizes project delivery processes, which although they run concurrently during a project’s development, they are not integrated to allow full exploitation in setting realistic performance goals.
2. Risk and Performance Management Integration Approaches
The integration of risk and performance management frameworks has been proposed in a rather limited number of previous research efforts. Starting from tracing the potential for such an integration, a comparative analysis of strengths and weaknesses between the two frameworks has clearly shown the parallels among them [17]. Furthermore, it was shown that the two frameworks are complementary in serving the main purpose, i.e., reaching performance goals, yet starting from two different start lines. From a performance management point of view, future performance is a pre-determined, standard benchmark, which needs to be fulfilled based on the assumptions and conditions considered at the design phase and their amendments due to real conditions occurring during the materialization phase. This is a rather deterministic approach where performance is pursued up to a certain level. From a risk management point of view, future performance is again a pre-determined, standard benchmark, which, this time, needs to be safeguarded from known or unknown fluctuations and disturbances to design requirements that occur during the project’s materialization phase. Therefore, risk management is about ensuring the environment where performance management deploys [17] and when that is achieved, performance is increased [22].
While the potential is identified, the methodological integration between the two frameworks has not significantly progressed. The attempts made so far can be broadly classified in three groups:
- The contextual, which mainly propose a framing of risk and performance in the context of broader frameworks such as strategic or enterprise risk management (ERM). For example, in [18], performance management is identified as an autonomous step for strategy monitoring, while risk management is identified as a component in the strategy realization step. In this case, there is rather a co-operation than an integration of the two frameworks. Other efforts have concluded that ERM and performance are positively related, nevertheless they have not investigated the mechanisms or even the existence of a direct relation between the two frameworks [27,28,29,30,31].
- The controlling, which mainly focus on project control, in the light of uncertainty [32,33,34]. In these cases, deviations of performance expressed as time and cost are investigated through Monte Carlo simulations addressing this way the modeling of uncertainties in performance assessment. These attempts aim at detecting the potential of performance deviations through a stochastic analysis and support project control rather than utilize risk management for setting performance goals.
- The performative, which are actually combining risk and performance management to set new performance goals during a project’s development. In this group of attempts, earned value analysis (EVA) plays a central role by constituting the methodological background for performance measurement that is further enhanced with risk management practices. For example, the introduction of control charts [35] validates the idea of stochastically predicting deviations due to potential risks, but also addresses the idea of moving from benchmark values to statistically determined ones for setting performance goals. This idea is further developed in other research efforts where setting performance goals is more and more enriched with risk management tools and techniques. Based on a combination of EVA, statistical analysis, and Monte Carlo simulations, tolerance limits are set for project’s performance control [36], or performance goals are directly estimated with a level of confidence [37]. Even in cases when the required total work is either completely unknown or uncertain, a proper modification of EVA to address fuzzy numbers is proposed for estimating both past and future performance values [14].
The methodological integration that is proposed in this paper falls into the third group and it expands on previous related research that combines EVA and benchmarking. The analytical presentation of this integration is provided in Section 3.
3. Proposed Methodological Integration of Risk and Performance Assessment
The proposed methodological integration expands the methodological framework that was initially presented by Nassar in 2005 [15] and has been subjected to enrichments by other researchers. The selection of this framework for proposing an integration between risk and performance assessment was made due to the analytical mathematical structure it presented, the combination between the benchmarking and the analytical calculation approaches, and its performative nature. Nassar’s framework is also consistent with the requirements for structuring performance systems concerning clarity of the measured performance [38] and appropriate selection of performance indicators [39].
The proposed framework is presented in two parts. The first part presents the methodological background that this research has used concerning performance assessment and the second part presents the way to integrate this framework with the risk management framework as proposed in this research.
3.1. Methodological Background for Performance Assessment
According to the adopted methodological background for performance assessment in this research, construction project performance is successful when the project team, the company, or organization carrying out the project and the client evaluate it so. The evaluation system used is common for these project stakeholders and comprises eight so-called performance dimensions [15], which are represented by respective indicators as shown in Section 3.1.1, Section 3.1.2, Section 3.1.3, Section 3.1.4, Section 3.1.5, Section 3.1.6, Section 3.1.7 and Section 3.1.8
3.1.1. The Cost Dimension
The cost dimension is measured through the cost performance index (CPI) taken from EVA. The index measures the achieved efficiency in the project, in terms of value earned for a specific amount of actual costs. The known formula for calculating this index is presented in Equation (1):
where EV is the earned value, i.e., the obtained value as a percentage of the budgeted work and AC is the actual cost spent for this obtained value. Both measures reflect the overall progress until the period where the project’s monitoring takes place.
CPI = EV/AC
3.1.2. The Time Dimension
The time dimension is measured through the schedule performance index (SPI) taken, again, from EVA. The index measures the achieved efficiency in the project, in terms of value earned against the anticipated progress based on the design. The known formula for calculating this index is presented in Equation (2):
where PV is the planned value, i.e., the budgeted work for a specific period of time based on the project’s design. Again, both measures reflect the overall progress until the period where the project’s monitoring takes place.
SPI = EV/PV
3.1.3. The Billing Dimension
The billing dimension is measured through the billing performance index (BPI), which measures the billed against the earned revenue at the time of the project’s monitoring. The idea behind this index is related to the efficiency of cash flows for a project under development. While construction projects managers recognize the necessity of controlling costs and schedules, they pay significantly less attention in securing cash flows for the whole duration of the project to avoid periods of shortage of funds that in turn may have adverse impacts for the project’s development. Efficient cash flows are those with a positive sign (or marginally neutral) for the project and, moreover, those that are timely processed; therefore, BPI is calculated with the formula presented in Equation (3):
where BRWP is the billed revenue and ERWP is the earned revenue for the delivered worked until the period where the project’s monitoring takes place.
BPI = BRWP/ERWP
3.1.4. The Safety Dimension
The safety dimension is measured through the safety performance index (SFI), which measures the performance in retaining a safe environment during the development of the construction project. This dimension is very significant as it introduces the safety factor, which has multiple impacts on the project’s successful delivery ranging from productivity and cost to reputation and competitiveness issues. The formula for calculating this index is presented in Equation (4):
where LTI measures the lost time due to safety incidents, C is a constant that represents 100 employees with full time annual occupation, and M measures the total man-hours required for the project until the period where the project’s monitoring takes place.
SFI = LTI × C/M
3.1.5. The Profitability Dimension
The profitability dimension is measured through the profitability performance index (PPI), which measures the earned revenue against the actual costs incurred until the time of the project’s monitoring. The index evaluates the actual profits earned only after subtracting from the revenue all direct and indirect costs and the calculation formula is presented in Equation (5):
where ERWP and AC are measures that have been defined in Equations (1) and (3), respectively.
PPI = ERWP/AC
3.1.6. The Quality Dimension
The quality dimension is measured through the quality performance index (QPI), which addresses the conformance of the realized work with the quality standards and specifications set both by the valid regulatory framework wherein the project is delivered and the customer’s requirements. Given that non-compliance requires reworks to reach the desired standards, the index measures the quality of the worked performed by calculating the cost of reworks required as a percentage of the actual costs incurred for the project’s construction. The calculation formula is presented in Equation (6):
QPI = Total Direct and Indirect Costs of Reworks/Total Field Costs
3.1.7. The Team Satisfaction Dimension
The team satisfaction dimension is measured through the team satisfaction index (TSI), which addresses the impact of human factor to the project’s performance. The effect of the human factor in almost every other aspect of project performance is evident, especially for the construction industry where there is still a large portion of works that are not automated. It could be argued that the impact of the human factor is measured indirectly through the Equations (1)–(6), since the indicators in these equations are affected from the human staff in a construction project. This argument, although reasonable, does not eliminate the need for an index like TSI, since the indirect measurement of the human factor’s impact is both vague (there is no particular indication as of the exact impact of the human factor in a calculated index value) and partial (not all aspects of the human effect on performance are calculated). TSI as defined in [15] addresses 12 specific parameters of team satisfaction with an impact to the project’s performance, namely:
- Involvement with the project;
- Client/Suppliers response to team’s needs;
- Project Manager response to team’s needs;
- Adequate equipment;
- Adequate training;
- Appropriate financial compensation;
- Clarity of responsibilities;
- Quality of supervision;
- Interest in the nature of work;
- Cooperative environment;
- Conformity with internal procedures during work;
- Access to project baselines and progress reports.
For each one of these parameters, the project management team sets the priority and level of satisfaction, and the overall team satisfaction is calculated through the formula presented in Equation (7):
where Wi is the relative weight of priority with = 1, and Ri is the level of satisfaction in the range [1, 10] with 10 signifying the maximum level of satisfaction.
3.1.8. The Client Dimension
The client dimension is measured through the client satisfaction index (CSI), which addresses the impact of the correspondence to a client’s demands as a factor of project’s performance. Satisfying a client’s demands can be a hard task with multiple impacts. It requires a thorough identification and understanding of the client’s expectations and even the mechanisms that lead to their change, in order to: (a) Retain a proper balance between reasonable and exaggerated demands, (b) minimize change requests, and (c) manage expectations successfully to achieve smooth cooperation with the client and good reputation as a supplier, which is a significant business asset in competition. As in the case of TSI, CSI as defined in [15] addresses 12 specific parameters of client satisfaction with an impact to the project’s performance, namely:
- Understanding of the project requirements;
- Understanding of client system and procedures;
- Response to client requests/needs;
- Flexibility and adjustment to change;
- Overall capability of contractor’s project team;
- Effective communication;
- Innovation in problem solving;
- Performance with respect to cost;
- Performance with respect to schedule;
- Performance with respect to service quality;
- Performance with respect to product quality;
- Performance with respect to safety procedures.
For each one of these parameters, the project management team sets the priority and level of satisfaction and the overall client satisfaction is calculated through the formula presented in Equation (8):
where Wi is the relative weight of priority with = 1, and Ri is the level of achievement in the range [1, 10] with 10 signifying the maximum level of satisfaction.
3.1.9. Calculation of the Overall Project Performance
The indicators of the performance system are calculated based on measured data or evaluations according to the nature of each index. The different nature of the indicators results in different ranges of values for them; however, in all cases, it is easy to define the same performance classes for the indices. Table 2 presents the classes and the corresponding values ranges according to the suggestions in [15].
Table 2.
Performance classes for system’s indicators.
The different nature of the indicators can also justify a differentiation of their contribution to the overall project’s performance. Weighting of the indices can be done through expert judgments or with the application of more systematic methods and techniques such as the analytical hierarchy process (AHP). Finally, Nassar [15] has suggested Equation (9) for the calculation of the total project’s performance:
where PI is the project performance index, and wi is the relative weight of significance of each performance indicator with = 1.
PI = w1 × CPI + w2 × SPI + w3 × BPI + w4 × PPI + w5 × SFI + w6 × QPI + w7 × TSI + w8 × CSI
3.2. Improvements of the Performance Assessment Methodological Background
The methodological background for performance assessment was further improved in this research, both in content and processes. In particular, two indicators, BPI and QPI, were redefined and a particular process of normalization for the calculation of PI was proposed. These novel interventions are described in detail in Section 3.2.1, Section 3.2.2 and Section 3.2.3.
3.2.1. The Modified Billing Performance Index
BPI as defined in [15] focuses on the billing of the performed work, which is important as it shows the readiness of the contractor to claim rewards; however, efficient cash flows are not secured only by proper billing, but also and more importantly by timely payment of the rewards. Although, in terms of logistics, cash flows can be recorded once billing is performed, payments are essential to retain liquidity that is of utmost importance in production, especially for construction projects that present volatilities in expenses. Another aspect is that payments are subjected to factors external to the project, and they are controlled by the client or the funder and not by the project’s manager. Given that no payments are feasible without the respective billing of the work performed, the maximum value of BPI could be equal to 1, thus signifying full payment for the billed work. BPI’s adjustment to reflect the above and be consistent with the structural approach of other indices such as CPI and SPI, is achieved through a new definition of the index, which is presented in Equation (10):
BPI = ERWP/BRWP
Equation (10) is the reversed Equation (3) and the measures of the two equations have identical interpretations.
3.2.2. The Modified Quality Performance Index
QPI as defined in [15] considers quality deviations only with respect to the construction phase. Although reworks are mostly expected in that phase, quality deviations may be present in the design phase as well. Moreover, any costs of reworks, i.e., any failures in quality have an impact on the overall project’s performance, therefore the baseline to evaluate them should be the project’s actual (direct and indirect) costs, instead of the costs in the construction phase. The adjustment to Equation (6) in order to reflect the above, results to Equation (11):
where CoR is the total cost of reworks and AC is the actual cost of the whole project until the period where the project’s monitoring takes place.
QPI = CoR/(AC − CoR)
3.2.3. The Normalization Process
The eight weighted indices that are added to calculate the project’s performance according to Equation (9) are not taking values in the range presented in Table 2. Although it might be feasible to consider similar grading for the conditions of those indices that are measured as percentages (e.g., CPI, SPI, etc.), this is absolutely not the case for indices as TSI and CSI, which are measured in 1–10 scales. A normalization is then required for the final calculation, which while is suggested in [15], it is not described or shown there. In the context of this research, a standard normalization process is proposed as following:
- The marginal values of the respective classes in the two linear grading systems (i.e., the index’s rating system and the normalized system) are forming pairs, which are plotted in the XY plane. Then, a graphical presentation is created by drawing the trend line of the set of paired values.
- The equation of the trend line is derived with a desired R2 approximating the value of “1” as the best fitting equation is required to transpose from an indicator’s rating system to the normalized respective one. For this reason, third degree polynomials are selected, although even linear equations had an R2 > 0.98. It should be mentioned that polynomials of a greater degree could be inappropriate due to overfitting.
- The normalization equation can be used for transposing any value given to the indicator’s rating system to the normalized rating system for the calculation of the project’s performance index.
The described process is presented in Figure 1 for PPI, while Table 3 summarizes the normalization equations for all indices that according to [15] had rating systems different than the normalized rating system, which is shown in Table 2.
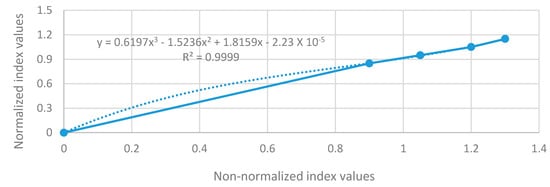
Figure 1.
An example of the normalization process for profitability performance index (PPI).
Table 3.
Normalization equations for the indices rating systems defined according to [15].
The normalization equations in Table 3 are respective to the rating systems proposed in Nassar [15]. Nevertheless, the proposed normalization process is simple, accurate, and adjustable to any rating system that has to be defined by the project management team according to the project’s conditions and the project’s stakeholders’ requirements.
3.3. Introduction of the Risk Factor in the Performance Assessment Methodology
The purpose of this paper as stated in the introduction is to integrate risk and performance assessment. For that reason, the risk aspect has to be introduced to the selected performance assessment methodology as improved after the modifications in the context of this research. This introduction can be in the form of a risk factor that will be composed according to the reasoning that follows.
A proper risk management entails risk identification, assessment, and response. Given that in the framework of this research, decisions are made based on the project’s performance index, the final stage of risk management is excluded, therefore only risk identification and risk assessment are required.
Risk identification can be applied by the project management team through any of the acknowledged methods and techniques available in the vast related literature. The identified risks are noted as Rij, where i represents the affected performance index and therefore takes values in the set of [1, 8], while j represents the code number of the risk and takes values in the set of [1, n], with n being the total number of risks identified for the index i. With this notation, all identified risks are directly related to the performance indices.
Risk assessment follows then with the use of the most generic formula for quantifying risks, which is presented in Equation (12):
where P is the probability of the risk to occur and C is the consequence upon occurrence of the risk.
R = P × C
The factors in Equation (12), ideally, should take real values estimated through the application of appropriate models and quantification techniques; however, performing such quantifications in the construction industry can be an extremely hard task due to the following two reasons: (a) The available data are very often incomplete, inaccurate, and generally inappropriate for systematic assessments, and (b) the approaches in practice are more qualitative and experience-based than mathematical and model-based, therefore leading to rough estimations, which are often expressed in linguistic terms (e.g., very high probability, low consequence, etc.). To adjust to this reality and appropriately model it for assessing construction projects risks, fuzzy theory provides an adequate framework that can be easily applied [40,41]. Probability and consequence in Equation (12) can be represented as fuzzy numbers taking values in a range of qualitative linguistic grades similar to those used in everyday practice. The mathematical equivalent of these ratings is selected to be trapezoidal numbers, which are broadly used in the respective literature for the easiness of their use [42]. Table 4 presents the proposed trapezoidal fuzzy numbers for each grade of probability and consequence in the context of this research. Scaling may differ based on the user’s risk attitude and experience.
Table 4.
Performance classes for system’s indicators.
Once the probabilities and consequences are associated with a specific class, the calculation of risk is a simple product of fuzzy numbers that equals another fuzzy number, which is defuzzified through the circumcenter of centroids rule used in [42,43], according to Equations (13) and (14):
In Equation (13), a-d are the trapezoid’s apices and w is the trapezoid’s height, while in Equation (14), CRRij is the final crisp number produced after the application of the defuzzification process, which represents the risk rating of a certain risk j with an impact on an indicator i. Once all Rij = CRRij are calculated, the risk-informed performance index is calculated with the following step-by-step process:
- Step 1: Calculation of the risk associated with each performance index. Several formulae have been proposed in the literature for calculating the total risk from individual risks [40,42,44,45]. To use an equation that addresses crisp numbers and considers the uneven contribution of individual risks to the overall risk, based on their significance as stated by their value, Equation (15) suggested in [44] is adopted in the context of this research:where N is the number of total risks for a single dimension i.
- Step 2: Calculation of the risk level of each performance index. The risk level (RL) of a performance index is actually the normalized value of the respective dimension’s total risk against the sum of all total risks of all performance dimensions. It is calculated through Equation (16) and it allows the weighting of all performance indices in the range [0, 1]:
- Step 3: Calculation of the risk factor of each performance index. The risk factor (RF) is the risk coefficient in the calculation of risk-informed performance. It is calculated for each performance index through Equation (17):RFi = 1 − RLi
As it is evident from the equation, the more increased is the risk level of the performance dimension, the lower is the value of the risk factor.
- Step 4: Calculation of risk-informed project’s performance index. The last step for calculating risk-informed performance is the introduction of the risk factor to Equation (9). The new form of the equation that calculates PI is that of Equation (18):RiPI = w1 × RF1 × CPI + w2 × RF2 × SPI + w3 × RF3 × BPI + w4 × RF4 × PPI + w5 × RF5 × SFI + w6 × RF6 × QPI + w7 × RF7 × TSI + w8 × RF8 × CSIAs shown in this equation, the project’s performance index has been replaced by the risk-informed performance index (RiPI), while all performance indices are weighted both in terms of their significance and the risk that is associated to them.
The introduction of the risk coefficient in the assessment of project performance is rationalizing the index’s value as it addresses the adverse effect that risks have in maximizing performance. This is useful for decision-making as it indicates the potential reduction of the recorded performance at some given point in time. Such indication along with the respective values of the indices of the various performance dimensions may trigger specific interventions towards dimensional and total project’s performance improvement.
3.4. Extension of the Risk-informed Performance Assessment Methodology
The introduction of the risk factor to the performance assessment methodology is a first significant step towards the integration of risk and performance dimensions in performance management; however, as addressed, it covers only the necessary calibration of performance assessments due to potential risk occurrences, thus retaining a partial approach regarding both the control capacity and the predictive power that such a methodology should present. For this reason, further extensions are required to the proposed risk-informed performance assessment methodology, for it to become more valuable towards performance control and prediction of future performance.
These extensions are inspired and following the example of previous work [32,33] and especially the introduction of the project risk baseline (PRB), which is defined as “the evolution of the value of project remaining risk over time: the remaining variability of project cost/duration during the project life cycle” [32]. Nevertheless, while the notion of PRB is very useful, the facts that it is limited to include only the factors of project’s cost and duration and, more important, that these factors are not merged but modeled as discrete performance control indicators leads to the need for developing a novel approach that aims at modeling PRB as a comprehensive measure of all factors included in the performance assessment methodology, described in Section 3.1, Section 3.2 and Section 3.3. Towards this direction, two new indicators of planned performance (PP) and actual performance (AP) are defined as following:
- Planned performance (PP) is the value of performance that must be achieved at the construction project’s completion according to the project’s planning and design. The maximum value of PP is taken through Equation (18) when no deviations from planning occur (i.e., CPI = SPI = BPI = 1) and is dependent on the values that the construction project manager sets for the factors affecting performance (i.e., indicators calculated from Equations (4), (5), (7), (8) and (11)).
- Actual performance (AP) is the value of performance that is actually achieved at the time when the project’s control is taking place. At this point, all variables are taking the values recorded according to the project’s progress and AP is calculated through Equation (18) (i.e., AP = RiPI).
To link PP and AP with the construction project’s completion phase, the two indicators are multiplied with the project’s planned percentage of completion (PPC) and the project’s percentage of completion (PC), respectively. The result is the planned performance for a planned percentage of the project’s completion (PPPPC) and the actual performance for the actual percentage of the project’s completion (APPC). Once the planned and actual performance are linked with the actual project’s progress, the performance risk baseline (PRB) is defined as the evolution of the value of the project’s risks for achieving performance throughout the construction project’s life cycle. This definition expands the one given in [32] by further integrating the notions of risk and performance, which is the aim of this research. PRB is assessed according to the project’s control plan by using Equation (19):
where PRBt is the construction project’s performance risk baseline at a specific time t. Equation (19) reflects that project’s risks for achieving performance are increased at the project’s beginning, and they are reducing throughout the project’s life cycle and towards project’s completion.
PRBt = PP − PPPPC
The variation of PRB between two consecutive project controls is calculated from Equation (20):
wPt = PRBt−1 − PRBt
At this point, the construction project’s performance is already risk-informed and linked with the project’s progress, while it can also be allotted in time. What is still required is to consider the potential tolerance of performance variations that ensure keeping performance under predefined thresholds through the construction project’s lifecycle. This tolerance is the last factor that should be considered in project’s performance control and estimations of risk-informed future performance and it is introduced to the methodology through the following process:
- Step 1: The project performance buffer (PPB) is defined according to Equation (21):where APmean is the project’s estimated mean actual performance and APp is the estimated performance for a given level of confidence p. Both estimations are based on Monte Carlo simulation, where the simulated variables are the performance indicators that determine RiPI (AP), while the risk factors and weights in Equation (18) are constants determined by the analyst.PPB = APmean − APp
- Step 2: PPB is allotted in time according to the project’s control plan, based on Equation (22):where σ2Pp is the total performance variation, i.e., σ2Pp = ΣwPt. The accumulated performance buffer at any given time (APBt) indicates the total use of the buffer until the period of the project’s control and is calculated according to Equation (23):PBt = (wPt × PPB/σ2Pp)APBt = PBt + APBt−1
- Step 3: Project control entails the comparison of the accumulated performance buffer (APBt) added to the actual performance at a given time with the planned performance at the same time. This comparison is mathematically expressed by Equation (24):where PCIt is the performance control index, which can be either: (a) Positive (PCIt > 0), thus indicating an improved performance compared to the planned one or (b) negative (PCIt < 0), thus indicating a reduced performance compared to the originally planned.PCIt = APBt + APPC − PPPPC
- Step 4: Having knowledge of the project’s status regarding performance achievement, the methodology concludes with the estimation of performance at project’s completion. The respective index (EPACt) is calculated according to Equation (25):EPACt = (PP + PCIt)EPACt is the estimated performance at project’s completion and a greater value than PP (EPACt > PP) indicates the existence of a quantified performance surplus that can be managed accordingly, while a lower value than PP (EPACt < PP) indicates the existence of a quantified performance shortage that should be covered through appropriate interventions.
The full application of the extended risk-informed performance assessment methodology introduces construction project’s performance control and construction project’s performance estimation at completion, thus providing a full review of the project’s performance during its life cycle.
3.5. Verification of Risk-Informed Performance Assessment
The verification of the methodological framework is attempted by applying it to a theoretical example that is presented in [32]. This particular example was selected intentionally as it allows comparisons between the two approaches (i.e., this research’s and the research presented in [32]) and their results; however, the application of the proposed methodology requires more data that were selected arbitrarily, yet close to the original values to constitute all together a realistic theoretical example.
As shown in Figure 2, the example presents a construction project’s segment that comprises four activities, A1–A4. Table 5 presents the planned and actual durations and costs, while the following assumptions are also considered for the theoretical example:
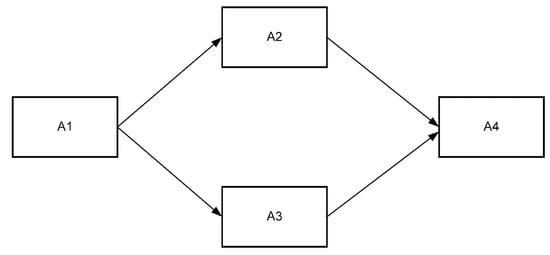
Figure 2.
Theoretical example: Construction project’s activities.
Table 5.
Cost and time data of the theoretical example.
- Fees include 10% profit. Payments are expected to be fully consistent with billing at the design phase; however, the actual cash flows are recorded as presented in Table 6.
Table 6. Performance data upon construction project’s completion of the theoretical example.
- Each activity is carried out from a team of two persons. The total man-hours for the completion of the project are 380. An initial estimation at the design phase for a loss of 10 manhours is not confirmed as the actual manhours lost are as presented in Table 6.
- At the design phase, the cost of reworks is expected to be at 750 €; however, the actual cost of reworks is the one presented in Table 6.
- The evaluation, at the design phase, of all parameters for both Team and Client satisfaction considers a level of satisfaction set at 8; however, the actual values of the levels of satisfaction for each parameter of each factor are those presented in Table 7 and Table 8.
Table 7. Calculation of team satisfaction index (TSI) for indicative weightings and levels of satisfaction.
Table 8. Calculation of client satisfaction index (CSI) for indicative weightings and levels of satisfaction.
- Eleven risks have been identified through the risk identification process.
The application of Equations (1), (2), (4), (5), (7), (8), (10) and (11) results to the non-normalized values of the indices. Then following the normalization process with the equations shown in Table 3, the final normalized values of the indices are shown in Table 9. Table 9 also presents the weights of each performance dimension for the calculation of the project’s performance index.
Table 9.
Non-normalized and normalized values of performance indices.
The introduction of the risk aspect in the calculation of construction project’s performance is achieved through the implementation of the risk assessment process (Equations (12)–(17)) that is described in Section 3.2. The calculation results are presented in Table 10, Table 11 and Table 12.
Table 10.
Risk quantification with the use of fuzzy numbers.
Table 11.
Crisp risk rating calculation after defuzzification.
Table 12.
Risk levels and risk factors calculations.
Having calculated all the factors of Equation (18), the risk-informed performance index of the construction project is assessed as shown below:
RiPI = 0.15 × 0.852 × 0.943 + 0.10 × 0.864 × 1.000 + 0.10 × 0.887 × 0.693 + 0.15 × 0.850 × 1.050 + 0.15 ×0.885 × 0.710 + 0.15 × 0.887 × 1.218 + 0.10 × 0.886 × 0.893 + 0.10 × 0.888 × 0.899 = 0.818
Based on the RiPI calculation, the project’s performance falls into class E (RiPI ≤ 0.85), which is considered as poor performance.
Based on the numerical data for the theoretical example according to planning and design, the application of Equation (18) yields PP = 0.918. Then, considering a weekly performance control period for specific scheduled and actual project’s progress and applying Equations (19) and (20), Table 13 and Figure 3 summarize the project’s actual and planned performance during the project’s lifecycle.
Table 13.
Planned and actual project’s progress and performance elements.
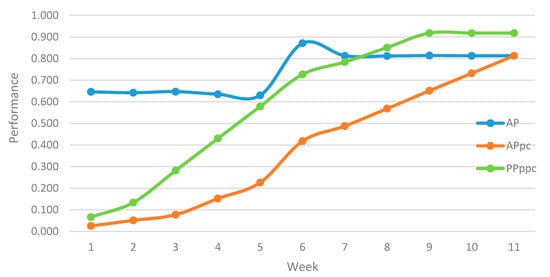
Figure 3.
Actual and planned performance’s evolution during the project’s life cycle.
The project performance buffer (PPB) for the theoretical example was calculated by performing a Monte Carlo simulation of 5000 iterations with the use of specific software (SPSS v.18). The level of confidence was set to 90% and the expected value was set to 0.918, i.e., the calculated value of PP. Then, the simulation returned the result shown in Figure 4, where the mean performance (APmean) is estimated at 0.90, the performance at the confidence level (AP0.90) is estimated at 0.824, and PPB is estimated at 0.076, according to Equation (21).
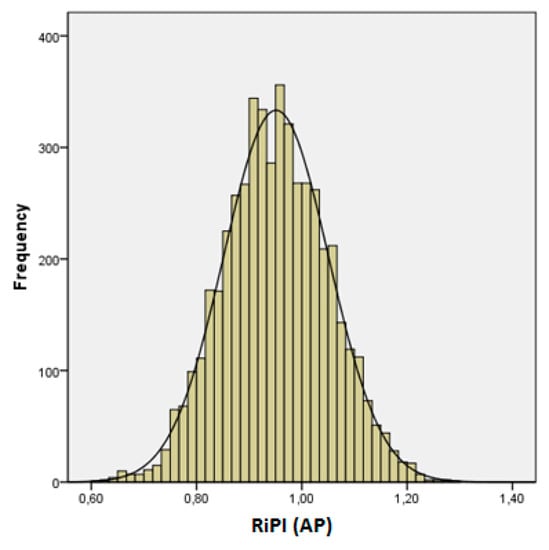
Figure 4.
Monte Carlo simulation results for actual performance at 90% confidence level.
Finally, the application of Equations (22)–(25) results in the outcome presented in Table 14 regarding the performance control index and the estimation of performance at project’s completion. As shown there (column PCIt), the project is constantly underperforming at all control points. Performance is increasingly reduced until the sixth week where the trend is reversed, however, not enough to return to acceptable performance levels until the project’s completion. The improvement after the sixth week is due to the effect of the BPI index to the project’s performance, which is changed after the payment made then (see Table 6). The final outcome is consistent with the analysis made in [32] for the same example, concerning the failure in meeting schedule performance requirements. As already mentioned, the proposed methodology integrates considerably more constituents of a project’s parameters, thus providing a more holistic view and estimation of performance.
Table 14.
Planned and actual project’s progress and performance elements.
Table 14 also presents the estimation of performance at project’s completion (EPACt), which, since the first week, is constantly estimated below the estimated value of PP. This estimation does not only confirm the project’s underperformance, which is quantified with PCIt, but also provides a quantified value of the distance that has to be covered towards reaching the performance requirements set at the project’s design. Covering this distance is a decision-making problem for the project’s manager and management team and the proposed methodology provides quantified results of a risk-informed performance assessment to facilitate the decision-making process.
4. Discussion and Conclusions
This work contributes to the course of research of assessing construction projects performance through the incorporation of risk management. Although very relevant, the two frameworks remain heavily segmented despite the similarities in the processing and the common output, which is a decision-making factor. The proposed methodological framework for risk-informed construction project performance assessment integrates the benchmarking approach through indicators with a robust yet simple mathematical structure that is fully deployed in this paper. This approach does not take, directly, into consideration the potential interdependencies between performance variables. It rather settles to consider them only at the stage of assigning values to the model’s variables, where these values are provided based on several determining factors, including the interdependencies between performance elements. The reason for such an approach is that with respect to this issue, this research focused entirely on addressing the integration between risk and performance; therefore the performance model was selected to be an appropriate adaptation, evolution and, eventually, enrichment of previous work to improve the knowledge background and develop a new framework that incorporates the risk aspect in the form of coefficients to performance dimensions.
The proposed methodological framework is balancing between the required robustness and completeness of a sound approach and the adjustability and subjectivity that decision-making processes require and inherently possess. There are many weightings and ratings that introduce the human aspect of stakeholders and project management teams both concerning performance and risk aspects. At the same time, there are indicators assessed purely based on recorded data, while the adoption of fuzzy numbers for the modeling of risk provides a sound way for dealing with incompleteness of data when this is occurring. The research’s most important contribution though is that it performs risk-informed performance control and future performance estimations and provides quantified outputs that can be used from the construction project’s management team for deciding appropriate interventions with respect to the achieved and desired project’s performance. A comprehensive and easy to apply methodology such as the proposed one may be very useful for project managers in their everyday decision-making tasks and facilitate successful project’s performance management.
This research revisits the field of integrating risk and performance in a way that raises more questions and trigger further research. For example, what is the trade-off between costs and benefits from establishing processes and assigning resources to collect all the required data and then analyze them for an integrated risk and performance management? What should be the level of accuracy for modeling risks with fuzzy numbers or for determining the marginal values for the performance classes? What is the amount of the effort required when the several weightings and ratings by expert judgments involved are not considered as constants, but are subjected to changes during the project’s lifecycle? What is the amount of the effort required for applying this methodological framework in case of large and complicated projects?
Investigating for the responses of these questions and a constant revision process of the proposed framework are expected to be topics of related future research. Achieving better modeling of the performance variables by including their interdependencies and better calibration of the several weighting factors addressed in the methodology shall advance even more risk-informed performance assessment of construction projects.
Author Contributions
Conceptualization, M.P. and Y.X.; methodology, M.P.; validation, M.P.; formal analysis, M.P.; investigation, M.P.; resources, M.P. and Y.X.; data curation, M.P.; writing—original draft preparation, M.P.; writing—review and editing, Y.X.; visualization, M.P. and Y.X.; supervision, Y.X.; project administration, Y.X. All authors have read and agreed to the published version of the manuscript.
Funding
This research received no external funding.
Conflicts of Interest
The authors declare no conflict of interest.
References
- Musawir, A.; Serra, C.E.M.; Zwikael, O.; Ali, I. Project governance, benefit management, and project success: Towards a framework for supporting organizational strategy implementation. Int. J. Proj. Manag. 2017, 35, 1658–1672. [Google Scholar] [CrossRef]
- Lamprou, A.; Vagiona, D. Success criteria and critical success factors in project success: A literature review. Rel. Int. J. 2018, 1, 276–284. [Google Scholar]
- Bryde, D.; Unterhitzenberger, C.; Joby, R. Conditions of success for earned value analysis in projects. Int. J. Proj. Manag. 2017, 36, 474–484. [Google Scholar] [CrossRef]
- Demirkesen, S.; Ozorhon, B. Impact of integration management on construction project management performance. Int. J. Proj. Manag. 2017, 35, 1639–1654. [Google Scholar] [CrossRef]
- Orihuela, P.; Pacheco, S.; Orihuela, J. Proposal of performance indicators for the design of housing projects. Procedia Eng. 2017, 196, 498–505. [Google Scholar] [CrossRef]
- Sanchez, O.P.; Terlizzi, M.A.; de Moraes, H.R.O.C. Cost and time project management success factors for information systems development projects. Int. J. Proj. Manag. 2017, 35, 1608–1626. [Google Scholar] [CrossRef]
- Chen, H.L.; Chen, W.T.; Lin, Y.L. Earned value project management: Improving the predictive power of planned value. Int. J. Proj. Manag. 2016, 34, 22–29. [Google Scholar] [CrossRef]
- Omar, M.N.; Fayek, A.R. Modeling and evaluating construction project competencies and their relationship to project performance. Autom. Constr. 2016, 69, 115–130. [Google Scholar] [CrossRef]
- Warburton, R.D.H.; Cioffi, D.F. Estimating a project’s earned and final duration. Int. J. Proj. Manag. 2016, 34, 1493–1504. [Google Scholar] [CrossRef]
- Yun, S.; Choi, J.; de Oliveira, D.P.; Mulva, S.P. Development of performance metrics for phase-based capital project benchmarking. Int. J. Proj. Manag. 2016, 34, 389–402. [Google Scholar] [CrossRef]
- Abd El-Karim, M.S.B.A.; Mosa El Nawawy, O.A.; Abdel-Alim, A.M. Identification and assessment of risk factors affecting construction projects. HBRC J. 2015, 13, 202–216. [Google Scholar] [CrossRef]
- Zavadskas, E.K.; Vilutienė, T.; Turskis, Z.; Šaparauskas, J. Multi-criteria analysis of projects’ performance in construction. Arch. Civ. Mech. Eng. 2014, 14, 114–121. [Google Scholar] [CrossRef]
- Cheng, E.W.L.; Ryan, N.; Kelly, S. Exploring the perceived influence of safety management practices on project performance in the construction industry. Saf. Sci. 2012, 50, 363–369. [Google Scholar] [CrossRef]
- Naeni, L.M.; Shadrokh, S.; Salehipour, A. A fuzzy approach for the earned value management. Int. J. Proj. Manag. 2011, 29, 764–772. [Google Scholar] [CrossRef]
- Nassar, N.K. An integrated framework for evaluation of performance of construction projects. In PMI® Global Congress 2009—North America, Orlando, FL, USA, 10–13 October 2009; Project Management Institute: Newtown Square, PA, USA, 2009. [Google Scholar]
- Pheng, L.S.; Chuan, Q.T. Environmental factors and work performance of project managers in the construction industry. Int. J. Proj. Manag. 2006, 24, 24–37. [Google Scholar] [CrossRef]
- Thekdi, S.; Aven, T. An enhanced data-analytic framework for integrating risk management and performance management. Reliab. Eng. Syst. Saf. 2016, 156, 277–287. [Google Scholar] [CrossRef]
- Cokins, G. Performance Management: Intergrating Strategy Execution Methodologies, Risk and Analytics, 1st ed.; John Wiley & Sons, Inc: Hoboken, NJ, USA, 2009. [Google Scholar]
- Bassioni, H.A.; Price, A.D.F.; Hassan, T.M. Performance measurement in construction. J. Manag. Eng. 2004, 20, 42–50. [Google Scholar] [CrossRef]
- Aven, T. On the new ISO guide on risk management terminology. Reliab. Eng. Syst. Saf. 2011, 96, 719–726. [Google Scholar] [CrossRef]
- Aven, T. On how to define, understand and describe risk. Reliab. Eng. Syst. Saf. 2010, 95, 623–631. [Google Scholar] [CrossRef]
- Olechowski, A.; Oehmen, J.; Seering, W.; Ben-Daya, M. The professionalization of risk management: What role can the ISO 31000 risk management principles play? Int. J. Proj. Manag. 2016, 34, 1568–1578. [Google Scholar] [CrossRef]
- Aven, T. The risk concept-historical and recent development trends. Reliab. Eng. Syst. Saf. 2012, 99, 33–44. [Google Scholar] [CrossRef]
- Mohammed, H.K.; Knapkova, A. The Impact of total risk management on company’s performance. Procedia Soc. Behav. Sci. 2016, 220, 271–277. [Google Scholar] [CrossRef]
- Jafari, M.; Chadegani, A.; Biglari, V. Effective risk management and company’s performance: Investment in innovations and intellectual capital using behavioural and practical approach. Int. Res. J. Financ. Econ. 2011, 3, 780–786. [Google Scholar]
- Neely, A.; Adams, C.; Kennerley, M. The Performance Prism: The Scorecard for Measuring and Managing Business Success; Prentice Hall: Upper Saddle River, NJ, USA, 2002; pp. 159–160. [Google Scholar]
- Gordon, L.A.; Loeb, M.P.; Tseng, C.Y. Enterprise risk management and firm performance: A contingency perspective. J. Account. Public Policy 2009, 28, 301–327. [Google Scholar] [CrossRef]
- McShane, M.K.; Nair, A.; Rustambekov, E. Does enterprise risk management increase firm value? J. Account. Audit. Financ. 2011, 26, 641–658. [Google Scholar] [CrossRef]
- Lundqvist, S.A. An exploratory study of enterprise risk management: Pillars of ERM. J. Account. Audit. Financ. 2014, 29, 393–429. [Google Scholar] [CrossRef]
- Callahan, C.; Soileau, J. Does enterprise risk management enhance operating performance? Adv. Account. 2017, 37, 122–139. [Google Scholar] [CrossRef]
- Florio, C.; Leoni, G. Enterprise risk management and firm performance: The Italian case. Br. Account. Rev. 2017, 49, 56–74. [Google Scholar] [CrossRef]
- Pajares, J.; López-Paredes, A. An extension of the EVM analysis for project monitoring: The cost control index and the schedule control index. Int. J. Proj. Manag. 2011, 29, 615–621. [Google Scholar] [CrossRef]
- Acebes, F.; Pajares, J.; Galán, J.M.; López-Paredes, A. Beyond earned value management: A graphical framework for integrated cost, schedule and risk monitoring. Procedia Soc. Behav. Sci. 2013, 74, 181–189. [Google Scholar] [CrossRef]
- Acebes, F.; Pajares, J.; Galán, J.M.; López-Paredes, A. A new approach for project control under uncertainty. Going back to the basics. Int. J. Proj. Manag. 2014, 32, 423–434. [Google Scholar] [CrossRef]
- Leu, S.-S.; Lin, Y.-C. Project performance evaluation based on statistical process control techniques. J. Constr. Eng. Manag. 2008, 134, 813–819. [Google Scholar] [CrossRef]
- Colin, J.; Vanhoucke, M. Setting tolerance limits for statistical project control using earned value management. Omega 2014, 49, 107–122. [Google Scholar] [CrossRef]
- Lipke, W.; Zwikael, O.; Henderson, K.; Anbari, F. Prediction of project outcome. The application of statistical methods to earned value management and earned schedule performance indexes. Int. J. Proj. Manag. 2009, 27, 400–407. [Google Scholar] [CrossRef]
- Zidane, Y.J.-T.; Andersen, B.; Johansen, A.; Ahmad, S. “Need for Speed”: Framework for measuring construction project pace—Case of road project. Procedia Soc. Behav. Sci. 2016, 226, 12–19. [Google Scholar] [CrossRef][Green Version]
- Langston, C. Development of generic key performance indicators for PMBOK® using a 3D project integration model. Australas J. Constr. Econ. Build. 2013, 13, 78–91. [Google Scholar] [CrossRef]
- Majumder, D.; Debnath, J.; Biswas, A. Risk analysis in construction sites using fuzzy reasoning and fuzzy Analytic Hierarchy Process. Procedia Technol. 2013, 10, 604–614. [Google Scholar] [CrossRef]
- Yeung, J.F.Y.; Chan, A.P.C.; Chan, D.W.M. Fuzzy set theory approach for measuring the performance of relationship-based construction projects in Australia. J. Manag. Eng. 2012, 28, 181–192. [Google Scholar] [CrossRef]
- Samantra, C.; Datta, S.; Mahapatra, S.S. Fuzzy based risk assessment module for metropolitan construction project: An empirical study. Eng. Appl. Artif. Intell. 2017, 65, 449–464. [Google Scholar] [CrossRef]
- Shankar, N.R.; Rao, P.P.B. Ranking fuzzy numbers with a distance method using circumcenter of centroids and an index of modality. Adv. Fuzzy Syst. 2011, 2011, 1–7. [Google Scholar]
- Royer, P.S. Risk management: The undiscovered dimension of project management. Proj Manag. J. 2000, 31, 6–13. [Google Scholar] [CrossRef]
- Zolotukhin, A.; Gudmestad, O. Application of fuzzy sets theory in qualitative and quantitative risk assessment. Int. J. Offshore Polar Eng. 2002, 12, 1–9. [Google Scholar]


© 2020 by the authors. Licensee MDPI, Basel, Switzerland. This article is an open access article distributed under the terms and conditions of the Creative Commons Attribution (CC BY) license (http://creativecommons.org/licenses/by/4.0/).