Article

Sustainability of Railway Undertaking Services with Lean Philosophy in Risk Management—Case Study

1
Faculty of Operation and Economics of Transport and Communications, University of Zilina, 010 26 Žilina, Slovakia
2
Faculty of Security Engineering, University of Zilina, 010 26 Žilina, Slovakia
3
The Institute of Technology and Business in Ceske Budejovice, Faculty of Corporate Strategy, 370 01 Ceske Budejovice, Czech Republic
4
Politechnika Częstochowska, ul. Dąbrowskiego 69, 42-201 Częstochowa, Poland
5
Railways of the Slovak Republic, Klemensova 8, 813 61 Bratislava, Slovakia
*
Author to whom correspondence should be addressed.
Sustainability 2020, 12(13), 5298; https://doi.org/10.3390/su12135298
Submission received: 27 May 2020 / Revised: 25 June 2020 / Accepted: 28 June 2020 / Published: 30 June 2020
(This article belongs to the Special Issue Sustainable Railway System)

Abstract

:
The sustainability of services in undertakings which operate in railway passenger transport is closely connected with efforts to provide high-quality and time-acceptable services to the customer, to achieve lean processes, to standardise work processes, to eliminate wastage and to avoid those activities which do not add any value. Considering its ecological nature and big volume of passenger transport, railway passenger transport represents an irreplaceable sustainable system for the future. These facts and the entry of new railway carriers into this system highlight the importance of managing risks in a progressive way. This article focuses on the options of risk management when versatile and flexible tools, such as Lean tools, are set correctly. The aim of this article is to introduce a proposal for the application and a specific application of Lean philosophy in risk management which impacts train delays in railway passenger transport. From the point of view of quantitative data analysis, multiple mathematical-statistical tests have been used to assess data (e.g., Anderson–Darling test, Kolmogorov–Smirnov test, Jarque–Bera test, two-tailed test, Grubbs’s test and Thompson Tau test). Also, descriptive statistics and ANOVA test (Analysis of Variance) have been applied in the process of evaluating the monitored attributes. In order to assess the data dependency, Chi-Square Test and a correlation analysis have been applied. The research outcomes focus on highlighting the need for a systematic approach for train delays and to avoid delays through risk management. The case study applies selected Lean methods to monitor train delays in selected stations within the main railway corridor of the Slovak Republic for the period from 2015 to 2018. In 2019, the results were processed and created a basis for proposing a unique software tool like an aid for risk management in the case of train delays using Lean philosophy. The flexible software includes the participation of employees, and at the same time, it respects the needs of customers. The research results provide grounds for further study of risks in a challenging environment of railway undertakings, with different types of trains, railway stations as well as entire railway networks. The processed results of the article represent valuable material for railway undertakings not only in Slovakia but also for railway organisations in V4 countries.

1. Introduction

The current era can be characterised by turbulent development on the transport market [1]. Challenges of sustainability also impact business activities of railway undertakings [2]. Achieving and maintaining a competitive position of a railway undertaking on a global transport market comes across many risks, and thus, it puts pressure on innovative thinking [3]. This is very challenging under the conditions of such a broad issue like railway transport; however, at the same time, it provides a large space for research in this area [4,5]. From an external aspect, railway undertaking is exposed to competition of road transport [6]. Moreover, thanks to the liberalisation of the railway market, new railway undertakings have entered the market [7]. Their increasing number leads to the necessity for complete understanding of their own processes, of their functioning as well as of risks with which the operation is linked [8,9,10,11]. The importance of this research is underlined with the fact that sustainability of the entire transport system comes hand in hand with quality services of public passenger transport which are convenient to customers’ needs [7]. Customers cannot be provided with services which, in their eyes, add no value [12]. Such a state is linked with the existence of many risks. A real operation indicates that the existence of risk is a principal problem of providing quality services [7]. Accurate identification, analysis, evaluation, communication and constant monitoring of risks, their reasons and consequences represent a single way to set priorities and to eliminate impacts of risks on the customer [7]. Knowledge published so far proves that a constant improvement is related to risks to such an extent which is a priority for the customer in making decisions on utilising the services of a railway undertaking in the future [13,14,15].
Continuous improvement is a basic principle of achieving quality in railway passenger transport. Therefore, it is necessary to understand the individual processes in connection with risks in each transport undertaking. Several quality-improvement tools are available worldwide to understand and analyse processes and services in detail [16]. Currently, there exists a space in research and thus also in literature which focuses on Lean in the sector of services [17]. Therefore, it was a big challenge for authors to concentrate on the options to apply Lean philosophy in the environment of railway transport services. This philosophy has been the object of an extensive research in which the authors of the paper have paid attention to the optimisation of processes of undertakings providing services in railway passenger transport. Considering this fact, it was mainly the effort of railway undertakings to achieve improvements permanently [18]. This study fills a gap in railway transport services with a new perspective through Lean philosophy with priority oriented to satisfying customers’ needs in the absolute and best possible way. This research focuses on railway undertakings in efforts to maintain the culture of constant improvement, with the support of employees, and on increasing the value for the customer. The uniqueness and originality of this study lie in the identification of risks in railway transport on a strategically important international corridor for passenger railway transport. An innovative aspect of this study lies in the approach of defining how it is possible to implement risk management in railway transport services by gradual appropriate steps using new software support because this approach does not yet exist in this area in the studied countries [19,20,21].
The aim of this article is to introduce a proposal for the application of Lean philosophy in risk management which impacts train delays in railway passenger transport. The incentive for the research was the fact that train delays affect the quality of railway passenger transport services with a 49% share, as documented in a previous study of the authors [7], which corresponds to the previously published findings of academics and researchers studies [22,23]. With their synergic effect, train delays affect many other factors and have a negative impact on the quality of railway transport services [24,25]. The article presents partial outcomes of the research aimed at the categorisation of risks in the railway operation and their impact on train delays in the entire network of the infrastructure manager of Zeleznice Slovenskej republiky (ZSR) in the Slovak Republic for the period from 2015 to 2018. The case study analyses R606 express train delays in selected stations within the main railway corridor of the Slovak Republic in more details. Žilina, Púchov, Trenčín, Leopoldov and Trnava stations and Bratislava—the main station—are included. The train is operated by the state carrier Železničná spoločnosť Slovensko. The research studied errors and individual reasons for delays, and it applied Lean tools, the application of which is universal for individual line sections and types of trains. This research was launched under the impulse of the national carrier of the railway passenger transport as well as the manager of the railway infrastructure of ŽSR; they needed to find out what options the philosophy offered for this sector which produced services.
Lean tools are supplemented by the authors’ proposed method of calculating the quality of service in the transport phase. In the next step, this calculation is implemented in new software improving the approach to risks with the involvement of employees and customers. The infrastructure manager did not use these tools and preventively monitored the risks that need increased attention, as it is the most important international corridor of passenger transport. The proposed software solution, which can be used in the V4 countries, also contributes to the originality of the processed benefits. The passenger transport carrier records delays in Microsoft Excel; furthermore, neither the prevention nor the efforts to eliminate risks in the future are addressed in many cases [18].
Thus, this research into train delays is innovative in terms of Lean philosophy, where stakeholders have the opportunity to supplement the system with information in the new software support. It emphasises that the quality of processes and services in railway transport can only be achieved with a systematic risks’ monitoring and their appropriate recording. The recordings must be not only informative but also comprehensible and flexible for users. The effort is to involve all employees of the railway undertaking into the application of the risk management process so they can learn and try to avoid any risks in the future. The research results not only brought risks’ monitoring using Lean philosophy but also introduced a proposal for a new software tool with respect to the sustainability of quality as well as in relation to customers.

2. Background

2.1. A Railway Undertaking on a Transport Market and the Sustainability of Services

The transport market and its new challenges for railway undertakings are related to the global environment and liberalisation of services [1]. Under the regulation SR1025, railway undertakings are businesses in which the line of business lies in the provision of transport services to provide railway transport [26]. The transport market is a place where carriers and agents of transport services and carriers meet; it is a place where transport services are sold and purchased using the system of prices for transport, transport conditions and conventions [24].
This article deals with railway passenger transport. A service is a product of railway passenger transport [27]. Transport must meet the basic criteria of quality required by the customer and set in international standards at the same time [25,26]. A customer of a transport undertaking is a passenger but also of the state since in many cases the services are provided in public interest [2].
With the current increase in individual transport, it is necessary to find some new options of improvement in the area of mass transport not excluding the railway transport [28,29,30,31,32].
The necessity to adopt these changes is closely related to the worldwide trend to orientate towards a customer which is nowadays more and more related to the term of quality of provided services or sustainability of services [29,30,31,32,33]. The European Union White Book aims to create a competitive transport system with an emphasis put on ensuring the sustainability of railway services quality, i.e., accessibility and reliability of transport services as well as rights of railway passenger transport’s users with regard to compensation for delays [34]. Furthermore, a published study of rail passenger transport in Asia also highlights the complexity of planning and investment to be efficient and to serve the needs of society. [35]. In the field of providing services in railway passenger transport, it is inevitable to take the following into account: requirements of the legislation as well as claims of customers change over time [36]. At any instant of a transport service, it is necessary to know what expectations the customer has and to what extent it is them who evaluates the quality of provided services and to decide on repeated use or not of this type of transport [37,38,39].
Published studies by foreign authors from Australia, Italy, Spain, the USA and New Zealand suggest various dimensions of sustainability in the transport sector [40,41,42]. The authors consider sustainable transport indicators as decision-making components which should reflect economic, social and environmental impacts [41,42,43,44,45,46,47,48]. According to the Council of the European Union, a sustainable transport system should be analysed from three different dimensions: An economic dimension, where an undertaking operates fairly and efficiently, offers choice of transport mode and supports a competitive economy; a social dimension, which allows basic access and development needs of individuals, companies and societies to be met safely and in a manner consistent with human and ecosystem health; and an environmental dimension, which limits emissions and waste within the planet’s ability to absorb them and uses nonrenewable resources at or below the rates of development of renewable substitutes while minimizing the impact on land and the generation of noise [49].

2.2. Lean Philosophy and its Relation to Services of Railway Passenger Transport

In the world, the necessity to introduce innovative solutions into processes and services in many areas is connected with Lean Six Sigma philosophy [50,51]. The idea of the author Patyal is that this philosophy should be integrated to produce a synergistic effect on quality performance, which, in turn, may increase business performance in an undertaking [52]. According to Yerubandi, the main objective of Six Sigma is 3.4 defects per million opportunities, which leads to fulfilling the customer requirements [53]. It gets a lot of attention at both the theoretical and research levels. According to Belhadi, the integration of Lean Six Sigma attracts the attention of both researchers and experts from the practice [54]. Lean is a really extensive philosophy of management applicable to many spheres. For example, Dursun deals with the application which is illustrated via a case study conducted in a bank that performs in the Turkish banking sector [55]. In his research, Ahmed underlines the issue of implementing Six Sigma methodology, its benefits as well as demandingness under the conditions of different organisations [56]. World authors highlight the need for studying the approaches to constant improvement [48]. Gutierrez shows a significant relationship between Six Sigma practices, team management and statistical metrics [57]. Zhang defines an important part, DMAIC (Define, Measure, Analyse, Improve and Control), as a means for a constant improvement of processes within an undertaking [58]. Respecting the research conducted by Lirazzeli, Lean philosophy requires a complexity of tools as well as a continuous training of employees [59]. The successful adoption of Six Sigma in an organization is dependent, at least in part, on the adoption of Six Sigma at the individual level [60]. Parekh says that the Six Sigma technique can evaluate the quality of current activities and can quantify the improvement goals so as to control success in critical activities for the project [61]. Six Sigma that was initially developed as a methodology to eliminate defects has been transformed into an operational improvement strategy in addition to extending the areas for its deployment [62,63]. As stated by Gupta, the author of the research, the interconnection of working teams and the complexity of methods, tools and techniques are important [64].
The well-known Six Sigma philosophy which overcomes constraints and shortcomings of some other concepts and connects the interests of both, customers and employees is not often applied under the conditions of railway transport. To find out the actual state of this philosophy’s adoption, the authors of this article conducted a questionnaire survey among infrastructure managers and carriers across Europe with more than 300 companies asked to complete it in 2019; 215 companies answered the questionnaire. Six Sigma as an integral system is used by Deutsche Bahn in Germany [18]. Other companies apply tools selected individually. Lean philosophy is adopted by WKO’s Wien [7]. Other companies have stated that they would be interested in exploring the options of the application. Currently, enterprises do not apply the concept to a full extent and the results imply that they apply some of the tools included in the Six Sigma methodology only partially. In 80% of cases, they apply a Pareto chart; in 12%, they apply a bubble chart; in 4%, they apply a bar chart; and the remaining 4% apply histograms, DOEs and control charts [60]. Pursuant to the survey, the quality management system in railway undertakings is oriented to ISO standards or the European Quality Foundation Model. The Lean Sigma concept strives to reduce the time between the supplier and the customer through eliminating the wastage in the chain between them. Under the conditions of railway transport, it means shorter time of transport, better awareness, saving of resources in processes, less extra investments and fewer errors. In a railway undertaking, it means the achievement of better outcomes in the form of services of higher quality with significantly reduced inputs. This idea comes out from the fact that high productivity does not mean working harder but better organisation of work in the railway operation and a correct conduct of activities for the first time.

2.3. Train Delays in the Railway Operation and Risk Management

The overall quality of railway passenger transport is impacted with many criteria which represent the customer’s view on the service provided [7]. For an empirical test in this research, a criterion of train delays has been chosen which has been based on real statistical data [18]. Regulation 1371/2007/EC of the European Parliament and of the Council on Railway Passengers’ Rights and Obligations says that a railway carrier shall be liable for the carriage and shall respect all passengers’ rights which result from it [19]. Train delays are inconvenient for both the passenger and the carrier when wastage occurs in a real operation [7]. The timetable of a train is like a document which establishes a time position of the train in a specific line section and defines travelling time for each train [14]. Based on Stoilov’s thoughts, planning must consider various criteria of the transport process [65]. If the travelling time is exceeded, then the passenger can be compensated for a train delay. The passenger is entitled to making a claim for indemnity upon the travel end on the basis of their original ticket [66].
The issue of delays is also dealt with in the decision of the Passenger Rail Committee of International Union of Railways (UIC), which has approved the quality policy related to, among others, delays, reliability and accuracy with competitive transport times, based on market-oriented times of departures and arrivals of trains [67].
Timeliness is likewise defined in EN 13816 standard, which considers it one of essential criteria for the quality of services in passenger transport [68]. If timeliness is not observed and trains begin to be late, there arises wastage and redundant processes or activities which are then necessary for the wastage elimination. Delays cause wastage, which affects the carrier, infrastructure manager and customer but also the elementary element of the process to ensure provision of services, i.e., motion of a transport means from its starting point to its destination [7]. Previous studies point to train delays and risk analysis from various perspectives, as shown by a team of scientists from Northern Ireland [69] as well as an extensive study from Switzerland [70]. According to a study by Chinese scientists, it is important to address different types of delays from the point of view of the infrastructure, stations, capacity of a railway line, bottlenecks and resulting congestions [71]. Research by Dutch authors also points to another phenomenon that the current system of the existing manual incident registration of train dispatchers is insufficient with respect to comprehensiveness, reliability and objectivity [72]. Another team of scientists from the Netherlands addresses the impact of delays on passengers [73]. A team of scientists from Canada and China discusses the problems of visual analysis of relevant delay indicators after the occurrences of disturbances [74]. Other Chinese authors talk about the need to monitor train delays based on real-world train operation records that is an essential issue to delay management [75]. Risks of train delays related to security are particularly serious; as authors from South Korea claim, risks should be further analyzed to create plans considering structural and environmental characteristics [76]. Authors from Italy and France talk about the problem of minimizing delays with respect to energy consumption, which is becoming a central issue both from environmental and economic perspectives, but it is usually neglected in the timetable recalculation [77]. A collaboration China and America also studied train delays by combining train timetabling, platforming and routing as a means of optimization [78]. Briggs and Beck conducted a statistical analysis of train delay fault records based on the operational data of the British Railways [79]. Train delays are also an economic category, as the Swedish authors declare [80]. Since it is a large system, the authors of this research want to contribute further insights into this issue, in line with the Lean philosophy [18,81]. According to Galli, to ensure success, risks must be identified and mitigated [82]. The ISO 31000 standard defines risk management as a coordinated activity of an organisation management and control with respect to risk [83]. Under the conditions of railway passenger transport, the aim of risk management is to monitor risks constantly and to suggest measures of a precautionary character correctly as it is proved with published studies which deal with a relation among risks and their assessment with respect to accident events [84,85,86]. All events which can occur in the railway operation are demand for wastage of resources, financial losses, material losses or health threat and threat to human life [7]. Whether an incident; threat to safety; a small, middle or big accident; or any emergency situation happens [87], the task is to eliminate wastage and to make an effort to prioritise precautionary measures.
In the first phase of risk management, it is necessary to determine connections and to define part of the railway passenger transport system which will be subject to study [88]. In the case of this research, we will study facts which may represent potential risks. Upon determining the system which will be subject to study, there follows the next step of identifying the biggest number of risks possible in individual categories within railway passenger transport [89]. It is required to set categories of risks, resources of risks, and for which participant on the transport market the risks occur [7]. The participant may be a manager of infrastructure, carriers, customers or third parties. The follow-up analysis of risks should bring information on what extent the specific risks are to be dealt with and what method is to be used for the analysis [90]. Also, under the conditions of railway passenger transport, the aim of risk assessment is to decide on the importance of the risk or the tolerability rate of the risk [91]. Therefore, in railway passenger transport, communication and consultations are of extreme importance during the entire transport chain in all processes in the delivery of services [92]. Monitoring of risks brings new information needed for constant improvement in the work with a risk in railway passenger transport [93]. Communication, consulting, monitoring and testing represent feedback; its main role is to constantly improve processes with the elimination of the wastage in railway transport [27].
In railway passenger transport, a huge number of potential risks may be distinguished. Perspectives of a passenger, a carrier operating the transport or an infrastructure manager do differ. The passenger perceives the risk subjectively [94]. The basic division of risks lies in individual phases of transport, i.e., before, during and after transport [88]. Another division looks at the difference between the risk on a train and in a railway station [32]. Risks are connected with the nature of the infrastructure but also with the nature of rail vehicles [90]. Vehicles can be locomotives and wagons. The categorisation of risks has been dealt with by the authors in more detail with respect to conditions of a carrier and a manager of the railway infrastructure. It is described in the following section of this article in detail, and it has become the basis of the research.

3. Materials and Methods

The main aim of this research was to judge the application of Lean philosophy tools in train delays in connection with risk management. Its purpose was both to help explain the origin of risks from the theoretical point of view and to support preventive effects on risks and their elimination in the real operation. The article presents the results of outcomes of the risk research which impact train delays in railway passenger transport and influence the quality of provided services. The research was monitoring train delays caused by operational, technical, personal and other risks. The sources were formed with data tracked by the research authors in cooperation with the manager of the railway infrastructure and the national carrier providing railway passenger transport within the main railway corridor of the international importance. The quantitative research was conducted continuously for four years since 2015 to 2018. The collected data was processed in 2019 and assessed in the first half of 2020. The sources were formed with data tracked by the research authors in cooperation with the manager of the railway infrastructure and the national carrier providing railway passenger transport within the main railway corridor of the international importance. The quantitative research was conducted continuously for four years since 2015 to 2018. The collected data was processed in 2019 and assessed in the first half of 2020 [18].
The design of the software support was based on the method of calculating the quality of service in the transport phase, which was proposed by the authors as an innovative element within the Lean philosophy. This relationship is the basis for the created software application (described in the Discussion section) and is based on subjective evaluations of passenger quality criteria and on the determination of weights of importance and degree of performance. The basic form of service quality calculation is as follows [18]:
Kps = 1 − (Vk. Hk.|1 − pvr|)
where Kps is the quality of service in the phase of transport, the value of which ranges between <0.1> while the closer the value is to 1, the higher the quality is (Kpsmax = 1, Kpsmin = 0) and values more than 0.4 are considered a limit of the quality; Vk is train category (EuroCity, EuroNight, SuperCity, interCity, Regional Express, EuroRegio, Express train, passenger train and a train without passengers); Hk is quality value (the total quality value can be calculated by using a multicriteria evaluation model by the multiplication of importance level and satisfaction level); and PPvr is the probability of occurrence of risk (determined by monitoring the occurrence of deviations from quality).
This method clearly alerts you in a software environment where corrective and preventive action is required.

3.1. Data Analysis and Processing

In order to fulfil the main aim of this article and to confirm the individual set hypothesis, there were applied multiple logic and scientific as well as mathematical-statistical methods working with both quantitative (discrete and continuous) and qualitative (nominal and ordinal) statistical measures. The initial analysis was used in the process of recognition and solution of various problems of the studied issue, e.g., the analysis of knowledge from the expert home and foreign literature and scientific articles to process the current state of the issue solved. The comparison method was used to compare selected statistical measures among each other and to compare and evaluate its own processed results. During the processing of the obtained data from the point of view of quantitative data, analysis tests for data analysis were used. The assessment of the probability distribution of a set was calculated on the basis of Anderson–Darling test as well as measures of the descriptive statistics, i.e., kurtosis and skewness. A significant factor is when p > 0.05, and the bigger the value is, the higher the probability of normal distribution of tested data is [95]. To assess data and to verify the calculation, the following tests were also conducted: Anderson–Darling test, Thompson Tau test, Kolmogorov–Smirnov test, Jarque–Bera test and two-tailed test. Moreover, descriptive statistics and ANOVA statistics were applied in the process of assessing individual data [6].
Then, the Grubbs’s test was applied to remove individual extremes which might misrepresent the results. The statistical analysis and output data were calculated in the MS Excel environment with elements used for the calculation of given tests and with the help of Minitab.
In order to analyse qualitative data, the Chi-Square Test of dependency was applied [95]. Chi-Square Test is defined as a test meant for the calculation of dependency between two qualitative indicators when it is necessary to set individual hypotheses which must be verified in a follow-up. It is a must to define the reliability level too.
Based on the processed initial analysis, i.e., the analysis of knowledge from the expert home and foreign literature and scientific articles, the analysis of the current state and the analysis of results within the project resolution, the aim of the paper was established; the research questions which are the grounds for hypotheses formulation represent its consequences.

3.2. Development of the Research Questions and Hypotheses

The work with data required a sequence of individual steps which resided in the formulation of specific research questions and hypotheses. The hypotheses were established based on the research goal. Their formulation is based on the requirements of the railway infrastructure manager and the national carrier. The data was observed as part of the research in cooperation with the transport division of the railway infrastructure manager Železnice Slovenskej republiky and in cooperation with the internal audit division of the ZSSK carrier. For the sake of the best possible data assessment as well as the work with it, it is necessary to determine if the obtained data featured a normal distribution. Due to this requirement, there exists a necessity to apply multiple statistical tests. Based on the information above, it was inevitable to formulate the following research hypothesis:
Hypothesis 1. 
The obtained data comes from a normal (Gauss) probability distribution.
Based on various studies which deal with train delays; with the monitoring of conditions in railway stations, within the corridor and during the train drive [28,33]; and with the study of both individual line sections and an entire railway network, it was possible to formulate the next research question. The question was articulated, coming out from the assumption that, if a train was or is late in the current station, it would also be late in the immediately following one. In order to confirm this assumption, it is required for the times of delays between individual stations which follow each other to be dependent. The following research hypothesis may be accepted:
Hypothesis 2. 
The times of delays in individual stations are mutually dependent.
Thanks to the authors’ experience from home and foreign researches [7,18,92] as well as monitoring of train delays in real operations in the field, it is possible to track a high number of errors in the operation which impact train delays. One of the examples is exceeding the travel time. The travelling times in individual line sections are determined by the infrastructure manager, and they come out from dynamic properties of the locomotives used, which allow for train operation with a set weight under given slope and direction line conditions. The source data regarding dynamic properties of the railway vehicles used is provided by a relevant carrier. If the travelling time is exceeded and it is caused by a train delay but the locomotive is not concerned, the reason for the risk must be assessed and its source must be found, i.e., whether it is on the site of the carrier (railway undertaking (RU)) or the infrastructure manager (IM). The travelling times of the train are calculated by the kind and parameters of the train, by the track speed or by the calculation method used to include the surcharges for the start and stop. The travelling times include the impact of temporary constraints of the track speed (e.g., closures and interventions after accidents); the option of a present or progressive acceleration in the sections is considered. Another significant operational risk is the sequence of trains which was there in researches [34,37] assessed as being a very frequent risk. A sequence of trains happens when there is a train delay due to the delay of another train. The train which is on its route on time is late since it must give preference to another already late train. In that case, the tracks in the station are occupied, and thus, another train route must be selected; there is no free track or platform. The research hypothesis is as follows:
Hypothesis 3. 
The operational risks form the biggest share of delays of R606 train on the Žilina–Bratislava line in the monitored period.
Due to time irregularity, the research [3,9,11,33] introduce a phenomenon of different results of delays by weekdays. Usually, the most frequent delay of trains can be observed on Fridays and Sundays. On these days, extra trains are operated, i.e., there is a higher number of trains which may be routed with regard to the throughput of line sections, however, at the same time in accordance with higher requirements of customers. Also, the number of wagons arranged in trains is bigger, which may cause higher demands on the train operation and more challenging situations on platforms when the passengers get on and off. Based on the experience of railway undertakings, a higher frequency of passengers can be monitored on these days. In particular, it is caused by the return of people who work or study away from their place of residence and commute to work. On the basis of the information above, the following research hypothesis was formulated:
Hypothesis 4. 
The biggest frequency of train delay is on Fridays and Sundays, and the delays on individual days are mutually dependent.
Based on studies [7,18], a higher frequency of passengers is one of the core problems of railway passenger transport. The issue lies in a higher number of passengers, a greater scope of the transport performance in the monitored period in the given station, line section or train in the case of a time and direction irregularity in transport while servicing the customers with regard to occupancy of doors in wagons as well as servicing handicapped customers (as stated in the work by Petrovsky [96]). These facts are the grounds for the research hypothesis:
Hypothesis 5. 
The most frequent error which causes train delays is a higher frequency in a line section.
The process of transport by railway passenger transport itself, which was the object of the research, is unstable based on the authors’ experience and preliminary data analysis. The carrier provides services in an environment where many stochastic impacts exist. Operative interventions are needed on a daily basis. Dispatcher machines of carriers and railway infrastructure managers must intervene in many emergency situations. These events impact the entire transport chain with a synergic effect. On the basis of the information above, it was possible to formulate the following research hypothesis:
Hypothesis 6. 
The studied process is unstable.
The authors’ experience as well as the monitoring of the line section in a long time horizon suggest that the DPU (Defects per Unit) indicator will achieve the highest value in Trnava railway station. This phenomenon may be caused by many passengers travelling to/from Bratislava and many trains within both long-distance and regional transport which do not continue to Žilina. In a long-term run in Trnava, a much larger frequency of passengers on platforms can be seen than in other tracked railway stations. These facts are the foundations for the research hypothesis:
Hypothesis 7. 
The biggest value of DPU indicator is in Trnava railway station.

4. Results and Discussion

The product of passenger transport is the effect of relocation which is of an intangible nature. This means it is consumed during the transport process. During this relocation, passengers evaluate the services provided by carriers, which leads to their decision of whether they will utilise railway passenger transport again. In order to maintain loyal customers, it is inevitable for the carrier to address the customers’ requirements and to make the biggest possible efforts to reflect them directly in the operation. As it has already been mentioned above, passengers consider train delays to have a significant impact on the service quality. In the sector of railway passenger transport, it is very difficult to apply steps which would lead to an effective and systematic improvement of quality; the reasons lie in the extent of the operation (many employees and assets) and in the many passengers, where each of them perceives the quality individually and has their own requirements on satisfactory travelling. It is because of these complex input parameters that the need to find a systematic way to reduce the wastage connected with the risk development exists. In the next steps of the research, the hypotheses set have been studied and verified.

4.1. Research of Hypothesis H1

In order to assess the hypothesis, first of all, the statistical set must be analysed as a whole. This will provide a basis for the identification of its basic characteristics. Figure 1 presents a summary statistic of the statistical set.
Figure 1 implies that the analysed data does not fulfil the assumption to confirm the hypothesis on normality of the statistical set (p-value < 0.05). Thus, it may be stated that the data distribution is not normal (we accept an alternative hypothesis). This can also be seen in the measures of kurtosis and skewness (Table 1). A significant mismatch in the area of the normal data distribution can also be seen in the comparison of mean and median measures, which differ considerably. Currently, the set comprises many extremes as well as individual groups which, however, do not contain many measures, and pursuant to the conducted Thompson Tau test, in the case of extremes, there is no assumption they would misrepresent the achieved results markedly; on this basis, it is possible to leave them in the statistical set. Since the skewness of the distribution is too big, the standard deviation will not provide sufficient information on the scatter of individual data in the statistical set.
From the point of view of the analysis of the mean and median of individual selected stations data, we can observe the same behaviour of data, just with smaller differences in individual selected characteristics of the descriptive statistics. Based on that hypothesis H1 formulated before can be rejected, the obtained data comes from a normal (Gauss) probability distribution, and it is required to accept the alternative hypothesis: the obtained data does not come from a normal (Gauss) probability distribution.

4.2. Research of Hypothesis H2

Based on the results of the descriptive statistics (as documented in Table 2), we can think of a mutual dependency of times in individual stations in a line section. It can be concluded that, if a train is late to the previous station, it will also be late to the next station. This occurs in a single corridor which undergoes closure activities due to its modernisation in the monitored period (it is also the result of previous author’s study [7]). Therefore, it is required to address the correlation. An alternative and a main hypothesis has been set:
  • H0: The times of delays in individual stations are mutually independent.
  • H1: The times of delays in individual stations are mutually dependent.
The results of the correlation analysis (Table 2) document that hypothesis H2 can be accepted. The times of delays in individual stations are mutually dependent; however, the highest dependency (Table 3), which is proved, is only weak and occurs between Púchov and Leopoldov (0.21). Based on the result, we may state that the dependency from the first monitored station (Žilina) to the destination station (Bratislava) decreases progressively. This phenomenon is caused by multiple factors occurring in the line. We speak about the already mentioned closure activity and securing the connectability of trains. However, it is possible to observe almost the same dependency always between the current and the previous stations except for Trenčín and Leopoldov. It is necessary to emphasise that the dependency in all other cases is low, even very low, i.e., there are multiple variables affecting the dependency.

4.3. Research of Hypothesis H3

The categorization of risks has been created by a method of observation by experts in cooperation with the transport division of a manager of railway infrastructure, and the marketing section and the internal audit division of the ZSSK carrier [18]. Risks have been categorised to operational, technical, manager, personal risks, natural disasters and other risks. This categorization was based on detailed daily data collection of railway operation recorded in the Microsoft Excel for the observed period from 2015 to 2018.
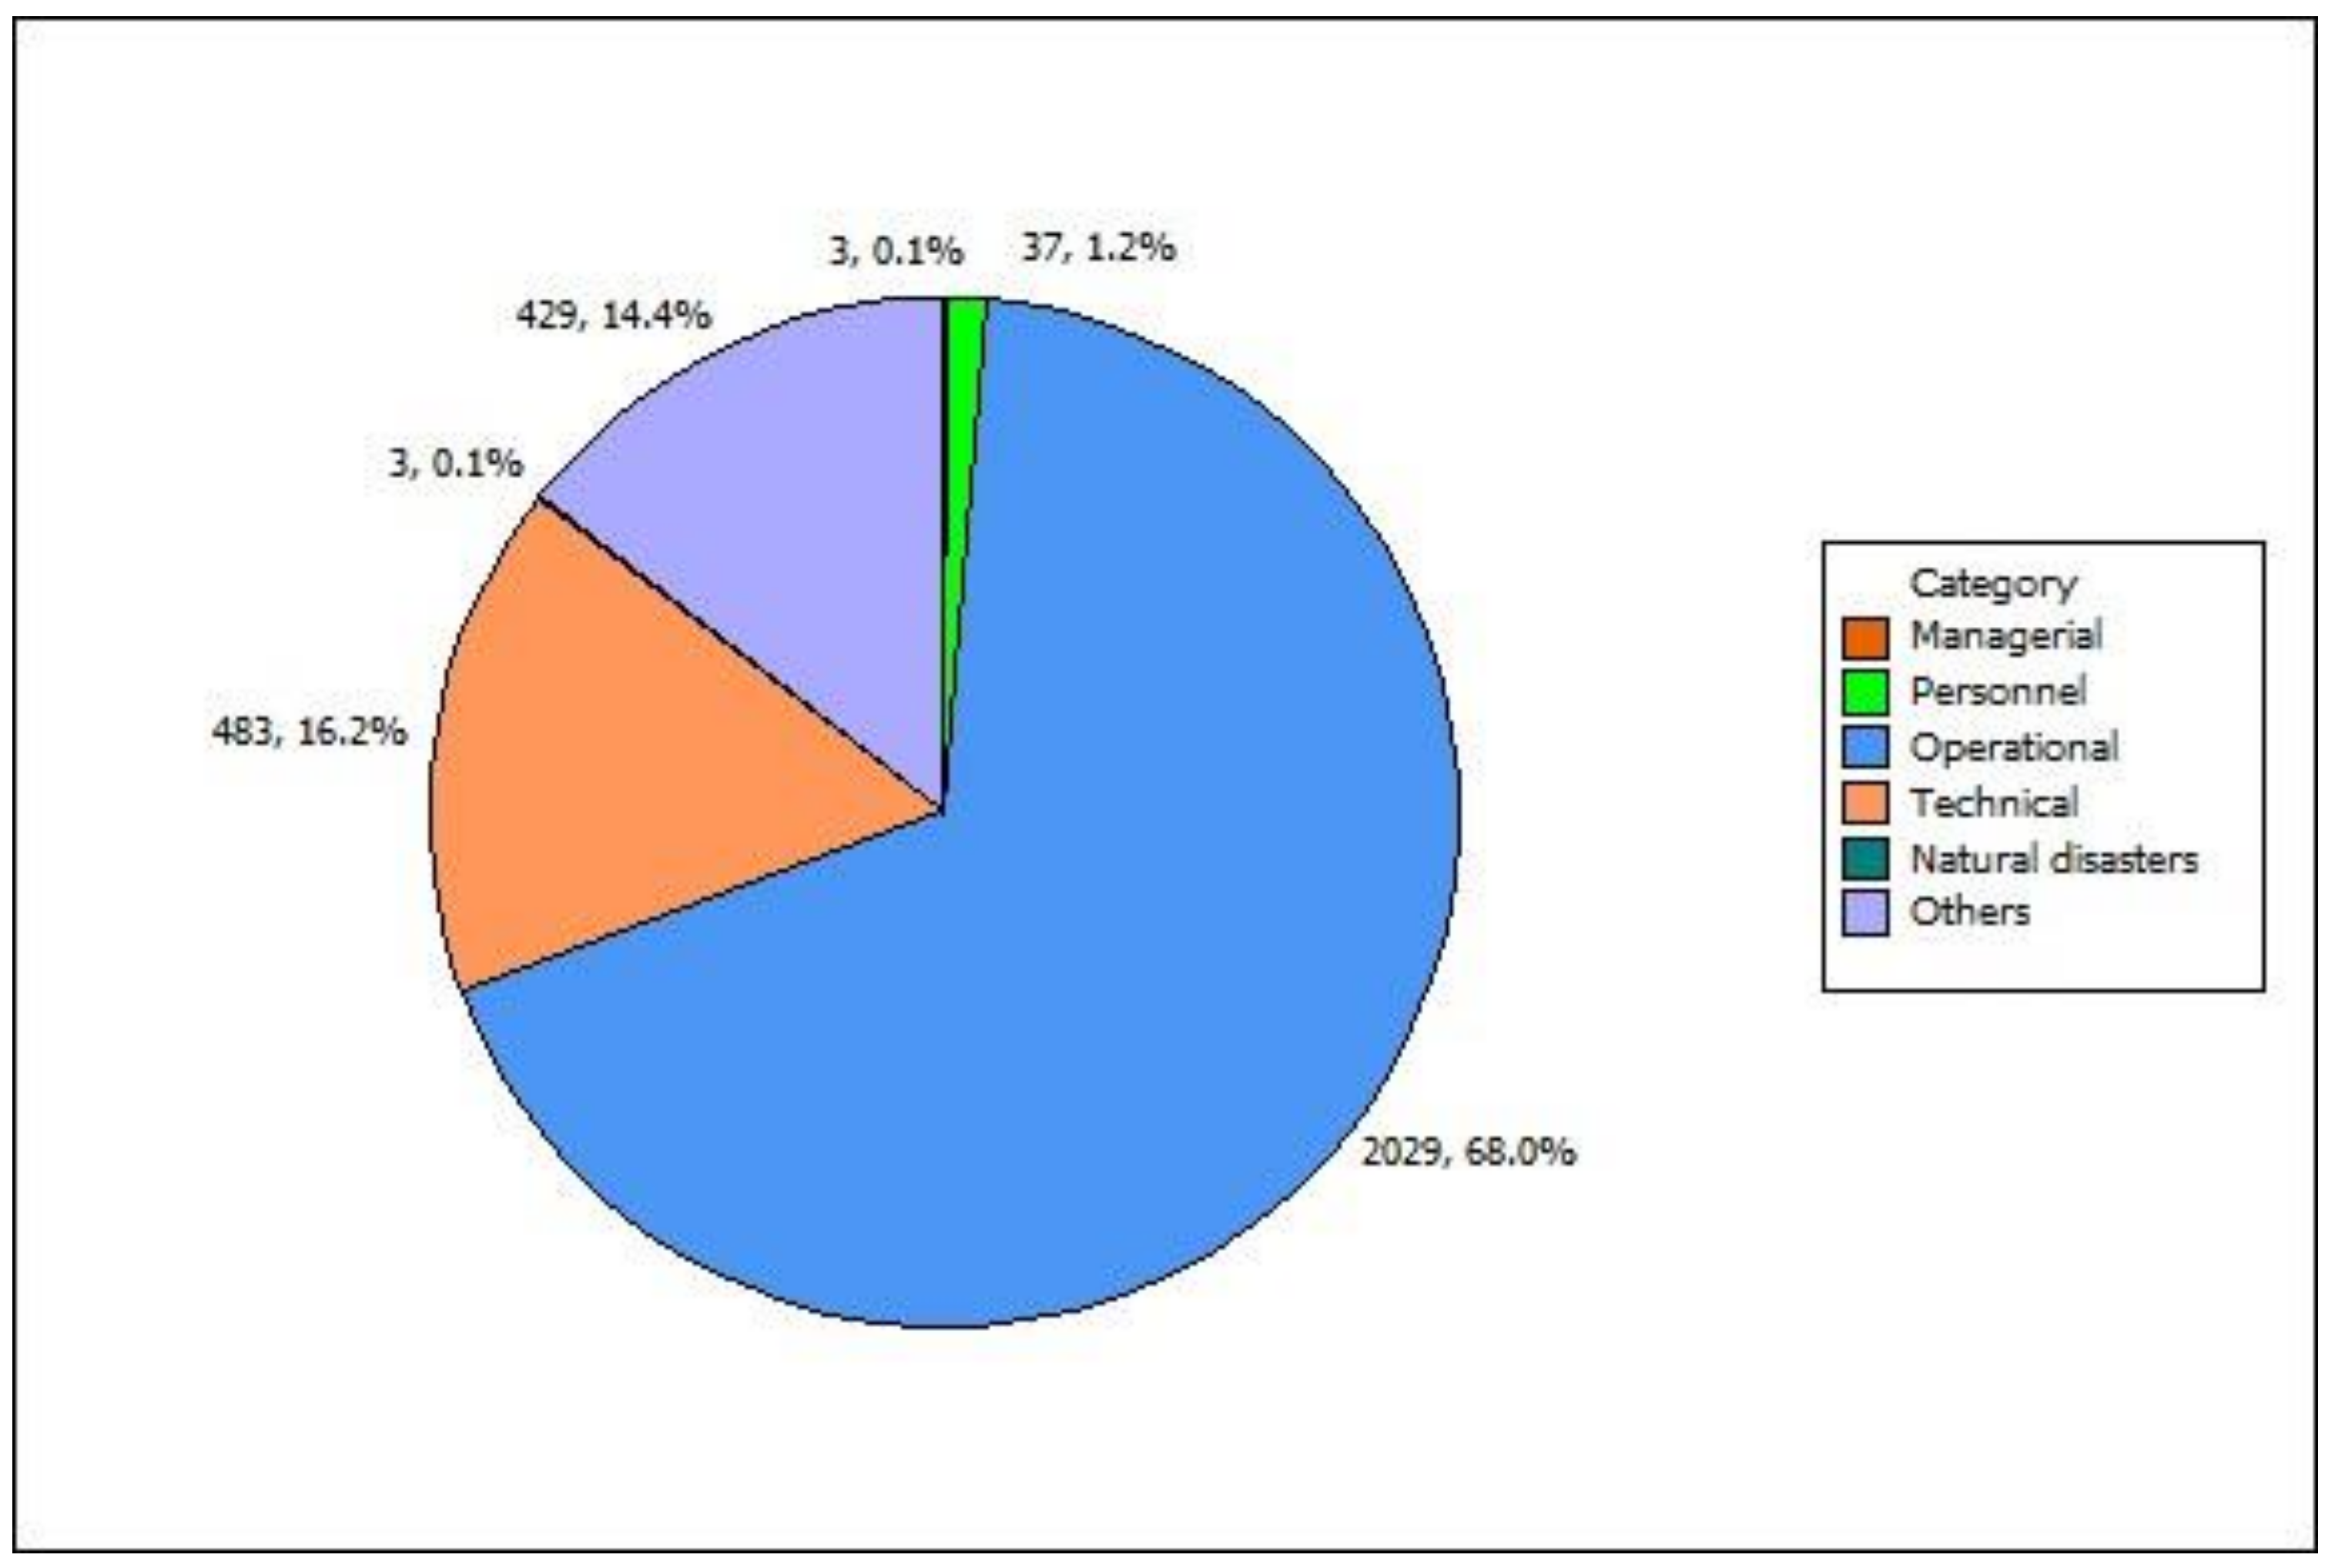
From the point of view of individual analysed risks, the operational risk can be considered the biggest risk, as documented in Figure 2. This category of risk has occurred in 68% of monitored cases. In a comparison of years 2015 and 2016, the risk features a decreasing tendency (in 2%); in 2017, it features an increase (in 11%), and then in 2018, it is a decrease (in 3%). In 94.33%, the carrier was the source of the risk; on the other hand, the infrastructure manager was the least occurring source in 5.67% of cases. The operational risk is associated with the sequence of trains, transport reasons and carriage reasons, exceeding the travelling times and accident events, too.
The second most serious category of risk is a technical risk which caused delays of the selected train in 2015–2018 in 16.19% of cases. In comparison of the risk in individual years, it may be stated that, in 2016, when compared to 2015, the occurrence of the risk featured a year-on-year decrease (in 39.79%); in 2017, it was a year-on-year decrease (in 55.65%); and then in 2018, it achieved a year-on-year increase (in 76.56%). This increase was related to slippages of the quality of individual infrastructure elements, mainly interlocking plants. The most frequent source of risks is the infrastructure manager (in 67.91% of cases), the carrier (in 26.92% of cases) and a third party (in 5.17% of cases). In the context of technical risks, the term “third party” may be understood as exceptionalities in building operations, late termination of closures, unplanned and unforeseen closures which were not caused either by the manager or the carrier, and mechanism failures.
The third group of plentifully represented risks are other risks in 15% of cases. In the comparison of years 2016 and 2015, the other risks featured a year-on-year increase in 7.27%; then in 2017, it was an increase in 8.74%; and in 2018, it was a decrease in 42.97%. The most frequent source of other risks was a third party in 59.70% of cases. The category of a so-called third party includes delays due to reasons created by other carriers and railway administrations, collisions with users of grade crossings, collisions with persons in open lines, impact of unknown people, substitution of transport with bus transport, vandalism, alarm messages, police investigation and firefighter intervention. A carrier caused such a type of risks in 40.30% of cases.
A personal risk was constituted with 37 cases, i.e., 1% only, in the monitored period. This category of risk includes a wrong organisation of work, slippages of the quality in train crossing and foregoing, inappropriate organisation of shunting, late delivery of wagons and accompanying documents, errors in the technology of work caused by the undertaking’s employees, lack of concentration on the performance of work, fatigue, not coming to work or late arrival, errors in staff scheduling, late train dispatch and late notice of the dispatcher apparatus in the case of exceptional events.
The achieved results point out the option to accept the set hypothesis. Operational risks form the biggest share of delays of the R606 train on the Žilina–Bratislava line in the monitored period. In a real operation, the operational risks represent up to 68% of all risks.

4.4. Research of Hypothesis H4

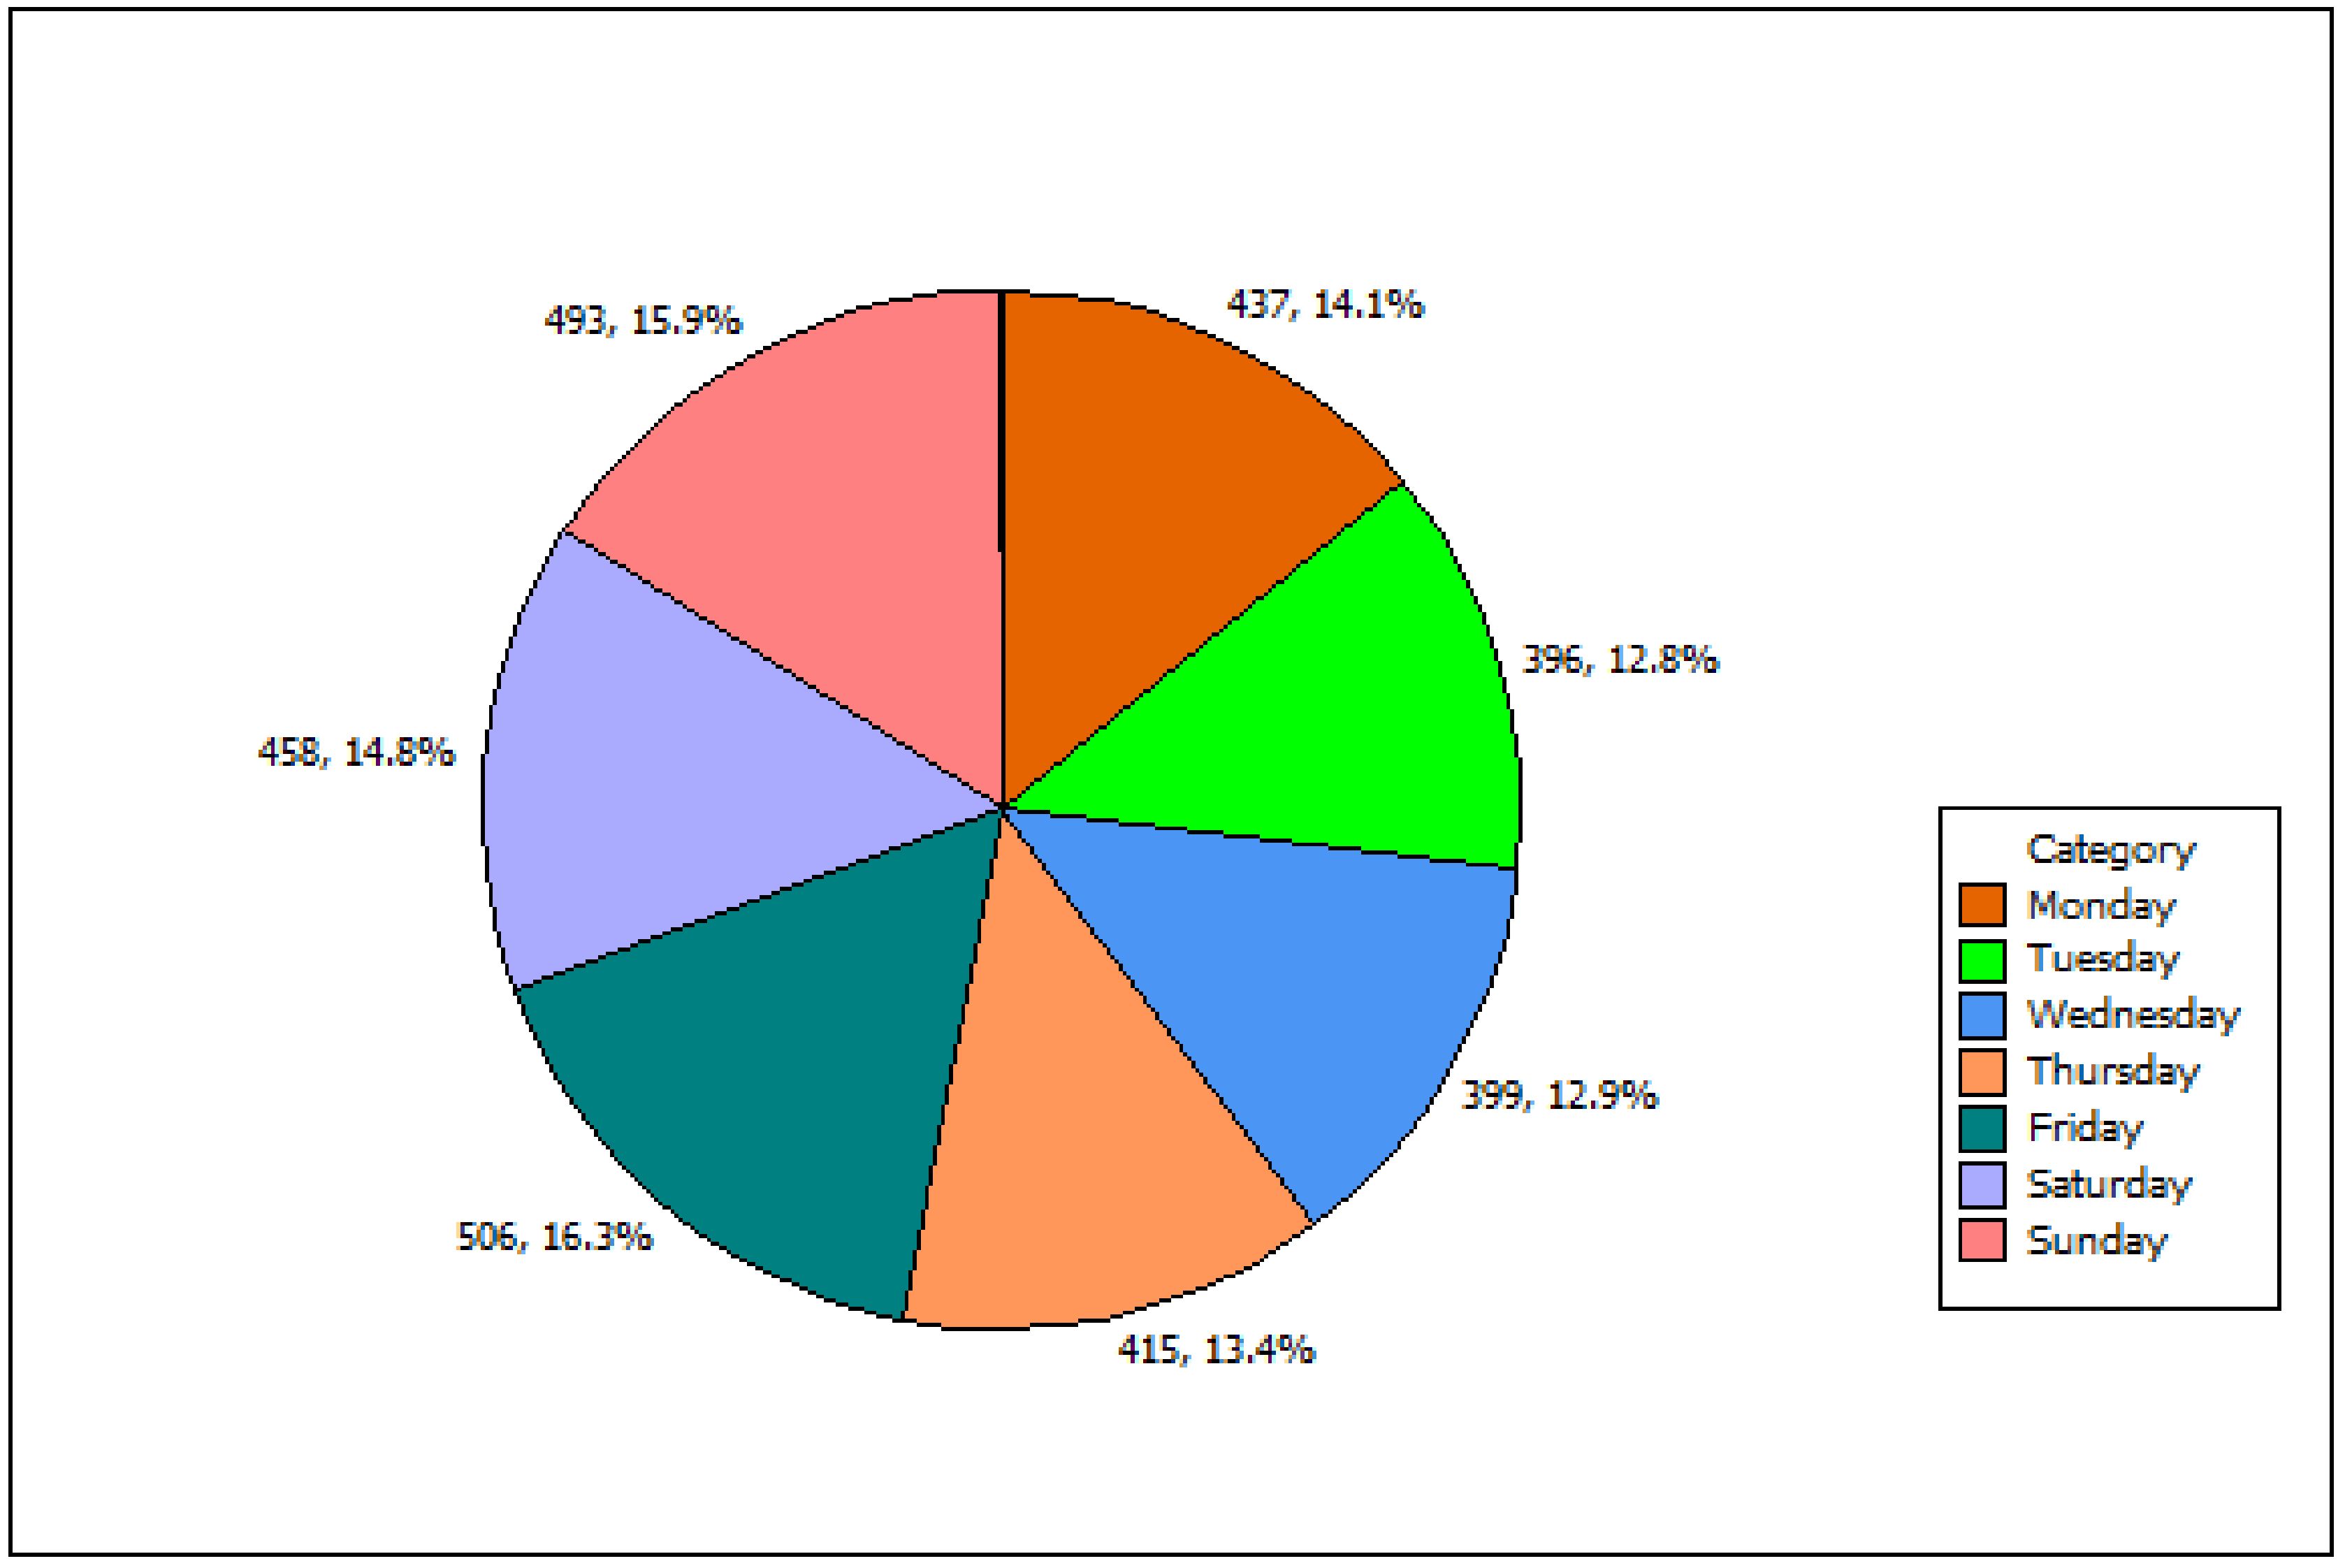
From the point of view of analysis of individual weekdays and a selected train in a selected line section, it is possible to come to a conclusion that, due to errors, the train was late most often on Fridays (16.30 %), as documented in Figure 3. The delay on this day is a long-term problem due to a higher frequency of passengers from Bratislava who return to the eastern part of the country. The spaces in railway station platforms are overcrowded; there occur problems with the release of doors when passengers get on and off. At the same time, on this weekday, there are 3 extra trains operated within the monitored line section which are not operated for the rest of the weekdays. Therefore, more often there happens a sequence of trains when a late train influences the delays of other trains. When monitoring individual years, the tendency of delay development was different by weekday. In 2015, Fridays formed the share of train delays in 16.6% of train delays; in 2016, it was only 14.5%; then in 2017, it was up to 17.64%, when this tendency got stabilised partially; and in 2018, it formed 16.6% of train delays.
The second weekday when train delays happened most frequently in the selected line in the monitored period 2015–2018 was Sunday, with 15.88%. In 2015, it was on Sundays when the train was late most often, in 18.92% of cases; then in 2016, this tendency decreased when the share dropped down to 13.52%. In 2017, there was an increase again up to 17.24%, and then again, there was a decrease down to 14.74% in 2018.
Based on these facts, it is possible to formulate the following additional hypotheses for the sake of a complete understanding of the statistical question:
  • H420: On the basis of the association, the delays noticed on weekdays are mutually independent in individual stations (correlation coefficient = 0).
  • H421: On the basis of the association, the delays noticed on weekdays are mutually dependent in individual stations (correlation coefficient is not 0).
The correlation of individual statistical measures has been tested at the significance level of 0.05. Chi-Test, which was realised, has brought the result to Chi = 18.46. The critical value for the selected significance level and degrees of freedom (0.05; 30) is 43.77. On the basis of the facts mentioned above, it is necessary to accept hypothesis H420, i.e., on the basis of the association, the delays noticed on weekdays are mutually independent in individual stations. Based on the result of the hypothesis, it cannot be anticipated that the individual results are mutually impacted by stations that the train passes through. In the monitoring of individual times of delays of the selected train between individual stations in the selected period, it is not possible to observe a progressive increase in the delay between individual stations.

4.5. Research of Hypothesis H5

From the perspective of individual errors that the selected train achieved in the selected section line in 2015–2018 (Table 3), the frequency of passengers is higher in 45% of cases. This phenomenon is related to the routing of the train within the main corridor and to the number of passengers who get transported in this transport arm. In 2015, the increased frequency formed up to 42.13% of all train delays; then, a smaller increase of the delay followed up to the level of 43.71% in 2016; in 2017, the cases slightly increased up to 44.07%; and the biggest increase can be seen in 2018, when the increased frequency formed up to 52.37% of delays of the monitored train.
There follows exceeding travelling times in 14.58% of cases. This includes exceeding travelling time in the cases of an exceptional train stopping per the requirement of ŽSR (surcharge to start and stop), permanent line speed limitation, deployment of an unscheduled locomotive, breach of travelling times due to locomotive reasons and exceeding the scheduled standard of weight or length. The standard length means the total length of the train set including the length of all locomotives arranged into a train. The standard of weight, regular weight and the type of the train resistance and their usage are determined by the carrier. Most of errors were recorded in 2015, when exceeding travelling times formed up to 17.72%; the tendency in 2016 featured a slight decrease down to 16.46%; and then in 2017, there happened the most noticeable decrease of the share down to 13.78%. In 2018, error occurred only in 10.33% of cases.
The third most significant error is represented with other reasons, the special ones, in 13.5% of cases. These errors lie in an incorrect rounding of half-minute time data in the information system and in reasons caused by unknown people, i.e., not the employees of the carrier or infrastructure manager. In 2015, the share comprised 12.89% of cases; in 2016, the share featured an increasing tendency up to 15.35%; then in 2017, there was an increase up to 16.64%; and in 2018, there was a considerable decrease down to 9.47%. Based on the processed results, we may accept the formulated hypothesis: the most frequent error which causes train delays is a higher frequency in a line section.

4.6. Research of Hypothesis H6

Since the value that the control chart is plotted for is measurable, we may use a control chart of means and ranges, a control chart of means and standard deviations, and a control chart of individual values. Since the values LSL (0 is the most favourable situation for the carrier when the train is not late) and USL (5 min.—a limit acceptable to the infrastructure manager) are provided, there was research conducted to find out how the measured values differed from the monitored ones (based on ISO 8258 standard—Shewhart control charts).
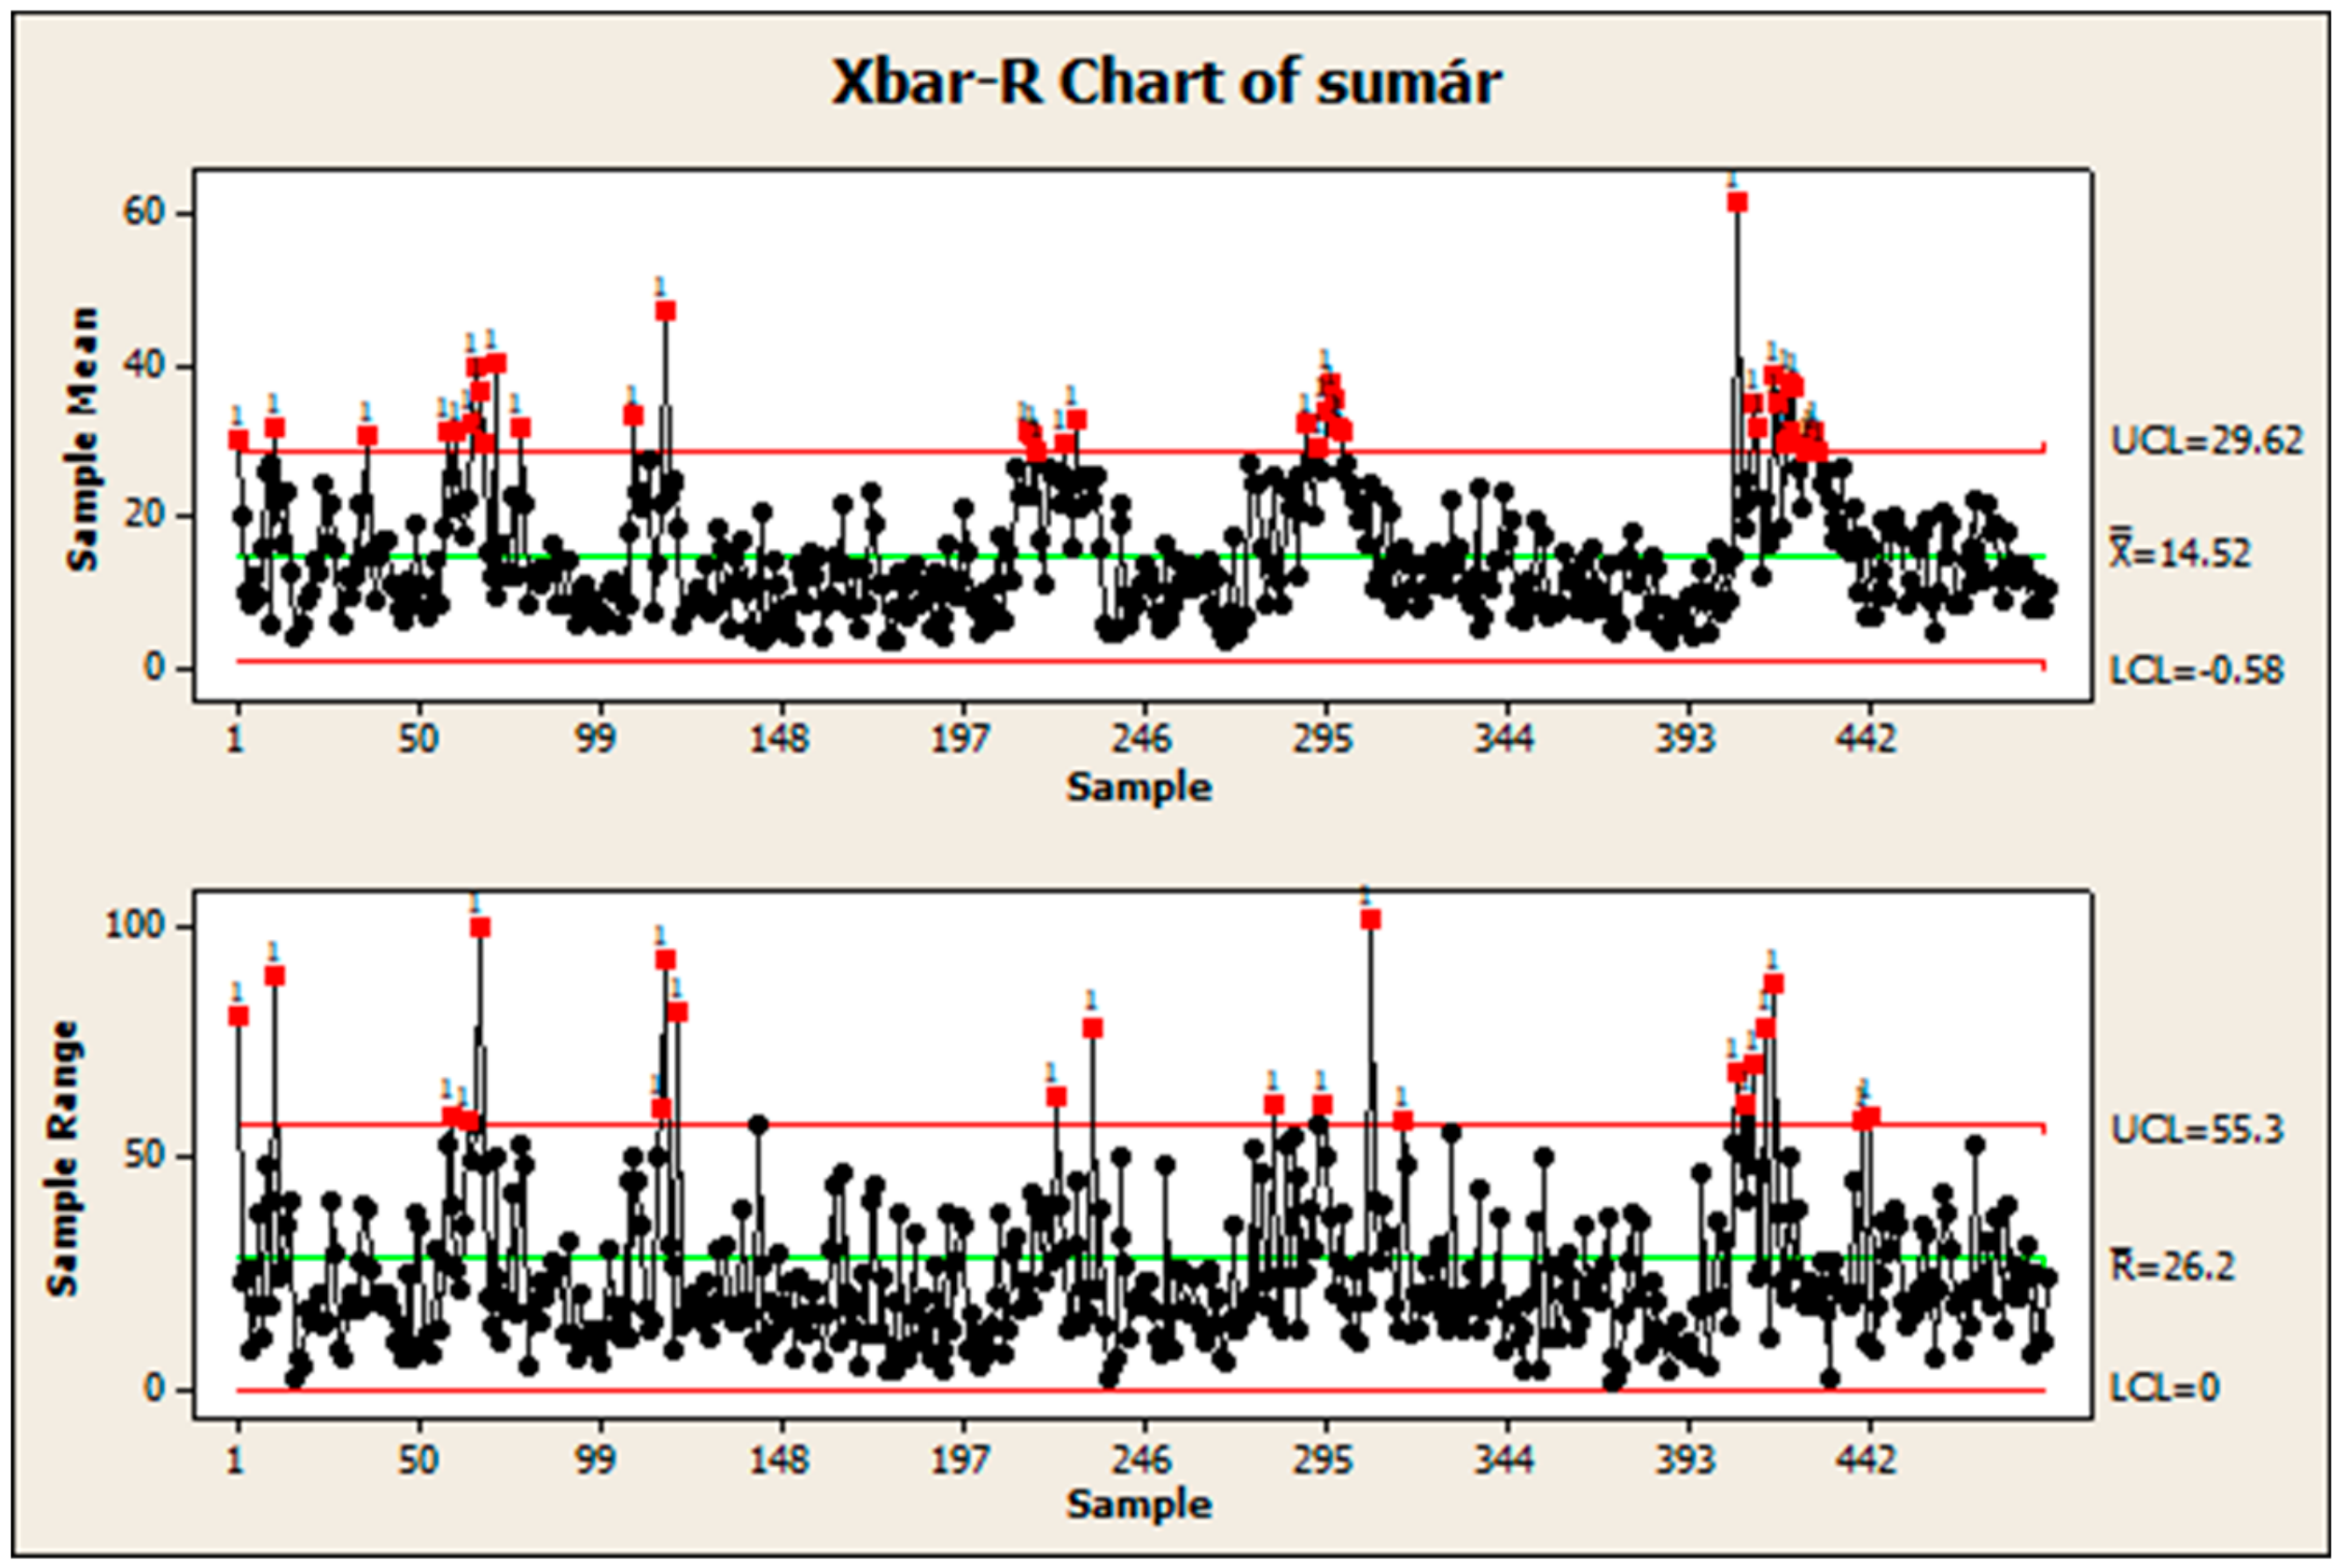
Individual charts created will count with the selection size of 6. There occur 6 railway stations in the set being monitored. Although the size of 6–12 is not recommended (it is favourable to divide large sets into smaller parts which leads to a greater predicative ability), in this case, the value of 6 which belongs to this interval may be used. Figure 4 represents a control chart of means and ranges.
Pursuant to results provided in the control chart of means and ranges, we may state that the studied process is unstable; there are 35 points in total exceeding the UCL (Upper Control Limit), which also represents the 3-sigma level. Thus, the following hypothesis H6 may be accepted: the studied process is unstable. The instability of the process can be seen in numerous deviations of the system from desired values.

4.7. Research of Hypothesis H7

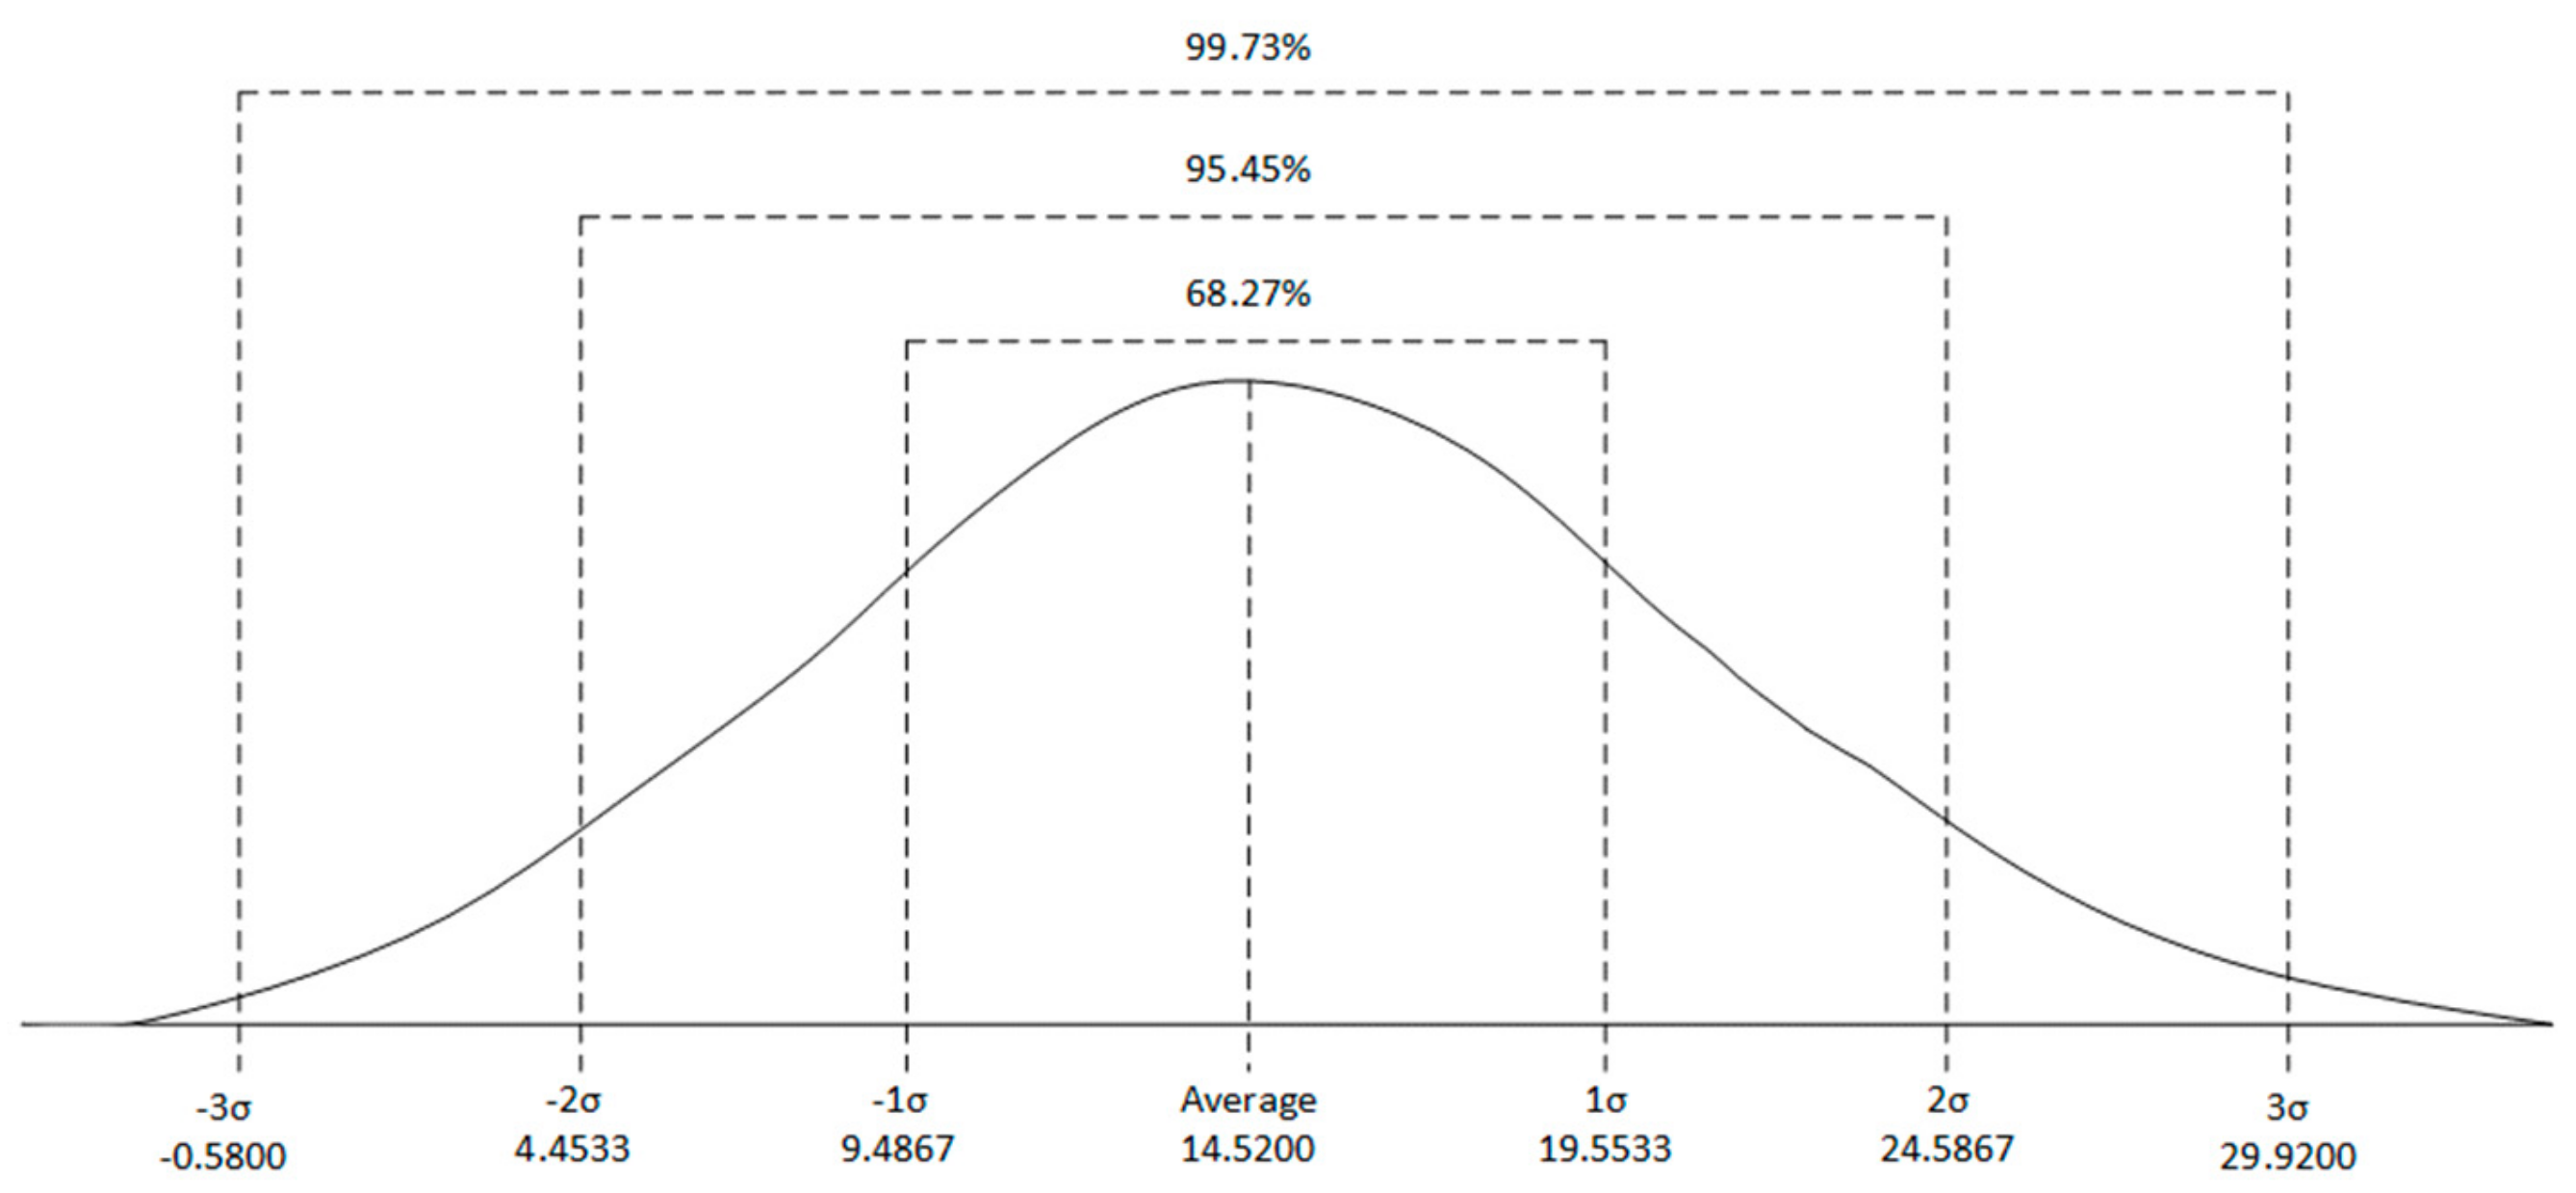
On the basis of data from the control chart of means and ranges also, individual levels of Six Sigma may be specified, i.e., (1 Sigma = UCL-X/3) or (x-LCL/3). Sigma levels are plotted in Figure 5 for the chart of means. The chart of ranges does not seem to be appropriate for the given process since it is too variable, and thus, it is not possible to use either the control chart of means and standard deviations or a control chart of individual values.
Upon the determination of the Sigma level, it was possible to quantify other indicators of Six Sigma, too, namely DPU (Defects per Unit) and DPMO (Defects per Million Opportunities). The value of DPU indicator was 1.43. It can be quantified as 1.43 error per one dispatched train on one day. However, it is also necessary to note and consider the number of monitored stations, i.e., 6; thus, on average, we can think of 0.24 errors per one dispatched train per 1 monitored station on one day. In more detail, for 1 monitored train per 1 day, we may think of 0.18 error in Žilina station, 0.16 error in Púchov station, 0.27 error in Trenčín station, 0.18 error in Leopoldov station, 0.38 error in Trnava station, and 0.27 error in Bratislava main station. The data suggests that it is required to pay more attention to Trnava station since there is the highest frequency of error.
The DPMO indicator manifested high values in the studied section: 1695 errors per 1,000,000 train drives. Considering the fact that the train passes through the route only once, this indicator is not important. Based on the achieved results, we may accept the formulated hypothesis: the biggest value of the DPU indicator is in Trnava.

4.8. Software Tool

Modern society puts emphasis on the utilisation of information technologies which bring plenty of benefits when the parameters are set correctly. The Lean concept speaks about a systematic identification and elimination of all forms of wastage. Thus, risks must be studied systematically. Currently, the monitored railway undertakings assess train delays in large tables; therefore, the team of authors has suggested an innovative software solution. The software is universal and applicable to different categories of risks, and its tabular form provides a simple operation for a user. Lean emphasises the maximum leanness of processes which shall comprise only those elements adding value for the customer. Thus, software support represents a great way to identify processes where the wastage occurs, to link them with the customers’ needs and to engage all employees.
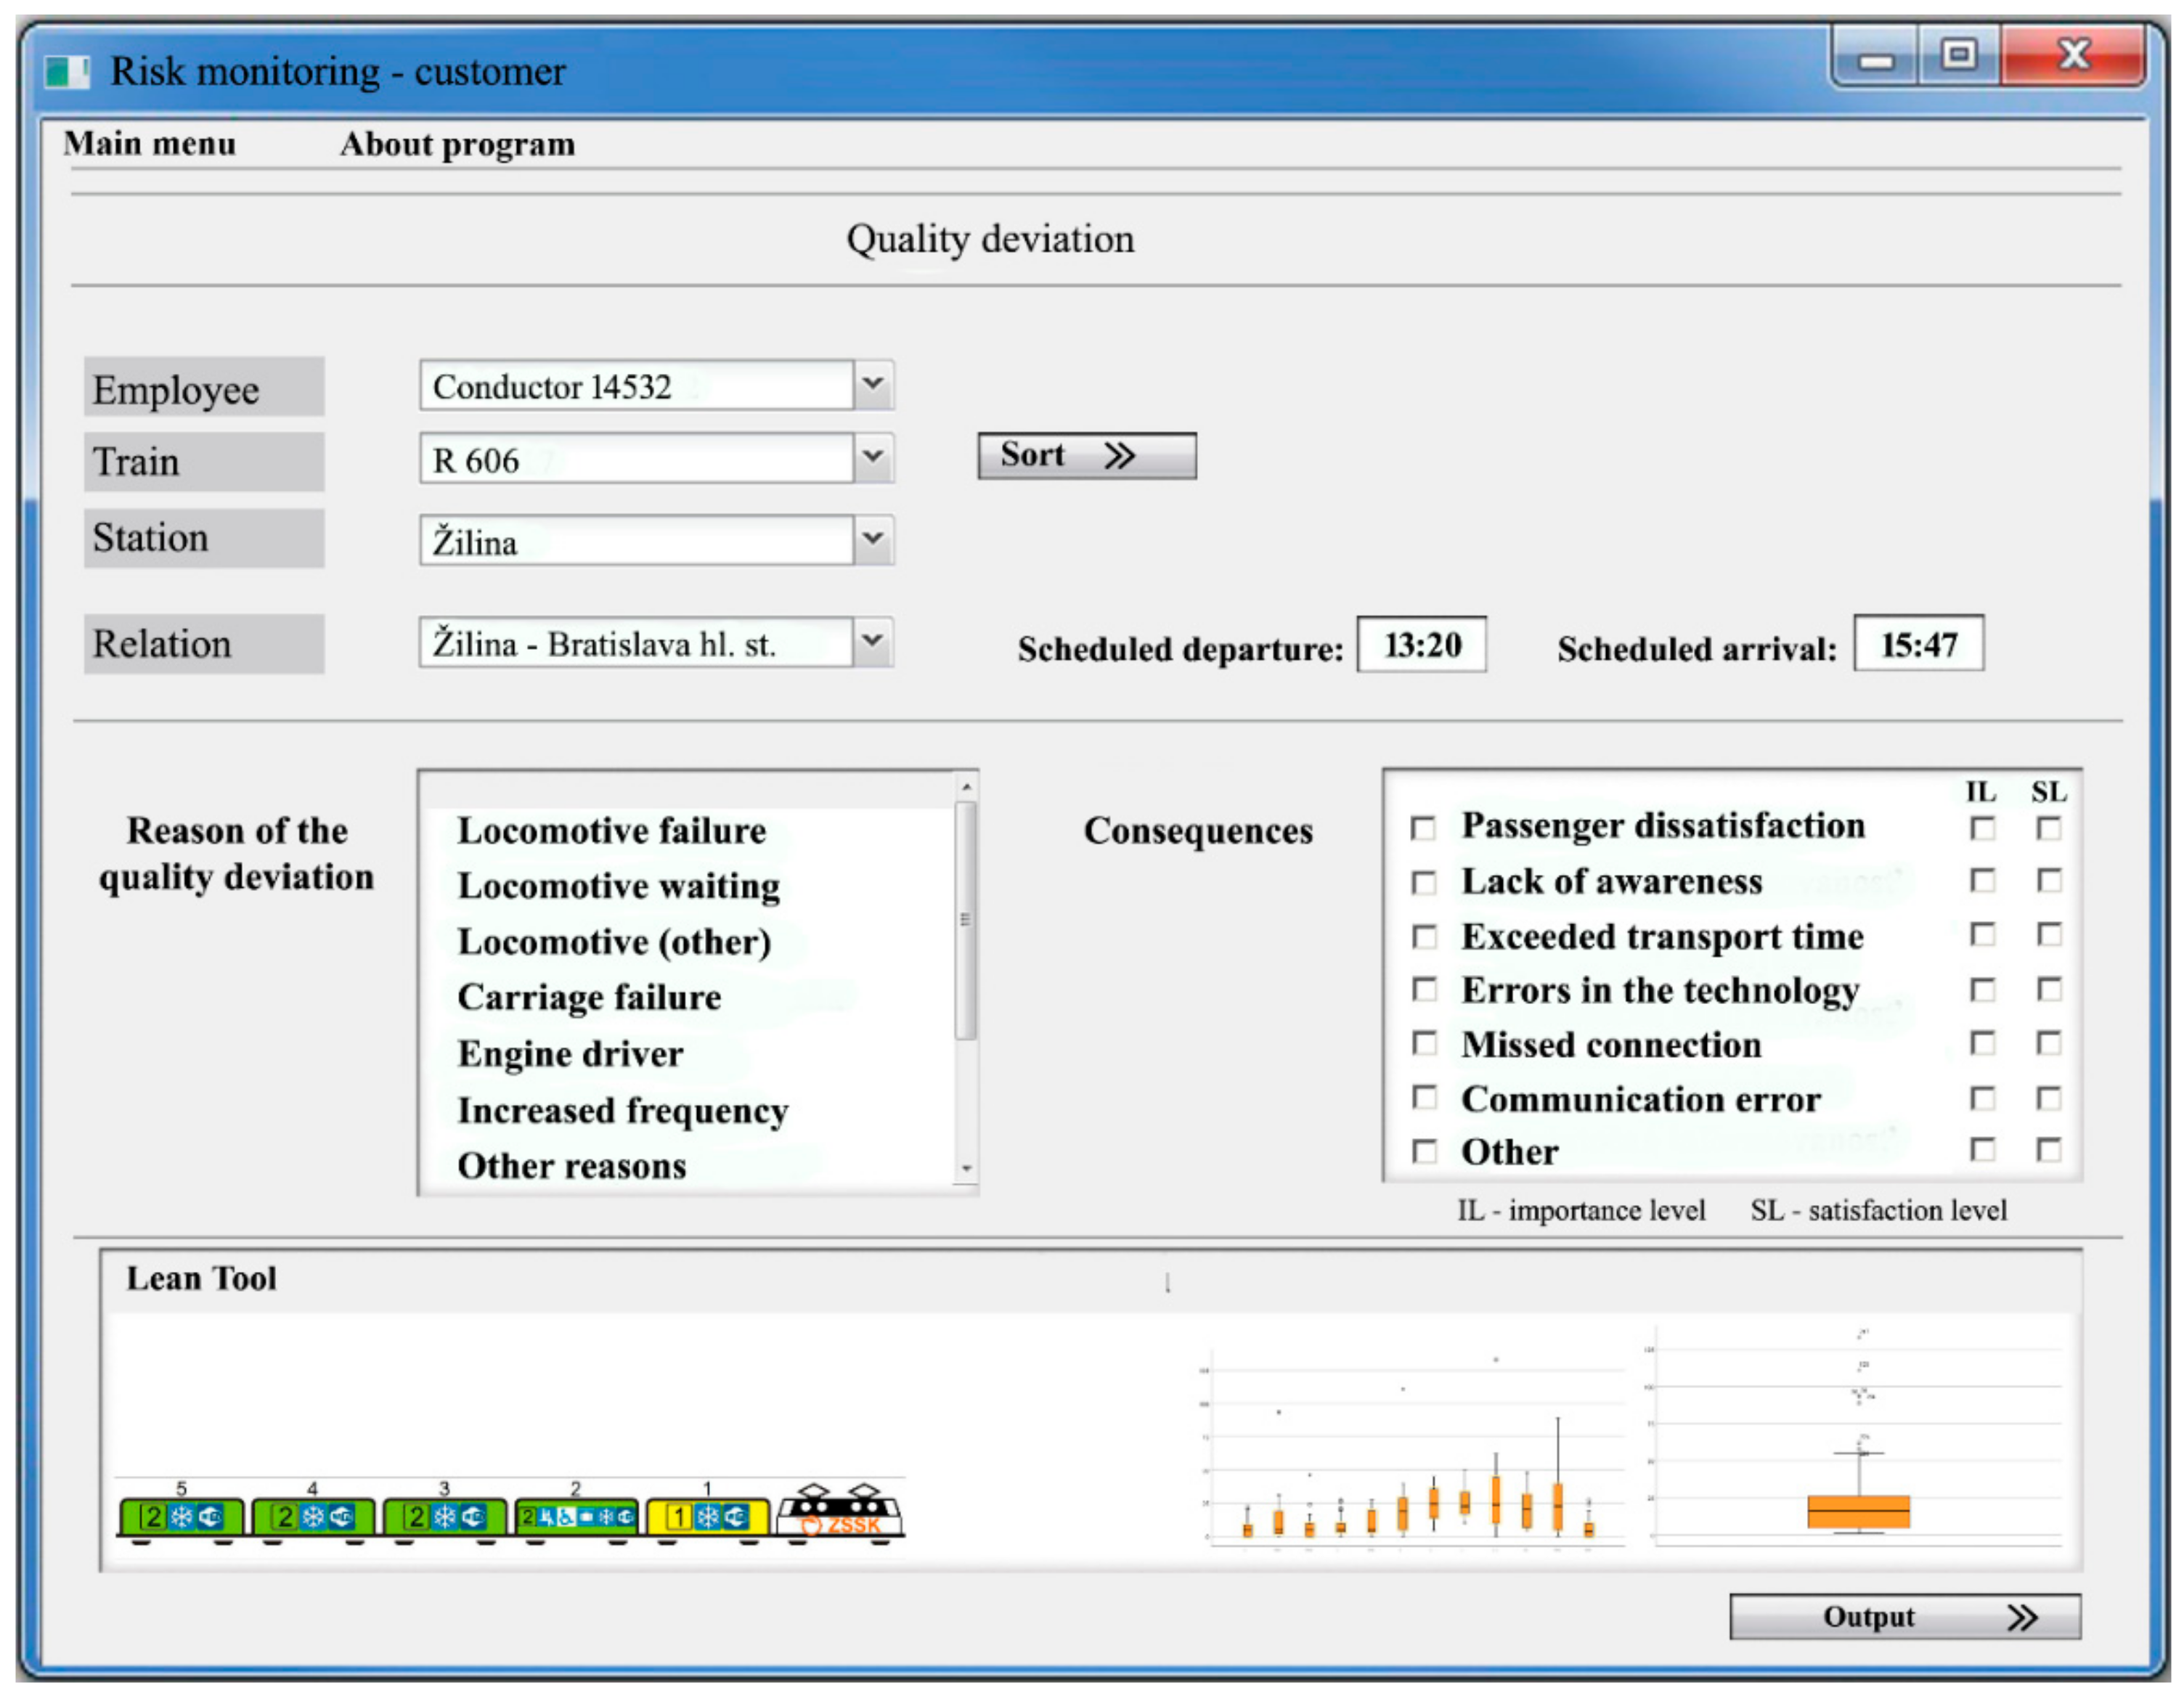
The software tool was created with the help of software engineers, and the content of this support was consulted with the internal audit division of ZSSK, the state carrier. At the same time, there was conducted a research in interests in Lean tools and software support, where managers of different divisions of railway undertakings of four V4 countries were addressed. In those countries, 86% of respondents expressed their opinion that it was univocally required to make the risks more transparent, to monitor them constantly and to take measures based on real outcomes. The efforts were to create a simple software application which could have been conveniently used by users, employees of the internal audit division. The software support is based on a graphical user interface which enables to control an electronic device with a set of interactive picture elements. The linkage of individual components in the application was tested so they are connected and added with necessary data. As a programming language, C++ with Qt extension was used, one of the most widely used languages for a multi-cross platform creation. In the future, the software functionality may be extended to Linux or Android platforms, too. The following Figure 6 represents a partial outcome. It depicts how an employee can enter reasons for the slippage of the quality and what consequences the slippages have brought, whereby the level of significance and grade of customers’ satisfaction are also differentiated. Therefore, it is an innovative idea to link records of employees and to monitor the customers’ satisfaction in selected trains, stations or transport sessions. The statistics data is collected and assessed with Lean tools. At the same time, a detailed description of the train is provided, including all its requisites, arrangement and the overall outcome which prioritises risks by their significance. The figure shows the current state and the arrangement of the R606 train which was monitored in the case study in this article. Currently, the arrangement comprises 5 wagons only due to the crisis with Covid-19. (A normal arrangement of this train comprises 10 wagons, which means the data concerning the train for the monitored years 2015–2018 was associated to a 10-wagon train.)
The software is in testing operation currently. It is used by employees of the internal audit division. The authors of the research have established a methodology which determines an algorithm for using the software so its results are relevant. It is intended for the management of a railway undertaking; however, it is also available to all employees participating in the operational processes. Thanks to the software tool, an internal auditor has the submitted outcomes of slippages of the quality from the first contact employees available, which are assessed once per month. They also factor in the regular monitoring of the customers’ satisfaction. The submitted outcomes are generated into a final table for selected slippages of the quality where an ideal value of quality and an actual value of troubleshooting quality are set. The internal auditor determines priorities to be solved in the nearest future, based on the outcomes of the actual value of troubleshooting quality. These priorities are part of the objectives of quality which are evaluated regularly in a report on quality once per year.

4.9. Discussion

The research has assessed the risks within the main international railway corridor in more details than it has been realised under the conditions of railway undertakings in the monitored area so far. Differences among risks, their occurrence and significance have been studied. The initiative for the study came from the railway infrastructure manager and railway undertakings. A literature review is a full-fledged basis for this study. It provides a detailed overview of the issues addressed by scientific studies from around the world; it solves the problems that are the basis for the identified questions and hypotheses of this study. These analysed theoretical backgrounds from world scientific sources highlight the need to more precisely design concepts for the application of risk management using Lean philosophy in railway transport. As a study by Dutch authors shows, there are shortcomings in the current manual registration of risks in many countries without software support that has lacked in clarity and reliability [72]. This fact was also the impetus for new software design. Research studies from the Netherlands, Canada and China have supported this study in the idea of addressing the appropriate recording and visualization of train delays with an impact on customer satisfaction [73,74,78].
The article deals with rail passenger transport. However, there are also rail freight operators on the railway infrastructure, for which the activities affect the entire transport system. A study of the literature has prompted further research to provide opportunities for promoting intermodal freight transport and consideration of an environmental perspective, as documented by an interesting publication by Hanaoka and Regmi, Asia freight study [97], or a publication by Stehmann and Zellhofer, EU freight study [98]. As the sustainability of rail transport services concerns not only the economic point of view but also the environment and society as a whole, there is scope to examine the risks associated with improving the possibilities of railway links and the efficiency of double-stack trains which would improve the overall efficiency of the intermodal transport and contribute to overall environmental benefits [97]. Following these ideas, there is a study by Guo and Peeta about truck carrier perspectives. By utilizing the various insights from this study, relevant decision makers in the rail freight carrier sector can effectively allocate their resources to design and adopt mechanisms that can lead to the fruition of rail-truck multimodal freight collaboration [99]. When a railway undertaking deals with risks, it assesses their size, number, impact and significance. It strives to create conditions for a possible elimination of wastage, which was the object of the authors’ research. Sustainable innovation connected with a new Lean quality management approach can help to improve the quality of rail services. However, as Mr. Masaki Ogata, the new president of the UITP, said, we had to know the genuine needs of our customers, which would create the seeds for innovation and reduction of risks. Train delays represent an adverse effect on customers’ needs and the whole company and society that is affected by the transport system.
Based on the analysis of the statistical set as a whole, it was possible to find out some basic characteristics. Pursuant to these research results, it may be stated that the data distribution is not normal, which leads to hypothesis H1 being rejected. This is, however, in accordance with the research conducted in 2017–2019 [18] in V4 countries where other transport arms of V4 countries’ trains were evaluated, so not only in Slovakia but also in the Czech Republic, Poland and Hungary [18]. With respect to fundamental principles of Shewhart, the essence of such a study is a constant control of the processes’ quality and, thus, the provision of services on the grounds of a mathematical-statistical evaluation of quality [19]. As this research has proved under the conditions of railway transport, such an evaluation is of a great importance because it enables to study the eligibility of the process over time and to take action operatively in case of a higher variability of outcomes in order to prevent unacceptable quality. The reduction of the processes’ variability then leads to a smaller probability of an accident when slippages of the quality in the form of errors are not large. It is connected with an adequate decrease of costs and improvement of the customers’ satisfaction. The orientation towards customers in this sense is underlined with foreign research [95]. The variability of the process may be evoked with random (natural) or special (unusual) causes. The efforts are to achieve stable processes in railway undertaking in a statistically managed state when the parameters of the probability distribution of the studied quality measure do not change over time [37].
Next, verification referred to hypothesis H20 regarding times of delays in individual stations where a slight dependency was confirmed. There was an interesting result that the dependency decreases progressively from the starting station of the monitored section to its destination station. Like a real operation shows, the dependency is influenced by scheduled closures, related to the modernisation of the corridor [66]. It also impacts the necessity to observe the connecting trains, mainly in Púchov station, where international trains to the Czech Republic are operated from.
Then, there followed an extensive study of risk categories where the object of the assessment was hypothesis H3, which was confirmed. The operational risks form the greatest share of delays up to 68%. This result is in accordance with a study [7], according to which the operational risks may be represented with those which have the biggest frequency share on resource wastage, which extend the travel times of trains, which impact train delays mutually and which result from accident events. At the same time, they are related to transport reasons in a line as well as in railway stations and carriage reasons with regard to accompanying documents of trains. It is a set of the most frequently recurring risks which ultimately impact the customer significantly. Here, long-term research and, thus, efforts to eliminate any risks remain because it is challenging to notice the wastage in all ways in such a big space that the railway passenger transport services are provided in. The technical risks represented 16.19%. An important factor that was proved in the research is that, in the area of technical risks, the infrastructure manager (who manages the infrastructure) is their considerable source. The risks refer to all elements of the railway infrastructure to which railway lines, tunnels, bridges, interlocking plants, railway stations, electrification objects and engine sheds belong per the research. All these elements of the railway infrastructure introduce a potential risk. Railway lines serve a safe and uninterrupted operation, and as a whole, they form a railway network. A significant risk is connected with the modernisation of the given corridor of the international importance, with the closure activity when an exclusion diagram is established with different types of restrictions. A nonconforming technical state of railway lines and resulting category of technical risks is, however, not related to the scheduled closures only [66]. It is also related to the wearing of material, outdatedness and the need for large investments that the infrastructure manager has to spend in order to eliminate the risks and to prevent source wastage. As the research confirms, it is very important to avoid the highest possible number of serious constraints of the operation which cause train delays and which impact the effectiveness of the railway operation synergically. The railway infrastructure manager impacts the height of a risk resulting from the technical state character of the railway line. With regard to this fact, the communication between the carrier and the infrastructure manager is important. In this sense, too, it is very challenging to look for the way to apply the Lean philosophy because, in their efforts to minimise the risk origin, the carrier may agree to buy new vehicles or to modernise railway vehicles. It can, however, lead to wastage when these steps are not taken in cooperation with the infrastructure, when the maximum design speed is not utilised or when the noise in driven vehicles, i.e., wagons, is not reduced. It is a linked, mutually dependent system which cannot be separated. If the infrastructure manager does not approach a suitable modernisation of lines at a desired technical level, the carrier’s efforts would be ineffective. This is true the other way around, too. The group of other risks represented 15% of cases. These ones are influenceable in a challenging way because, as proved with studies oriented to this area [63,67], they are caused by unknown people or other railway foreign undertakings.
A separate personal risk was constituted with 37 cases in the monitored period. Railway undertakings put the psychological factors or failures of employees exclusively into this category as already mentioned above. It is statistical data, however, that a human factor impacts all previous categories of risks, too, and a space for their closer research in the future remains. As proved with published knowledge [10,17,100,101,102,103,104], employees of railway undertakings may contribute to the risk reduction on one hand and they may represent a risk factor themselves on the other hand. Respecting the ideas of García-Alcaraz, the appropriate implementation of Lean principles requires an education process and human knowledge [105]. The underestimation of risk factors and subsequently risks which result from an inappropriate approach of employees may negatively impact the quality of business culture. The neglect of trainings, improper choice of the railway undertaking’s employees as well as their own risky actions, as proved in this research, lead to a direct impact on train delays [106,107,108]. This state not only reduces the quality of the business culture in the eyes of the public but also, in the future, increases the unwillingness of passengers to use the carrier’s services repeatedly. With regard to effectiveness, safety and functioning of railway passenger transport, these risks may not be caused by an internal employee only. From the point of view of risks caused by a human factor, the risks are external to a large extent [109]. They may be represented by employees of other carriers, the infrastructure manager or the public. Studies which were conducted at carriers in 12 European countries prove that the travelling public relates train delays to a human factor failure of the first contact employees in 30% of cases [36,46]. However, this research shows that the results in a real operation are different. The percentage coming from the research of European carriers shows a subjective perception of the public, which is an interesting piece of information since the public perceives the services in its own way. All risks caused by a human factor, whether external or internal ones, cannot be eliminated completely [110]. Through Lean philosophy, even in the area of personal risks, it is possible to reduce wastage in many ways with some suitable preventive measures which may as a result influence the operational and technical risks. Responsible action of everybody is the most effective measure when reducing risk. An incentive for further discussion is also the fact that risks that emerge from the nature of transport means locomotives and wagons are to be approached to in a manner which is different from the approach to risks of a human factor. From this perspective, the need for a long-term study of potential risks and work with the most frequent risks, mainly the operational ones, is confirmed as is the minimisation of their negative effect.
The analysis of individual days in a week has led to the confirmation of hypothesis H420. In a long-term run, the issue lies in the last workday in a real operation. Most of all, it is caused by a higher frequency of passengers, as confirmed by previous studies [55,61]. At the same time, it is caused by a higher number of trains operated on that day so the customers’ requirements are met. This is related to the issue of delays of trains in a so-called sequence when they influence each other. Due to the same reasons, Sundays are impacted with other, significant train delays. At the same time, mutual independence has been confirmed in individual stations.
A higher frequency of passengers was the object of study and confirmation of hypothesis H5. A high share of the passengers’ frequency was related to the introduction of free transport for students and pensioners in the railway network in the monitored period. This phenomenon was a reason for many operational issues and difficulty of the operational situation. In a long-term run and per the daily study in cooperation with the national carrier, it manifested the biggest impact on train delays and problems in communication with employees of railway undertakings who encountered an increase in the customers’ requirements. According to research [7,24], exceeding travelling times in 14.58% of cases is usually an effect of the infrastructure manager’s requirements; limits of line speed; or problems with train sets, locomotives as well as wagons. In the future, it is possible to deal with the effect of exceeding the trains’ length and weight standards and to discuss this issue which is connected to a big wastage in many cases.
Hypotheses H6 and H7 have been accepted. The research has proved that the studied process is unstable and that there are points which exceed the upper control limit. The level of Sigma has been determined, and other indicators of Six Sigma, DPU and DPMO have been quantified. The value of the DPU indicator was 1.43. This can be quantified as 1.43 error per one dispatched train on one day. The number of monitored stations has been taken into account. The object of a further research may stand for a more detailed focus on individual railway stations and their corresponding risk categories, reasons and consequences.
The results of the research are important for railway operation from the theoretical point of view which provides a guidance for railway undertakings on how to study the issue of delays. This guidance is applicable from a wider perspective not only to one railway network but also in case of studying the international connections. From the practical point of view and based on the given research results, the direction of a further study in the future lies in extending the software tool to all categories of risks. The software tool is a significant outcome of this study because, as the author Doherty states, large organisations like railways have struggled to keep up with and to utilise the new digital technology effectively [111]. Currently, this new software support is designed for operational and technical risks which are linked to personal risks. The incentives for further research reside in more detailed monitoring of personal risks using this software, which includes the utilisation of Lean tools to eliminate wastage. Similar to previous study claims [112,113], the results of the case study indicate that the application of systematic and data-driven quality improvement approaches, such as Lean philosophy with some simple changes and adjustments to the conditions of railway undertakings, can contribute to the service quality. The author of a foreign research, Vaidya, who deals with the Six Sigma concept under the conditions of Indian railways, likewise points out the benefits of extending this approach to various areas of railway transport [114]. Based on the results of this study, we may identify ourselves with the worldwide research, which points out that Lean Six Sigma’s goal is to produce quality products that meet customers’ requirements as efficiently and effectively as possible [115]. This is also true within the area of railway passenger transport services.

5. Conclusions

The aim of this article was to evaluate the application and a specific application of Lean philosophy tools under the conditions of railway passenger transport in risk management with regard to the sustainability of services with an orientation towards the customers’ needs satisfaction when there are train delays. The tendency to constantly monitor and improve the quality with Lean is well-recognised worldwide. The benefits and achievements of a systematic approach of Lean philosophy are provable mainly in production. In the area of the service provision, it is a challenging process; however, concerning the constantly increasing pressure under the conditions of a liberalised transport market, it is a great way to maintain the customers’ loyalty, competitiveness and permanent position of an undertaking on the market. According to the conducted research, risks in railway undertakings are systematically approached usually in the area of strategic risks. Thus, the authors of the research have focused on a new area of risks in detail. These are risks which exist in the railway operation in the railway infrastructure, in stations and on trains.
A theoretical benefit of the research lies in the identification of risks and their categories in railway passenger transport. Simultaneously, based on Lean tools, hypotheses concerning train delays have been studied. Their confirmation or rejection means a significant step in the knowledge of the issue which has not been studied this way before. Thanks to these research results, railway undertakings may get to know better the environment in which they realise their own services, to identify shortcomings and to implement preventive measures.
As the authors emphasise, the process of analysing individual risks related to the operation of passenger transport trains must proceed in individual steps as mentioned in the results of the research, i.e., in detail, step by step, with a focus on areas which cause wastage, train delays, breach of travelling times, failures of facilities and resulting dissatisfaction of customers. For railway undertakings, it requires expertise in the issue. The team of authors cooperates on organising trainings for employees as well as on developing the software tool. The designed software represents a practical benefit of the research. It provides options for a chronological and detailed study of risks. It contains a sequence of steps which are used to complete the database of risks, their causes and consequences while using Lean tools. It engages employees in the process and it pays attention to the needs of customers. As the results of the presented research show, the railway undertaking may eliminate the wastage and may realise value-adding processes this way.
This article presents the results of the research aimed at the application of Lean philosophy with regard to the sustainability of railway undertaking services. They point out the need to monitor individual specifics in the railway operation where each risk features another impact on the railway undertaking, infrastructure manager and mainly the customer.
The study of the world literature has underlined the importance of dealing with this issue. From this perspective, the research has brought visible outcomes for railway undertakings where this question of Lean philosophy was only little known before. Results of this research are useful for all railway undertakings, infrastructure managers and state authorities that decide on procedures in railway passenger transport. The statistical regulation shows how to prevent defects occurrence, i.e., unsatisfactory products or services with poor quality. Thanks to a subsequent introduction into the railway undertaking, we assume that the variability of the monitored measure of quality will be reduced and that the concordance with customers’ requirements will be ensured. Lean philosophy is a standardised procedure. At the same time, it is a system which allows for a fast and effective response to changes on the market. Therefore, as the research has proved, it brings big advantages also in the environment of the railway undertaking where changes happen all the time. Lean is also a training “fitness” for employees of the undertaking; they can systematically prepare themselves for tests evoked with a situation in the internal environment and resulting from the customers’ needs and conditions on the transport market. Based on these considerations, the idea to create a simple software tool which allows for monitoring the risks over time has arisen. The tool is clear and comprehensible for its user. It informs the place of risk origin, which train and which railway station or another element of the railway infrastructure it is related to. It informs on what slippages of quality happen and what consequences the risk brings. The software must clearly display the state that the monitored risk is in. The ideal situation is when it monitors risks through the engagement of employees and customers.
The benefits of the research cannot be understood on the national level only. The research must be seen in a wider context because its algorithm is applicable in a flexible way under conditions of both any transport undertaking and infrastructure manager in a selected line and category of a train, too. The research opens a space for further study and mutual comparison of different types of trains and different stations. Its procedures are universal to the degree that it can also be applied abroad as a recommendation for those railway undertakings which have been heard to be thinking of Lean philosophy application in their own environment. According to the research results, Lean is a synonym for timeliness, accuracy, speed, comprehensibility, transparency and simplicity under the conditions of railway transport. At the same time, this article highlights the potential of extending this philosophy to such a challenging area as railway transport services are from the global perspective.

Author Contributions

Conceptualization, E.N. and R.S.-B.; data curation, E.N. and P.Š.; formal analysis, E.N., M.H., L.L., and P.Š.; funding acquisition, E.N.; investigation, M.H. and M.M.; methodology, M.M. and P.Š.; project administration, E.N., M.H., and R.S.-B.; software, E.N.; supervision, M.H. and L.L.; validation, R.S.-B. and P.Š.; visualization, E.N.; writing—original draft, E.N. and L.L.; writing—review and editing, M.M. and L.L. All authors have read and agreed to the published version of the manuscript.

Funding

This research was supported by Scientific Grant Agency: The project KEGA No. 014ŽU-4/2020, Six Sigma and progressive education of the quality management in the railway transport field of study in accordance with the requirements of railway undertakings; the project KEGA No. 030ŽU-4/2018, Research of Risk Management in Enterprises in Slovakia to create a new study program Risk Management for the FBI University of Zilina; and the project VEGA No. 1/0243/20 Integrated risk management system in the conditions of contemporary changes in enterprise environment in Slovakia, the Ministry of Education, Science, Research and Sport of the Slovak Republic.

Conflicts of Interest

The authors declare no conflict of interest.

References

  1. Sommerauerova, D.; Chocholac, J.; Hyrslova, J. Sustainable development indicators of selected European countries in the field of transport sector. In Proceedings of the 22nd International Scientific Conference Transport Means, Trakai, Lithuania, 3–5 October 2018; pp. 645–650. [Google Scholar]
  2. Stefancova, V. Implementation of Six Sigma methodology in railway processes. Ph.D. Thesis, University of Zilina, Žilina, Slovakia, 2019. [Google Scholar]
  3. Morgan, J.; Brenig-Jones, M. Lean Six Sigma for Dummies, 3rd ed.; John Wiley & Sons: London, UK, 2016; p. 350. [Google Scholar]
  4. Cempirek, V.; Vrbova, P.; Zakorova, E. The Possibility of Transferring the Transport Performance on Railway Transport. In Proceedings of the 18th International Scientific Conference-Logi, 8 November 2017; Volume 134. [Google Scholar] [CrossRef]
  5. Nedeliakova, E.; Dolinayová, A.; Nedeliak, I. Methods of Quality Evaluation of Transport Services, 1st ed.; EDIS–University of Žilina: Žilina, Slovakia, 2013; p. 184. [Google Scholar]
  6. Motykova, J.; Svadlenka, L. Statistical Analysis and Forecasting of Rail Transport Accidents in the Czech Republic. In Proceedings of the SGEM 2016, BK 2: Political Sciences, Law, Finance, Economics and Tourism Conference Proceedings, Albena, Bulgaria, 24–30 August 2016; pp. 619–626. [Google Scholar] [CrossRef]
  7. Milinkovic, S.; Marton, P.; Mašek, J.; Nedeliakova, E.; Gasparik, J.; Kendra, M.; Camaj, J.; Izvolt, L.; Belosevic, I.; Pavlovic, N.; et al. Increasing of Effectivenes of the Railway Transport Services Using the Decision-Support Systems; APVV Project: Beograd, Serbia, 2018. [Google Scholar]
  8. Kucharčíková, A.; Mičiak, M. Human Capital Management in Transport Enterprise. In Proceedings of the 18th International Scientific Conference on LOGI, MATEC Web of Conferences, Ceske Budejovice, Czech Republic, 19 October 2017; Volume 134. [Google Scholar] [CrossRef] [Green Version]
  9. Kořínek, T.; Křupka, J.; Soušek, R. Modelling of road safety evaluations at the regional and local level in Czech Republic. Int. J. Math. Models Methods Appl. Sci. 2013, 7, 91–102. [Google Scholar]
  10. Stachova, K.; Stacho, Z.; Blstakova, J.; Hlatká, M.; Kapustina, L.M. Motivation of Employees for Creativity as a Form of Support to Manage Innovation Processes in Transportation-Logistics Companies. Naše More 2018, 65, 180–186. [Google Scholar] [CrossRef]
  11. Thomsett, M. Getting Started in Six Sigma, 1st ed.; John Wiley & Sons, Inc.: Hoboken, NJ, USA, 2004; p. 224. [Google Scholar]
  12. Kohnová, L.; Papula, J.; Salajová, N. Internal factors supporting business and technological transformation in the context of industry 4.0 Bus. Theory Pract. 2019, 20, 137–145. [Google Scholar] [CrossRef]
  13. Pillet, M.; Rochon, S.; Duclos, E. SPC–Generalization of Capability Index Cpm: Case of Unilateral Tolerances. Qual. Eng. 1998, 10, 171–176. [Google Scholar] [CrossRef]
  14. Langewalter, G. Life is Our Ultimate Customer: From Lean to Sustainability. Target (AME) 2006, 22, 5–15. Available online: http://www.zerowaste.org/publications/Lean_to_Sustainability.pdf (accessed on 24 April 2020).
  15. Sustr, M.; Sousek, R.; Kolonicny, A.; Nemec, V. Transport Modelling Of Citizens Evacuation. In Proceedings of the 3rd International Conference on Traffic and Transport Engineering (ICTTE), Assoc Italiana Ingn Traffico Trasporti Res Ctr, Belgrade, Serbia, 24–25 November 2016; pp. 1026–1030. [Google Scholar]
  16. Topfer, A. Six Sigma. Koncepce a příklady pro řízení bez chyb. In Business Books: Praxe manažera; Computer Press, a.s.: Brno, Czechia, 2008; p. 508. [Google Scholar]
  17. Nadanyiova, M. Global Trends of the Personnel Marketing in Service Enterprises. In Proceedings of the 16th International Scientific Conference on Globalization and its Socio-Economic Consequences, Rajecke Teplice, Slovakia, 5–6 October 2016; pp. 1474–1481. [Google Scholar]
  18. Nedeliakova, E. The New Methods of Teaching Quality Management in the Study Program Railway Transport with a Focus on Optimization of Extraordinary; 010ŽU-4/2017, International project; Ministry of Education, Science, Research and Sport: Bratislava, Slovakia, 2017.
  19. George, M. Lean Six Sigma for Services–How to Use Lean Speed and Six Sigma Quality to Improve Services and Transactions, 1st ed.; McGraw-Hill Education: New York, NY, USA, 2003; p. 400. [Google Scholar]
  20. Brue, G. Six Sigma for Managers–24 Lessons to Understand and Apply Six Sigma Principles in Any Organization, 1st ed.; The McGraw-Hill Companies, Inc.: New York, NY, USA, 2005; p. 50. [Google Scholar]
  21. Eckes, G. Six Sigma for Everyone, 1st ed.; John Wiley & Sons, Inc.: Hoboken, NJ, USA, 2003; p. 124. [Google Scholar]
  22. Mura, L.; Ključnikov, A.; Tvaronavičienė, M.; Androniceanu, A. Development trends in human resource management in small and medium enterprises in the Visegrad Group. Acta Polytech. Hung. 2017, 14, 105–122. [Google Scholar] [CrossRef]
  23. Glisovic, N.; Milenkovic, M.; Bojovic, N.; Svadlenka, L.; Avramovic, Z. A hybrid model for forecasting the volume of passenger flows on Serbian railways. Oper. Res. 2016, 16, 271–285. [Google Scholar] [CrossRef]
  24. Dvořák, Z. Riadenie Rizík v Železničnej Deprave; Institut Jana Pernera: Pardubice, Czech Republic, 2010; p. 287. [Google Scholar]
  25. Hanzl, J.; Bartuska, L.; Rozhanskya, E.; Průša, P. Application of floyd´s algorithm on transport network of south bohemian region. Commun. Sci. Lett. Univ. Zilina 2016, 18, 68–71. [Google Scholar]
  26. Internal regulation of Railway infrastructure manager SR1025. Internal document of railway undertaking, Slovakia. 2019. Available online: http://fpedas.utc.sk/~gasparik/SR1025_1zmena.pdf (accessed on 24 May 2020).
  27. Štefancová, V.; Škorupa, M.; Kendra, M. Utilization of Six Sigma Methodology in Terms of Reducing Train Delays. Transport Means 2017. In Proceedings of the 21th International Scientific Conference, Kaunas, Lithuania, 20–22 September 2017; pp. 373–376. [Google Scholar]
  28. Nedeliakova, E.; Sekulova, J. Dynamic Quality Models in Services, 1st ed.; EDIS, University of Žilina: Žilina, Slovakia, 2016; p. 98. [Google Scholar]
  29. Nedeliakova, E.; Dolinayova, A.; Nedeliak, I. Management of Railway Transport 2, 1st ed.; EDIS-University of Zilina: Zilina, Slovakia, 2012; p. 164. [Google Scholar]
  30. Šatanová, A.; Klementova, J. Trends in Management Quality; Technical University in Zvolen: Zvolen, Slovakia, 2014; p. 184. [Google Scholar]
  31. Brue, G. Six Sigma for Managers, 1st ed.; McGraw-Hill Education: New York, NY, USA, 2015; p. 272. [Google Scholar]
  32. Štefancová, V.; Nedeliakova, E.; López-Escolano, C. Connection of Dynamic Quality Modeling and Total Service Management in Railway Transport Operation. Int. Sci. Conf. Sustain. Mod. Safe Transp. 2017, 192, 834–839. [Google Scholar] [CrossRef]
  33. Ližbetin, J.; Stopka, O. Application of Specific Mathematical Methods in the Context of Revitalization of Defunct Intermodal Transport Terminal: A Case Study. Sustainability 2020, 12, 2295. [Google Scholar] [CrossRef] [Green Version]
  34. Transport White Paper 2011: Towards a Competitive and Resource Efficient Transport System; The European Comission: Brussels, Belgium, 2011.
  35. Li, G.; Luan, X.; Yang, J.; Lin, X. Value capture beyond municipalities: Transit-oriented development and inter-city passenger rail investment in China’s Pearl River Delta. J. Transp. Geogr. 2013, 33, 268–277. [Google Scholar] [CrossRef]
  36. Závadská, Z.; Korenková, V. Process Management Theory and Practice, 1st ed.; Wolters Kluwer: Bratislava, Sovakia, 2017; p. 152. [Google Scholar]
  37. Trpisovsky, M.; Prusa, P. Regional Public Transportation Services Modelling. Nase More 2014, 61, 77–82. [Google Scholar]
  38. Svozilová, A. Zlepšování Podnikových Procesů, 1st ed.; Grada Publishing: Praha, Czech Republic, 2011; p. 223. [Google Scholar]
  39. Lusková, M.; Hudáková, M.; Buganová, K. Manažérstvo Kvality a Rizika–Integrácia, Princípy, Metódy, 1st ed.; EDIS–University of Zilina: Zilina, Slovakia, 2013; p. 278. [Google Scholar]
  40. Scheurer, J.; Porta, S. Centrality and Connectivity in Public Transport Networks and their Significance for Transport Sustainability in Cities. In World Planning Schools Congress; Global Panning Association Education Network: Mexico DF, Mexico, 2016. [Google Scholar]
  41. Alonso, A.; Monzón, A.; Cascajo, R. Comparative analysis of passenger transport sustainability in European cities. Ecol. Indic. 2015, 48, 578–592. [Google Scholar] [CrossRef] [Green Version]
  42. McGimpsey, P.; Havemann, J.; Sutcliffe, P. Promoting Sustainability in New Zealand’s Rail System; NZ Transport Agency: Wellington, New Zealand, 2009.
  43. Litman, T.A. Sustainable Transportation Indicators: A Recommended Research Program for Developing Sustainable Transportation; Transportation Research Board’s (TRB) Sustainable Transportation Indicators Subcommittee: Washington, DC, USA, 2009. [Google Scholar]
  44. Nenadál, J. Měření v Systémech Managementu Jakosti, 2nd ed.; Management Press: Praha, Czech Republic, 2004; p. 335. [Google Scholar]
  45. Tošenovský, J. Metody Zlepšování Jakosti Six Sigma a DALŠÍ strategie–Sborník k seminářům; StatSoft: Praha, Czech Republic, 2002; p. 116. [Google Scholar]
  46. Yang, K.; El-Haik, B. Design for Six Sigma—A Roadmap for Product Development, 2nd ed.; McGraw-Hill Education: New York, NY, USA, 2008; p. 768. [Google Scholar]
  47. Smith, D.; Blakeslee, J.; Koonce, R. Strategic Six Sigma–Best Practices from the Executive Suite, 1st ed.; John Wiley & Sons, Inc.: Hoboken, NJ, USA, 2002; p. 304. [Google Scholar]
  48. Budíková, M.; Králová, M.; Maroš, B. Průvodce Základními Statistickými Metodami, 1st ed.; Grada Publishing: Praha, Czech Republic, 2010; p. 272. [Google Scholar]
  49. OECD. Policy Instruments for Achieving Project Environmentally Sustainable Transport; OECD: Paris, France, 2001. [Google Scholar]
  50. Gyci, C.; Decarlo, N.; Williams, B. Six Sigma for Dummies; Wiley Publishing, Inc.: Indianapolis, IN, USA, 2005; p. 360. [Google Scholar]
  51. Kovacova, L. The Integration of Lean Management and Sustainability. Transf. Innov. 2013, 26, 195–199. [Google Scholar]
  52. Patyal, V.S.; Maddulety, K. Interrelationship between Total Quality Management and Six Sigma: A Review. Glob. Bus. Rev. 2015, 16, 1025–1060. [Google Scholar] [CrossRef]
  53. Yerubandi, V.S.M.; Mathi, P.; Namburi, K.P.V. Implementation of Lean Six Sigma in Public Road Transportation. Int. J. Innov. Technol. Explor. Eng. 2019, 9, 4937–4940. [Google Scholar] [CrossRef]
  54. Belhadi, A.; Kamble, S.S.; Zkik, K.; Cherrafi, A.; Touriki, F.E. The integrated effect of Big Data Analytics, Lean Six Sigma and Green Manufacturing on the environmental performance of manufacturing companies: The case of North Africa. J. Clean. Prod. 2020, 252, 119. [Google Scholar] [CrossRef]
  55. Dursun, M.; Goker, N.; Mutlu, H. An intuitionistic fuzzy cognitive map approach to evaluate success factors of lean six sigma project management methodology. Adv. Intell. Syst. Comput. 2020, 1029, 1138–1143. [Google Scholar] [CrossRef]
  56. Ahmed, A.; Page, J.; Olsen, J. Enhancing Six Sigma methodology using simulation techniques: Literature review and implications for future research. Int. J. Lean Six Sigma 2020, 11, 211–232. [Google Scholar] [CrossRef]
  57. Gutierrez, A. Continuous improvement initiatives for dynamic capabilities development: A systematic literature review. Int. J. Lean Six Sigma 2020, 11, 125–149. [Google Scholar] [CrossRef]
  58. Zhang, Z.H.; Awasthi, A.A. DMAIC-based methodology for improving urban traffic quality with application for city of Montreal. Int. J. Six Sigma Compet. Advant. 2016, 10, 24–49. [Google Scholar] [CrossRef]
  59. Lirazzeli, F.L.; Alliprandini, D.H. Comparative analysis of Lean and Six Sigma improvement projects: Performance, changes, investment, time and complexity. Total Qual. Manag. Bus. Excell. 2020, 31, 407–428. [Google Scholar] [CrossRef]
  60. Gutierrez-Gutierrez, L.; Barrales-Molina, V.; Fernandez-Giordano, M.; López-Morales, B. Six Sigma for dynamic capabilities development: Becoming more flexible organizations. Int. J. Lean Six Sigma 2020, 11, 35–56. [Google Scholar] [CrossRef]
  61. Parekh, V.; Solanki, K.; Prajapati, N. Application of Six Sigma on METRO Rail Construction Project. Lect. Notes Civ. Eng. 2020, 54, 567–572. [Google Scholar] [CrossRef]
  62. Mueller, P.; Cross, J. Factors impacting individual Six Sigma adoption. Int. J. Lean Six Sigma 2020, 11, 57–83. [Google Scholar] [CrossRef]
  63. Guerrero, A.; Hernández-Gomez, J.; Victorica, K.; Olivares, L. Six sigma as a competitive strategy: Main applications, implementation areas and critical success factors (CSF). DYNA 2019, 86, 160–169. [Google Scholar] [CrossRef] [Green Version]
  64. Gupta, S.; Modgil, S.; Gunasekaran, A. Big data in lean six sigma: A review and further research directions. Int. J. Prod. Res. 2020, 58, 947–969. [Google Scholar] [CrossRef]
  65. Stoilova, S. An Integrated Multi-Criteria and Multi-Objective Optimization Approach for Establishing the Transport Plan of Intercity Trains. Sustainability 2020, 12, 687. [Google Scholar] [CrossRef] [Green Version]
  66. ZSSK. General Conditions of Carriage for Passengers by Rail (GCC-CIV/PRR); ZSSK: Bratislava, Slovakia, 2013; Available online: https://www.zssk.sk/fileadmin/Dokumenty2/2013_pdf/nariadenie_vpppzpo-2013-10b.pdf (accessed on 24 April 2020).
  67. UIC. Internal Regulation of the International Union of Railways; UIC: Paris, France, 2011. [Google Scholar]
  68. CEN/TC 320—Transport—Logistics and Services; European Standard, European Committee for Standardization CEN—CENELEC: Brussels, Belgium, 2003.
  69. Carey, M.; Carville, S. Testing schedule performance and reliability for train stations. Oper. Res. Soc. 2000, 51, 666–682. [Google Scholar] [CrossRef]
  70. Corman, F.; Kecman, P. Stochastic prediction of train delays in real-time using Bayesian networks. Transp. Res. Part C Emerg. Technol. 2018, 95, 32. [Google Scholar] [CrossRef] [Green Version]
  71. Yong, Z.; Wenqing, L.; Shaoquan, N.; Xiaowei, L. Research on Train Delay Diagnosis in Train Diagram Based on Big Data Technology. In International Conference on Smart Vehicular Technology, Transportation, Communication and Applications, VTCA; Springer: Berlin/Heildelberg, Germany, 2017; Volume 86, pp. 109–116. [Google Scholar] [CrossRef]
  72. Daamen, W.; Goverde, R.; Hansen, I. Non-Discriminatory Automatic Registration of Knock-On Train Delays. Netw. Spat. Econ. 2009, 9, 47–61. [Google Scholar] [CrossRef] [Green Version]
  73. Ghaemi, N.; Zilko, A.A.; Yan, F.; Cats, O.; Kurowicka, D.; Goverde, R.M. Impact of railway disruption predictions and rescheduling on passenger delays. J. Rail Transp. Plan. Manag. 2018, 8, 103–122. [Google Scholar] [CrossRef] [Green Version]
  74. Chao, W.; Xiong, Y. Visualizing Train Delays Using Tableau and the Framework of a Delay Impact Visualization System. J. Big Data Anal. Transp. 2020. [Google Scholar] [CrossRef]
  75. Shi, R.; Wang, J.; Xu, X.; Wang, M.; Li, J. Arrival Train Delays Prediction Based on Gradient Boosting Regression Tress. In Proceedings of the 4th International Conference on Electrical and Information Technologies for Rail Transportation (EITRT); Springer: Singapore, 2019; Volume 640. [Google Scholar] [CrossRef]
  76. Lee, H.; Mun, H.; Lee, S. Evacuation time at Jong-no 3ga subway station considering electric train delays and congestion. J. Transp. Secur. 2018, 11, 137–150. [Google Scholar] [CrossRef]
  77. Montrone, T.; Pellegrini, P.; Nobili, P. A MILP Algorithm for the Minimization of Train Delay and Energy Consumption. In Optimization and Decision Science: Methodologies and Applications; Proceedings in Mathematics & Statistics; Springer: Berlin/Heildelberg, Germany, 2017; Volume 217. [Google Scholar] [CrossRef]
  78. Zhang, Y.; Chen, Z.; An, M.; Umar, A.M. Timetabling, Platforming, and Routing Cooperative Adjustment Method Based on Train Delay. In Proceedings of the 4th International Conference on Electrical and Information Technologies for Rail Transportation (EITRT); Springer: Singapore, 2019; Volume 640. [Google Scholar] [CrossRef]
  79. Briggs, K.; Beck, C. Modelling train delays with q-exponential functions. Phys. A 2007, 378, 498–504. [Google Scholar] [CrossRef] [Green Version]
  80. Krüger, N.; Vierth, I. Precautionary and operational costs of freight train delays: A case study of a Swedish grocery company. Eur. Transp. Res. Rev. 2015, 7, 6. [Google Scholar] [CrossRef] [Green Version]
  81. Sony, M.; Naik, S.; Therisa, K.K. Why do organizations discontinue Lean Six Sigma initiatives? Int. J. Qual. Reliab. Manag. 2019, 36, 420–436. [Google Scholar] [CrossRef]
  82. Galli, B. Risks related to lean six sigma deployment and sustainment risks: How project management can help. Int. J. Serv. Sci. Manag. Eng. Technol. 2018, 9, 82–105. [Google Scholar] [CrossRef]
  83. STN EN ISO 31000:2019. Risk management; Slovak Office of Standards, Metrology and Testing; Slovak Office of Standards, Metrology and Testing: Bratislava, Slovakia, 2019.
  84. Sanni-Anibire, M.O.; Mahmoud, A.S.; Hassanain, M.A.; Salami, B.A. A risk assessment approach for enhancing construction safety performance. Saf. Sci. 2020, 121, 15–29. [Google Scholar] [CrossRef]
  85. Internal Regulation of Railway Infrastructure Manager Z17 Accidents and Extraordinary Circumstances; Zeleznice Slovenskej Republiky: Bratislava, Slovakia, 2017.
  86. Závadská, Z.; Orenková, V. Procesný Manažment Teória a Prax, 1. Vyd; Wolters Kluwer: Bratislava, Slovakia, 2017; Volume 152, ISBN 978-80-8168-554-5. [Google Scholar]
  87. Bohnné, K.K. The Customer is Satisfied? Public Press Ltd.: Budapest, Hungary, 2005. [Google Scholar]
  88. Jarošová, E.; Noskievičová, D.Á.D. Pokročilejší Metody Statistické Regulace Procesu, 1st ed.; Grada Publishing: Praha, Czech Republic, 2015; p. 290. [Google Scholar]
  89. Stachová, K.; Papula, J.; Stacho, Z.; Kohnová, L. External partnerships in employee education and development as the key to facing industry 4.0 challenges. Sustainability 2019, 11, 345. [Google Scholar] [CrossRef] [Green Version]
  90. Kotler, P.; Keller, L. Marketing Management, 15th ed.; Prentice Hall: London, UK, 2016. [Google Scholar]
  91. Gródek-Szostak, Z.; Nesterak, J. Trade missions as the instrument for supporting international technological cooperation of enterprises-case study of Poland, Slovakia and Czech Republic. Acta Oecon. Univ. Selye 2017, 6, 57–68. [Google Scholar]
  92. Lizbetin, J. Decision-making processes in introducing RFID technology in manufacturing company. Nase More 2018, 65, 289–292. [Google Scholar] [CrossRef]
  93. Lorincová, S.; Hitka, M.; Štarchoň, P.; Stachová, K. Strategic instrument for sustainability of human resource management in small and medium-sized enterprises using management data. Sustainability 2018, 10, 3687. [Google Scholar] [CrossRef] [Green Version]
  94. Tokarcikova, E.; Bartosova, V.; Kucharcikova, A.; Durisova, M. Automotive Company’s Social Responsibility in Slovakia. In Proceedings of the 24th International-Business-Information-Management-Association Conference, Milan, Italy, 6–7 November 2014; pp. 2118–2127. [Google Scholar]
  95. Ozdemir, Y.A.; Ebegil, M.; Gokpinar, F. A Test Statistic for Two Normal Means with Median Ranked Set Sampling. Iran. J. Sci. Technol. Trans. A Sci. 2019, 43, 1109–1126. [Google Scholar] [CrossRef]
  96. Petrovsky, A. Transport Disctionary; Alfa: Bratislava, Slovakia, 1983. [Google Scholar]
  97. Hanaoka, S.; Regmi, M.B. Promoting intermodal freight transport through the development of dry ports in Asia: An environmental perspective. Iatss Res. 2011, 35, 16–23. [Google Scholar] [CrossRef] [Green Version]
  98. Stehmann, O.; Zellhofer, G. Dominant rail undertakings under European competition policy. Eur. Law J. 2004, 10, 327–353. [Google Scholar] [CrossRef]
  99. Guo, Y.; Peeta, S. Rail–truck multimodal freight collaboration: Truck freight carrier perspectives in the United States. J. Transp. Eng. 2015, 141, 04015023. [Google Scholar] [CrossRef] [Green Version]
  100. Wang, F.K.; Tamirat, Y.; Tsai, Y.S. Process Selection for Linear Profiles with One-sided Specifications Based on the Ratio Test Statistic. Qual. Reliab. Eng. Int. 2015, 31, 1575–1585. [Google Scholar] [CrossRef]
  101. Azizan, N.A.; Mohamed, I.; M’ng, J.C.P. A profitability study on the Malaysian futures markets using a new adjustable technical analysis indicator, adjustable bands Z-test-statistics’ (ABZ’). Afr. J. Bus. Manag. 2011, 5, 5984–5993. [Google Scholar] [CrossRef]
  102. Hemphill, J. Interpreting the Magnitude of Correlation Coefficients. Am. Psychol. 2003, 58, 78–79. [Google Scholar] [CrossRef] [Green Version]
  103. Hair, J.F.; Black, W.C.; Babin, B.J.; Anderson, R.E.; Tatham, R.L. Análise Multivariada de Dados; Bookman: Porto Alegre, Brazil, 2009; p. 593. [Google Scholar]
  104. Xie, S.; Ouyang, Y. Reliable service systems design under the risk of network access failures. Transp. Res. Part E Logist. Transp. Rev. 2019, 122, 1–13. [Google Scholar] [CrossRef]
  105. García-Alcaraz, J.L.; Avelar-Sosa, L.; Latorre-Biel, J.I.; Jiménez-Macías, E.; Alor-Hernández, G. Role of human knowledge and communication on operational benefits gained from Six sigma. Sustainability 2017, 9, 1721. [Google Scholar] [CrossRef] [Green Version]
  106. Rao, K. Services Marketing, 2nd ed.; Dorling Kindersley: New Delhi, India, 2011. [Google Scholar]
  107. Olšovská, A.; Mura, L.; Švec, M. Personnel management in Slovakia: An explanation of the latent issues. Pol. J. Manag. Stud. 2016, 13, 110–120, ISSN 2081-7452. [Google Scholar] [CrossRef]
  108. Hitka, M.; Vetráková, M.; Balážová, Ž.; Danihelová, Z. Corporate Culture as a Tool for Competitiveness Improvement. Procedia Econ. Financ. 2015, 34, 27–34. [Google Scholar] [CrossRef] [Green Version]
  109. Hitka, M.; Balážová, Ž. Comparison of Motivation Level of Service Sector Employees in the Regions of Slovakia and Austria. Procedia Econ. Financ. 2015, 23, 348–355. [Google Scholar] [CrossRef] [Green Version]
  110. Zyka, J.; Drahotsky, I. Evaluation of Ergonomic Risks in Workplace as an Efficient Instrument for Managing the Performance of Human Resources. In Proceedings of the 10th Annual International Scientific Conference on Competition, Jihlava, Czech Republic, 17–18 May 2018; pp. 434–441. [Google Scholar]
  111. Doherty, A. How will ‘Digital Technology’ change asset management in the railways? In IABSE Symposium, Guimaraes Towards a Resilient Built Environment Risk and Asset Management–Report; University of Minho: Guimaraes, Portugal, 2019; pp. 1–3. [Google Scholar]
  112. Chocholac, J.; Sommerauerova, D.; Hyrslova, J.; Kucera, T.; Hruska, R.; Machalik, S. Service quality of the urban public transport companies and sustainable city logistics. Open Eng. 2020, 10, 86–97. [Google Scholar] [CrossRef] [Green Version]
  113. Kuvvetli, Ü.; Firuzan, A. Applying Six Sigma in urban public transportation to reduce traffic accidents involving municipality buses. Total Qual. Manag. Bus. Excell. 2019, 30, 82–107. [Google Scholar] [CrossRef]
  114. Vaidya, O. A six sigma based approach to evaluate the on time performance of Indian railways. Int. J. Qual. Reliab. Manag. 2018, 35, 2212–2226. [Google Scholar] [CrossRef]
  115. Klochkov, Y.; Gazizulina, A.; Muralidharan, K. Lean six sigma for sustainable business practices: A case study and standardization. Int. J. Qual. Res. 2019, 13, 47–74. [Google Scholar] [CrossRef]
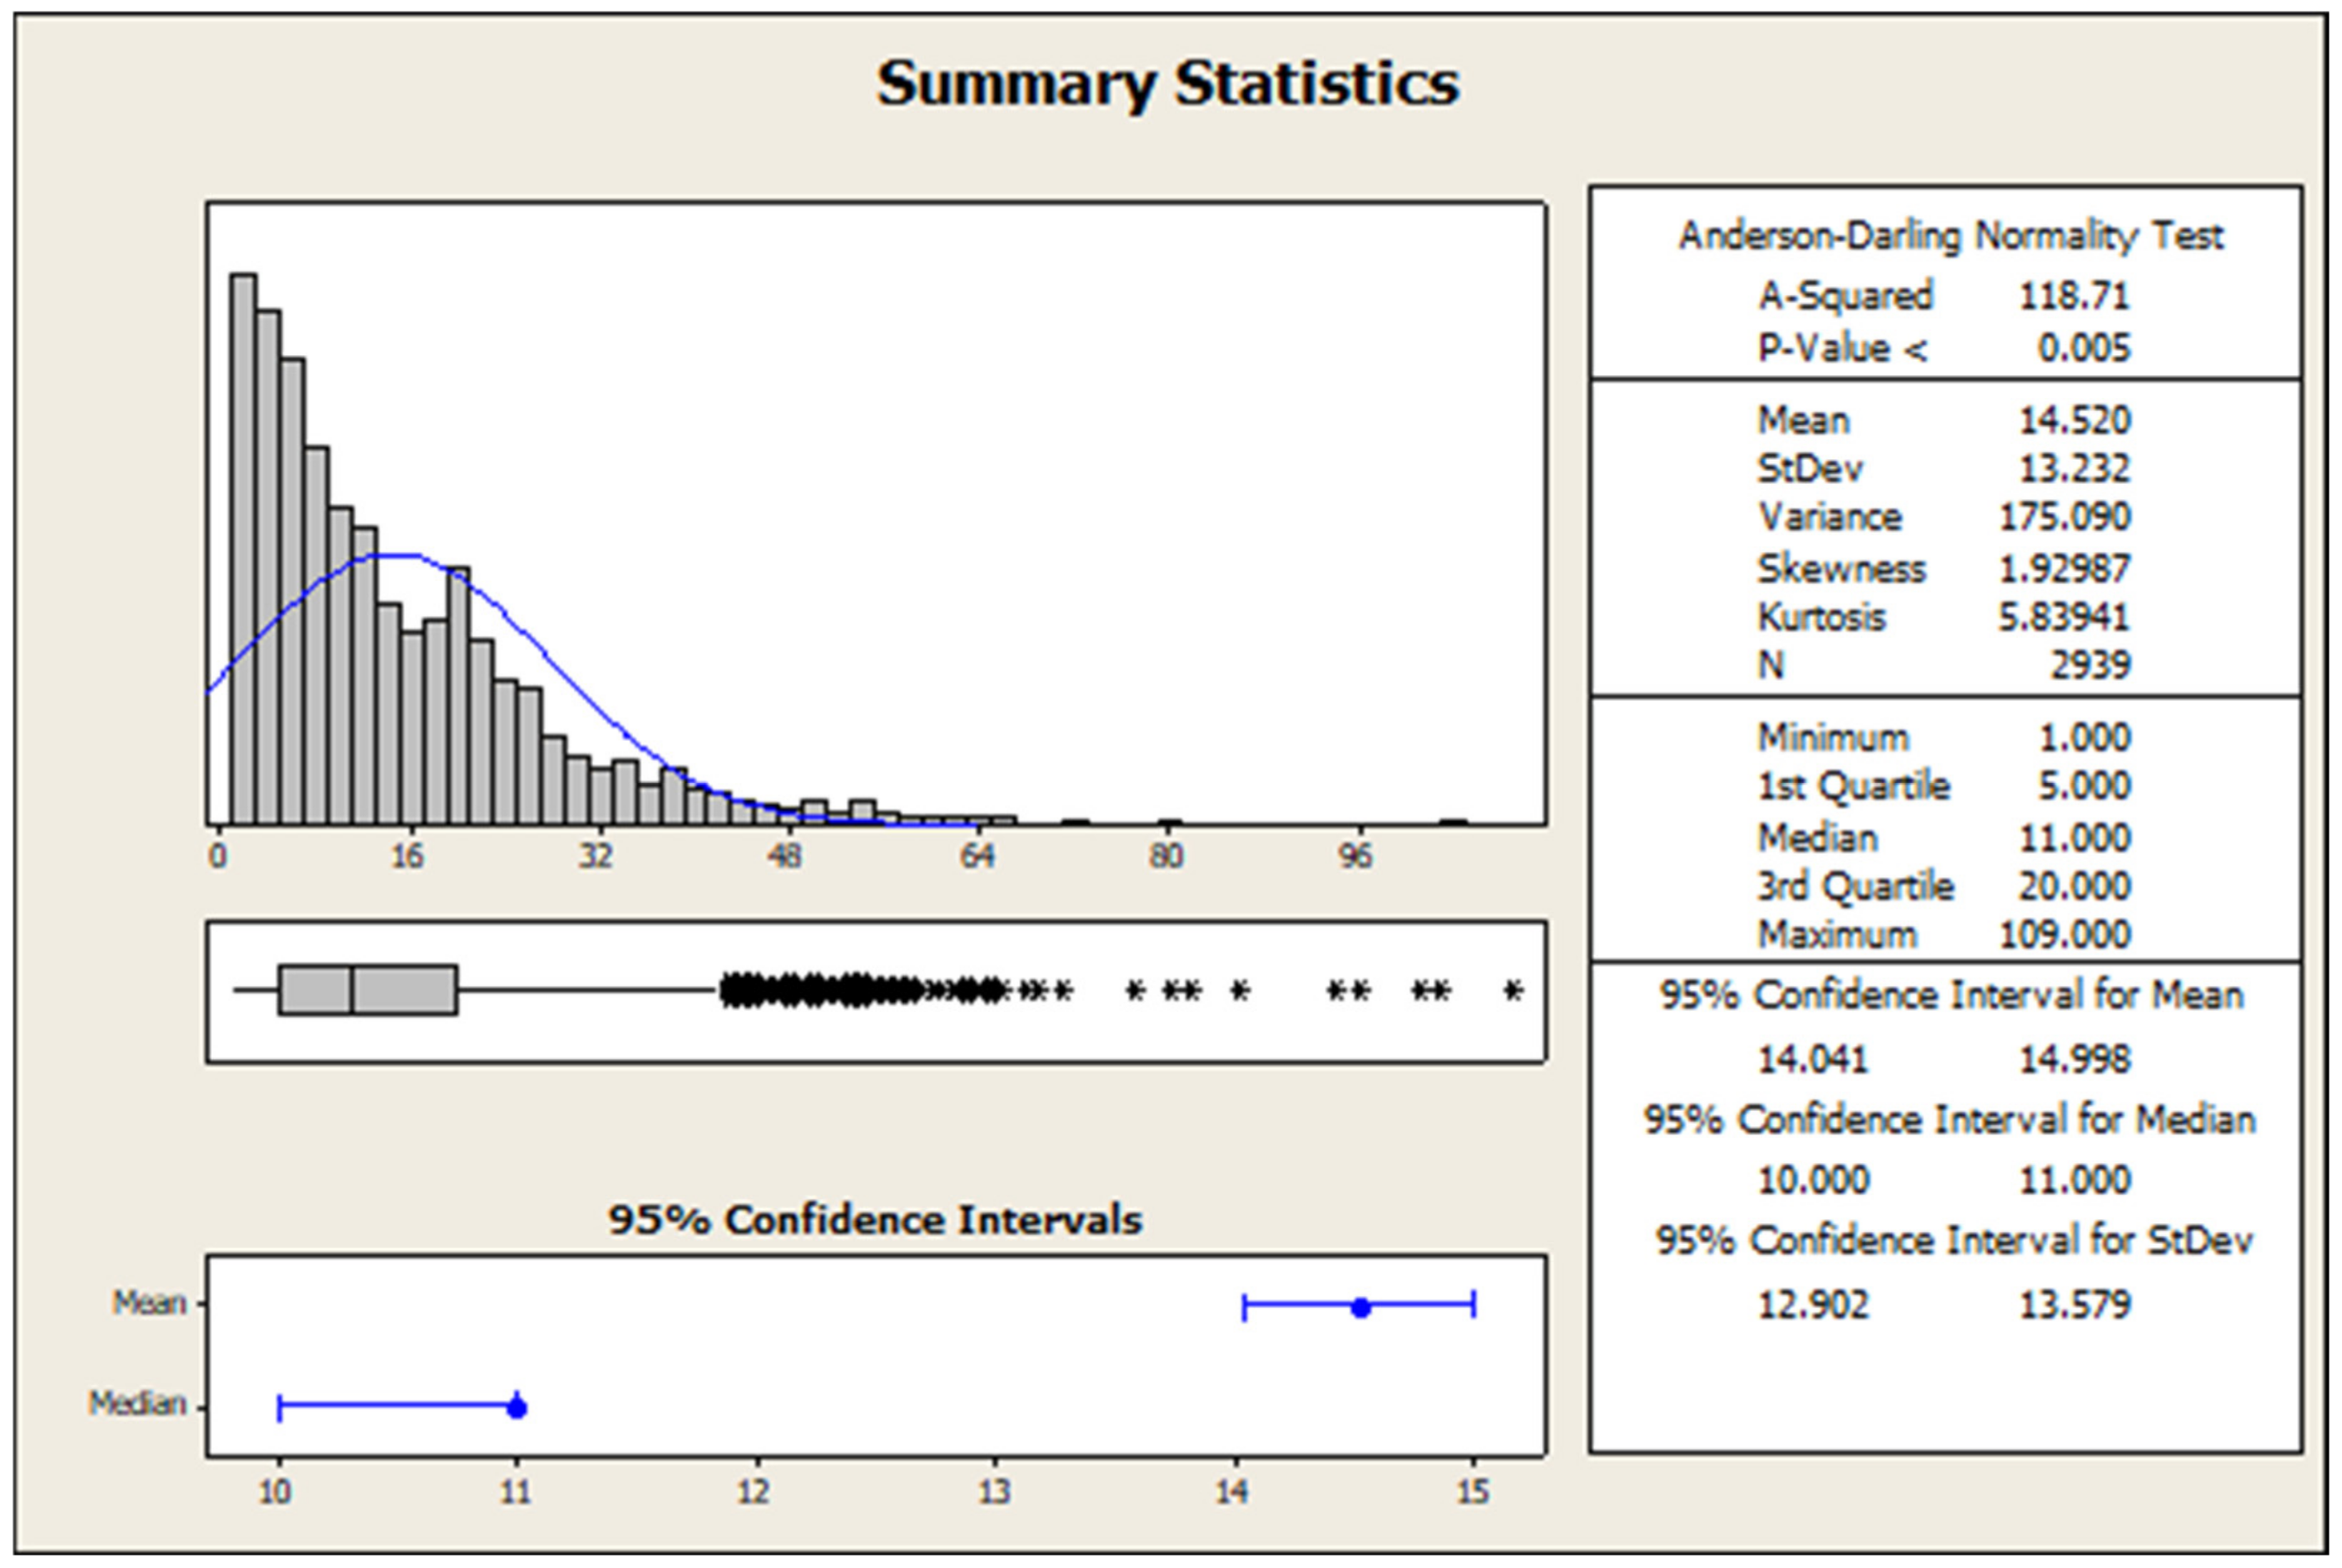
Figure 1. Summary statistics of the statistical set.
Sustainability 12 05298 g001
Figure 2. The categories of risks which caused the delays of a selected train in 2015–2018.
Sustainability 12 05298 g002
Figure 3. Delays of a selected train by weekday in 2015–2018.
Sustainability 12 05298 g003
Figure 4. Control chart of means and ranges.
Sustainability 12 05298 g004
Figure 5. Six Sigma levels in the monitored period of years 2015–2018.
Sustainability 12 05298 g005
Figure 6. A sample of the environment of the software tool.
Sustainability 12 05298 g006
Table 1. Data analysis through the selected DSI.
VariableμσQ1Q2Q3RSKN
Žilina13.9212.22961119932.339.16338
Púchov15.5914.91151121991.995.01305
Trenčín11.6911.60739161022.49.87619
Leopol14.9312.92441222781.42.51374
Trnava14.0712.643510201011.95.36792
Ba Hln18.1114.832616251081.644.8511
mean, μ; standard deviation, σ; first quartile, Q1; median, Q2; third quartile, Q3; range, R; skewness, S; kurtosis, K; and number of observed values, N.
Table 2. The results of correlation analysis: dependency of times in individual stations in a line section.
ŽilinaPúchovTrenčínLeopoldovTrnavaBratislava
Žilina1
Púchov0.1226391
Trenčín0.1441550.1518421
Leopoldov0.0183560.2112840.0231511
Trnava0.0055660.0025510.0771980.1191261
Bratislava0.0128970.0607320.1503430.1754410.1781721
Table 3. The error rate in the monitored period of 2015–2018.
ErrorAbsolute CountRelative Count
CountCumulative CountCountCumulative Count
Sequence of trains3143140.1052630.105263
Connection train1784920.0596710.164935
Unknown impact195110.0063690.171304
Waiting for a tractive vehicle85190.0026820.173986
Other reasons, transport95280.0030170.177003
Other reasons, tractive vehicles195470.0063690.183372
Other reasons, building105570.0033520.186725
Other reasons, special4039600.1350990.321824
Loading and unloading - others69660.0020110.323835
Accident events79730.0023470.326182
Turnover99820.0030170.329199
Failures of tractive vehicles5310350.0177670.346966
Failures of passenger wagons4610810.0154210.362387
Exceeding of travelling times43515160.1458260.508213
Preparation515210.0016760.509889
Government authorities415250.0013410.51123
Train crews (conductor, train attendant)3315580.0110630.522293
Driver715650.0023470.52464
Impact of weather1015750.0033520.527992
Interlocking plants2415990.0080460.536038
Equipment of electric traction1716160.0056990.541737
Increased frequency134429600.4505530.99229
Superstructure1229720.0040230.996312
Other reasons, carriage429760.0013410.997653
Other reasons, commercial129770.0003350.997989
Grade crossing interlocking plants629830.0020111