1. Introduction
Mass rapid transit (MRT) stations play an important role in hosting and distributing passengers through an urban transport system. However, station space is a limited resource, and passengers move through or temporarily halt in this limited space. Many studies have examined how to effectively configure and use space. For example, Bahrehmand et al. [
1] present an interactive layout solver that can assist designers in layout planning by recommending personalized space arrangements based on architectural guidelines and user preferences. Guo and Li [
2] present a method for the automatic generation of a spatial architectural layout from a user-specified architectural program. But the quality of an open public space may be significantly negatively associated with psychological distress. Therefore, emphasis must be placed on space planning and service quality in building such spaces [
3]. The quality of space planning for MRT stations will affect passengers’ evaluations of the space service quality. Poor space planning may, to a large extent, negatively impact passengers’ perceptions of the space service quality. In addition to the space in the infrastructure, time and user experience are additional factors to consider in space and route planning to improve the overall levels of service quality and passenger satisfaction. To enhance space planning and the degree of user satisfaction with station services, Li et al. [
4] employed a scientific method to assess a building’s space performance while emphasizing its influence on environmental quality and passenger satisfaction. They also developed an evaluation tool to continuously monitor the overall sustainable performance in the operation stage. Wang et al. [
5] used a questionnaire survey to understand the overall level of satisfaction with the interior environment of a flight terminal, and the outcomes can be used to assist in the future design and planning of airports and their operations. Tomé et al. [
6] stated that buildings are complex dynamic systems composed of sub-systems and components in continuous interaction with human behavior. Therefore, information needs to be obtained from records to understand passenger concentrations and levels of space usage. The above research studies belong to the post-occupancy evaluation (POE) method. The question which we must consider next is the cost and operational impacts of reconstruction caused by future use problems due to poor design. Hayek et al. [
7] and te Brömmelstroet et al. [
8] both argued that planning integration should occur in the early stages of design to avoid any imperfections or conflict problems in the public transport system. However, planning is often based on the instinct and experience of the decision-makers, even if they lack the ability to interpret modeling results. Therefore, it is a challenge to provide models and evaluation results that are easy to understand so that they can assist planning personnel in the decision-making process to achieve a reasonable balance between planning design and evaluation. Evaluation methods can be divided into two types: non-parametric and parametric evaluation methods. Data envelopment analysis (DEA) is a non-parametric method in operations research and economics for the estimation of production frontiers [
9,
10].
Another method is the parametric evaluation method, as Indraprastha and Shinozaki [
11] present in the computational model to analyze and assess the quality of architectural space by using visual distance combined with viewing angle to obtain the spatial quality. Understanding and evaluating space quality at the design stage can assist in making modifications at the pre-construction stage. Zawidzki et al. [
12] propose a framework wherein the architectural functional layout is optimized for the following objectives: functionality (defined by users), insolation (calculated according to geographical conditions), outside view attractiveness (assessed on-site) and external noise (measured on-site). Although we can use mathematics or optimization methods to evaluate the quality of the space design, these research approaches ignore the influence of human interaction and grouping in a confined space. The agent-based modeling (ABM) [
13,
14] technique is also widely adopted to simulate real social conditions and human psychological reactions to determine the problems that may arise. A multi-agent system consists of multiple independent agents interacting with each other. They can result in different sorts of complex and interesting behaviors. It is a method to model real-life situations. Research has supported the validity of ABM in modeling human behaviors. Lee and Malkawi [
15] utilized ABM to predict passenger behaviors, demonstrating that passenger behaviors impact both comfort and energy management activities. Osman [
16] applied ABM to predict infrastructure asset management activities to study the effects of the social-psychological behaviors of users on how the users spend time on infrastructure services. Langevin et al. [
17] developed and validated ABM for occupant behaviors using data from a one-year-long field study in a medium-sized, air-conditioned office building. Building information modeling (BIM) [
18,
19] is another popular technique in the construction industry, where it has been applied in the design and planning and the operation and maintenance phases. BIM can provide a visual modeling environment to assist in space planning, thus reducing discrepancies between design and actual construction outcomes. BIM models consist of comprehensive engineering attributes and spatial information. In view of these merits, in this study, BIM and ABM are applied to the evaluation of space service quality for providing dynamic visualization of the interactions between passengers and space. In simulating the actual conditions, the effects of spatial topology and human perception factor on the service quality of a space are considered. The results can not only assist planning personnel in adjusting current spatial designs but also provide feedback for the planning of station space and routes and in the analysis of alternative options at the design stage. This method can reduce labor and other financial costs associated with making changes in the design to improve passenger satisfaction levels.
2. Evaluation Method for Space Service Quality
Human beings have long endeavored to create indoor environments in which they can feel comfortable. Durmisevic and Sariyildiz [
20] pointed out key features that influence underground space design, including accessibility and nearest surroundings, orientation and way finding, spatial proportion, contact with the outside world, natural and artificial lighting, materials and colors, noise level, and air quality, among others. In addition to hardware equipment and environmental factors, other features are predominantly related to subjective feelings. In determining the impact of an indoor space on the comfort of the human body, the most common discrimination item is the indoor environment quality (IEQ), which is a benchmark for residential quality performance. It includes four items: thermal comfort, air quality, noise level, and lighting level [
21]. Some research scholars have shown that indoor environmental quality factors can affect occupant satisfaction [
22,
23]. Among them, the thermal comfort and lighting level can be improved by adjusting the hardware equipment to improve the quality of space services. However, noise and air quality are more difficult to improve. The main reason is that different measurements result from the interactions and states of crowds of people, so they are difficult to quantify. Therefore, this study considers the impact of human interaction and grouping on space to propose a novel method for evaluating space service quality for facilitating the efficient operations of an MRT Station. This method employs BIM technology combined with agent-based simulation to simulate the behavioral patterns of passengers at MRT stations. Through dynamic modeling of possible scenarios, an examination of spaces crowded by large volumes of passengers and the associated noise and air quality issues is performed to understand service quality at MRT stations.
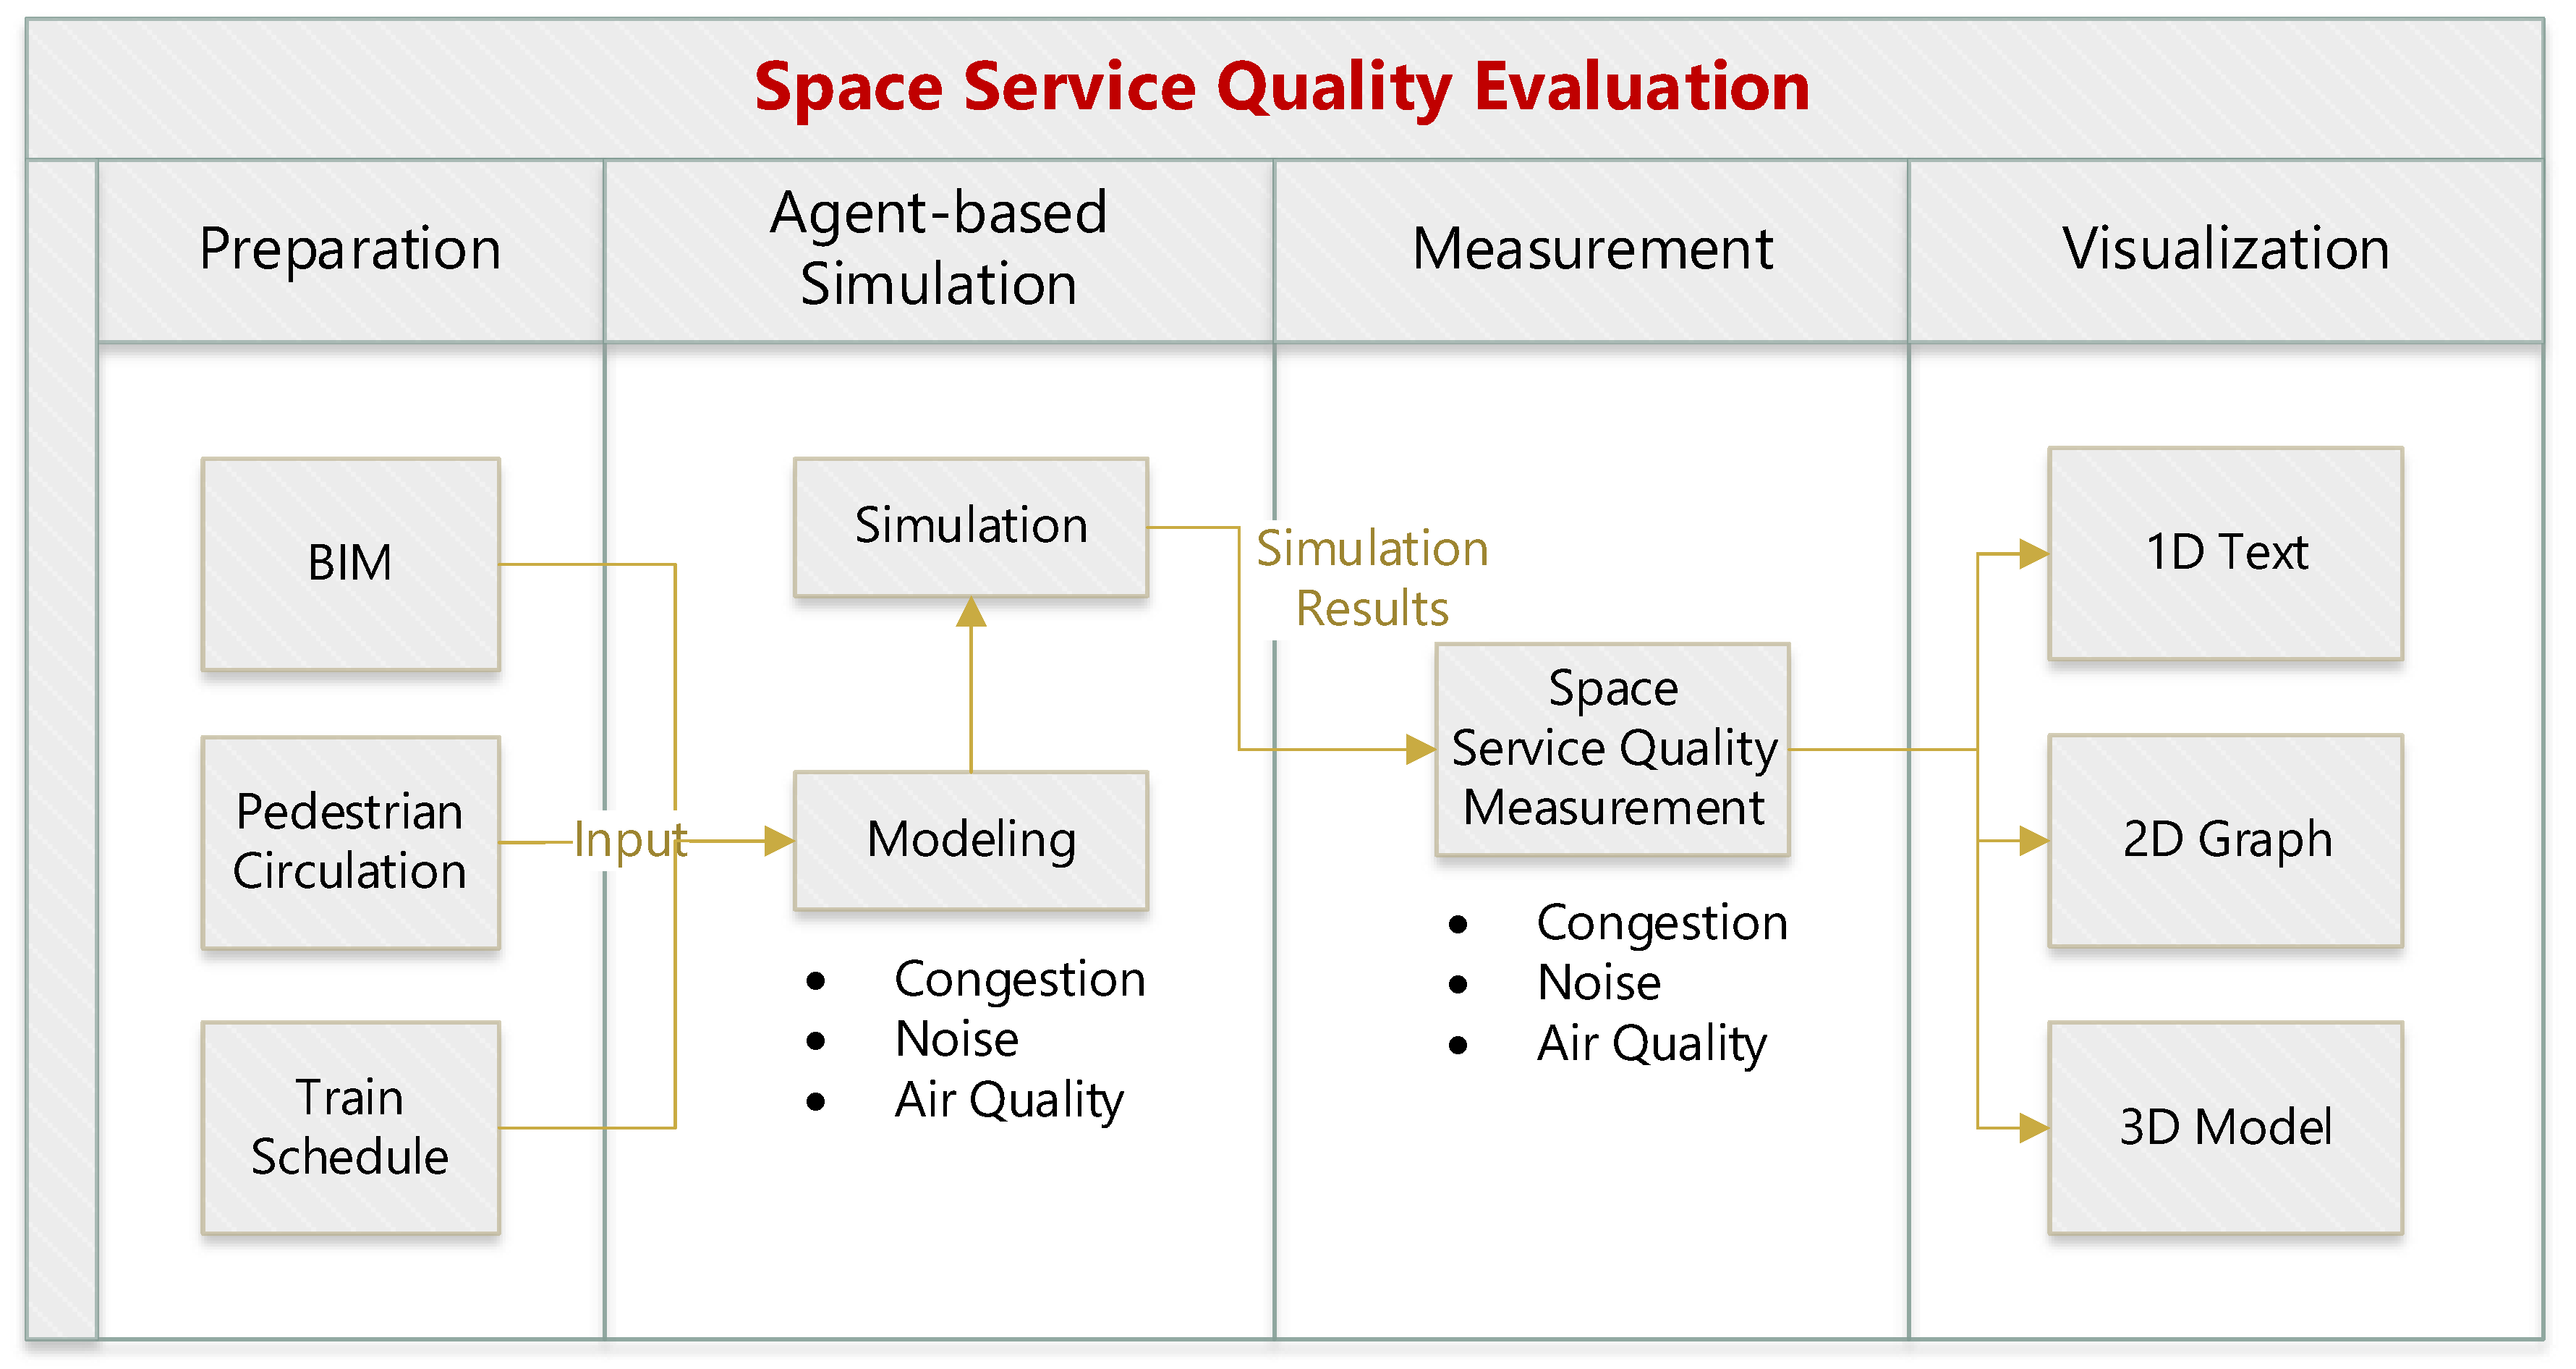
Figure 1 illustrates a flowchart of the evaluation method for space service quality. A major feature of this method is the reuse of the BIM models, which reduces the time and cost associated with the data preparation required for simulation. The BIM model contains geometric shapes, spatial locations, and boundaries, which are important simulation constraints. Subsequently, this research establishes agent-based models based on BIM and the passenger and train movement conditions. The actual conditions are simulated by setting the relevant influencing factors and behavioral patterns. This system can simulate the status of space usage, usage level, air quality, noise, etc. Moreover, the 2D and 3D visualization and statistical charts are used to present the simulation results. Finally, the simulation results of the space service quality measurement can be exported into Excel spreadsheets to assist planning personnel in evaluation and decision making in the design and operation stage during the building’s life cycle. In this way, the potential impact of future activities on service quality can be predicted and managed in advance.
3. Data Preparation
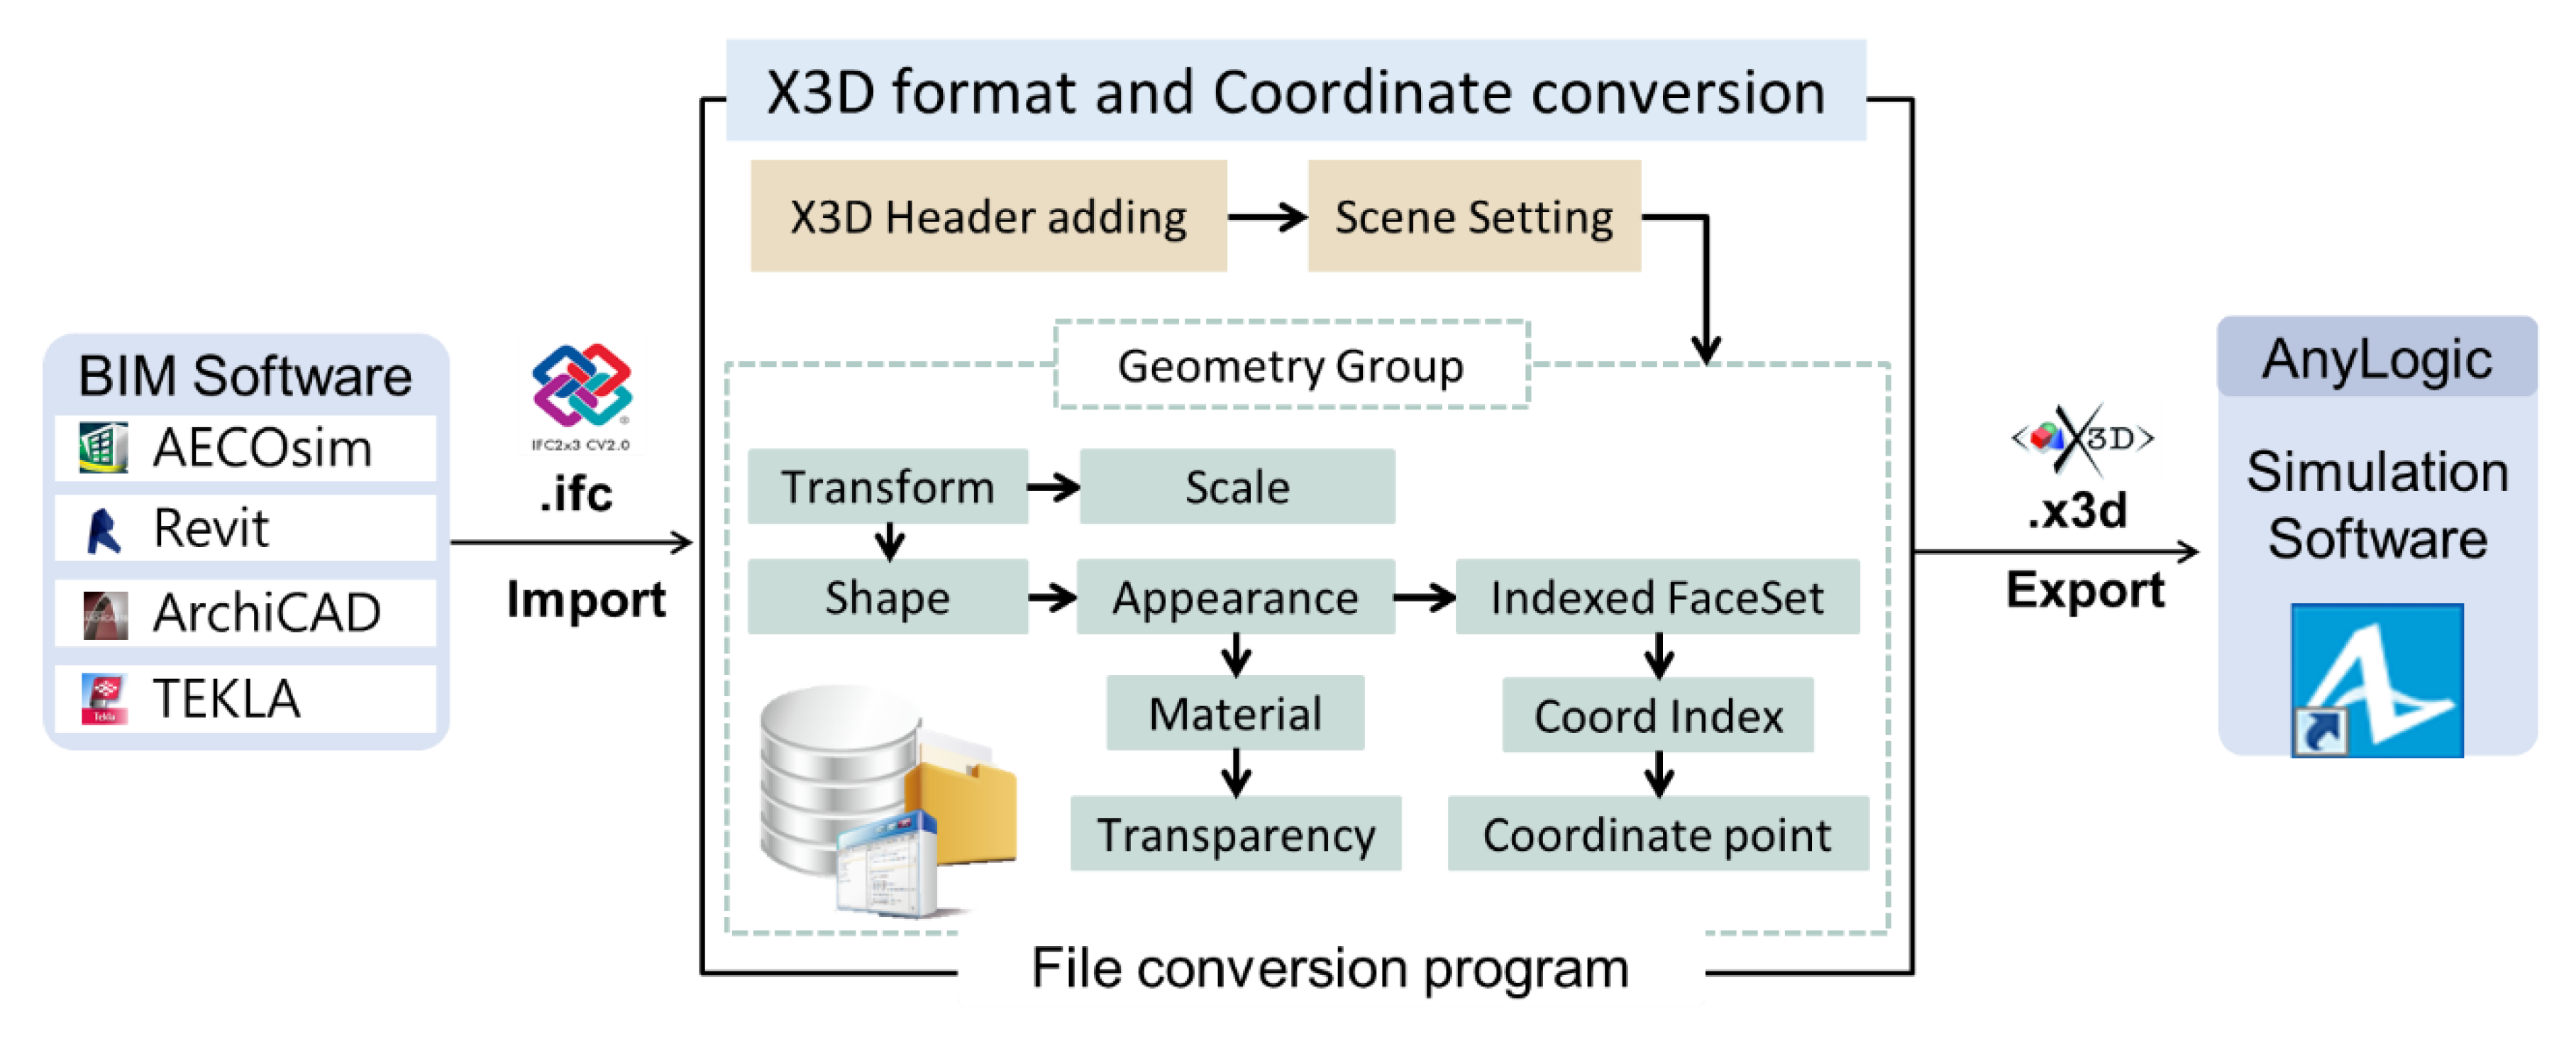
For space and pedestrian circulation planning, the dynamic simulation of virtual display methods needs to involve the timing between moving and stationary objects, the space configuration, and user participation characteristics. This research uses AnyLogic simulation software for agent-based simulation. Although it can support the 3D object formats VRML (Virtual Reality Modeling Language) and X3D (Extensible 3D), the VRML format has too many restrictions, and no updated version beyond VRML 97 exists. Therefore, this study employs X3D as the model conversion object. Since X3D is developed in XML format, it can be verified or modified using XML-related editing tools. Having extensible characteristics, it is a highly readable format due to the interaction between cross-platforms and is one of the current unified exchange formats for 3D data. In addition, to improve the sustainability value of the conversion program, the BIM model information exchange format called the Industry Foundation Classes (IFC), a data format released by BuildingSMART, is used as the standard format for converting all BIM models in the process. It can be used by different modeling software, such as Bentley AECOsim, Autodesk Revit, ArchiCAD, and Tekla, and this conversion mechanism can be used to export files in the X3D 3.0 version format for subsequent analysis and simulation. Thus, the consistent format conversion of the data model in the data preparation stage is a problem that must be solved. This study develops a BIM model data capture and format conversion tool, as shown in
Figure 2. The user can directly retrieve the floor plan and compartment data of the BIM model, convert it into the X3D virtual reality file format, and directly import it into AnyLogic for conversion to the active space boundary condition of the system. This study reuses the BIM model established in the design planning stage to ensure the accuracy of the simulation and to avoid the labor cost of rebuilding the model. Moreover, the data on pedestrian circulation were collected from historical data of the operation stage. In addition to traffic at the exits and entrances of the station, passengers board and alight from MRT trains at the platforms. Thus, this research collected the train schedules to obtain train capacities at different times and consider the overall pedestrian circulation.
4. Agent-Based Simulation
Space quality, similar to service quality, is subject to user perceptions. Crowded spaces or spaces with noise and/or bad air quality directly negatively affect people’s perception of the service quality. Agent-based modeling can deal with continual temporal and spatial states of events. Agents can make decisions on space boundaries, destinations, entrances, exits, and route disturbances as well as identify potential problems. A multi-agent system consists of multiple independent agents interacting with each other. A multi-agent system simulation can be applied to society, biological bodies, mechanical processes, human beings, or any movable object. The social force model proposed by Helbing et al. [
24] can be used to promote or influence agents’ physical and psychological states, generating distance between the agents and resulting in socio-psychological, physical, and reaction forces. This model is widely applied for the simulation of behavioral patterns of agents. Therefore, in addition to using BIM to understand the walking behaviors of passengers in an MRT station space, this study uses an agent-based method to simulate congestion, noise, and air quality according to the number of passengers, determine the extent of their effect, and evaluate service quality. The results can serve as a reference and a basis for decision making in the planning process.
4.1. Modeling for Congestion
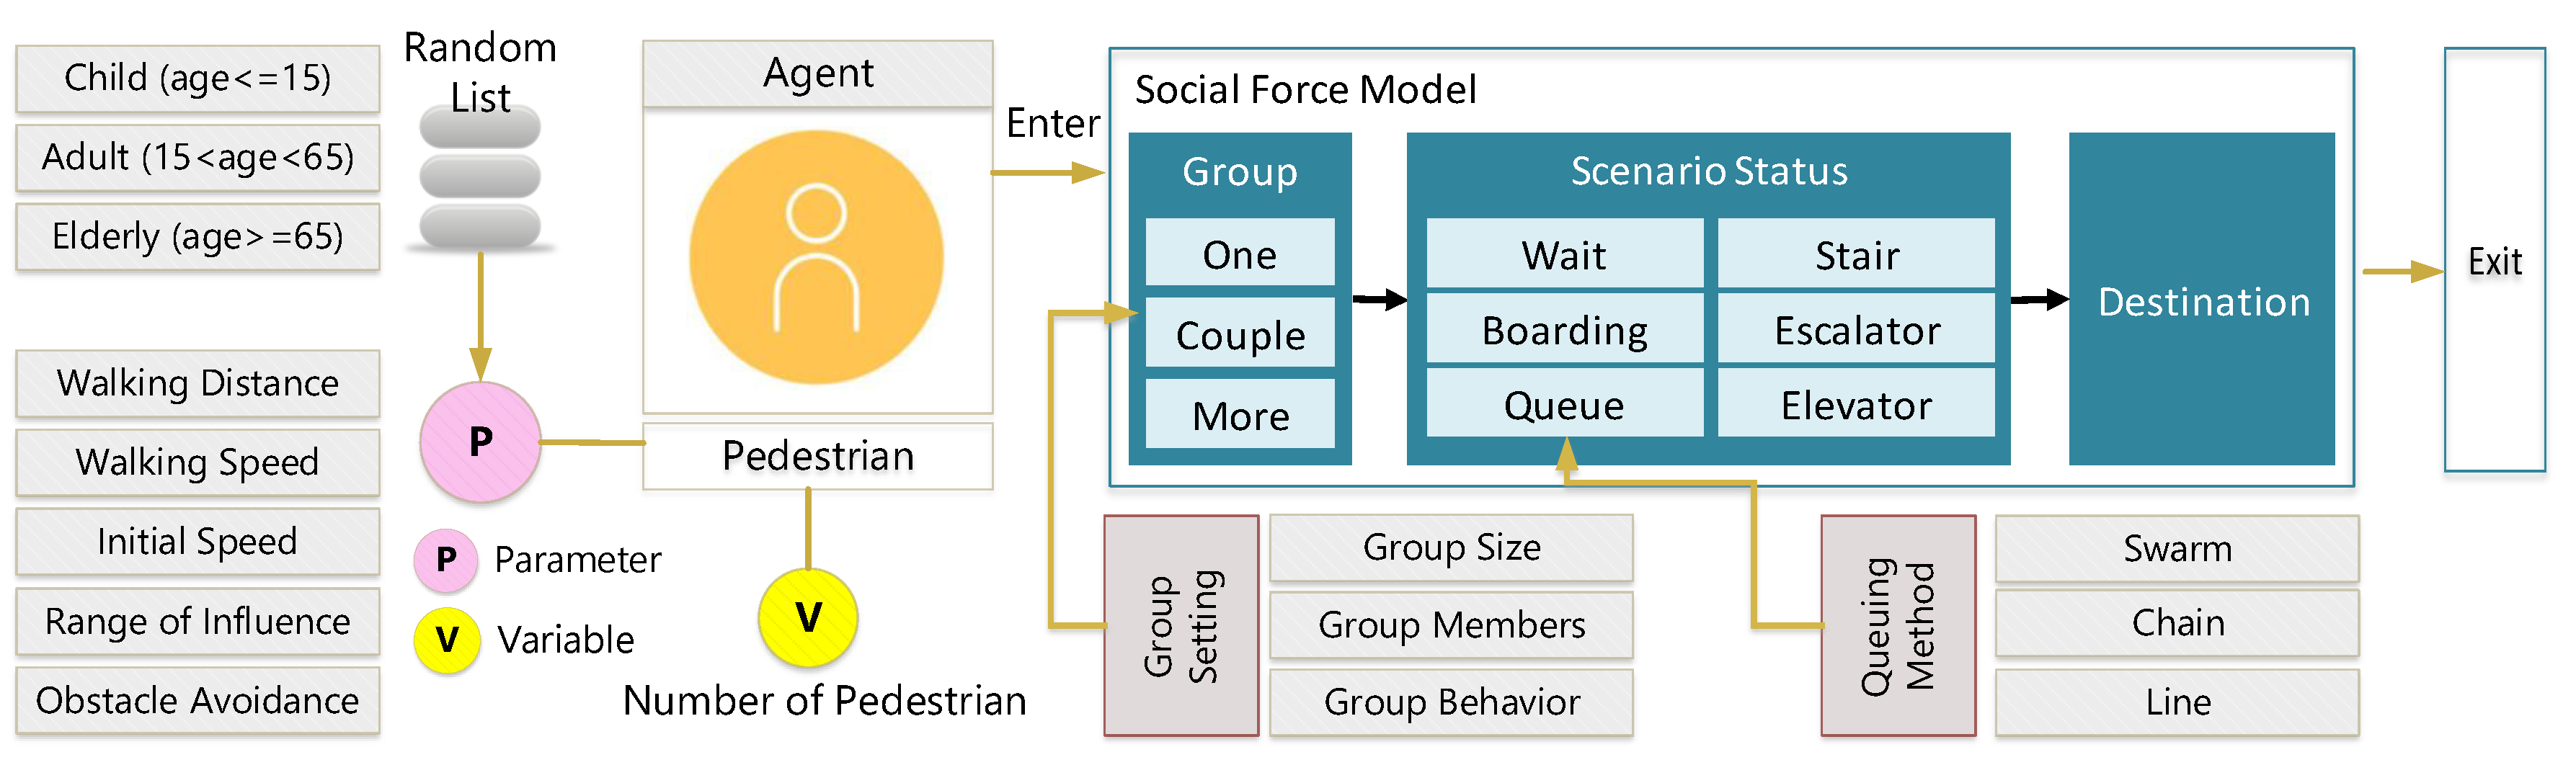
MRT stations serve male and female passengers of different ages. The passenger’s speed, grouping, behavior, etc. produce different interactions within the space. Factors such as the location of entrances and exits and the placement of equipment affect the passengers’ circulation within the space. They also have different behavioral impacts on other agents, which are reflected in the results of subsequent decisions. Understanding the relationship between passengers and MRT station spaces allows reductions of relative obstacles and increases in circulation speed. Therefore, this study uses the BIM technology to capture the boundary conditions of the MRT station model, integrates the agent’s virtual role to simulate the flow of people, and reflects the behavioral state and judgment logic of the passengers in different environments in different spaces. Through the establishment of influencing factors, the simulation results can be presented in dynamic 2D and 3D visualization without static assumptions. It is hoped that based on the specific situation analysis and the actual situation, by the setting of parameters and simulation of the agent, whether the existing space can cope with varying crowd sizes can be analyzed. In addition, through relevant settings, the possible behavior results of various agents in different spaces, the flow of people and the state of congestion are evaluated, and data results are provided to improve the impact of service quality within the space.
Pedestrian agents are intelligent in the state of social force model agent simulation. Passengers are simulated through continuous calculation and judgment for each step they take; this study also adds the calculation parameters in the space to the agent calculation equation, making the agent more reliable in the simulated state. The parameters include simulated walking targets, walking velocity, walking distance, walking speed, passenger influence range, obstacle avoidance, and other factors affecting pedestrian agents between spaces and obstacles. In addition, because the agent system needs to first generate a category during the construction, this category generates the agent character objects according to the conditions based on the parameters and state settings defined in the study. This ensures that the agent character objects are independent of each other. Different state behaviors are additionally set in the category, resulting in different behavioral rules for different pedestrian agents. In this study, pedestrian agents are distinguished by age as the object parameters of adults, the elderly, and children, and they are set in groups or partnered so that the pedestrian agents not only walk independently but also may be in the group movement state. However, in situations such as queuing, waiting, ascending and descending stairs, and boarding, the states that produce a separate pass or use conditions need to be changed. This study presents the above-mentioned conditions based on the basic conditions of pedestrian agents in the simple behavioral state, and they are presented in flow charts, as shown in
Figure 3.
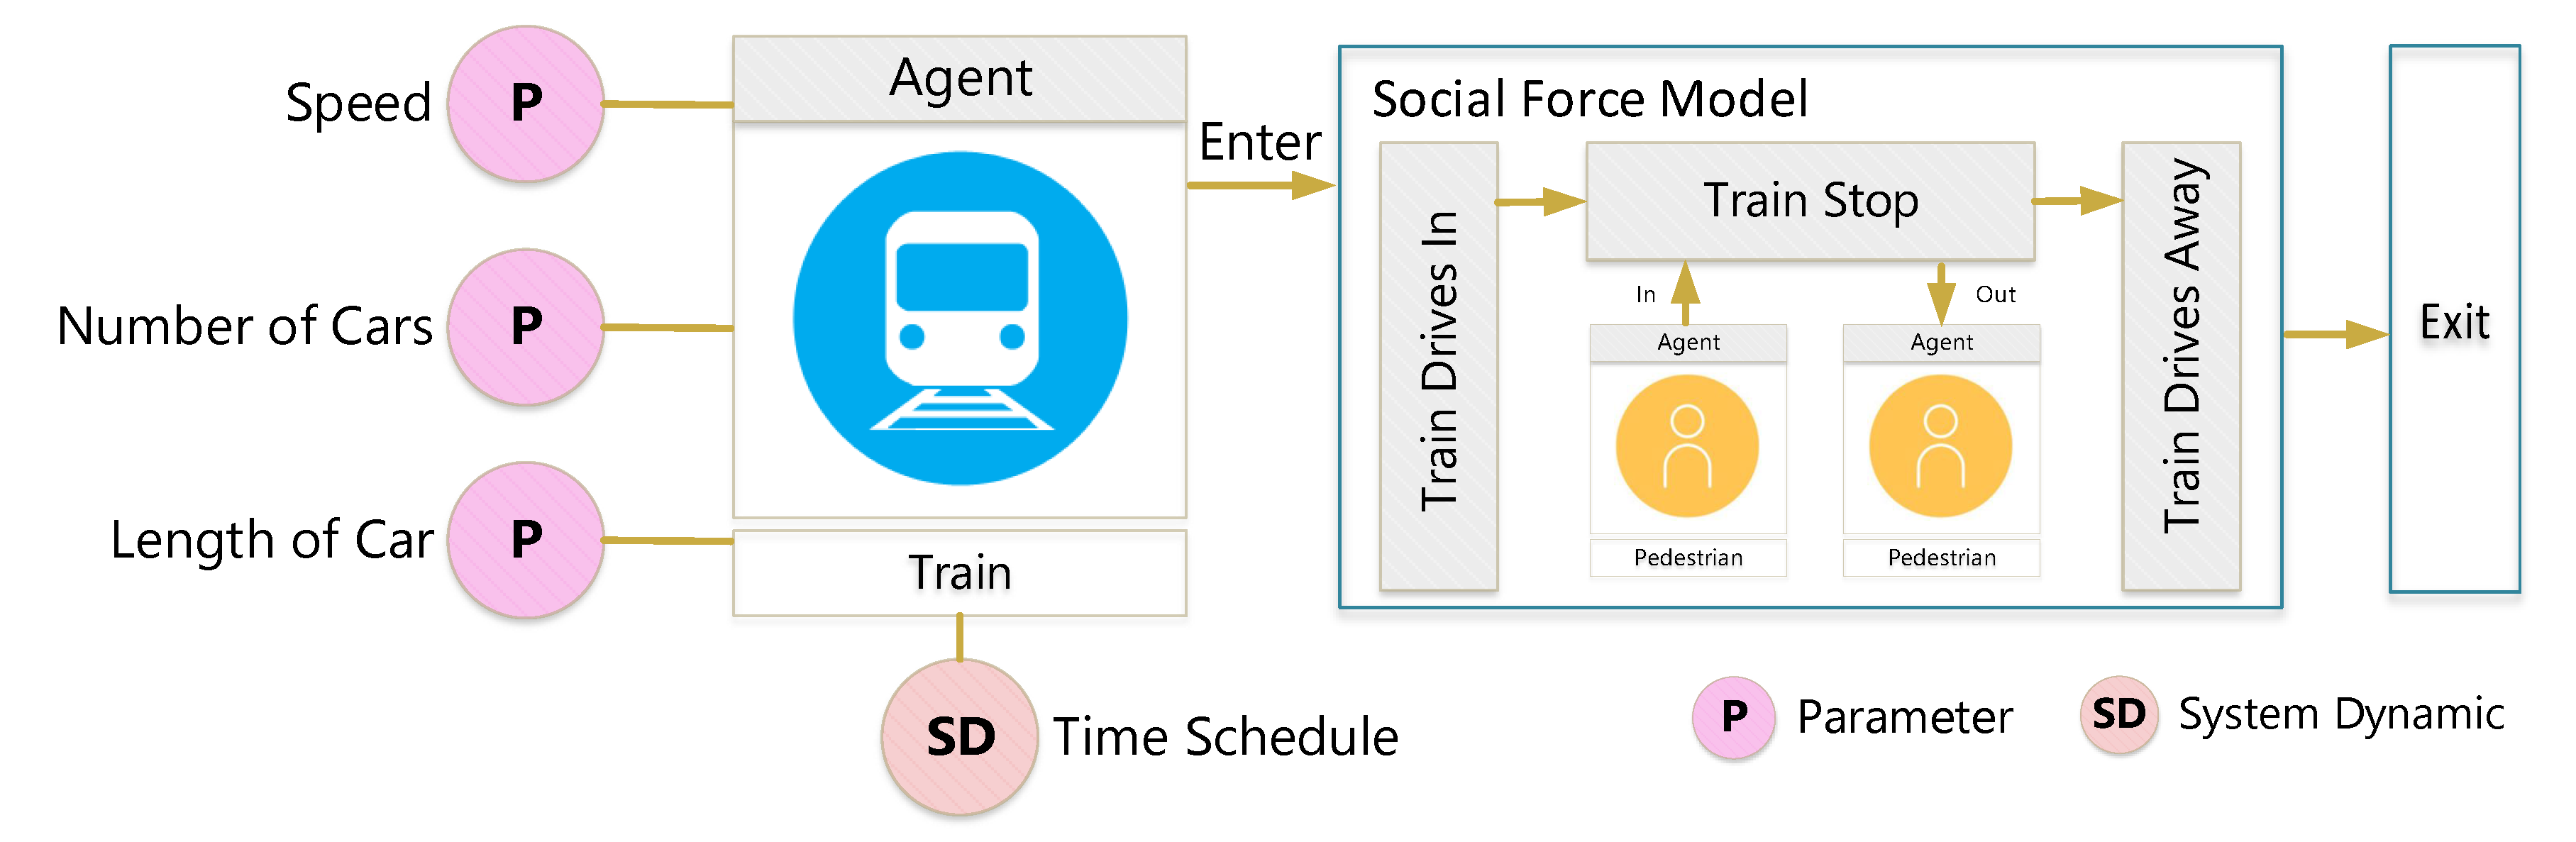
At the platform level of the MRT station, a track area caters to the trains’ demand outside the passenger use area. Therefore, simulation is performed while considering the train entry and exit statuses and the passengers’ boarding behaviors in the same space. If the simulation is not performed simultaneously, it will not be able to meet the changes in trains’ spatial demands for different passengers. However, trains and passengers are objects of different agent types and have different characteristics. Therefore, it is necessary to establish the various agent types for different agents. Moreover, because the train travels on a track, it is divided into two service states—inbound and outbound—so there are no roaming and collision problems. The number of train cars is set to 8 according to the number of platform doors. The length of each car is 23.5 m, and the train’s arrival and travel times are controlled by parameters in the simulation. The basic traveling speed of the train is 20 m/s, and the train is set to have an acceleration/deceleration state when entering and leaving the station. The transition mode of the cyclic state is shown in
Figure 4. In this study, the train agent is connected to the process in the initial state of the train, and as shown in the flowchart, the position of the inbound and outbound track, as well as the length and running speed of the car, are set. Before entering the model, we establish that no train is on the track, and we set the speed of entry and departure as well as the stops for passengers. In addition, we set the time for the boarding of passengers in a delayed state for simulation of both passengers and cars, and then we set a fixed cyclic state after the train leaves and change the cycle time according to demand. This is used as a train agent simulation process.
Simulation of the congestion conditions requires knowing the number of people entering the model, the number of users of each space, train arrival times, the number of passengers brought in by each train, the hourly passenger volume, the area of the space, etc. The walking routes of agents are recorded and used in the simulation to derive the results.
4.2. Modeling for Noise
Balaras et al. [
25] studied the indoor environment quality of Greek airports in 2003. The study showed that noise is a major problem, with a dissatisfaction rate of 78%. This study reflects that noise is one of the main factors affecting the quality of space service. Sound is a perception of human hearing, and noise pollution in the space will cause discomfort to people. Passengers walking and talking in public environments produce basic sounds, which can have a superimposing effect in the space. From an acoustic point of view, the human ear can detect sound due to rapid pressure changes in the air transmitting the sound. Therefore, the noise in this study is calculated in terms of the Sound Pressure Level (SPL) in decibels (dB) [
26,
27]. It is defined as the common logarithm of the ratio of the effective value of the measured sound pressure
p(
e) and the reference sound pressure
p(
ref), multiplied by 20, as given by Equation (1). The general value of the reference sound pressure
p(
ref) in the air is 2 × 10
−5 Pa.
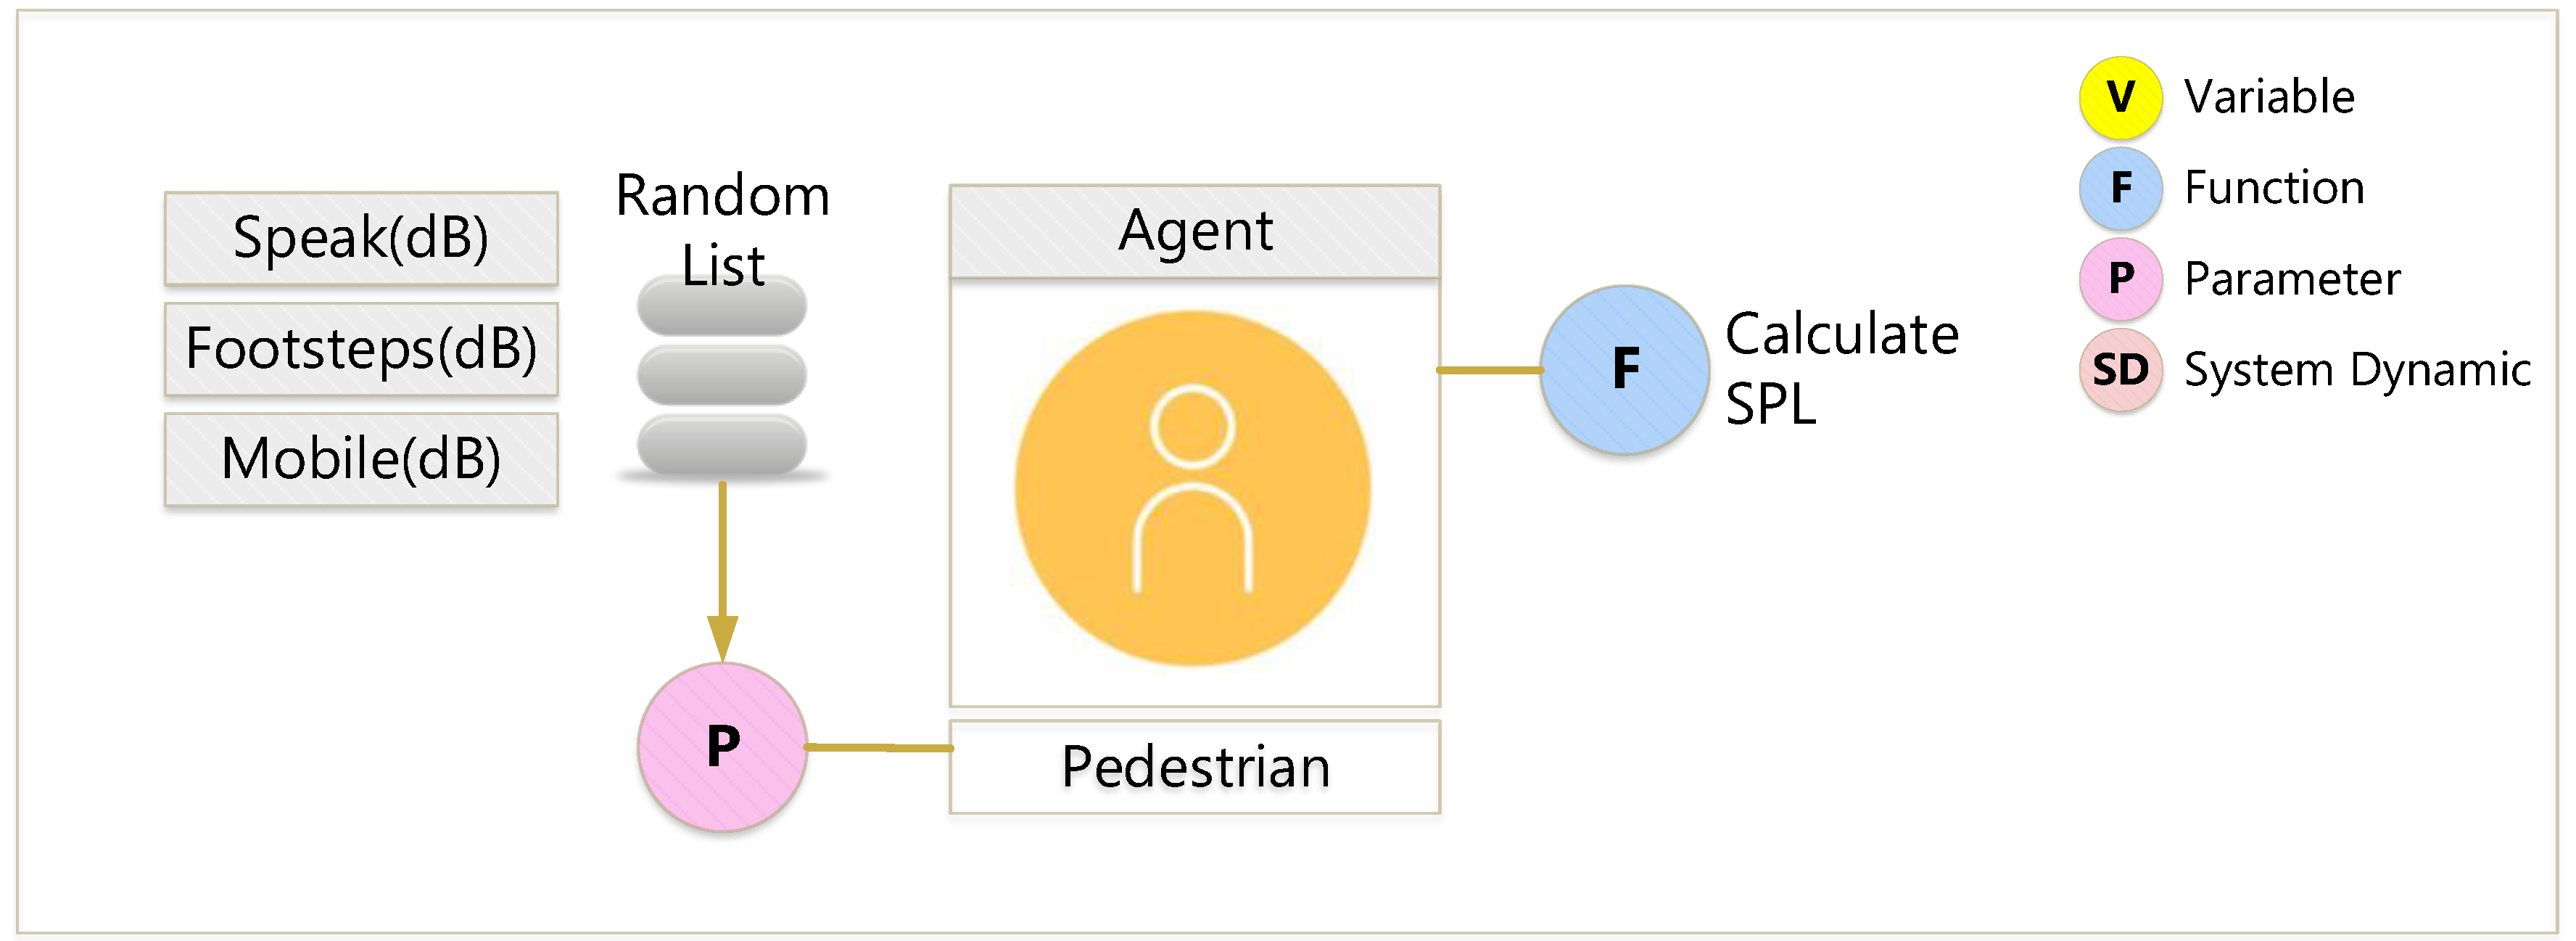
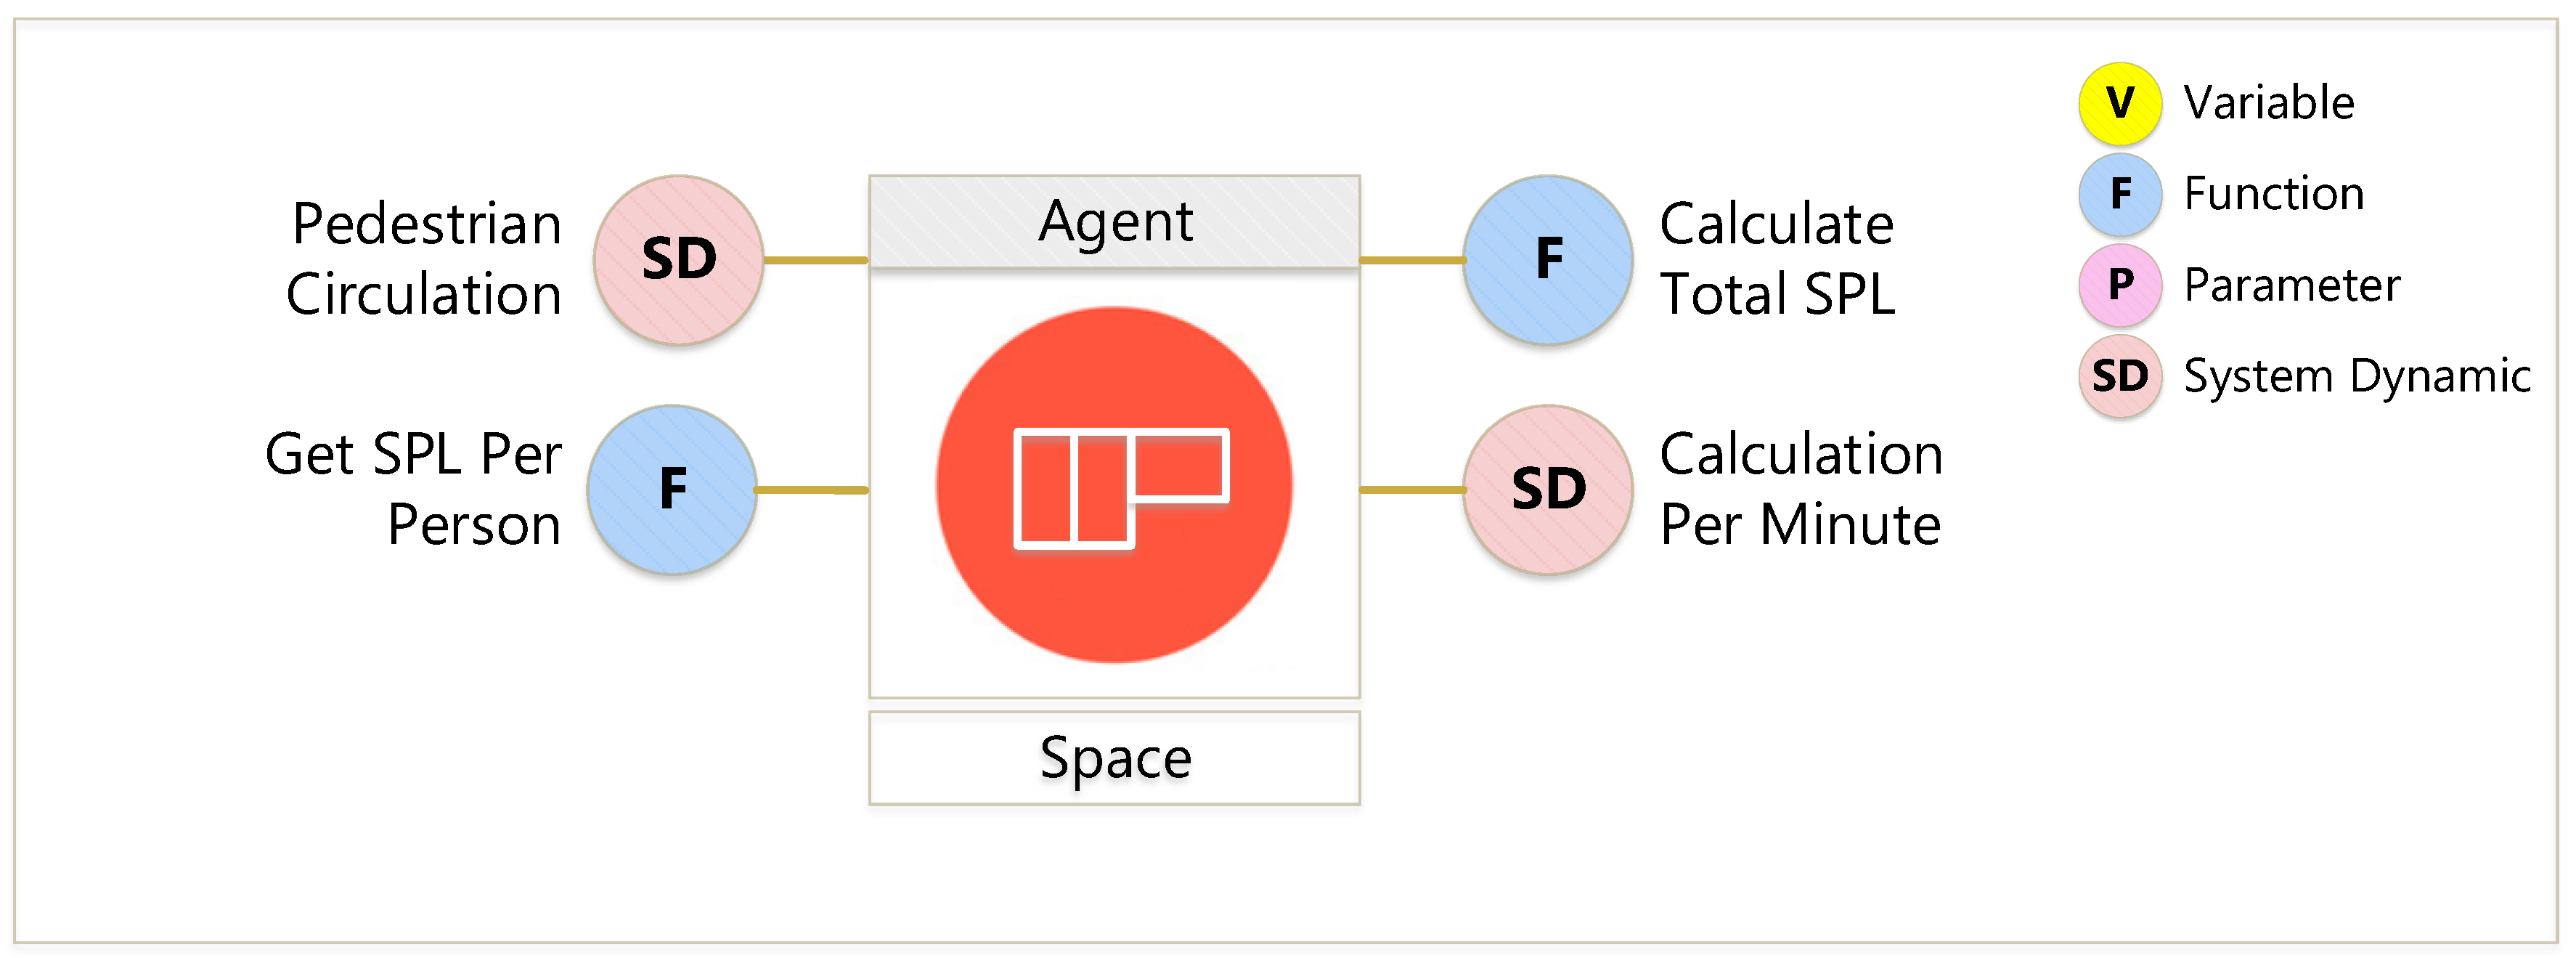
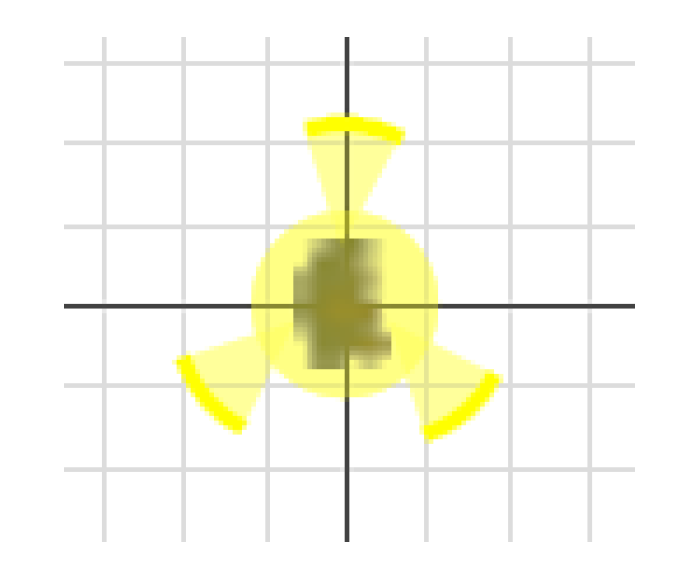
In the MRT space, passengers will create other basic sounds, such as speaking, phone calls, or footsteps, which affect the environment. In this study, the SPL is added to the pedestrian agent’s self-behavior with a random parameter number such that the passenger gains a decibel value of sound when entering the space. At the same time, to evaluate the total noise amount in each space, the total SPL generated by the cluster is calculated according to Equation (2).
This study constructs a noise model based on the above description. Passengers talking to each other, footsteps, and phone sounds are added to pedestrian agent behaviors as variables, and each agent randomly generates only one type of sound. Pedestrian agents walk in different spaces according to specific behaviors and routes. The number of people and different sound states in each space is shown in
Figure 5. About parameter settings for affecting the space, the total SPL obtained is considered as the basis for evaluating the decibel levels of the sound generated by each passenger, and other sounds increasing the decibel level result are considered. Then the impact score due to noise in each space is calculated to facilitate follow-up space service quality result measurement. The parameter settings required for the simulation are shown in
Figure 6.
4.3. Modeling for Air Quality
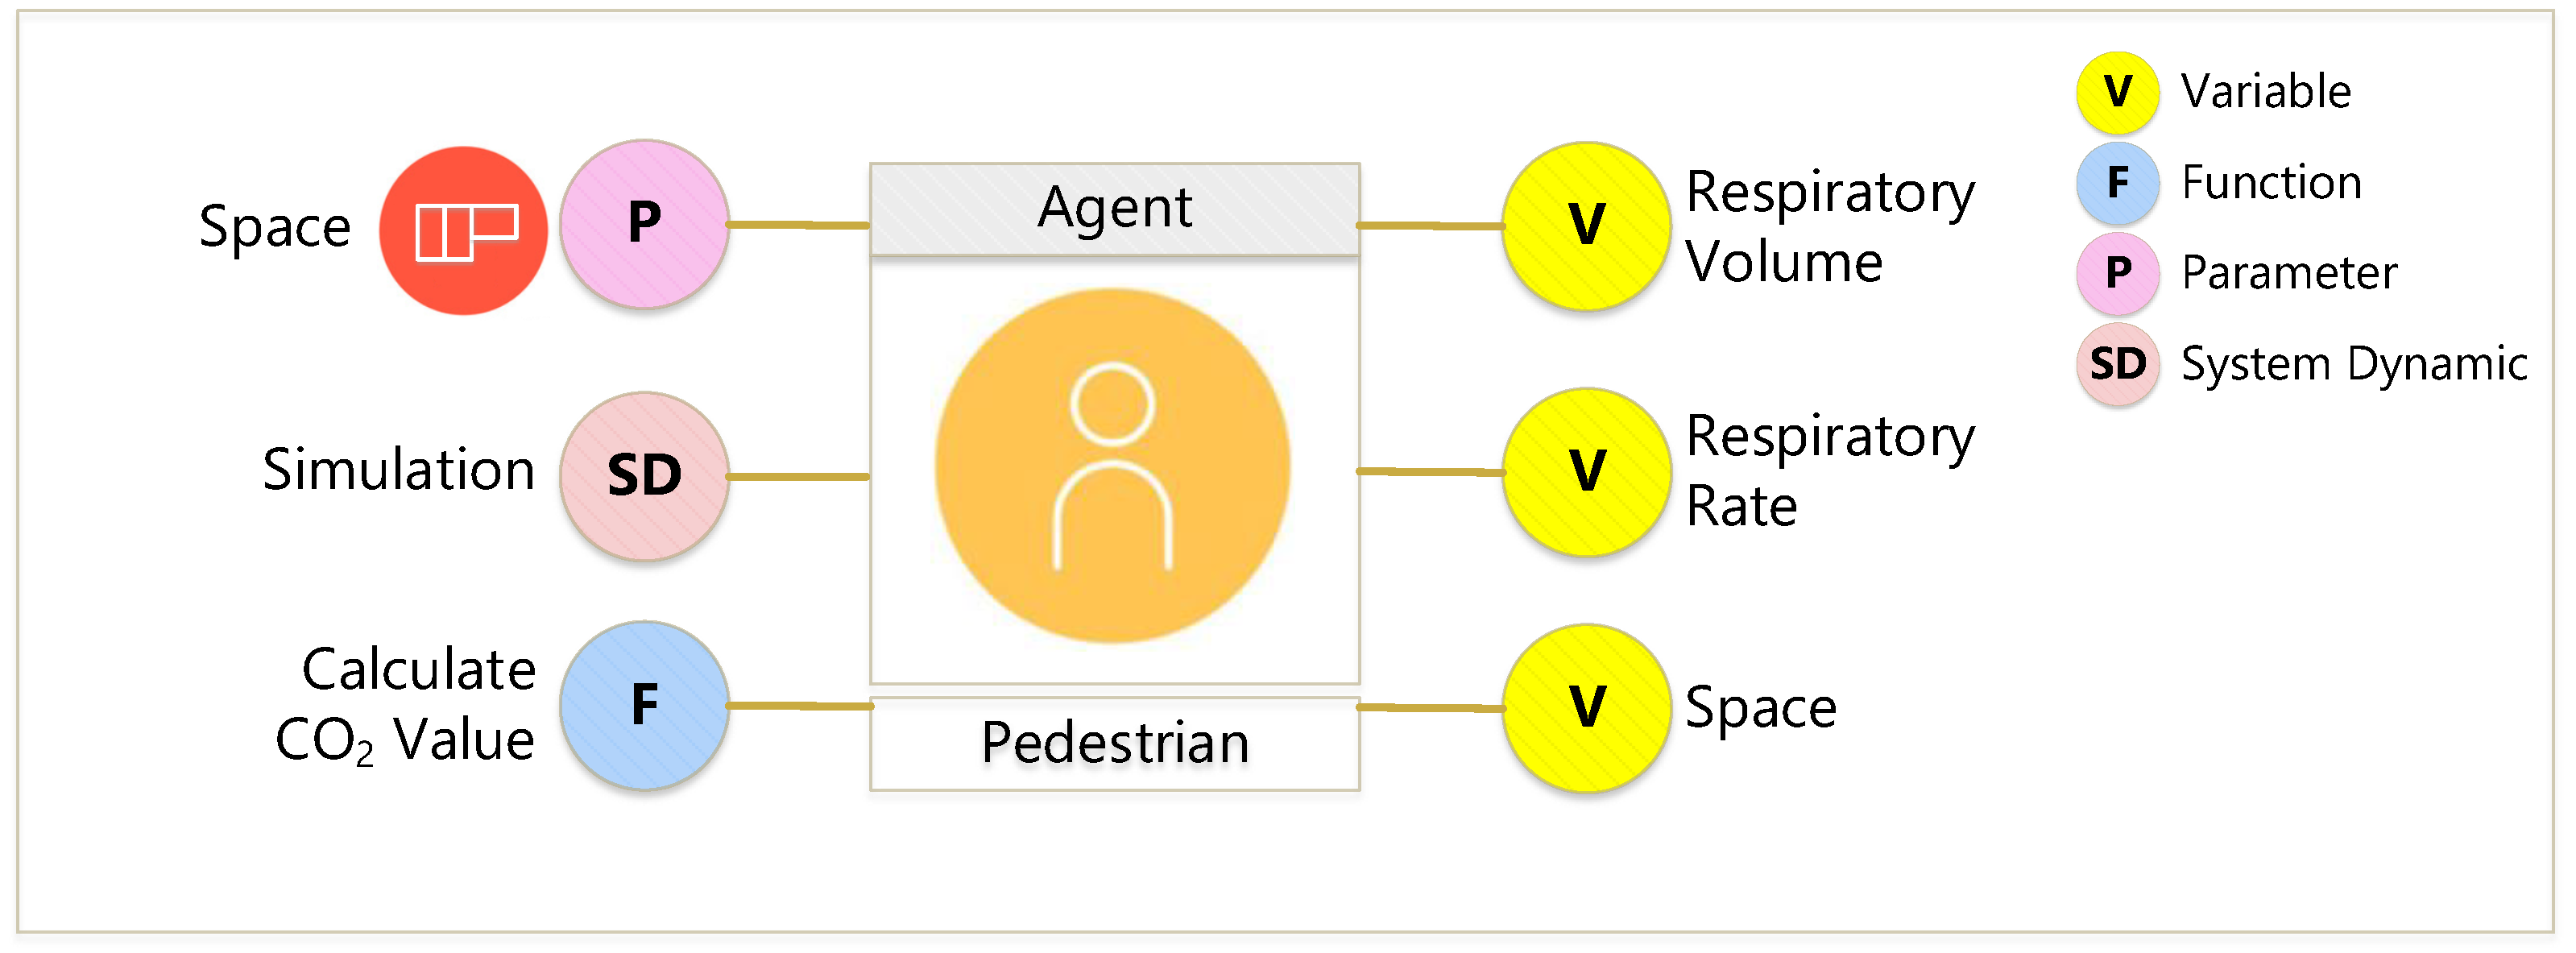
Air quality is one of the main factors affecting the space environment. A concentration of carbon dioxide of 1000 ppm or higher in an indoor environment will cause dizziness and tiredness in people and affect their work mood. If the content of carbon dioxide is too high, it will harm the human body, causing hypoxia, numbness in the hands and feet, and loss of consciousness, or even difficulty in breathing, coma, and possibly suffocation. Therefore, this study considers air quality for space service quality and uses the concentration of carbon dioxide as the main simulation subject. To calculate the carbon dioxide equivalent produced by each passenger every minute during the simulation, the amount of air inhaled in each breath, the number of breaths, the amount of ventilation per minute per person, and the space area are set as variables in this study. Based on the simulation time for the method, the carbon dioxide content exhaled per minute per person can be calculated as shown in Equation (3).
where
: The concentration of carbon dioxide produced per person per minute
: Number of breaths per minute
: Volume of each breath
: The proportion of carbon dioxide in the air
Since the space has been set to the agent type, the spatial parameter can be set in the pedestrian agent through a variable reference for the calculation. Owing to the movement of air and passengers, there is no fixed result, and it is necessary to focus on the causal feedback relationship between the overall simulation process and a large number of variables. To understand the mutual influence of the movement of people on the carbon dioxide level in each space, from the perspective of system dynamics, the passengers in the simulation process are considered to have a pure level initially, which can be accumulated or reduced as time goes. During the simulation, through the interactive relationship between carbon dioxide level and passenger behavior, the feedback of the information obtained from the interaction results in the change of the carbon dioxide volume and the behavior of the impact rate.
In the planning process of the carbon dioxide model, we must first understand the setting parameters of the carbon dioxide air exchange required by the pedestrian simulation, as shown in
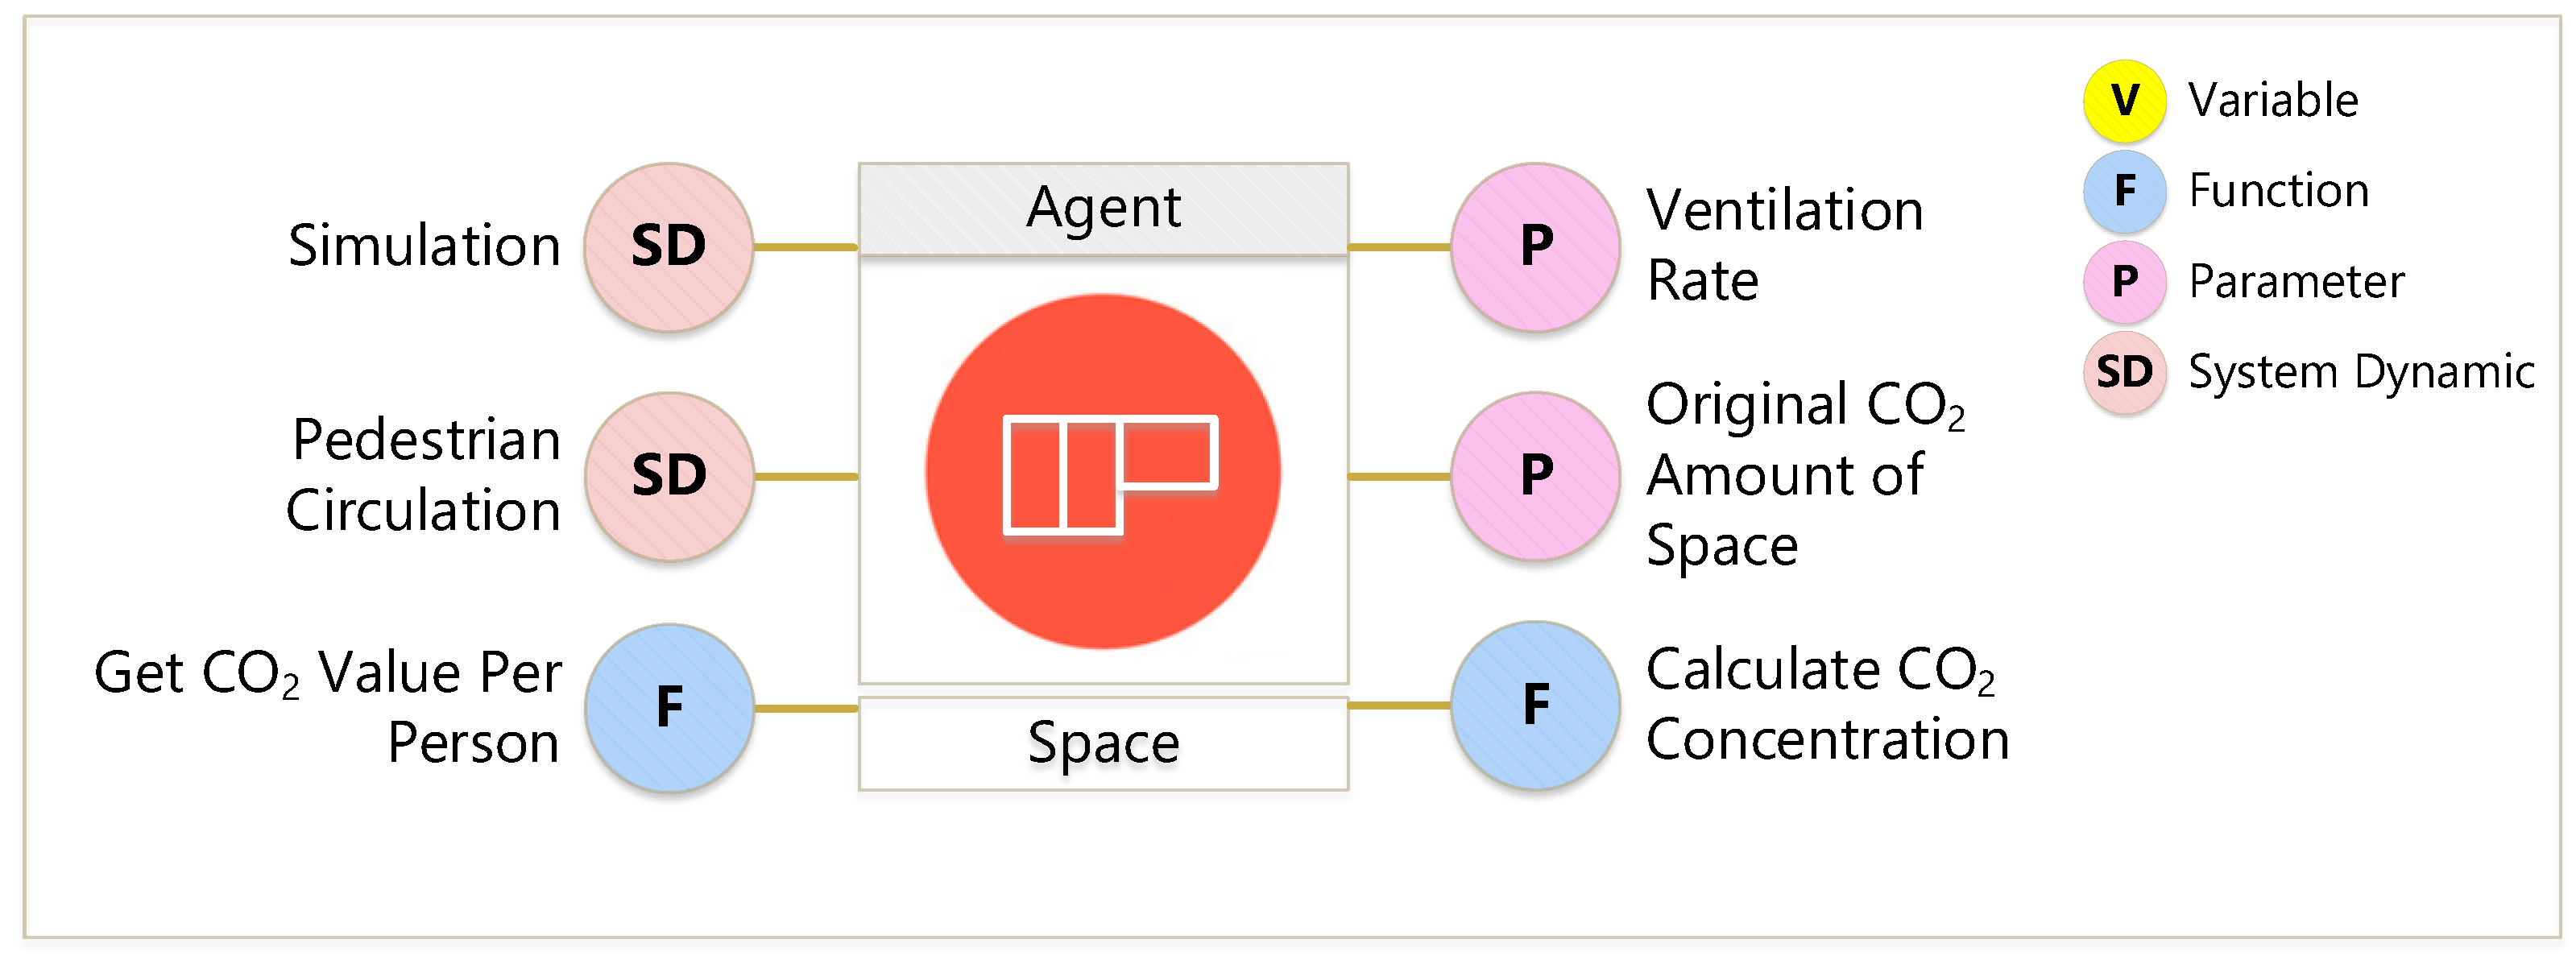
Figure 7. This allows determining the amount of carbon dioxide generated by each passenger in the space. Next, the passengers are randomly generated in the space, and the carbon dioxide emissions are continuously calculated. The emissions are then fed back to the space agent to calculate the overall carbon dioxide concentration. In addition to the carbon dioxide produced by passengers, each space has the original carbon dioxide value generated by environmental equipment, this must also be included in the calculation. Furthermore, considering the poor ventilation environment of an MRT station, most of the air conditioning systems use forced ventilation to improve space ventilation efficiency. Therefore, this study also takes into account the ventilation rate to obtain the total value of carbon dioxide concentration accumulated in the space, as shown in
Figure 8. The space will have reduced air quality due to the increase in the number of passengers. Therefore, the number of passengers in each space is obtained through simulation, and the current carbon dioxide concentration in each space is calculated with the carbon dioxide equation given by Equation (4).
where
: Carbon dioxide concentration in the space
n: Number of persons in the space
: The amount of carbon dioxide exhaled by each person
: Original CO2 content in the space (ppm)
: Ventilation Rate (ppm/minute)
: Time (minute)
4.4. Space Service Quality Measurement
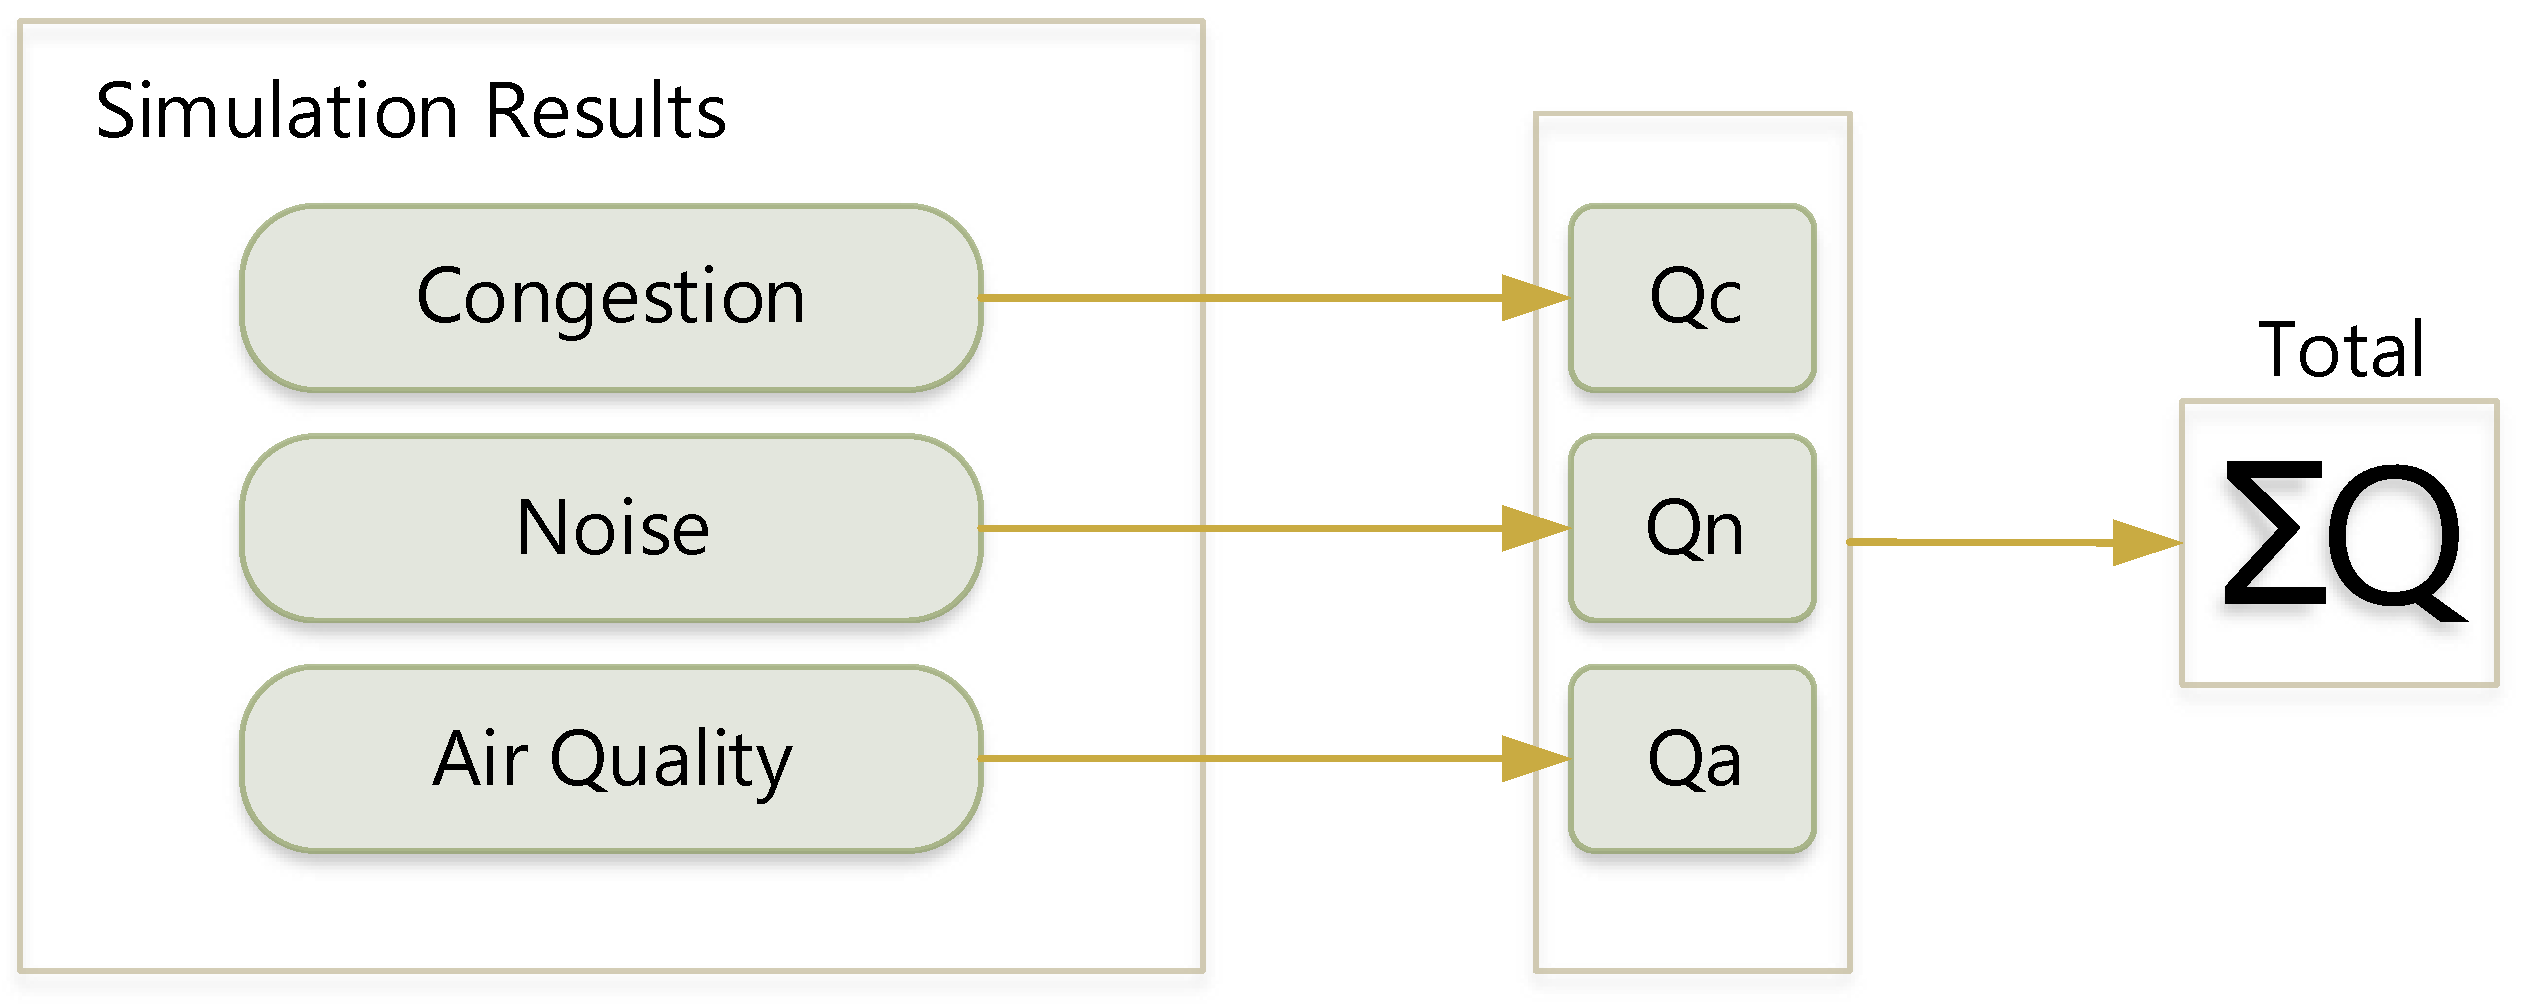
In addition to congestion, noise and air quality are important factors influencing the evaluation of space service quality. Overcrowding will lead to greater noise and air pollution. These three factors are simulated separately in this research, and the results are combined to derive the final score for overall space quality.
Table 1 indicates the influence score (Qc) for congestion conditions [
28]. In the color schema, blue corresponds to a score of 1, indicating a sparse density of less than 0.31 persons/m
2, the non-congested condition of 0.32–0.72 persons/m
2 is represented by green, corresponding to a score of 2. A score of 3 denotes a normal condition of 0.72–1.08 persons/m
2, shown in yellow. Orange corresponds to a score of 4, representing a slightly congested condition with 1.09–2.5 person/m
2, and red, with the highest score of 5, means a highly congested condition with a distribution of greater than 2.5 persons/m
2.
When passengers enter the space, the system will calculate the sound of one person, and the result will be used to analyze the effect of the entry of agents on the noise level. This system refers to a WHO research report [
29] in defining the influence scores (Qn) for the noise levels and effects as shown in
Table 2. The noise of less than 40 dB is scored 0, while the noise of more than 120 dB is scored 5. The effect of noise on space service quality is measured as such.
The system based on the ASHRAE standard [
30] defines five levels corresponding to different colors and scores, as shown in
Table 3. “Good” is scored 1 point and represented by green, “unhealthy” is scored 3 points and represented by red, “hazardous” is scored 5 and represented by brown. A higher score implies lower quality.
This method of space service quality measurement is illustrated in
Figure 9. The highest score for the overall space service quality is 15. A higher score indicates poorer space service quality. The scores are provided to relevant parties for modification and adjustment to achieve high-quality planning of space service.
5. Demonstration
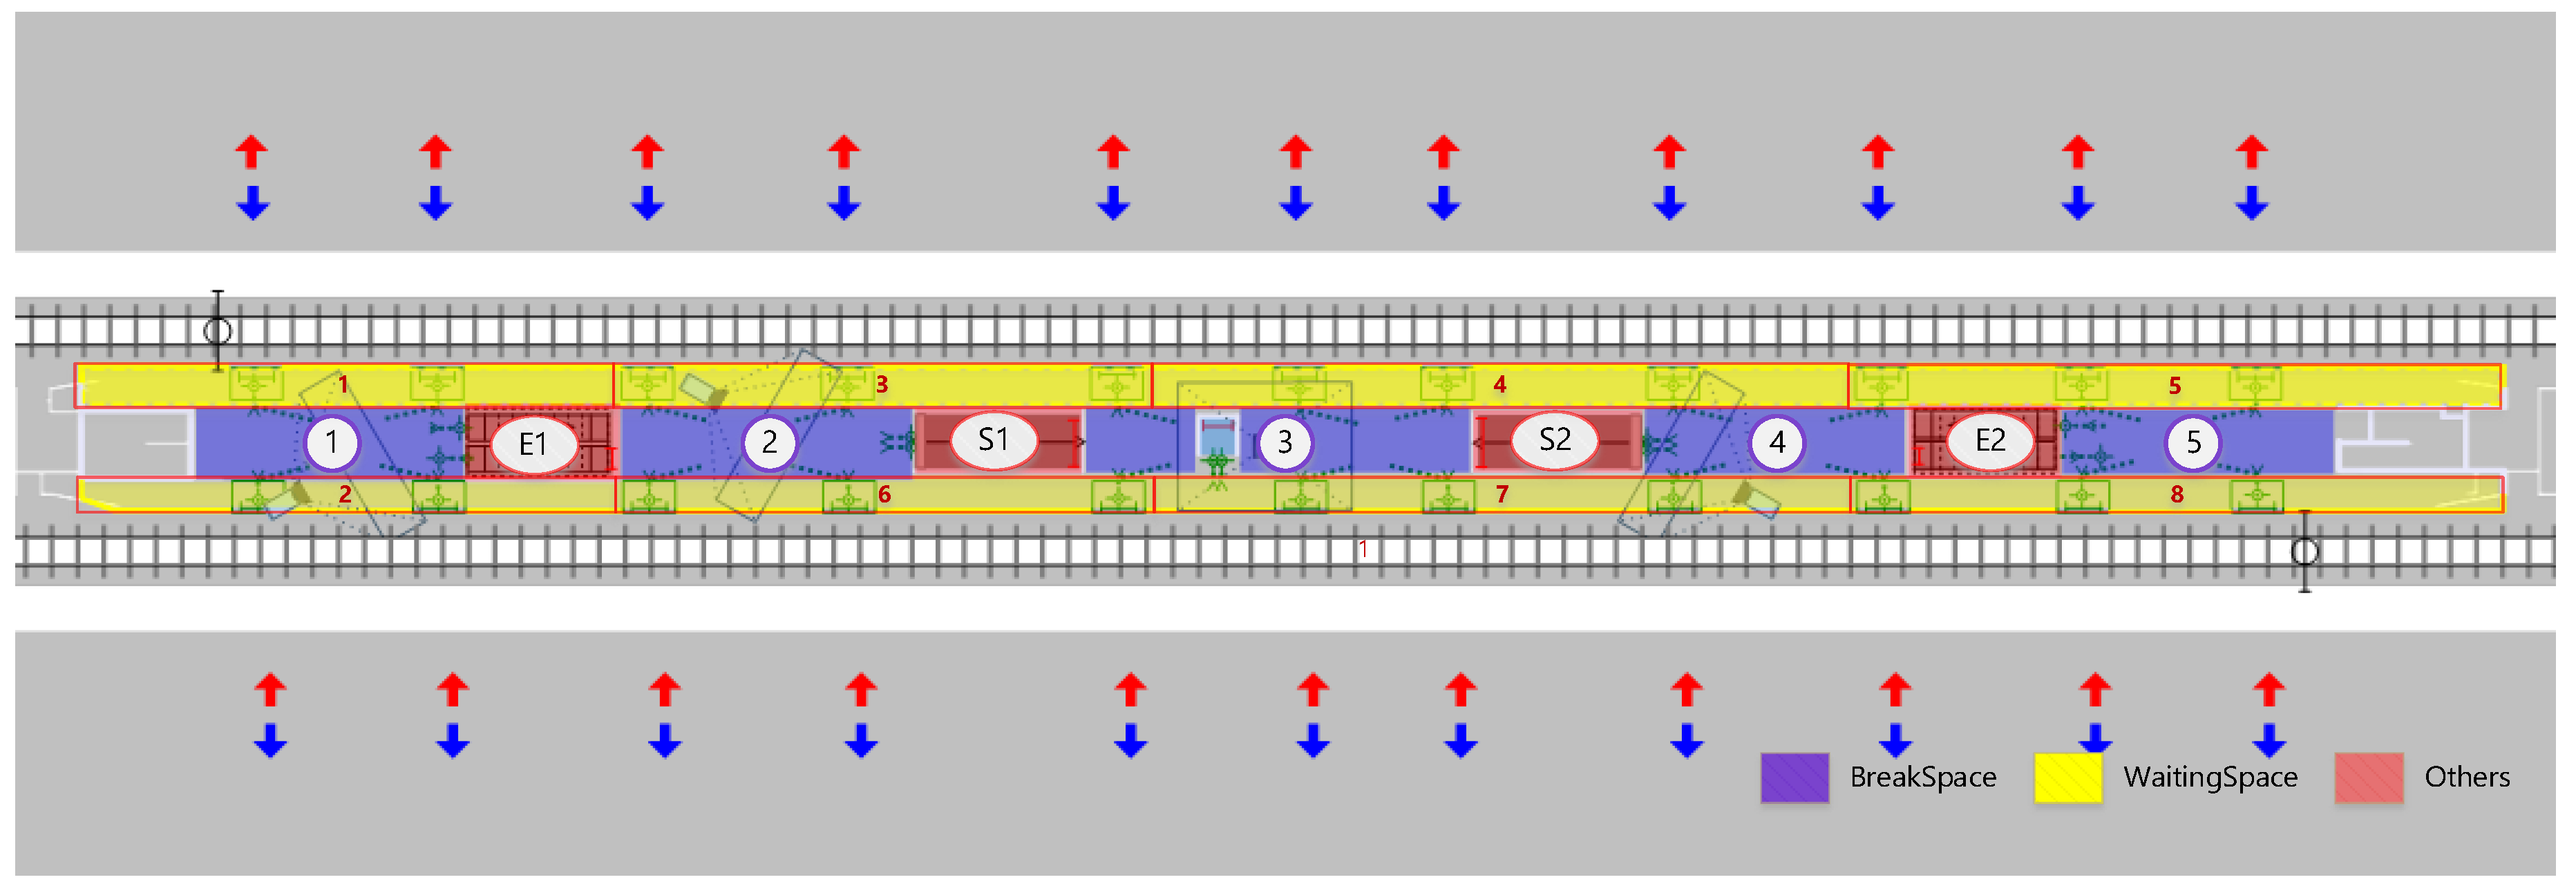
In this study, 3800 people are imported into the simulation system to represent the peak traffic time of the Daan Park metro station, and the possible scenarios are set. For example, considering passengers entering and exiting the station at entrances, cashing out, purchasing tickets, checking tickets, boarding the trains, and even moving from location to location allows for more realism in the simulation, thus enabling potential problems and difficulties to be evaluated and observed. This allows management and decision-makers to produce more accurate judgments and analysis before the actual implementation. Before setting the congestion state, the space configuration and planning must be completed, the pedestrian agent process and logic settings must be completed, and the corresponding train agent and boarding behavior agent must be set to understand the state of congestion in the simulation. The space configuration planning status, such as the platform level in this study, is divided into pedestrian agent needs and train agent needs, in which track area, waiting area, and other area configurations and planning are completed, as shown in
Figure 10 and
Figure 11.
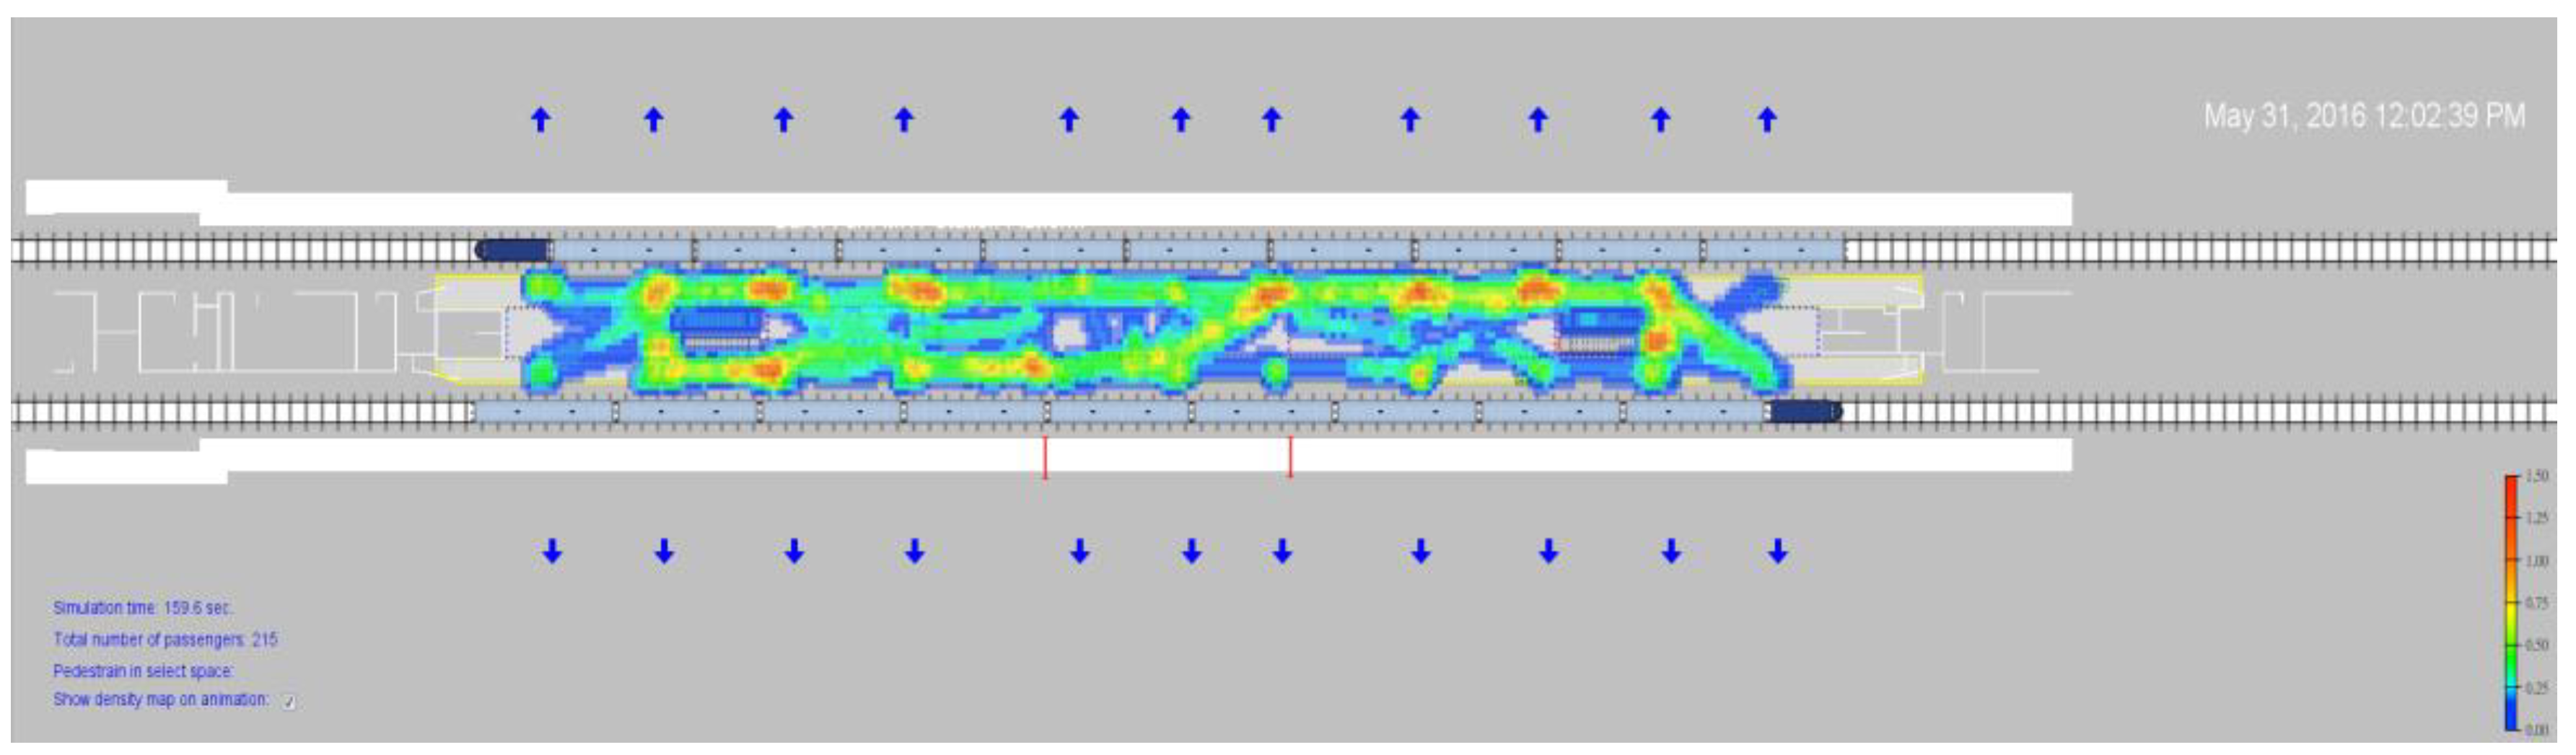
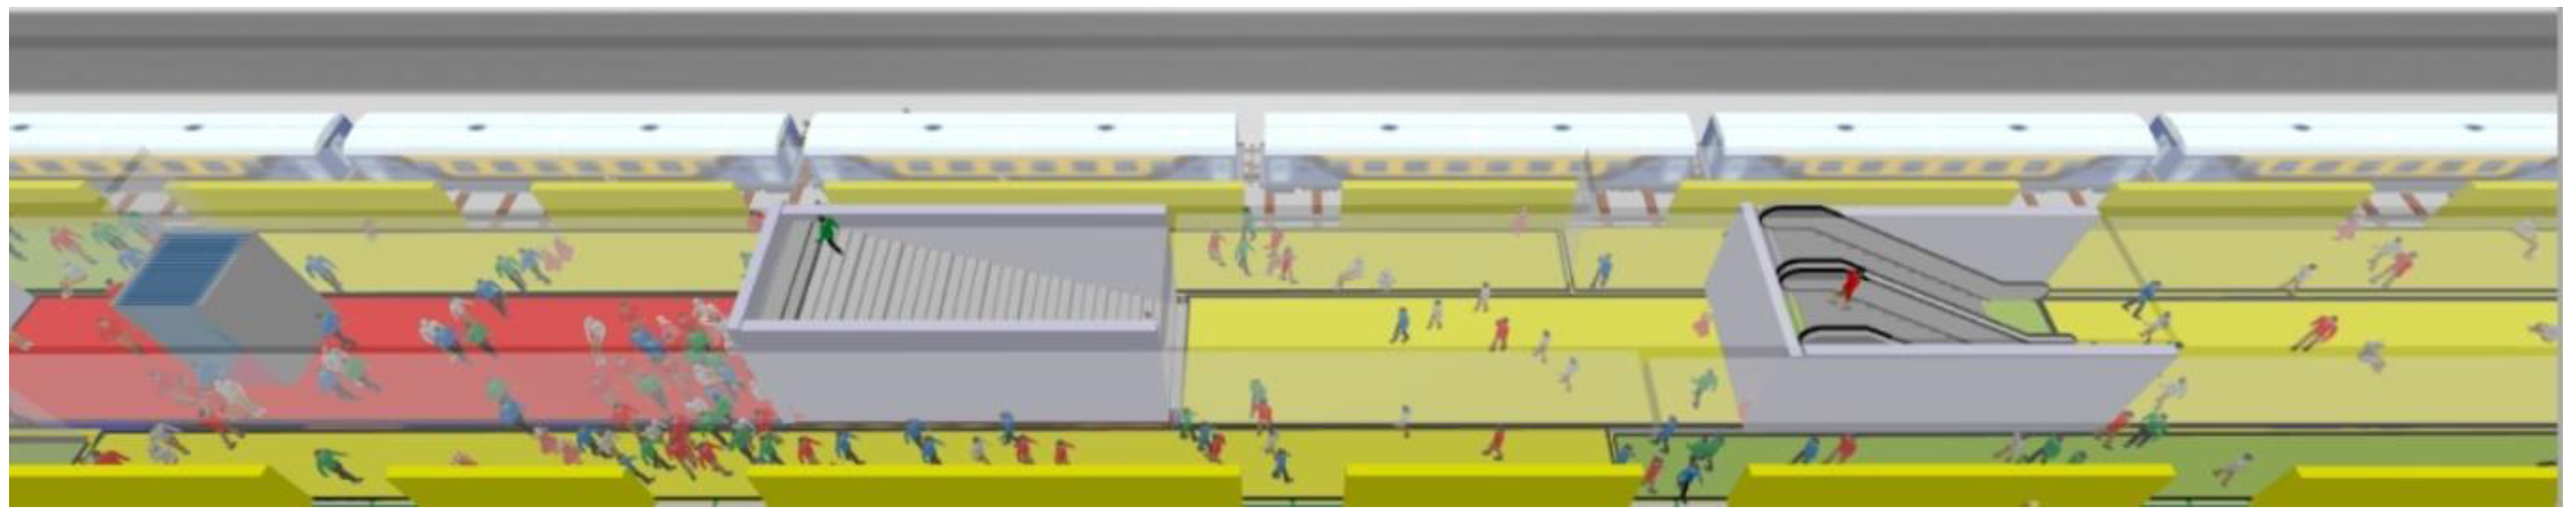
This study presents all the data in the main editor of the software system after the space, passengers, trains, and congestion density are set. One of the simulation results is shown in
Figure 12. This system simulates different floor spaces separately. The simulation results of the Hallway indicate that the ATM location, ticket machine location, entrance and exit locations, and changes in pedestrian circulation greatly affect the degree of space usage. In addition, the circulation chaos caused by the device locations increases the level of crowding in the space. Moreover, the sizes of the entrances and exits are a factor in congestion. If the equipment locations were set according to the circulation requirements, the practical function and quality of the space of this MRT station would be greatly improved.
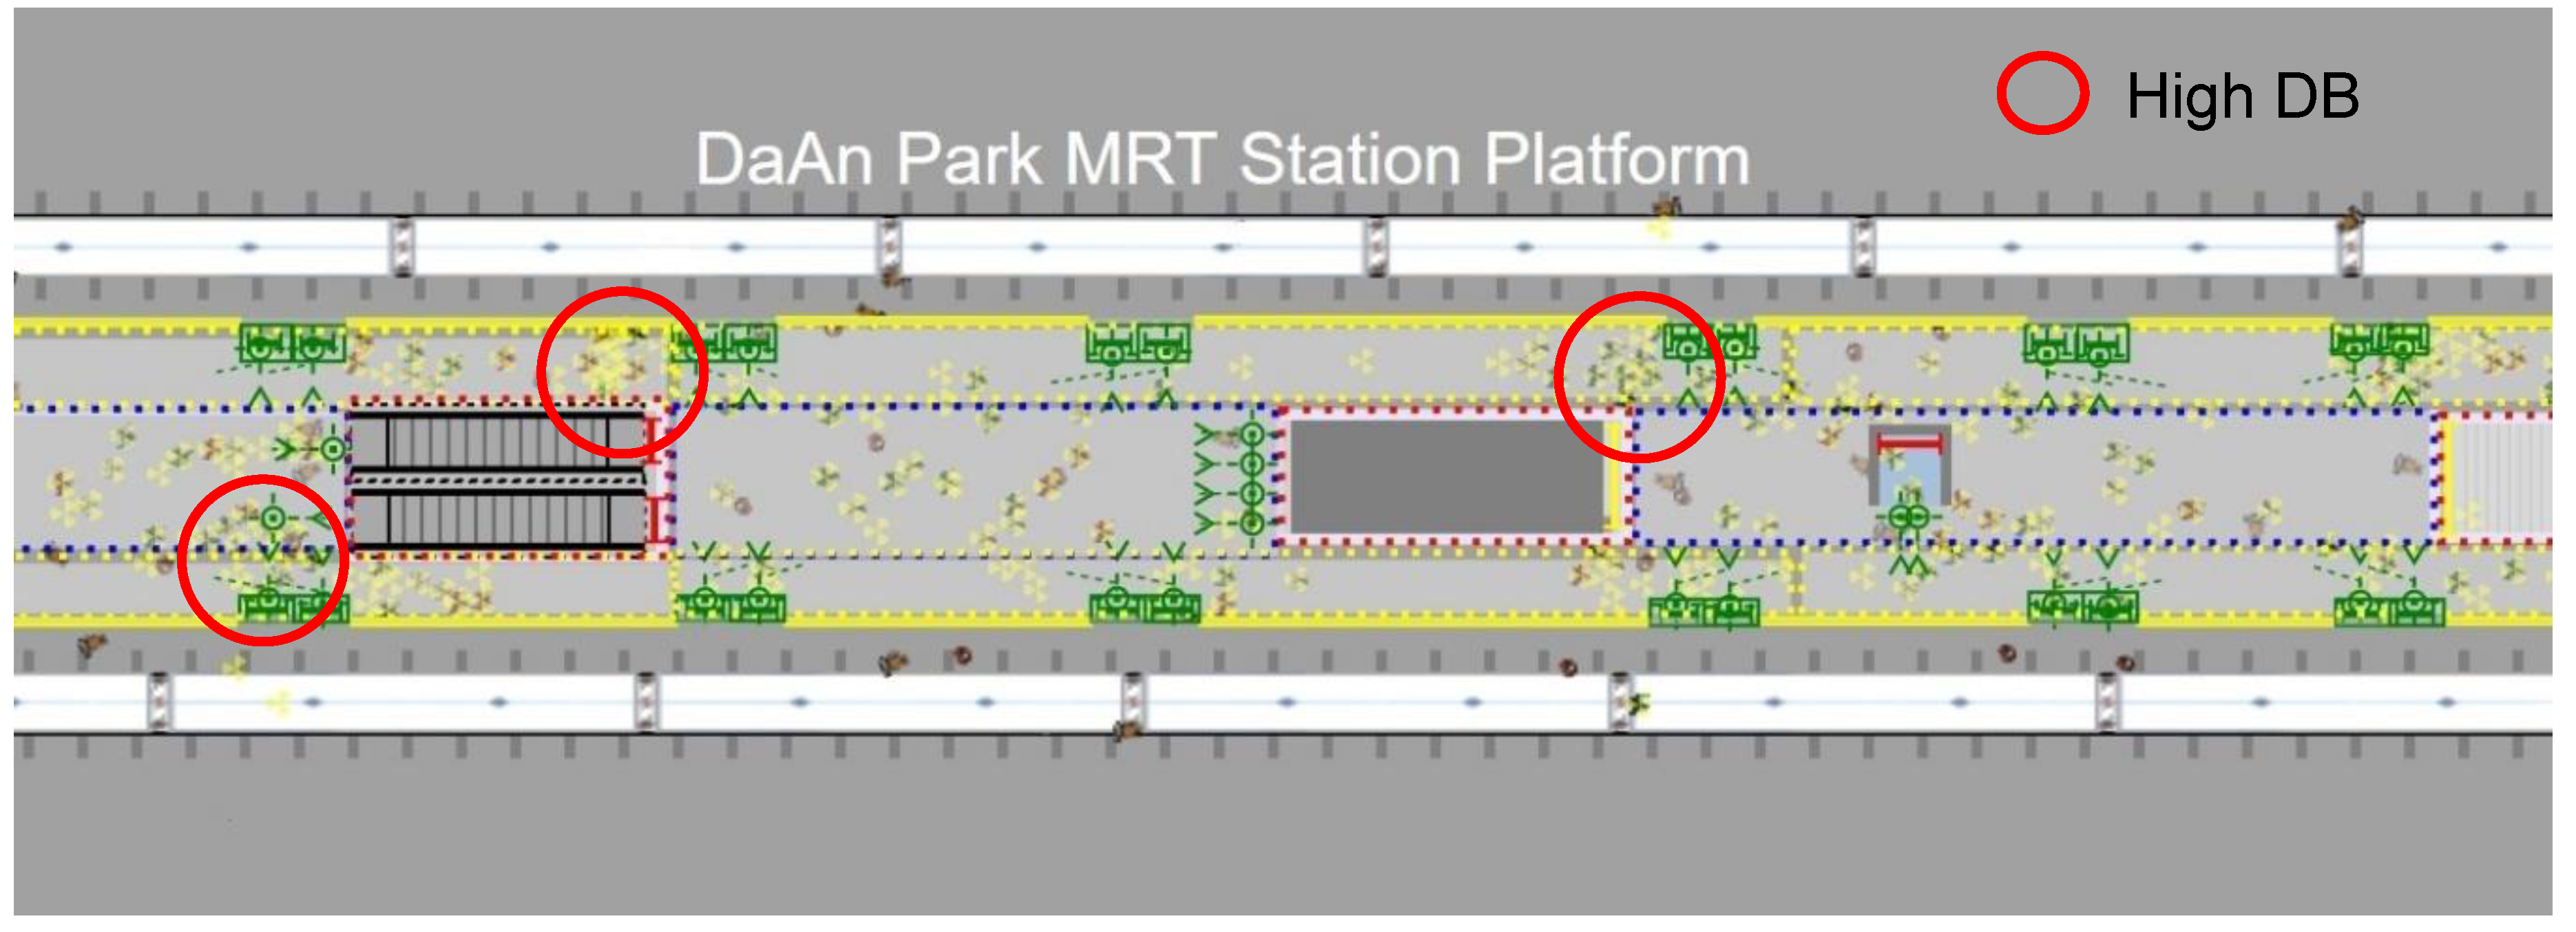
In terms of noise, this study adds sound factors to the pedestrian agent’s self-behavior, so the passengers themselves have sound parameters. There are different volume levels according to different parameters of the sound, and the range of influence of the sound will vary according to the decibel level. During the simulation, you can clearly see the decibel presentation status issued by each person, and the influence range of the agent’s own noise will be visualized in the simulation, as shown in
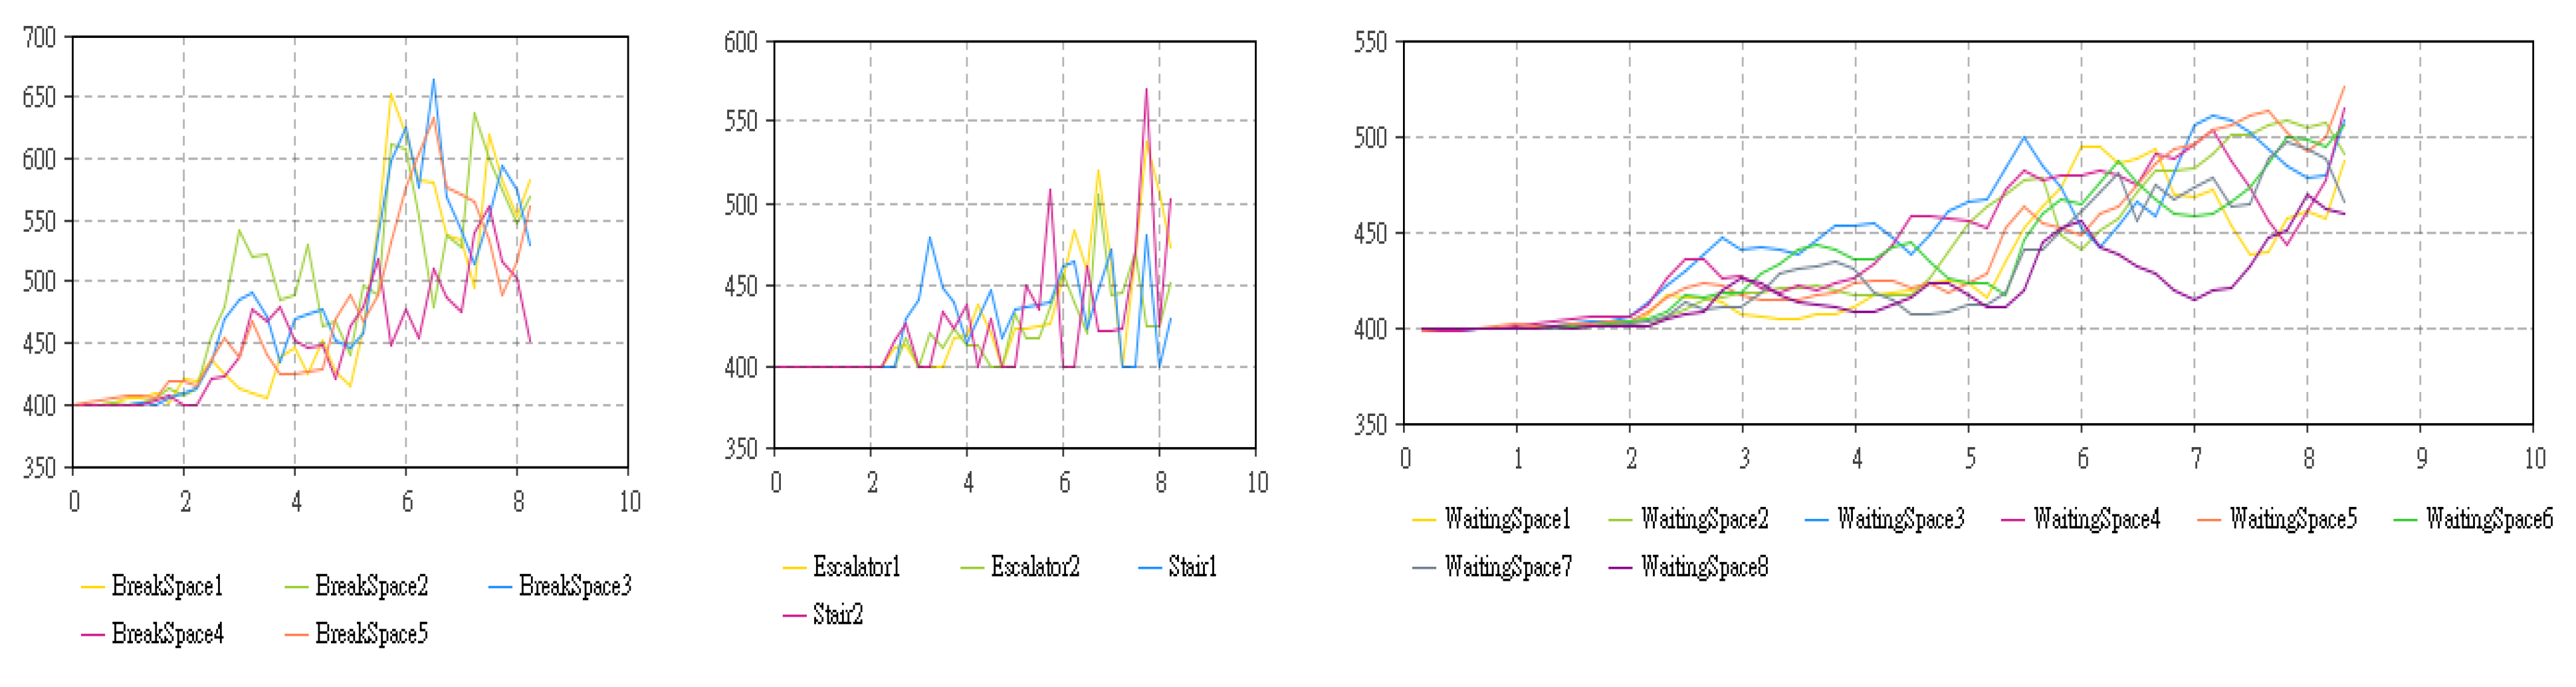
Figure 13. In reality, the passengers have a multiplying relationship with the sounds in the space. Therefore, in this study, the total number of people in the space is simulated, and then the total sound pressure value is calculated for all decibel values; the simulation results of each space are obtained through Equation (2) and are shown in
Figure 14. The results clearly indicate the locations and distributions of places where the noise gathers.
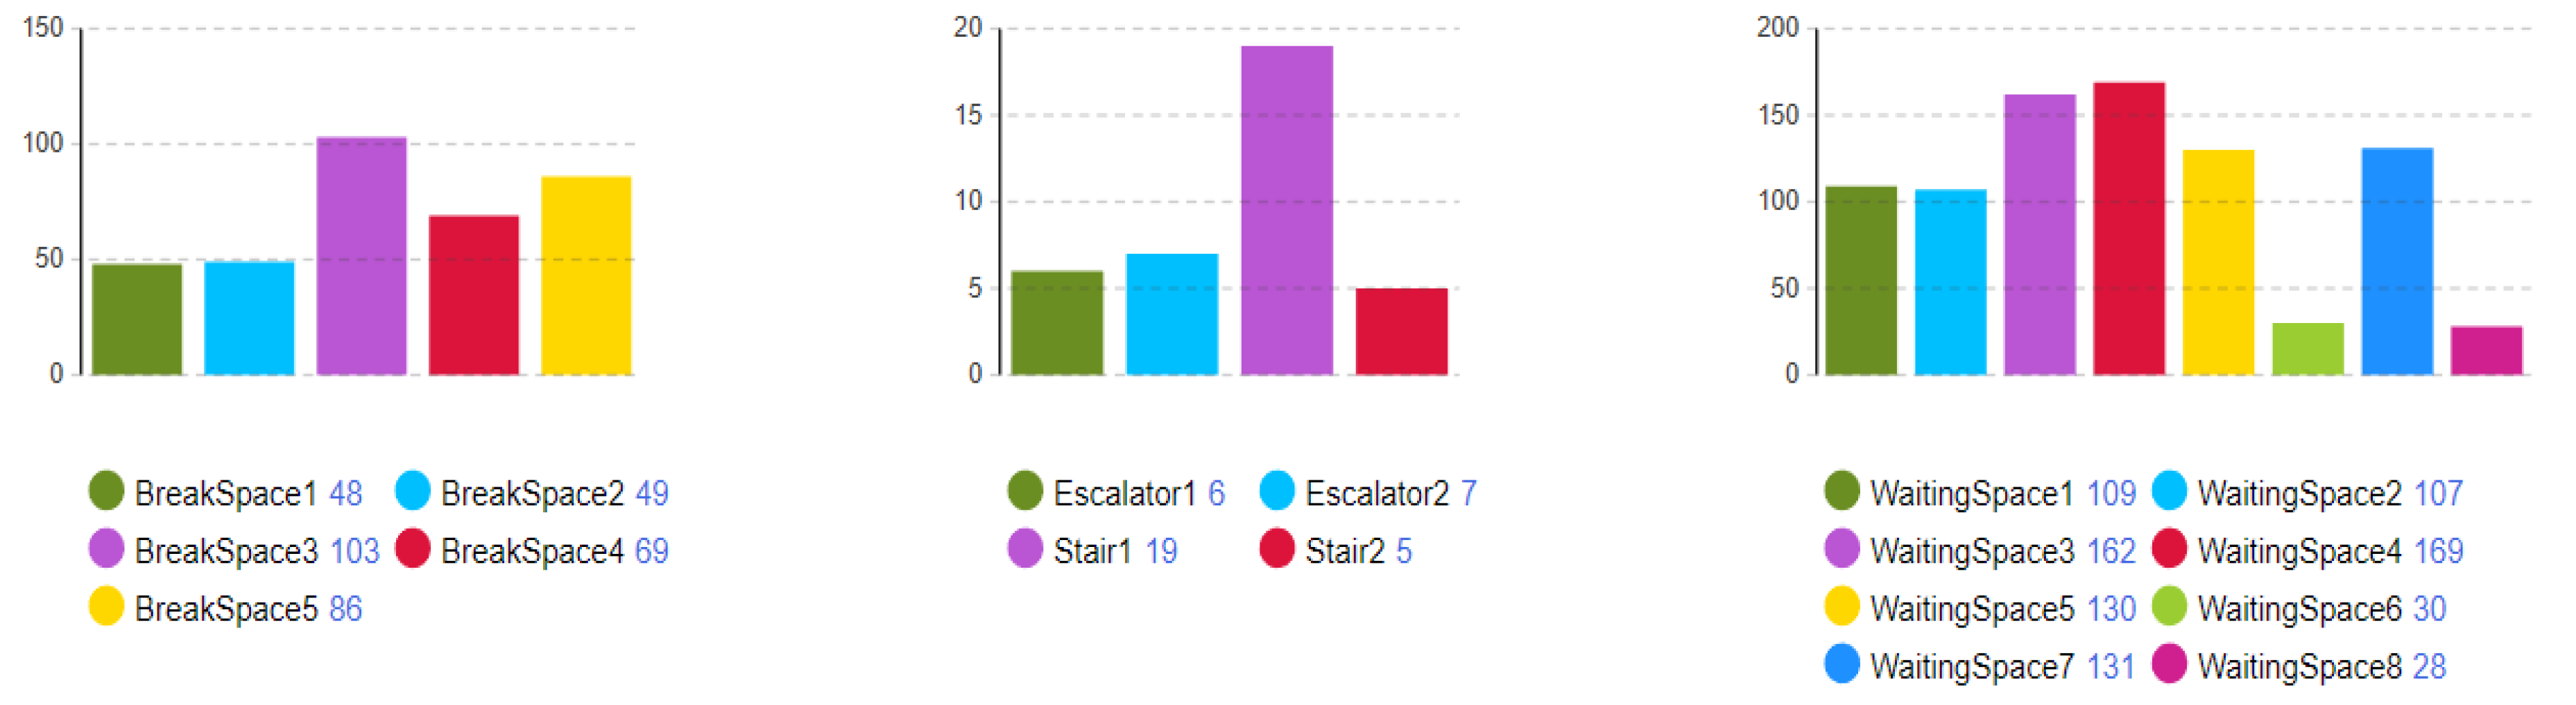
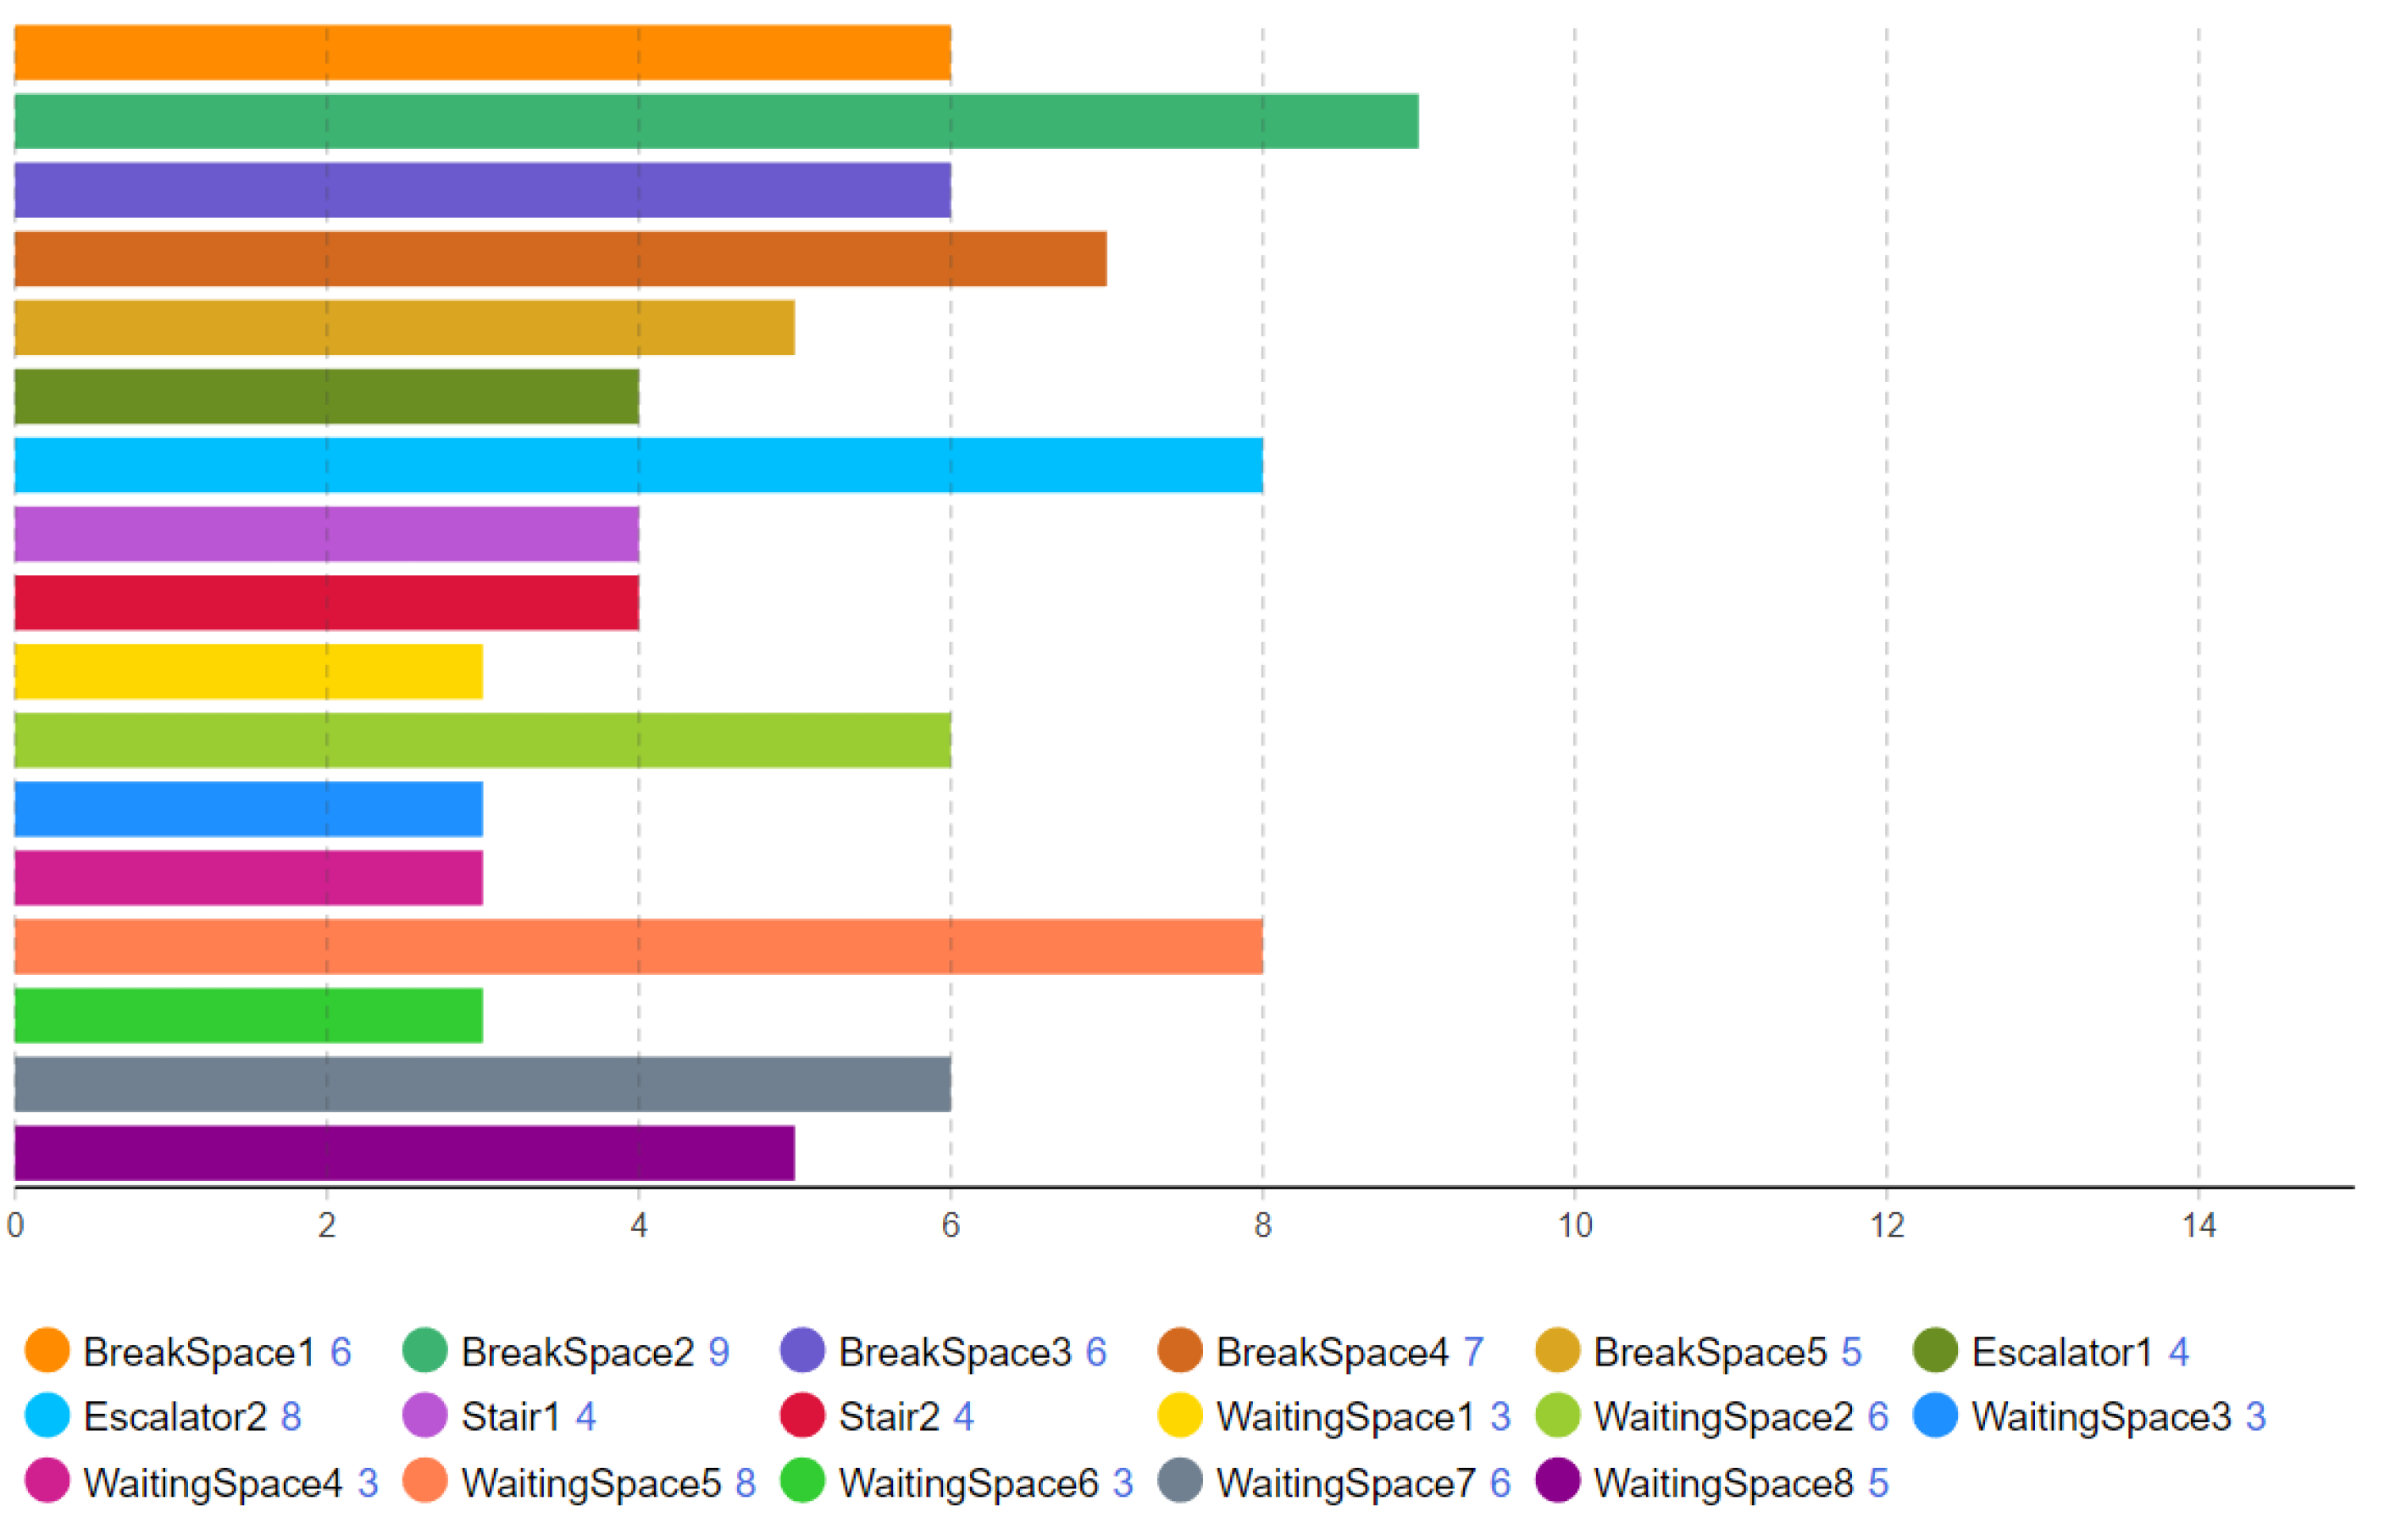
The system also calculates the decibel level of each space after the simulation is performed and presents the calculation results in the form of a bar chart, as shown in
Figure 15. These results provide managers with an understanding of how the decibel levels change in the spaces in the simulation.
To simulate the space air service quality, the space is set as an agent type, and the carbon dioxide concentration is used. According to the above-mentioned parameters and settings required for the simulation of the congestion state and the setting for the carbon dioxide in the air, including carbon dioxide concentration, space area, number of people, etc., the air quality-related parameters are connected through the space environment agent. The number of passengers in each space during the simulation is obtained, and the current carbon dioxide concentration in each space is calculated according to Equation (4). During the simulation, the user can mouse-click any space to select it and obtain the current number of users in the space and the current carbon dioxide concentration. The actual simulation results are shown in
Figure 16.
In the system in this study, the impact of an agent’s carbon dioxide emissions caused when the agent enters each space during the simulation process is presented through a line graph, as shown in
Figure 17. The system calculates the data changes every 15 s for planners to understand the current status of the space visually; the data vary for different time periods and simulation times. Users can understand the changes in carbon dioxide concentrations from the data recorded in this graph and then return to the model to understand the relationship between the state of the space and the change in air quality. This enables planning personnel to change the design as well as the circulation needs.
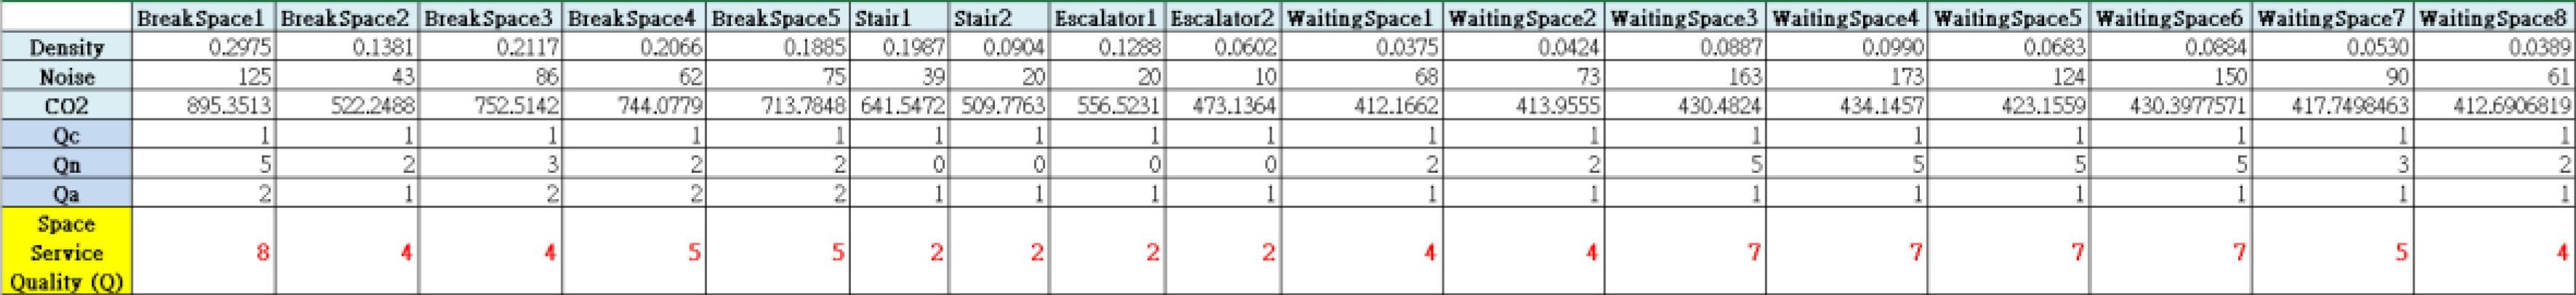
The highest overall space service quality score is 15, based on the congestion state score of
Table 1, the noise and decibel impact state evaluation of
Table 2, and the carbon dioxide concentration evaluation score of
Table 3. The three evaluation scores are summed for the overall score, with higher scores indicating lower space service quality. This study uses statistical bar graphs for the scores obtained for each space, as shown in
Figure 18. Then it provides relevant units for modification and adjustments to achieve high-quality space service planning.
The system can also export the relevant information service quality measurement results of each space to an Excel spreadsheet, which can be used by subsequent personnel in related fields for decision-making, as shown in
Figure 19.
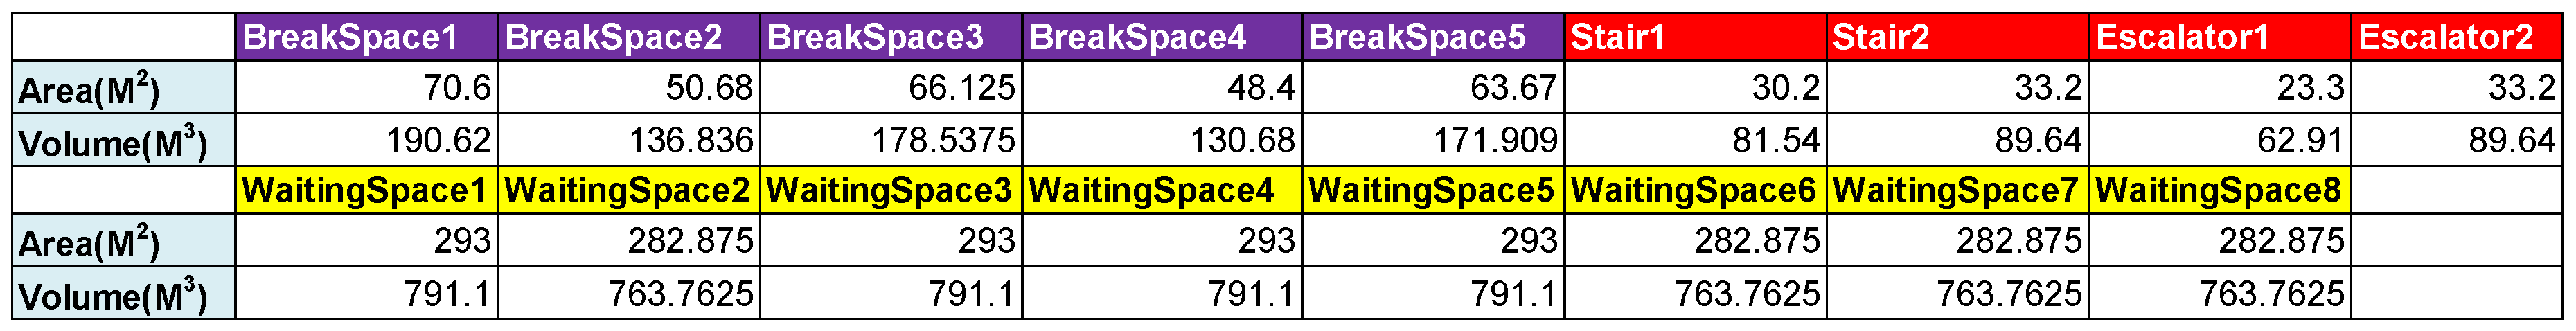
When space planners or decision-makers receive the information, they can accordingly adjust or change spaces with low service quality. For example, BreakSpace2, which has a space service quality score of 9, originally has an area is 50.68 m2. If its area is increased to 75 m2, the original settings of passenger flow, noise, and carbon dioxide settings will still affect the parameter values for simulation after the modified model is imported. In larger spaces, more people can be accommodated. This implies that the noise and carbon dioxide concentration will be relatively increased, but the overall service quality score after the simulation will be significantly reduced to 4 due to changes in space conditions affecting pedestrians’ circulation, which in turn affects the adjacent space quality score.
6. Conclusions
To study the current space usage, this research used Daan Park Station as a case study to simulate streams of people entering and exiting the station from trains or from the outside. It also proposed combining building information modeling technology and an agent-based model to simulate the interaction of agents in the space. A study of the published literature revealed that, in addition to space planning and route interruptions, factors that can lead to a low quality of space service include noise and air quality. Therefore, this research set these factors as agents, including passengers, space, noise, and air quality. The results on space service quality were presented in 2D and 3D visualizations. Possible scenarios were visualized to provide solutions for the space design of an MRT station and route planning. Different colors were used to show and distinguish the space usage so as to provide decision-makers with a better understanding of the actual space usage and service quality at MRT stations through visual presentation. Simple equations were used to combine simulation results for the derivation of the space service quality score.
In the present study, the three influencing factors were simulated comprehensively. We expect to integrate various relevant factors and provide various infographics and dashboards in the future to present results that bear a better resemblance to reality. Good visualization results will be used as a bridge to facilitate communication with other relevant parties so that planning personnel can make space adjustments and other modifications. We would also like to provide these results as feedback for the space designs of MRT stations and routes and the analysis of alternative options with the aim of reducing the labor and costs associated with design variations.


