Abstract
Flooding events can produce significant disturbances in underground transport systems within urban areas and lead to economic and technical consequences, which can be worsened by variations in the occurrence of climate extremes. Within the framework of the European project RESCCUE (RESilience to cope with Climate Change in Urban arEas—a multi-sectorial approach focusing on water), climate projections for the city of Barcelona manifest meaningful increases in maximum rainfall intensities for the 2100 horizon. A better comprehension of these impacts and their conditions is consequently needed. A hydrodynamic modelling process was carried out on Barcelona Metro Line 3, as it was identified as vulnerable to pluvial flooding events. The Metro line and all its components are simulated in the urban drainage models as a system of computational link and nodes reproducing the main physical characteristics like slopes and cross-sections when embedded in the current 1D/2D hydrodynamic model of Barcelona used in the project RESCCUE. This study presents a risk analysis focused on ensuring transport service continuity in flood events. The results reveal that two of the 26 stations on Metro Line 3 are exposed to a high risk of flooding in current rainfall conditions, and 11 of the 26 stations on Metro Line 3 are exposed to a high risk of flooding in future rainfall conditions for a 20-year return period event, which affects Metro service in terms of increased risk. This research gives insights for stakeholders and policymakers to enhance urban flood risk management, as a reasonable approach to tackle this issue for Metro systems worldwide. This study provides a baseline for assessing potential flood outcomes in Metro systems and can be used to evaluate adaptation measures’ effectiveness.
1. Introduction
Current trends in the analysis of climate-driven events on urban societies, infrastructures, and services have guided study towards the direct and indirect impacts of these events, resulting in disruptions within the interdependent infrastructure systems. These studies draw our awareness to the importance of analyzing the impacts generated by extreme events, such as heavy rainfall, flooding, storm surge, and other extreme natural phenomena which severely compromise city services. This introduction presents the importance of assessing Metro systems’ flooding impacts, pointing to the research gap on this topic and supporting the motivations leading this study.
Climate change represents a severe threat to cities and their resilience, which are complex systems characterized by constant flow and are the result of a lot of dynamic variables that change in space and time [1,2]. As discussed by Wan et al. [3], transportation resilience can be described as the capacity of a transportation system to "absorb disturbances," sustaining its fundamental structure and purpose, plus recovering to an expected service level following occurring disruptions. As an initial action for a risk/resilience appraisal [4], a potential hazard for urban resilience is the occurrence of flooding events which might impact the continuity of Metro services. Metro systems, as one strategic transport service on urban areas, represent one key variable for assessing resilience in the context of physical infrastructure used by citizens. Decreasing the risks that may affect the continuity of the Metro service, therefore, will increase resilience at the municipal level [5]. Although there are a variety of words for underground transport railway systems (e.g., subway, underground, or tube), this paper will use the term "Metro systems" when referring to them.
Metro systems’ importance worldwide for cities’ operability is evident. According to 2018 figures [6], 178 cities in 56 countries have a Metro transportation system, with an average ridership of 168 million per day, and increasing annual use of 19.5%. Figure 1 presents the currently in-service number of Metro systems in Europe. Between China, India, and Iran, Asia is building 16 new systems, shaping the decarbonizing urban transport effort as a response to climate change [6].
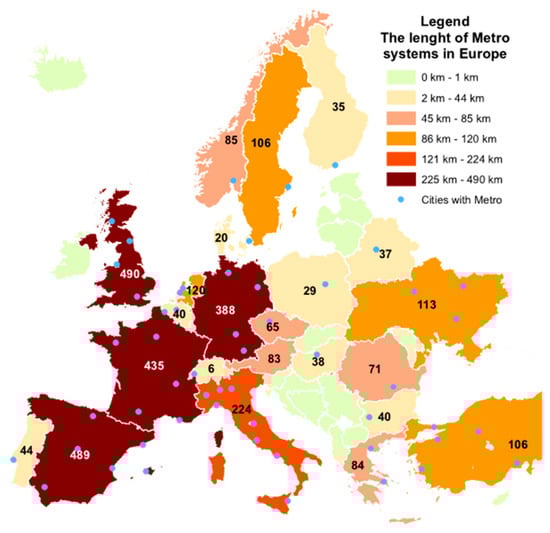
Figure 1.
Metro systems in operation in Europe by 2019 [6].
Following the accelerated growth of cities and their Metro systems, and the increasing growth and complexity of Metro networks, the ability to study and improve the vulnerability of systems are more complex, according to the heterogeneity of the different components of a large scale system, such as a transport network [7]. The probability of disruptions should consider many factors, not only the number of affected Metro stations, but also the distance between them [8], along with several other factors.
Considering hazards that Metro systems face worldwide, there is a notable lack of research on water-related hazards [5], including those related to flooding events and their impact on Metro systems’ resilience [9]. In a context of climate change, flooding events can produce increasing significant socioeconomic risks in urban areas. Worse still, urbanization heightens the likelihood of water disasters such as floods because development decreases the amounts of permeable surfaces where water can soak into the soil, thereby originating runoff that contributes to flooding. This situation poses a critical risk to Metro systems, which can suffer from diverse types of flooding, such as riverine (fluvial) and rain-related (pluvial) flooding, and tidal surges.
Climate change endangers the Barcelona Metro system when subjected to flooding events. Flood events have caused property damage along with service disruptions, by the inundation of underground infrastructures (e.g., Metro tunnels and facilities) [10,11]. Therefore, it is essential to evaluate flood risks in Metro systems to plan for flood disasters and set mitigation strategies efficiently. Figure 2 illustrates how Metro flooding events affect both Metro systems’ infrastructure and users, exposing them to collateral effects such as hard falls due to the loss of stability of passengers crossing through water flow [12,13], material damage, and reduction of service provision due to damage caused to both the users and the companies that administer the systems. These events have gradually increased in recent years due to cities’ growth and climate change [14,15,16].
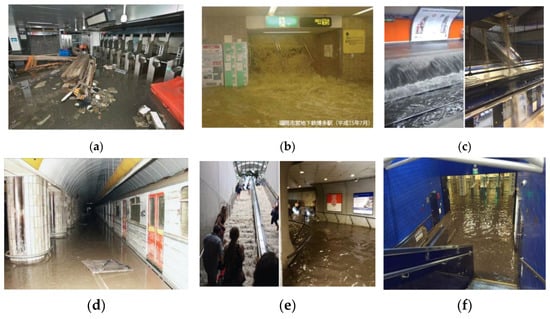
Figure 2.
Flood events in major global Metro systems: (a) New York [17]; (b) Tokyo [18]; (c) Madrid [19]; (d) Prague [20]; (e) Washington [21]; (f) Brussels [22].
The main objective of this research is to analyze Metro stations’ vulnerability facing floods under extreme rainfall events, then, exposing the system to climate change flooding influenced events. Other research approaches focus on ensuring transport service continuity using other public transport modes, responding to Metro system flooding events [23,24,25,26]. In order to address the cited research gaps, this study proposes and analyzes interactions connecting pluvial flood events and the water level thresholds inside Metro station tunnels that might result in service disruption, through a hydrodynamic model including the Metro system. Barcelona Metro Line 3 is the line most vulnerable to flood events due to extreme rainfall, according to TMB (Transports Metropolitans de Barcelona, Barcelona Metropolitan Transport—the leading public transport operator in Barcelona) records. Hence, in this study, the Metro Line 3 is integrated into the 1D/2D hydrodynamic model developed for the entire drainage system of the city of Barcelona within the European project RESCCUE (RESilience to cope with Climate Change in Urban arEas—a multi-sectorial approach focusing on water) [27].
This study proposes a new methodology for a flood risk assessment in an underground Metro system, based on a surface pluvial flooding 1D/2D hydrodynamic modelling and the Metro infrastructure real data. The new flood model, derived from the integration of the infrastructure of Line 3 of the Barcelona Metro with the city's current drainage model, was calibrated based on flood observed from photos and visual inspection by TMB operators. The Metro elements through which floodwater enters into the tunnels (i.e., staircases, ventilation grates, hallways) were simulated based on their simplification, depicting the Metro entrances as pipelines addressing the Metro tunnels and stations, as an approach that can be applied to other case studies.
As a vital component of the flood risk assessment, future scenarios using rainfall projections under the climate change impact were applied. The model calibration aimed at reproducing observed water levels in the studied Metro stations, water levels in various real events were adequately reflected by the model. Also, it was possible to identify the likely effects of climate change on underground flooding by analyzing the effects of future rainfall conditions. Finally, a risk assessment of the Metro station was performed, adaptation strategies were proposed to reduce floods’ impact and to prevent disruptions in Metro service, increasing the resilience of city transportation services.
2. Materials and Methods
This study incorporates Barcelona Metro Line 3 real data into the hydrodynamic 1D/2D model of Barcelona considering the connections among possible water inflows and Metro tunnels and stations and considering them as pipelines. To summarize the overall structure of the model, Figure 3 lists the necessary steps performed for the proposed flood risk assessment.
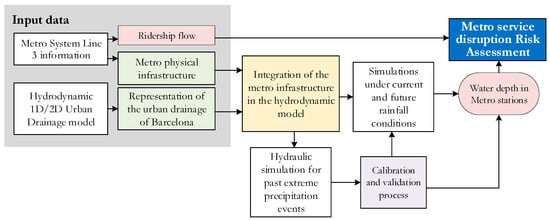
Figure 3.
The overall model structure for flood risk assessment in Metro systems.
This chapter presents a list of the precipitation events in Barcelona that have caused disruptions in the Metro service due to the entry of water into the system, considering both the sources and methods of study, with the hydrodynamic model implementation, the Metro Line 3 data acquisition, and components’ introduction processes to the model. Furthermore, this chapter describes the model calibration and validation process, along with the flood risk assessment under the impact of climate change.
2.1. Historical Data of Metro Systems’ Flood Events in Barcelona
Table 1 summarizes a two-decade historical data of Metro system flood events. Only those events that caused service disruption have been considered. The table was obtained linking Barcelona Metro system records from system administrator TMB, with internet media. Service disruption information is available for request to TMB, due to its confidential nature.

Table 1.
Barcelona Metro service disruptions due to flooding events in the last 20 years.
Table 1 suggests Barcelona Metro flooding events frequency has increased over the last two years, indicating that these events could maintain or increase their frequency or intensity, due to climate change influence on rainfall variations [16]. Barcelona rainfall events frequency and intensity increases, doubling frequency downpours and peak rainfall rates up to 20% higher [41], rainfall intensities rise due to climate change impacts [42].
2.2. Overview of the Hydrodynamic Model
A 1D/2D urban drainage model of the whole municipality of Barcelona was developed, calibrated, and validated using the hydraulic modelling software Innovyze InfoWorks ICM® and local observation data from different rain events. This model is an update of the model used for the Drainage Master Plan of Barcelona of 2006.
A rainfall-runoff model was used to compute the runoff from buildings that were assumed to directly drain into the 1D hydraulic model representing the drainage network. The 2D model was used to reproduce overland flow on streets, parks, and further areas located at terrain elevation that can be flooded. The 1D and the 2D models continuously interact with each other through model nodes that physically represent surface inlets (like gullies or maintenance holes) to the drainage system. At these nodes, the exchange of water between the 1D and the 2D model was computed using different modelling options available in InfoWorks (nodes can be defined as Inlets 2D, 2D, Gullies 2D) that compute water flows as a function of local water levels and inlet geometries.
A peculiarity of this 1D/2D model is that part of the rainfall is directly applied to the streets and parks represented by the 2D overland flow model, and part to the rainfall-runoff model used for buildings, roofs, and elevated areas. Conventional urban drainage modelling approach generally applies rainfall directly to rainfall-runoff models that compute runoff diverting it into the 1D hydraulic model, and flooding can only occur through a maintenance hole surcharge. In Barcelona, it is believed that urban floods are partly caused by deficient surface drainage capacity due to, for instance, a reduced number of street gullies.
This model includes approximately 2164 km of pipes, 67,967 pipes, 66,158 nodes, 18 detention tanks with a total volume of approximately 461,600 m3, 489 weirs, 22 pumps, 47 sluice gates, and 120 outfalls. The full 1D Saint-Venant equations are used to solve the sewer flow. Rainfall-runoff processes were simulated using a single non-linear reservoir model with routing coefficients that are a function of surface roughness, surface area, ground slope, and catchment width. Initial hydrological losses were simulated to be approximately 1 mm (a little higher in pervious areas and lower in impervious ones).
Continuous losses were only applied to pervious areas and were simulated using the Horton model. The 2D model has an unstructured mesh with 662,071 cells created from a Digital Terrain Model (DTM) with a resolution of 2x2 m2 obtained by a special combination of a 3-D scanning and laser scanning (LIDAR) provided by the Cartographic and Geological Institute of Catalonia (with an accuracy of 0.15 m for altitudes). The 2D cells have areas in the range of 5–125 m2 in the urban area and 100–10,000 m2 in the upstream rural areas.
The 1D/2D model was quantitatively and qualitatively calibrated and validated using data from four different historical rain events. In Barcelona, approximately 25 rainfall gauges and more than 100 water level sensors and flood event videos and photos are available. Calibration and validation details can be found in deliverable 2.2 of the EU RESCCUE project [27].
2.3. Description of how the Metro Service is Affected by Flooding
Depending on the type of tunnel, existing floor, sleeper type, and other variables unique to each Metro system in the world, the characteristics of the infrastructure that perform primary flood control in Barcelona Metro service tunnels are summarized as follows.
The dimensions presented in Figure 4 are estimated, since they may vary depending on the sort of tunnel, among other factors, and should be taken as a theoretical reference. Therefore, depending on the existing drainage in each case, it will be more or less rapid for the water to reach the base of the rail.
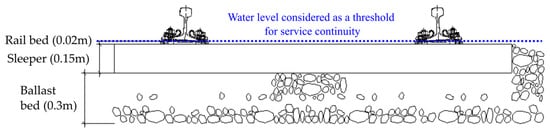
Figure 4.
Approximate scheme of the Barcelona Metro's railway infrastructure.
One of the essential parts of the train movement is railway signaling, which always allows safe movement by regulating the speed and location of trains. The basis of the railway signaling is based on the track circuits, whose theoretical schematic configuration is shown in Figure 5 (it does not precisely represent the reality for the whole Line 3 of the Barcelona Metro), where the track is electrically isolated in sections of a certain length. In the case of Metro Line 3, the track circuits are about 25 and 35 meters long.
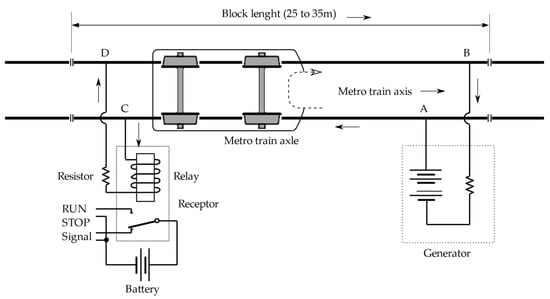
Figure 5.
Occupied block—track circuit scheme. Modified from [43].
The railway signaling equipment is qualified to work under wet conditions; therefore, the circuit could work in case of flooding. Depending on the amount of water in the surrounding area and its conductivity, it may not complete the circuit, then diverting the electric current between the power supply and the receptor, producing the receptor is not over-excited by the electric current and the block is assumed occupied. It is not conceivable to set only a water level which produces the false occupation phenomenon. However, it could be established as an inaccurate reference level when the water level reaches half of the railway rail (0.08 m from the rail bed), we could have an occasional false occupation.
In the case of having a higher water level, in many cases, there would be false occupation, and therefore no Metro service would be provided. Due to these circumstances, this study takes a level of 0.15 m as an approximate reference level in which, in any road configuration, it is inevitable that because of a flooding event, false occupation is produced. It must be considered that even if we could find a situation where the water reaches the height of the head of the rail, there would be no false occupation, due to there being no short circuit of the electrical circuit. At this point, it would be necessary to analyze whether it is mechanically viable for trains to transit, given the possibility of slippage in the wheel-rail contact and the impossibility of visualizing the rail with the danger that this entails. Furthermore, concerning the ATP (automatic train protection) system, the closer the water gets to the head of the rail, the easier it is for the train's ATP antennas not to be able to obtain correct track circuit information, causing the train to brake for lack of obtaining the ATP code. When the water covers the whole head of the rail, accurate ATP interpretation is not possible.
2.4. Integration of the Metro Infrastructure in the Hydrodynamic Model
Water presence in the tunnel and the stations of a Metro system affects the continuity of the service. Thus, this study represents Metro network components into the hydrodynamic model through the creation of hydraulic geometry elements, comparable to real infrastructure components, evaluating a conceivable water entry event into the system, through hydrodynamic modelling. Principal floodwater access to the Metro system during extreme precipitation events are the ventilation grates and stations’ entrances, according to TMB and visual inspections carried out by TMB personnel during extreme rainfall events.
The data required to calculate the flow intercepted at the ventilation grates depends on the modelled inlet type. InfoWorks ICM® offers various methods to estimate captured flow by inlets, two of them based on the Federal Highway Administration (FHWA) Urban Drainage Design Manual, Hydraulic Engineering Circular No. 22 (HEC-22) [44]. This study applies another method, an alternative to the HEC-22 continuous grate inlet based on the equations from work carried out by Gomez et al. [45] at the Technical University of Catalonia (UPC), implemented in the InfoWorks® ICM software package.
Three-dimensional numerical modelling experimental campaigns [46,47] executed at UPC characterizes Barcelona drainage grates’ hydrodynamic behavior [45,48,49], including physical obstruction conditions determining hydrodynamic efficiency decrease on partially clogged grated inlets [50]. The ventilation grates as a water inlet use this previous research outcome since the model integrates hydrodynamic equations representing urban drainage grates, comparable to ventilation grates.
Metro tunnels’ representation in the hydrodynamic model introduces pipes with identical dimensions and geometry to the real infrastructure, considering tunnels’ cross-section and elevation data as Figure 6 shows. Metro network elements’ depiction in the hydrodynamic model process disregards entrance to service tunnel variability, which simplifies the flood impact analysis on the stations' platform and tunnels.
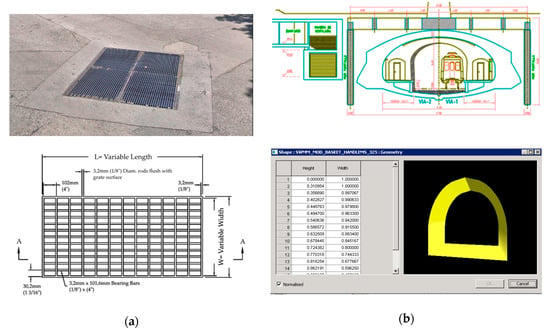
Figure 6.
(a) Image (up) and essential features (down) of a typical surface grate for ventilation purposes in the Barcelona Metro system; (b) Catalunya Metro station cross-section drawing (up); tunnel depiction shape in ICM® software (down).
Reaching a proper representation of Metro entrances requires gathering information such as longitude, altitude, stairs slope, and the elevation difference with the tunnel service, to set the pipe connecting them. An evaluation and calibration process for different inlet types concludes, in this case, that the continuous curb-opening inlet typology provides a better representation of Metro station entrances’ hydrodynamic behavior.
2.5. Calibration and Validation Process
The calibration process consists of adapting model parameters to achieve correspondence among simulated flood behavior and recorded or observed flooding. The calibration parameters are listed in Table 2. This process trains the model concerning selected hydraulic conditions that are compared with the observed data. Specifically, the computed water levels in both the surroundings of the Metro stations’ access and the tunnels were validated in this study.
Table 2.
Selected calibration parameters of the hydrodynamic model, including calibrated values.
TMB selects the pluvial flooding event dated 2018-09-06 as a flood event suitable for calibration purposes in two stations of Line 3 (Paral·lel and Drassanes). Throughout this precipitation, the water depth in the Metro tunnels of these two stations induced a service disruption, the presence of water already generates the false occupation phenomenon. Metro operators can remark on how risky it is to have a station open to possible water flows. However, it is the false occupation that disrupts the service. With a variable water depth in the tunnel service, although the train can pass through the station it cannot stop to pick up or drop off passengers, as it is technically incapable of stopping.
A calibration method employing a large data sample is not feasible in this model, due to the water level measurements shortage inside tunnels, hence this study tests to check its performance in real-world applications after calibration and before practice utilization, as the validation phase. Validation process applies another recorded surface flood event to ensure that the model acceptably reproduces recorded results, in this case, the pluvial flooding event dated 2018-08-17. This surface flooding event affected potential water entry points to the Metro system, but regular Metro service continued. The water level was not enough for the TMB operators to set the service interruption, nor was the water accumulated in the tunnels ample for the Metro system's self-protection system to produce a disruption in service.
2.6. Flood Risk Assessment under the Impact of Climate Change
One of the most used approaches in assessing the vulnerability of underground mass transport systems is the identification of the effects of service disruptions [9], giving a primary role to the ridership flow at Metro stations. Some authors have mainly been interested in questions concerning risk assessment for Metro stations [51,52] in a holistic manner. Metro system flooding events can lead to risk conditions involving both ridership and infrastructure, for instance, its impact on passengers' stability and safety [12,53]. Other authors focus their research on the optimization of evacuation processes during flood events in underground infrastructure [54,55,56,57,58]. However, this study defines risk according to the interruption of the Metro service, as a result of rainwater flooding on the urban transport system.
The concept of risk used in this research encompasses the combination of hazard and vulnerability. Hazard is characterized by flooding water depths (as the intensity of the hazard) along the Metro tunnel related to design storms of different return periods (probability of flooding events). Vulnerability criterion focuses on the ridership number affected by service interruptions. Therefore, the flood risk assessment process for Metro stations involves a hazard assessment, following the vulnerability assessment, and the procedure to obtain the risk data and maps for Barcelona Metro Line 3, as Figure 7 illustrates. For the hazard assessment, one, five, 10, and 20 years return period design storms are employed as inputs for Barcelona hydrodynamic 1D/2D coupled model for this study.
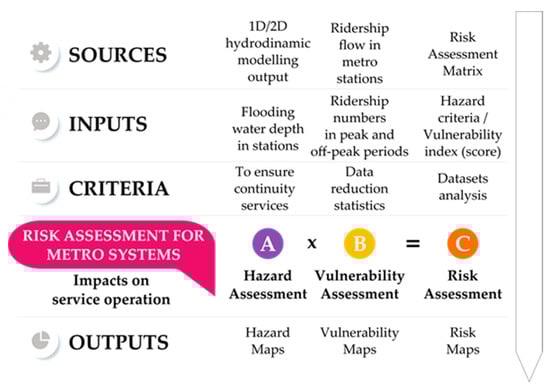
Figure 7.
Risk concept definition and datasets required in each stage.
These design storms were selected following the recommendations of the municipal operator of the city drainage system (Barcelona Cicle de l'Aigua, SA—BCASA). The principal criteria for establishing this hazard estimation is to ensure continuity of Metro services, as the primary concern of the Metro administrator. One of the operational thresholds which defines Metro service operation is the water depth within the Metro tunnels. Considering a flood event, after the water depth reaches 0.15 m inside Metro station tunnels, Depending on the state of the railway road track in front of the train, if there is false occupation due to water, the train would not reach that circuit because it would stop before arriving, impacting the entire line service. Through operational experience and based on technical assumptions with support from TMB, the hazard ranges are defined as follows: water depths between 0 and 0.15 m are defined as low, between 0.15 and 0.30 m as medium, and depths greater than 0.30 m are high. These values are variable in a real operation scheme and depend on the track circuit, so they are only taken as a reference.
For the vulnerability assessment, registered Line 3 station user entrance data, for every hour in the months November and December 2019, reflect the ridership flow, defining peak hours (18:00–19:00) and off-peak hours (12:00–13:00). Vulnerability assessment development uses ridership flows as inputs. It applies the Jenks natural breaks algorithm as a standard method for dividing a dataset into three homogenous classes; low, medium, or high. The hazard and vulnerability limits proposal and matrices are summarized in Table 3. Methods for risk assessment can be qualitative or quantitative, both having limitations [59]. To defining risk as to the probability or threat to a hazard occurring in a vulnerable area, flood risk was assessed through a risk map related to a determined scenario and return period by combining hazard and vulnerability maps. Metro stations and ridership are affected by floods in Barcelona, and their assessment defines hazard, vulnerability, and risk levels by significance levels such as "high," "medium," and "low," evaluating the resultant risk level against qualitative criteria.
Table 3.
Hazard and vulnerability criteria for Metro stations service exposed to flooding.
Hazard range assignment relates to Metro trains’ capacity to operate under tunnel flooding conditions, considering the maximum water levels for the inundation events and the consequent service disruption. For the low hazard level defined by floodwater levels between 0 m and 0.15 m, service continuity disruption starts, and the Metro operation is subject to substantial supervision until the water level reaches 0.1 m when the service might be disrupted. At the medium hazard level, service disruption is likely because trains can no longer stop, affecting service availability on affected stations. High hazard level corresponds to floodwater level exceeding 0.3 m, under this water depth condition, the rail is likely covered by water, thus services are disrupted and trains cannot ride.
The creation of risk and vulnerability maps implies multiplying the vulnerability index (1, 2, or 3, corresponding to the low, medium, and high vulnerability) by the risk index (1, 2, or 3, corresponding to the low, medium and high). The total risk ranges from 1 to 9, where higher levels indicate a higher risk. This approach is compiled in the risk matrix shown in Table 4.
Table 4.
The risk matrix for Metro stations and ridership.
The entry of water into the subway system due to surface flooding is since the flood levels are higher than the elevation of the Metro infrastructure, which allows access to water, e.g., ground ventilation grates and user entrances to the system. This study identifies these water entry accesses according to different rainfall conditions. It suggests some non-structural and structural measures [5], combining both as a successful strategy facing the increased risk of flooding, according to Barcelona Metro system-specific factors.
3. A Case Study for the Barcelona Metro System
The purpose of this chapter is to present the physical characteristics of the study area, including a comprehensive summary of the Metro system, the hydrological conditions over the study area, a comprehensive summary of the rainfall data, and the boundary conditions applied in the integrated hydrodynamic 1D/2D model.
3.1. Characteristics of the Study Area
Barcelona has a Mediterranean climate, with gentle winters and mild summers. Barcelona soil cover experienced massive urbanization through the last century. Nowadays, the city land-use is about 80% of impervious areas and 20% of pervious areas. This morphology causes a brief time of concentration in catchment areas. As a result, medium and heavy storm events produce quick stormwater storage in flatland areas, provoking urban flash floods.
3.2. Underground Infrastructure Network: Metro System
Based on TMB confidentiality policies, this research does not offer Metro system details such as ventilation grates, accesses, tunnel dimensions, incoming water volumes, and ridership flows. The system runs by one operator (TMB) whose fare integrates into the unified six-zone system created by the Metropolitan Transport Authority. This research has TMB support, manager of the Metro system as a benchmark public mobility company in Europe and the world. With 13 lines, consisting of ten Metro lines, a cable car, a tram and a funicular, with a length of 121.4 km for the entire network, and 160 stations, the Metro network is the second largest conventional Metro network in Spain after Madrid, and since December 2009, the first with automated lines.
In 2019, 411.95 million passengers used the Barcelona Metro network managed by TMB. Barcelona Metro Line 3 links Zona Universitària and Trinitat Nova stations along a 17.8-kilometre double-track stretch with 26 stations underground. Line 3 at the peak hour averages 26 trains with 95 million passengers being second in terms of ridership volume, reaches a commercial speed of 26.5 km/h, and uses a rigid catenary system for the power supply and standard track width [60]. Figure 8 reveals flooding events’ marked concentration on one specific area of Metro stations, which coincides with the most frequent surface pluvial floods area; during rainfall events, stormwater flow exceeds sewer pipe capacity.
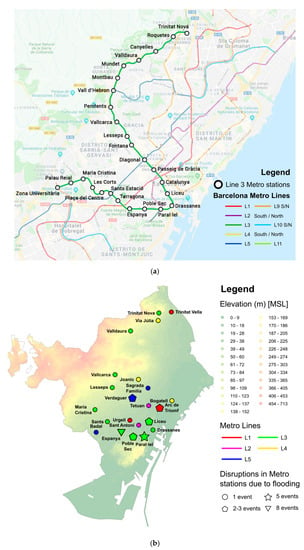
Figure 8.
(a) Location of the stations on Line 3 of the Barcelona Metro system; (b) Barcelona Metro stations affected by flooding in the last 20 years, the lines to which they belong, and the number of service interruptions due to flooding at stations. The size of the nodes for every affected Metro station is proportional to the number of disruptions and related to the geometric element.
3.3. Data Acquisition
As part of the research, a precise record of Barcelona Metro Line 3’s possible water accesses was obtained based on TMB provided data. Historical flood events confirm surface runoff reaches the Metro system by specific accesses and ventilation grates, set by visual reports authored by newspapers, also registered and validated by TMB staff. Metro Line 3 elements’ representation as part of the coupled 1D/2D Barcelona drainage network model considers water flow through Metro station entrances, lifts, and ventilation grates, as Figure 8 shows. This inclusion allows improving model outcomes, as flow dynamics description between surface flow and urban drainage improves [61]. Figure 9 indicates the spatial location of the possible water entry points to Line 3 of the Metro system.
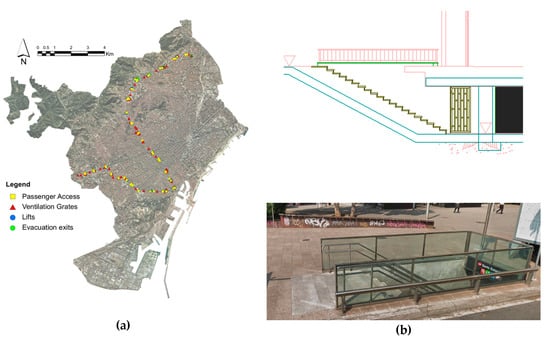
Figure 9.
(a) Integrated Metro elements into the hydrodynamic model, such as possible water entry points for Barcelona Metro Line 3; (b) schematic representation of the Metro station accesses analyzed in the study.
3.4. Rainfall Data and Boundary Conditions
The 1D/2D hydrodynamic model boundary conditions consisted of the result of the rainfall-runoff model (storm water management model based on the non-linear reservoir was chosen among the options provided by InfoWorks ICM®) applying the rain gauge data and the observed water depth in the Metro tunnels downstream. The upstream boundary conditions applied in the calibration and validation phase are two historical rainfall events with surface flooding over Barcelona.
3.4.1. General Rainfall Conditions in Barcelona
The annual average rainfall is 460 mm. The Mediterranean rainfall pattern shows short-duration high-intensity events and spatial high-variability; 50% of the annual precipitation happens throughout variable rainfall events [62]. These events, in combination with city morphological characteristics and impervious areas, produce high flows in the sewer system. All these factors increase urban flood risk in city flatland areas. Barcelona has rainfall data since 1927 from Fabra Observatory; this long-time data series allowed the creation of the intensity duration frequency (IDF) curves for the city. Figure 10 shows new IDF curves based on 81 years data series (1927–1992 and 1995–2009) for some return periods [42]. Intensity values from these IDF curves are currently employed in local sewer network studies.
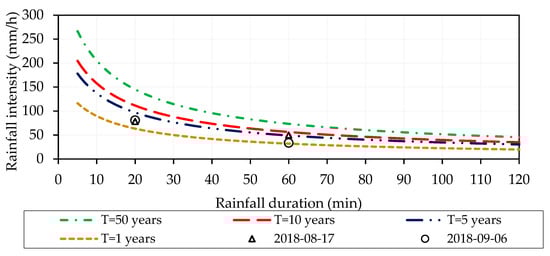
Figure 10.
Intensity duration frequency (IDF) curves relating return periods (in years) with durations (in minutes) for Barcelona [63]. Points with information of two real precipitation events (2018-09-06, 2018-08-17), to compare them with the IDF curves.
3.4.2. Calibration and Validation Data
Two recent rainfall events induced surface flooding in Barcelona. One of these events (2018-09-06) caused Metro service disruptions in five stations. Ergo, this study uses this flooding event to calibrate the hydrodynamic model considering a water level of 0.15 m, for which service availability is likely to be affected by flooding in Metro service tunnels. Figure 11 shows calibration, and validation rainfall events’ hydrological features, including rain gauges’ covered area, Thiessen polygon distribution, and cumulative rainfall depth.
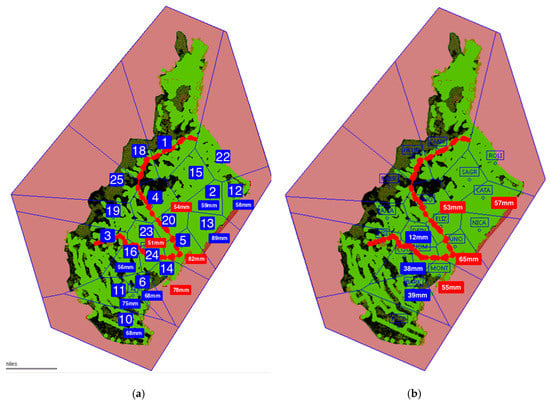
Figure 11.
Study area map indicating rain gauges used for rainfall data acquisition process, and the cumulative rainfall (mm) for every flooding event. Red dots reveal possible water entry points to Metro Line 3. Blue lines show the Thiessen polygon division for each gauge region (25). (a) Flooding event for calibration 2018-09-06; (b) flooding event for validation 2018-09-06.
The other flooding event (2018-08-17) produced surface flooding; nevertheless, this event did not affect Line 3 Metro stations. On this basis, this research considers this event valid for validation purposes, understanding the process to validate the surface 2D overland flow in the vicinity of the Metro station. For this event, the model registers surface flooding, but it does not indicate floods inside the station.
3.4.3. Design Storms
Climatic variables’ projections unto 2100 are forecasting within project RESCCUE. This study embraces these rainfall projections to create design storms (using alternating blocks method, according to recommendations produced near the study area [64]). After running the hydrodynamic model for the future expected conditions, including climate change influence, hence obtaining the pluvial floods to assess expected future impacts.
Extreme events analysis is considering return periods of one, five, 10, and 20 years as possible adaptation frameworks. The same rain intensity is distributed over the whole area for these synthetic events, with the rain gauges used for rainfall data acquisition process, and the cumulative rainfall (mm) for an event. These synthetic rains are conceived with a five-minute temporal resolution to reach a high-level accuracy, duration up to 2 h 30 min, and a maximum rainfall intensity as Figure 12 illustrates for each one of the return periods.
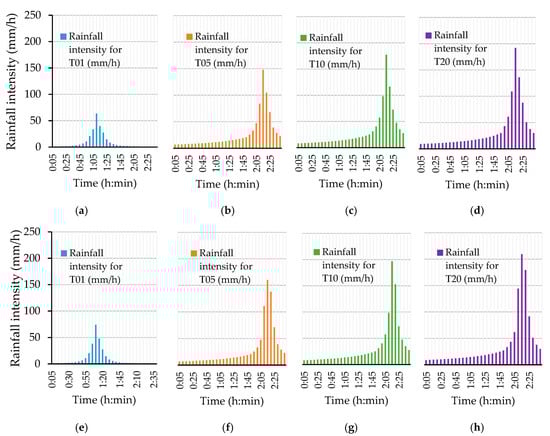
Figure 12.
Synthetic rainfall events characteristics. Five-minute rainfall intensity hyetographs for events under current rainfall conditions: (a) A 1-in-1 year event; (b) a 1-in-5 year event; (c) a 1-in-10 year event; (d) a 1-in-20 year event. Five-minute rainfall intensity hyetographs for events under future rainfall conditions: (e) A 1-in-1 year event; (f) a 1-in-5 year event; (g) a 1-in-10 year event; (h) a 1-in-20 year event.
4. Results
Section four highlights the research findings, focusing on the three key themes: The calibration and validation results obtained through hydrodynamic modelling of two historical flood events, from which there are real data to carry out the required corroboration; and the outcomes of the simulations under current and future rainfall conditions. This section outlines the modelling process results achieved via the application of the proposed methodology, their interpretation as well as the conclusions that can be drawn for three points: The calibration and validation phase. Besides, it shows the hydraulic modelling outputs from the application of the synthetic rainfall conditions driven by the impact of climate change into the drainage model.
With the results of the projected water depth for the conditions of the historical event used for the calibration of the model and the projected water depth for future flooding events, one of the two fundamental criteria is obtained. Along with the ridership flow to obtain the hazard and vulnerability assessment, the flood risk assessment results for Line 3 Metro stations are obtained, following the methodology introduced in Section 3.
4.1. Calibration and Validation Processes
The first set of analyses examined the real events’ pluvial flooding impact; one of them (2018-09-06) caused both surface flooding, along with two stations flooding on Metro Line 3, as indicated in Figure 13. The other flood event (2018-08-07) was merely superficial, comparable to the first event, but it did not generate flooding on Metro stations.
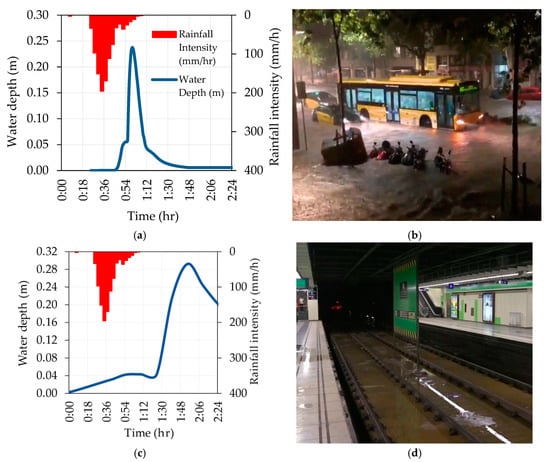
Figure 13.
Calibration process summary output, for flooding event 2018-09-06: (a) Water depth modelling outcome in access 323_1 that serves the Paral·lel Metro station; (b) photograph of the flood event in the Metro access surroundings, corroborating the water depth obtained in the modelling; (c) water depth modelling outcome in Paral·lel Metro station tunnel; (d) photograph of the flood event in the Paral·lel Metro tunnel, corroborating the water depth obtained in the modelling.
This real-life hydraulic behavior replication in the hydrodynamic modelling output is successful in obtaining similar water depths at the surface level, through the calibration process applying this model for the Barcelona master drainage plan and the executed process for this study. Moreover, for the first event, the model identified water entries to Line 3 surrounding Paral·lel and Drassanes Metro stations areas, including water in their tunnels, as can be seen from the table (below). Then, water depth results in the 2D hydraulic element surrounding the ventilation grates and Metro stations’ accesses are summarized, in addition to the water level in the cited Metro stations, are consistent with the flood event records.
4.2. Simulations under Current and Future Rainfall Conditions
Table 5 presents the hydrodynamic modelling process results for various return periods, which includes the Line 3 infrastructure points number where water accesses are identified, the maximum water depth in the 2D element surrounding water access points, and the maximum water depth projected in Metro stations’ tunnels, for scenarios with climate change influence or without it. In the same way, it details the variation among every return period and the scenarios involving climate change impact, identifying such impact directly. Three things are evident from the changes among the results with the climate change influence and those not considering such influence. Firstly, rainfall intensities and water flow increment due to the climate change impact will impact Metro infrastructure, suggesting that the Metro system should develop adaptation measures against climate change effects. Secondly, the magnitude of the maximum water depth estimation varies between the differing return periods, with the climate change projections yielding a more significant water depth than estimated via non-influenced projections. Finally, the maximum water depth in Metro station tunnels increases between the different approaches; this is particularly evident when comparing T20 and T20 CC, which show a 54% increase estimation for the projected water depths.
Table 5.
Outcome summary for hydrodynamic simulations performed under current and future rainfall conditions.
The results suggest that the magnitude of change is dependent upon the rainfall intensity for every outcome category. For example, the water depth changes appear most substantial for the T20 CC generated scenario, with the water depth estimates being shifted further than with the other approaches, without the climate change influence. However, the varying water depth associated with each return period is also highlighted, with the results differing between each return period.
4.3. Risk Assessment
Applying the outlined methodologies, Figure 14 and Figure 15 describe the comparison of the risk assessment outcomes among the real event (2018-09-06) and the 1-in-20 years return period flooding event with climate change impact, as the most critical scenario analyzed. Differences between the projections provided by each flooding scenario and applying a peak ridership flow pattern are highlighted by the risk assessment presented in Figure 16 as a summary, detailing the risk obtained for Barcelona Metro Line 3 stations facing flooding events. The findings presented here highlight the considerable influence of the water depth in the water entry points’ surrounding areas when assessing the climate change impact upon flood risk. Although all the flood events used here do not result in quite different pictures of future flood risk on the Metro accesses or ventilation grates, there are some significant differences in terms of the risk magnitude.
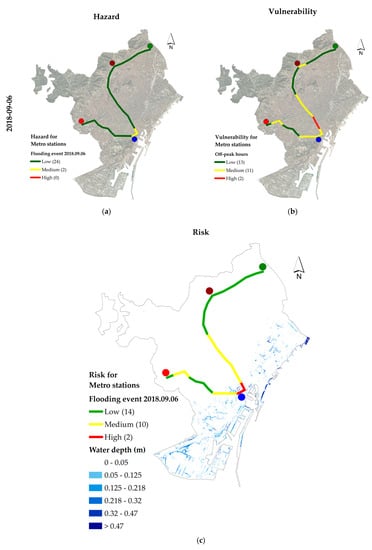
Figure 14.
Metro stations risk assessment map for real event pluvial flooding scenario (2018-09-06): (a) Hazard map considering real flooding event; (b) vulnerability map applying off-peak ridership flow; (c) risk map with flooding water depth.
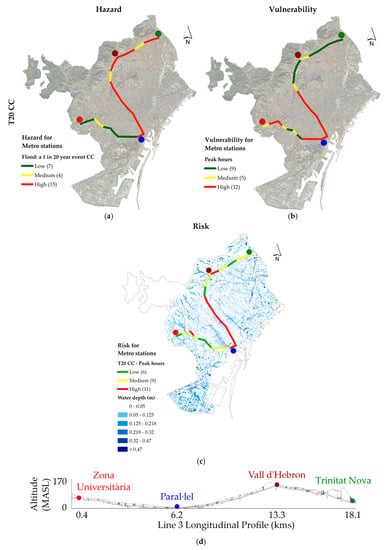
Figure 15.
Metro stations risk assessment map for synthetic event scenario with climate change influence (a 20 year return period event—"T20 CC"): (a) Hazard map considering future flooding conditions with climate change influence; (b) vulnerability map applying peak ridership flow; (c) risk map with flooding water depth; (d) Barcelona Metro Line 3 longitudinal profile scheme, with the location of the Metro stations located at the highest and lowest points of the network.
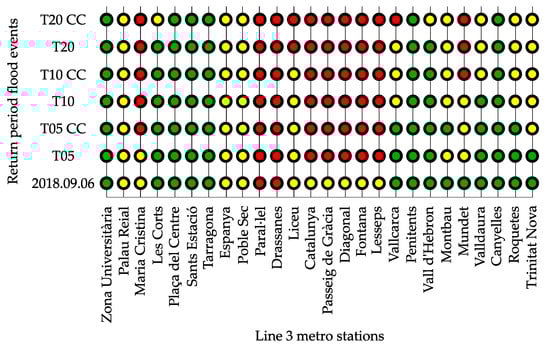
Figure 16.
Risk assessment outcome for flood events on Barcelona Metro Line 3 stations, arranged by return period (T, in years) and climate change (CC) influence on the projected flood event. The green color means a low risk, the yellow color symbolizes medium risk, and the red color denotes a high risk.
The small difference between the maximum water depth affecting the water entry points, comparing T05 CC and T20 CC scenarios (0.08 m), produces significant differences for the risk assessment results. As Figure 15 illustrates, with a significant risk for 14 stations in T05 CC scenario and increasing to 20 stations having a significant risk in T20 CC scenario. It therefore seems necessary to incorporate a range of approaches in adaptation measures that are focused on coping with this increment in water depth. The majority of Metro Line 3 stations are highly susceptible to floods. Considering all risk scenarios, the maximum water depth in the surroundings of the water entry points, such as ventilation grates and Metro stations access, is not larger than 0.38 m.
5. Discussion
This chapter draws together and discusses the key findings, analyzing the results obtained in the study, and indicates how adaptation measures can be applied, according to local conditions. To the best of our knowledge, this is the first study to have quantified the flooding risk to underground Metro stations for water intrusion hazard due to rainfall events, obtaining water depths estimation for projected extreme rainfall events. The approach used in this study differs substantially from other approaches studied previously [5]. In particular, although it uses geographic information systems (GIS) as the basis for collecting and organizing information from the Barcelona Metro system, the use of GIS is a secondary component which does not form part of the analysis in this study, contrasting other studies in the field [25].
This study considered only the water depth in the Metro station tunnels, obtained from hydrodynamic modelling, as a variable to characterize the hazard. Although the hazard due to flow velocity can be taken into account since there is sufficient information to carry out such an analysis from the hydrodynamic model, the objective of the analysis carried out in this research is the interruption of the Metro service. Therefore, the flow velocity is not a relevant parameter for this analysis, as it would be if this study were focused on passenger safety.
A hydrodynamic modelling software, combined with innovative analysis on how Metro systems can be represented into a drainage system, and assumptions about the fragility of transport infrastructure derived from pluvial flooding events have been used to assess flood risk in a Barcelona Metro line. The study demonstrates the potential for conducting transport infrastructure risk analysis through hydrodynamic modelling and a depiction of the real physical conditions for representing Metro systems. One of the main conditions of this study was to define a simplification of Metro system water accesses, such as ventilation grates, depicted as drainage grates adapted to each grate condition; the stations' access, neglecting the complexity inherent to each station, such as hallways, stairs, and additional architectural components before entering the station tunnel. All these elements were considered as pipes until arriving at the main tunnel; this enabled the Metro network to be integrated into the complex hydrodynamic model.
We have found that improving some ventilation grates and Metro access designs, by increasing their minimum height to 0.35 m, could yield a potential decrease in flooding events for Metro Line 3 tunnels and stations. Of course, care should be taken with the interpretation of these results, as local conditions for each of the ventilation grates and accesses must be considered in detail. This simplification could affect water transport times from water entry points to tunnels.
Service disruptions due to flooding events are not only by water depth increase in Metro tunnels, but also by impacts on ridership stability inside stations, corridors, and hallways. Flooding events can also affect the electrical equipment and increase maintenance costs, as Figure 2 illustrates. Service disruption does not occur mainly because of the water level itself but because of the misleading interaction between water and the Metro blocks-based electrical system. The higher the water depth, the more likely a block can be misleadingly occupied, and thus the service disrupted.
The outcomes of this study display that by accounting for increased possible water entry sources, water depth range forecasts in Metro tunnels widen. It is reasonable to assert that the principal source of flooding is a local level phenomenon of water entry. However, differences in topographic altitude also influenced flooding cases in the Metro tunnels for our case study. The locations of water entry points to the Metro identified in the real flood event (2018-09-06) are near the two most affected stations, Paral·lel and Drassanes. Nevertheless, flood events with projected high-rainfall intensities also affect high sub-basin areas in our case. These outcomes suggest an association between water entry from the upper sub-basin and the increased water entry risk for upper and lower Metro stations. It is therefore likely that such connections exist between a water transport phenomenon into the system tunnels and the increased water depth in Paral·lel and Trinitat Nova Metro stations.
Flooding events also impact the system's vulnerability, as the presence of water in the Metro tunnels affects the continuity of the service, also impacting the passengers' flow. By preventing passengers’ access to the stations due to an extreme precipitation event and the consequent flooding that this causes, the vulnerability decreases because the flow of passengers entering the system also decreases. By preventing water from entering the Metro system, both the flooding hazard and the vulnerability expressed in the flow of ridership decrease. Nevertheless, such vulnerability is never zero, and in fact, it is high, since the disruption of the service also impacts passengers who are already on the trains, inhibiting their adequate transportation.
Our findings draw attention to the importance of considering that the low level of some ventilation grates and Metro stations’ accesses may increase probabilities for water entering in flood events, as Figure 17 illustrates.
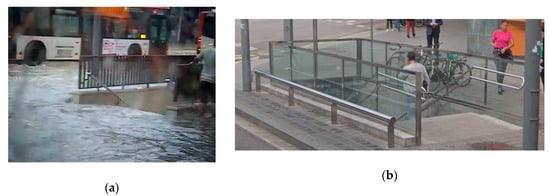
Figure 17.
The visual contrast among a Paral·lel station entrance facing a flood event, and its regular service; (a) flooding event 2009-10-22; (b) current situation.
Moreover, the significant water depths in upper-located stations such as Vall d'Hebron associated with high-return periods under observed conditions may further question rainfall events’ role in impacting water intrusion to the Metro system. Addressing the spatial and temporal full range uncertainty related to future rainfall events poses a significant challenge, therefore, we believe that having a homogeneous rainfall distribution over the city is adequate to cope with most possible climate change situations to come.
Concerning the research methods, some limitations need to be acknowledged. The interaction at the hydraulic level between the 1D and 2D model is not fully understood, for example, during the transformation of the surface flood water level to the entry points of the Metro system. Due to the lack of modelling elements that competently render physical structures that are not common in hydraulic systems. A possible source of bias for the study is the influence that unexamined physical details of stairs, access corridors, and vents, as water access points to the Metro, could have physical details beyond the roughness, sizes, and lengths that were considered.
This study emphasizes that this risk assessment combines water level projections with present ridership flows and traveler density. Outcomes should hence not be used as projected impacts. Instead, they ponder the current risk, which we define as a threat indicator for Metro system sustainability in the future. Future research should consider and integrate all the major possible flood hazard modes for Metro systems, such as the influence of groundwater infiltrations. A full climate risk assessment is required for the Metro system. It must have a high priority within a comprehensive, Barcelona-wide climate risk assessment and adaptation effort, involving all governmental agencies.
6. Conclusions
This study presents a novel integrated model to simulate flooding in the underground Metro system of Barcelona. This model assumes that the Metro flooding only occurs from surface flooding that can drain into the underground Metro infrastructure through Metro staircases, ventilation grids, and elevators. The new model integrates a conventional 1D/2D urban flood model with a Metro model that is simulated as a system of pipes and links just as if it was a drainage network. The integrated model can simulate the spatial and temporal variability of Metro flood water depth and velocity. Simulated maximum flood depth is used as input for the flood risk assessment presented.
This research analyzes the current flooding of the Barcelona Metro Line 3 infrastructure, considering the climate change influence on future rainfall intensities, for flood risk assessment. This research proposed a framework for flood simulation of underground Metro systems, showing that Metro infrastructure can be simulated as a "drainage system" for risk assessment purposes of Metro systems. Notwithstanding the relatively limited data sample analyzing one of 12 Metro lines, this work offers valuable insights into developing targeted interventions aimed at reducing Metro service disruptions frequency and impact. This piece of research includes strategies to enhance flood risk management as a reasonable approach to tackle this issue, not only for Barcelona Metro but for Metro systems worldwide. This study provides a baseline for assessing potential flood outcomes in Metro systems, notwithstanding, any proposed adaptations are not studied in detail. However, the model can be used to evaluate adaptation measures’ effectiveness. To estimate the adaptation costs under various climate change and socioeconomic development situations, compatible adaptation measures with the urban planning recommended by the Barcelona City Council are necessary.
One might thus conclude that decreasing Metro service flood hazard by heightening this infrastructure is further up the list of priorities, after ensuring pedestrian mobility at the ground level and easy access to Metro stations. Still, there are significant benefits from improving the flood hazard of flooding-exposed Metro infrastructure performing some adaptation measures, either increasing accesses’ heights or achieving other structural measures such as hydraulic barriers by demand.
Author Contributions
Conceptualization, E.F.-O. and E.M.-G.; methodology, E.F.-O., E.M.-G. and B.R.; software, E.F.-O. and L.L.; validation, E.M.-G., L.L. and B.R.; formal analysis, E.F.-O. and E.M.-G.; investigation, E.F.-O., M.C.P. and L.L.; resources, E.M.-G., and M.C.P.; data curation, E.F.-O. and M.C.P.; writing—original draft preparation, E.F.-O.; writing—review and editing, E.F.-O., E.M.-G. and L.L.; visualization, E.F.-O. and L.L.; supervision, E.M.-G.; project administration, E.F.-O. and E.M.-G.; funding acquisition, E.M.-G. and B.R. All authors have read and agreed to the published version of the manuscript.
Funding
This research was funded by the RESCCUE project, which is sponsored by the European Union's Horizon 2020 research and innovation program under grant agreement No. 700174, whose support is gratefully recognized.
Acknowledgments
The contents of this research are a part of the findings of the project RESCCUE, which has obtained funding from the EU H2020 (grant agreement n. 700174). Part of the content is also presented in this article with the explicit consent of Transports Metropolitans de Barcelona (TMB). Re-use of the knowledge enclosed in this paper for commercial and/or non-commercial purposes is allowed and free of charge, on the requirements of compliance by the re-user of the research, not distortion of the original meaning or information of this research and the non-liability of the RESCCUE project partners and/or TMB for any consequence stemming from the re-use. The RESCCUE project partners and TMB do not accept any liability for the errors, consequences, or omissions herein contained.
Conflicts of Interest
The authors declare no conflict of interest. The funders had no role in the design of the study; in the collection, analyses, or interpretation of data; in the writing of the manuscript, or in the decision to publish the results.
References
- Michener, W.K.; Blood, E.R.; Bildstein, K.L.; Brinson, M.M.; Gardner, L.R. Climate change, hurricanes and tropical storms, and rising sea level in coastal wetlands. Ecol. Appl. 2016, 7, 770–801. [Google Scholar] [CrossRef]
- Chapin, F.S.; Kofinas, G.P.; Folke, C.; Carpenter, S.R.; Olsson, P.; Abel, N.; Biggs, R.; Naylor, R.L.; Pinkerton, E.; Stafford, D.M.; et al. Resilience-based stewardship: Strategies for navigating sustainable pathways in a changing world. In Principles of Ecosystem Stewardship: Resilience-Based Natural Resource Management in a Changing World; Springer New York: New York, NY, USA, 2009; pp. 319–337. ISBN 9780387730325. [Google Scholar]
- Wan, C.; Yang, Z.; Zhang, D.; Yan, X.; Fan, S. Resilience in transportation systems: A systematic review and future directions. Transp. Rev. 2018, 38, 479–498. [Google Scholar] [CrossRef]
- Markolf, S.A.; Hoehne, C.; Fraser, A.; Chester, M.V.; Underwood, B.S. Transportation resilience to climate change and extreme weather events – Beyond risk and robustness. Transp. Policy 2019, 74, 174–186. [Google Scholar] [CrossRef]
- Forero-Ortiz, E.; Martínez-Gomariz, E.; Cañas Porcuna, M. A review of flood impact assessment approaches for underground infrastructures in urban areas: A focus on transport systems. Hydrol. Sci. J. 2020. [Google Scholar] [CrossRef]
- UITP World Metro Figures. 2018. Available online: https://www.uitp.org/sites/default/files/cck-focus-papers-files/StatisticsBrief-Worldmetrofigures2018V4_WEB.pdf (accessed on 15 May 2019).
- Vespignani, A. The fragility of interdependency. Nature 2010, 464, 984–985. [Google Scholar] [CrossRef] [PubMed]
- Sun, D.J.; Guan, S. Measuring vulnerability of urban metro network from line operation perspective. Transp. Res. Part A Policy Pract. 2016, 94, 348–359. [Google Scholar] [CrossRef]
- Forero-Ortiz, E.; Martínez-Gomariz, E. Hazards threatening underground transport systems. Nat. Hazards 2020, 100, 1243–1261. [Google Scholar] [CrossRef]
- Transport for London. Providing Transport Services Resilient to Extreme Weather and Climate Change. 2011. Available online: http://www.energyforlondon.org/wp-content/uploads/2016/07/TfL-adaptation-report-.pdf (accessed on 29 January 2020).
- Secretary Transport UK. Transport Resilience Review—A Review of the Resilience of the Transport Network to Extreme Weather Events; Government of the United Kingdom: London, UK, 2014; ISBN 9781474106610.
- Martínez-Gomariz, E.; Gómez, M.; Russo, B. Experimental study of the stability of pedestrians exposed to urban pluvial flooding. Nat. Hazards 2016, 82, 1259–1278. [Google Scholar] [CrossRef]
- Chen, Q.; Xia, J.; Falconer, R.A.; Guo, P. Further improvement in a criterion for human stability in floodwaters. J. Flood Risk Manag. 2018, 12, e12486. [Google Scholar] [CrossRef]
- Madsen, H.; Lawrence, D.; Lang, M.; Martinkova, M.; Kjeldsen, T.R. Review of trend analysis and climate change projections of extreme precipitation and floods in Europe. J. Hydrol. 2014, 519, 3634–3650. [Google Scholar] [CrossRef]
- Willems, P.; Olsson, J.; Arnbjerg-Nielsen, K.; Beecham, S.; Pathirana, A.; Gregersen, I.B.; Madsen, H.; Nguyen, V.-T.-V. Impacts of Climate Change on Rainfall Extremes and Urban Drainage Systems; PB-IWA Publishing: London, UK, 2012; Volume 68, ISBN1 978-1-78040-126-3. ISBN2 978-1-78040-125-6. [Google Scholar]
- Nissen, K.M.; Ulbrich, U. Increasing frequencies and changing characteristics of heavy precipitation events threatening infrastructure in Europe under climate change. Nat. Hazards Earth Syst. Sci. 2017, 17, 1177–1190. [Google Scholar] [CrossRef]
- Joe Weisenthal Hurricane Sandy: Photos of New York Subway Flooded. Available online: https://www.businessinsider.com/hurricane-sandy-photos-of-new-york-subway-flooded-2012-10?IR=T (accessed on 4 November 2019).
- Japanese Water Management and Land Conservation Measures against Inundation of Underground Space-Past Flooding Cases. Available online: http://www.mlit.go.jp/river/bousai/main/saigai/jouhou/jieisuibou/bousai-gensai-suibou01-kako.html (accessed on 12 November 2019).
- Tremending Metro de Madrid: Flooding after This Week’s Summer Storms. Available online: https://www.publico.es/tremending/2017/07/07/facebook-metro-de-madrid-nada-las-inundaciones-tras-las-tormentas-de-verano-de-esta-semana/ (accessed on 7 November 2019).
- Vaníček, I.; Jirásko, D.; Vaníček, M. Interaction of transport infrastructure with natural hazards (landslides, rock falls, floods). Ce/Papers 2018, 2, 135–164. [Google Scholar] [CrossRef]
- NBC. Metro Station Flooding: Nearby Parking Lot Expansion Could Be Part of Cause. Available online: https://www.nbcwashington.com/traffic/transit/Metro-Station-Flooding-Nearby-Parking-Lot-Expansion-Could-Be-Part-of-Cause-384015451.html (accessed on 4 December 2019).
- The Bulletin. Bulletin Brussels Metros Flood with Water after Tuesday Storms. Available online: https://www.thebulletin.be/brussels-metros-flood-water-after-tuesday-storms (accessed on 14 November 2019).
- Wu, J.; Fang, W.; Hu, Z.; Hong, B. Application of bayesian approach to dynamic assessment of flood in urban underground spaces. Water 2018, 10, 1112. [Google Scholar] [CrossRef]
- Lyu, H.M.; Wang, G.F.Q.G.; Shen, J.S.; Lu, L.H.; Wang, G.F.Q.G. Analysis and GIS mapping of flooding hazards on 10 May 2016, Guangzhou, China. Water 2016, 8, 447. [Google Scholar] [CrossRef]
- Lyu, H.M.; Sun, W.J.; Shen, S.L.; Arulrajah, A. Flood risk assessment in metro systems of mega-cities using a GIS-based modeling approach. Sci. Total Environ. 2018, 626, 1012–1025. [Google Scholar] [CrossRef] [PubMed]
- Lyu, H.-M.; Shen, S.-L.; Yang, J.; Yin, Z.-Y. Scenario-based inundation analysis of metro systems: A case study in Shanghai. Hydrol. Earth Syst. Sci. Discuss. 2019, 1–30. [Google Scholar] [CrossRef]
- Velasco, M.; Russo, B.; Martínez, M.; Malgrat, P.; Monjo, R.; Djordjevic, S.; Fontanals, I.; Vela, S.; Cardoso, M.A.; Buskute, A. Resilience to cope with climate change in urban areas-A multisectorial approach focusing on water-The RESCCUE project. Water 2018, 10, 1356. [Google Scholar] [CrossRef]
- EFE. Power Cuts and Flooding on Roads, Railways and Metro due to Heavy Rains in Catalonia. Available online: https://www.elmundo.es/elmundo/2002/10/09/sociedad/1034147378.html (accessed on 16 November 2019).
- Vanguardia. Heavy Rains Cause Problems in the Accesses to Barcelona Due to Floods and Traffic Light Breakdowns. Available online: https://www.lavanguardia.com/vida/20040914/51262798057/las-fuertes-lluvias-provocan-problemas-en-los-accesos-a-barcelona-por-inundaciones-y-averias-de-sema.html (accessed on 3 November 2019).
- Vanguardia. An Autumn Storm Floods the Ronda Litoral and Barcelona's Metro for Three Hours. Available online: https://www.lavanguardia.com/sucesos/20091022/53809334313/una-tormenta-otonal-inunda-la-ronda-litoral-y-el-metro-barcelones-por-tres-horas.html (accessed on 23 November 2019).
- Vanguardia. The Strong Storm Causes Effects on Trains and Subway in the Area of Barcelona. Available online: https://www.lavanguardia.com/sucesos/20110719/54187726290/el-fuerte-temporal-causa-afectaciones-en-trenes-y-metro-del-area-de-barcelona.html (accessed on 14 November 2019).
- Vanguardia. Firefighters Make about a Hundred Exits Due to Flooding in the Area of Barcelona. Available online: https://www.lavanguardia.com/vida/20180716/45935565609/bomberos-efectuan-unas-cien-salidas-por-inundaciones-en-el-area-de-barcelona.html (accessed on 26 November 2019).
- Vanguardia. Storm in Barcelona: The Strong Storm that Has Hit the Capital City. Available online: https://www.lavanguardia.com/local/barcelona/20180906/451668443082/tormenta-lluvia-rayos.html (accessed on 19 November 2019).
- Vanguardia. Heavy Rainfall in Barcelona. Available online: https://www.lavanguardia.com/local/barcelona/20181009/452266860153/lluvia-torrencial-barcelona-temporal-aguaceros-inundaciones-video-seo-lv.html (accessed on 25 November 2019).
- Vanguardia. The Emergency Number 112 Records 157 Rain Calls up to 8 Hours. Available online: https://www.lavanguardia.com/local/barcelona/20181115/452943966963/el-112-registra-157-llamadas-por-la-lluvia-hasta-las-8-horas.html (accessed on 18 November 2019).
- EFE. The Rain is Pouring into the Metro and Flooding Roads and Shops in Barcelona. Available online: https://elpais.com/ccaa/2019/07/27/catalunya/1564240513_745071.html (accessed on 7 November 2019).
- Metrópoli Abierta Waterfalls in the Verdaguer and Sagrada Família Metro Stations. Available online: https://www.metropoliabierta.com/el-pulso-de-la-ciudad/metro-verdaguer-sagrada-familia-inudada-lluvia_18588_102.html (accessed on 12 November 2019).
- ABC. Heavy Rains from the Cold Drop Cause Flooding in the Barcelona Metro. Available online: https://www.abc.es/espana/catalunya/barcelona/abci-fuertes-lluvias-gota-fria-causan-inundaciones-metro-barcelona-201908271615_noticia.html (accessed on 1 December 2019).
- Abierta, M. Rain Affects Metro, Bus and Renfe Services. Available online: https://www.metropoliabierta.com/movilidad/lluvia-afecta-servicios-metro-bus-renfe-barcelona_21490_102.html (accessed on 9 December 2019).
- Vanguardia. Flooded Streets and Closed Metro Stations: The Incidents Due to the Storm in Barcelona. Available online: https://www.lavanguardia.com/local/barcelona/20191204/472058751703/incidencias-temporal-lluvias-barcelona-dana.html (accessed on 21 December 2019).
- Ajuntament de Barcelona. Barcelona, a City Committed to Combatting Climate Change. 2013. Available online: https://carbonn.org/uploads/tx_carbonndata/Barcelona%20committed%20to%20combat%20climate%20change-Mitigation&Adaptation%20actions_05.pdf (accessed on 12 December 2019).
- Rodríguez, R.; Navarro, X.; Casas, M.C.; Ribalaygua, J.; Russo, B.; Pouget, L.; Redaño, A. Influence of climate change on IDF curves for the metropolitan area of Barcelona (Spain). Int. J. Climatol. 2014, 34, 643–654. [Google Scholar] [CrossRef]
- Scalise, J. How track circuits detect and protect trains. Railw. Walk Rail Talk 2014, 1, 1–7. [Google Scholar]
- FHWA. Urban Drainage Design Manual, Hydraulic Engineering Circular No. 22 (HEC-22); FHWA: Washington, DC, USA, 2009. [Google Scholar]
- Manuel, G.; Beniamino, R. Hydraulic efficiency of continuous transverse grates for paved areas. J. Irrig. Drain. Eng. 2009, 135, 225–230. [Google Scholar]
- Gómez, M.; Recasens, J.; Russo, B.; Martínez-Gomariz, E. Assessment of inlet efficiency through a 3D simulation: Numerical and experimental comparison. Water Sci. Technol. 2016, 74, 1926–1935. [Google Scholar] [CrossRef] [PubMed]
- Tellez, J.; Gómez, M.; Russo, B.; Redondo, J.M. Performance assessment of numerical modelling for hydraulic efficiency of a grated inlet. In Proceedings of the 12th Workshop on Synthetic Turbulence Models: Synthetic Flows for Heat and Mass Transfer, Caen, France, 3–4 July 2017; p. 1. [Google Scholar]
- Russo, B.; Gómez, M.; Tellez, J. Methodology to estimate the hydraulic efficiency of nontested continuous transverse grates. J. Irrig. Drain. Eng. 2013, 139, 864–871. [Google Scholar] [CrossRef]
- Gómez, M.; Macchione, F.; Russo, B. Methodologies to study the surface hydraulic behaviour of urban catchments during storm events. Water Sci. Technol. 2011, 63, 2666–2673. [Google Scholar] [CrossRef] [PubMed][Green Version]
- Gómez, M.; Rabasseda, G.H.; Russo, B. Experimental campaign to determine grated inlet clogging factors in an urban catchment of Barcelona. Urban Water J. 2013, 10, 50–61. [Google Scholar] [CrossRef]
- Avci, O.; Ozbulut, O. Threat and vulnerability risk assessment for existing subway stations: A simplified approach. Case Stud. Transp. Policy 2018, 6, 663–673. [Google Scholar] [CrossRef]
- Compton, K.L.; Faber, R.; Ermolieva, T.Y.; Linnerooth-bayer, J.; Nachtnebel, H. Uncertainty and Disaster Risk Management: Modeling the Flash Flood Risk to Vienna and Its Subway System; International Institute for Applied Systems Analysis (IIASA): Laxenburg, Austria, 2009; ISBN 9783704501486. [Google Scholar]
- Chanson, H.; Brown, R. Stability of individuals during urban inundations: What should we learn from field observations? Geosciences 2018, 8, 341. [Google Scholar] [CrossRef]
- Ishigaki, T.; Onishi, Y.; Asai, Y.; Toda, K.; Shimada, H. Evacuation criteria during urban flooding in underground space. In Proceedings of the 11th International Conference on Urban Drainage Modelling, Palermo, Italy, 23–26 September 2008; p. 7. [Google Scholar]
- Ishigaki, T.; Asai, Y.; Nakahata, Y.; Shimada, H.; Baba, Y.; Toda, K. Assessment of safety on evacuation route during underground flooding. In Proceedings of the 16th APD-IAHR, Nanjing, China, 20–23 October 2008; pp. 141–146. [Google Scholar]
- Ishigaki, T.; Baba, Y.; Toda, K.; Inoue, K. Experimental study on evacuation from underground space in urban flood. In Proceedings of the 31st IAHR Congress, Seoul, Korea, 1 September 2005. [Google Scholar]
- Ishigaki, T.; Asai, Y.; Nakahata, Y.; Shimada, H.; Baba, Y.; Toda, K. Evacuation of aged persons from inundated underground space. Water Sci. Technol. 2010, 62, 1807–1812. [Google Scholar] [CrossRef]
- Mizuguchi, M.; Kasuya, T.; Omori, T.; Sawada, M.; Saito, T. Study of potential flooding of underground pedestrian space in the area around Tokyo station. In Proceedings of the Advances in Underground Space Development, Singapore, 7–9 November 2012; pp. 258–266. [Google Scholar]
- Demirel, H.; Kompil, M.; Nemry, F. A framework to analyse the vulnerability of European road networks due to Sea-Level Rise (SLR) and sea storm surges. Transp. Res. Part A Policy Pract. 2015, 81, 62–76. [Google Scholar] [CrossRef]
- TMB. Dades Bàsiques/Metro System Basic Data 2019; Transports Metropolitans de Barcelona: Barcelona, Spain, 2019; p. 1. [Google Scholar]
- Chang, T.J.; Wang, C.H.; Chen, A.S.; Djordjević, S. The effect of inclusion of inlets in dual drainage modelling. J. Hydrol. 2018, 559, 541–555. [Google Scholar] [CrossRef]
- Dünkeloh, A.; Jacobeit, J. Circulation dynamics of Mediterranean precipitation variability 1948–1998. Int. J. Climatol. 2003, 23, 1843–1866. [Google Scholar] [CrossRef]
- Casas Castillo, M.; Rodríguez Solá, R.; Navarro, X.; Redaño Xipell, Á. Influencia del Cambio Climático en las Curvas IDF y en la Lluvia de Diseño del Área Metropolitana de Barcelona. Segundo Informe Para el Proyecto SW0801. 2010. Available online: https://upcommons.upc.edu/handle/2117/15055?show=full (accessed on 17 January 2020).
- Balbastre-Soldevila, R.; García-Bartual, R.; Andrés-Doménech, I. A comparison of design storms for urban drainage system applications. Water 2019, 11, 757. [Google Scholar] [CrossRef]
© 2020 by the authors. Licensee MDPI, Basel, Switzerland. This article is an open access article distributed under the terms and conditions of the Creative Commons Attribution (CC BY) license (http://creativecommons.org/licenses/by/4.0/).