Assessment of Urban Flood Resilience in Barcelona for Current and Future Scenarios. The RESCCUE Project

 ,
,  , , , ,
Abstract
1. Introduction
2. Materials and Methods
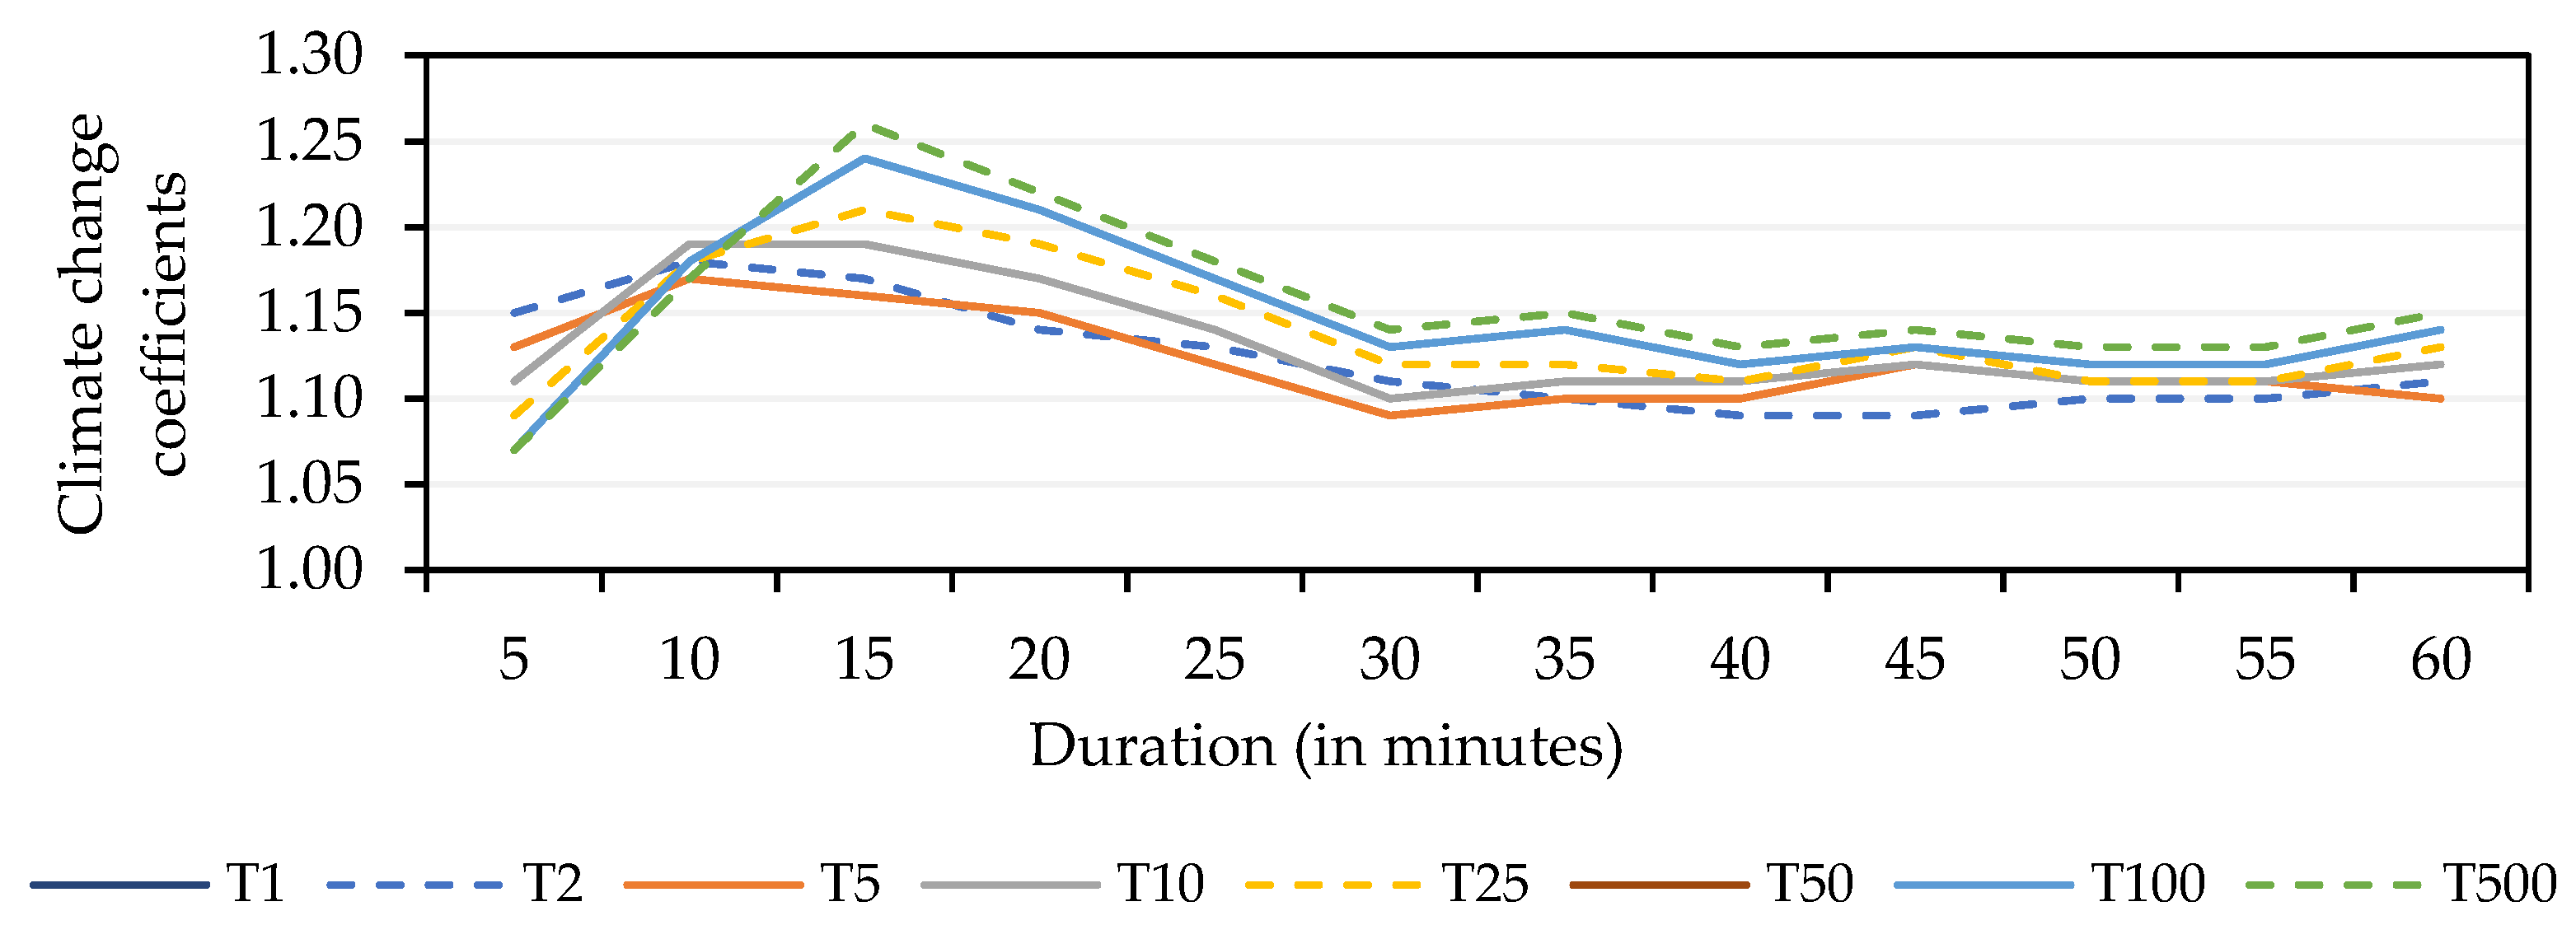
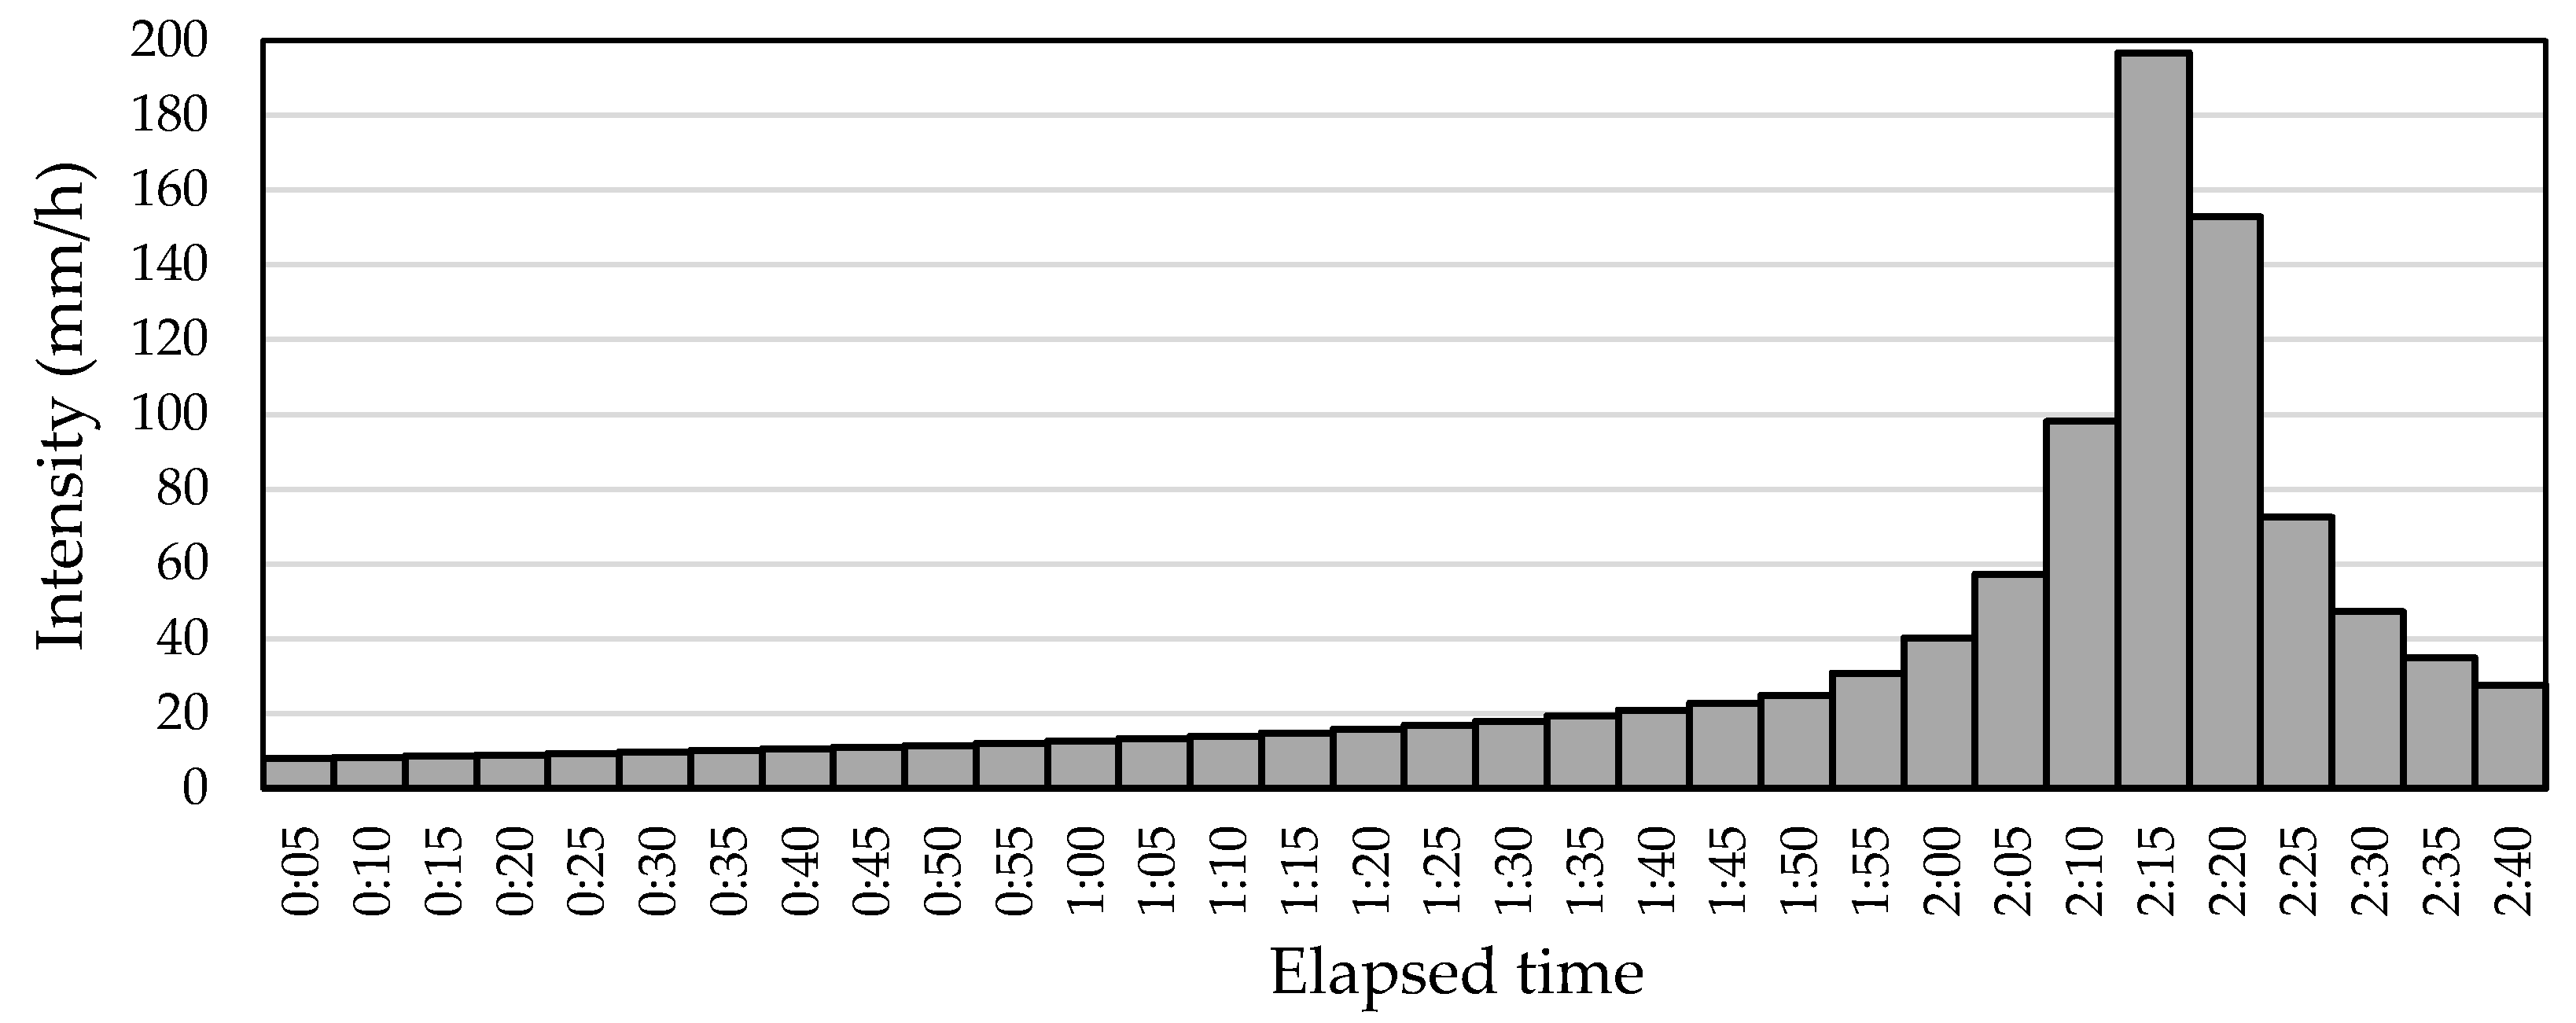
2.1. The Effects of Climate Change on Maximum Rainfall Intensity in Barcelona
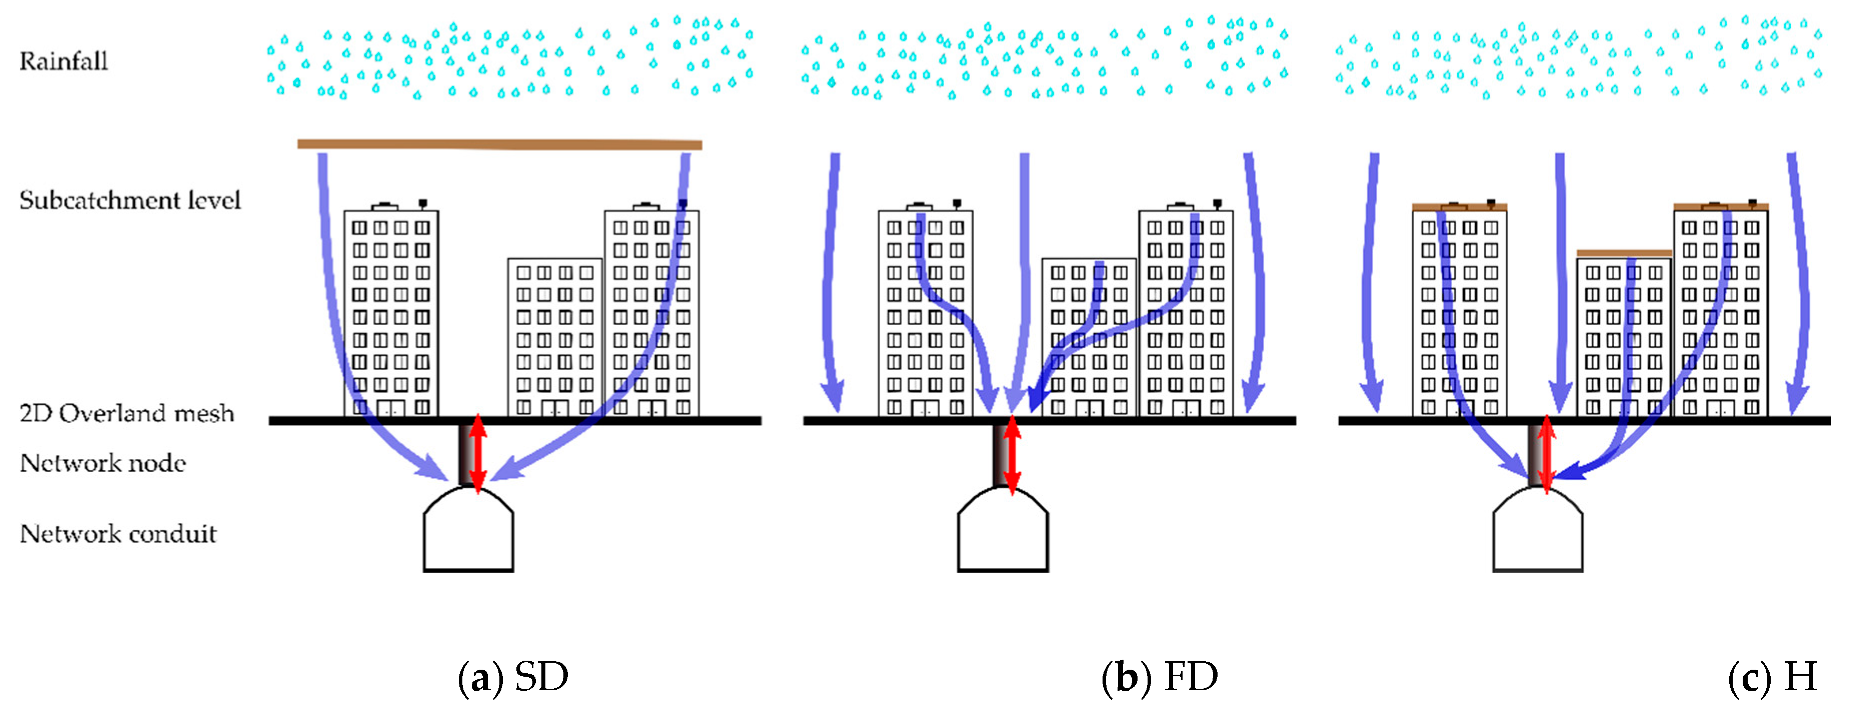
2.2. 1D/2D Coupled Approaches for Urban Pluvial Modelling
2.3. Barcelona Semi-Distributed 1D/2D USM
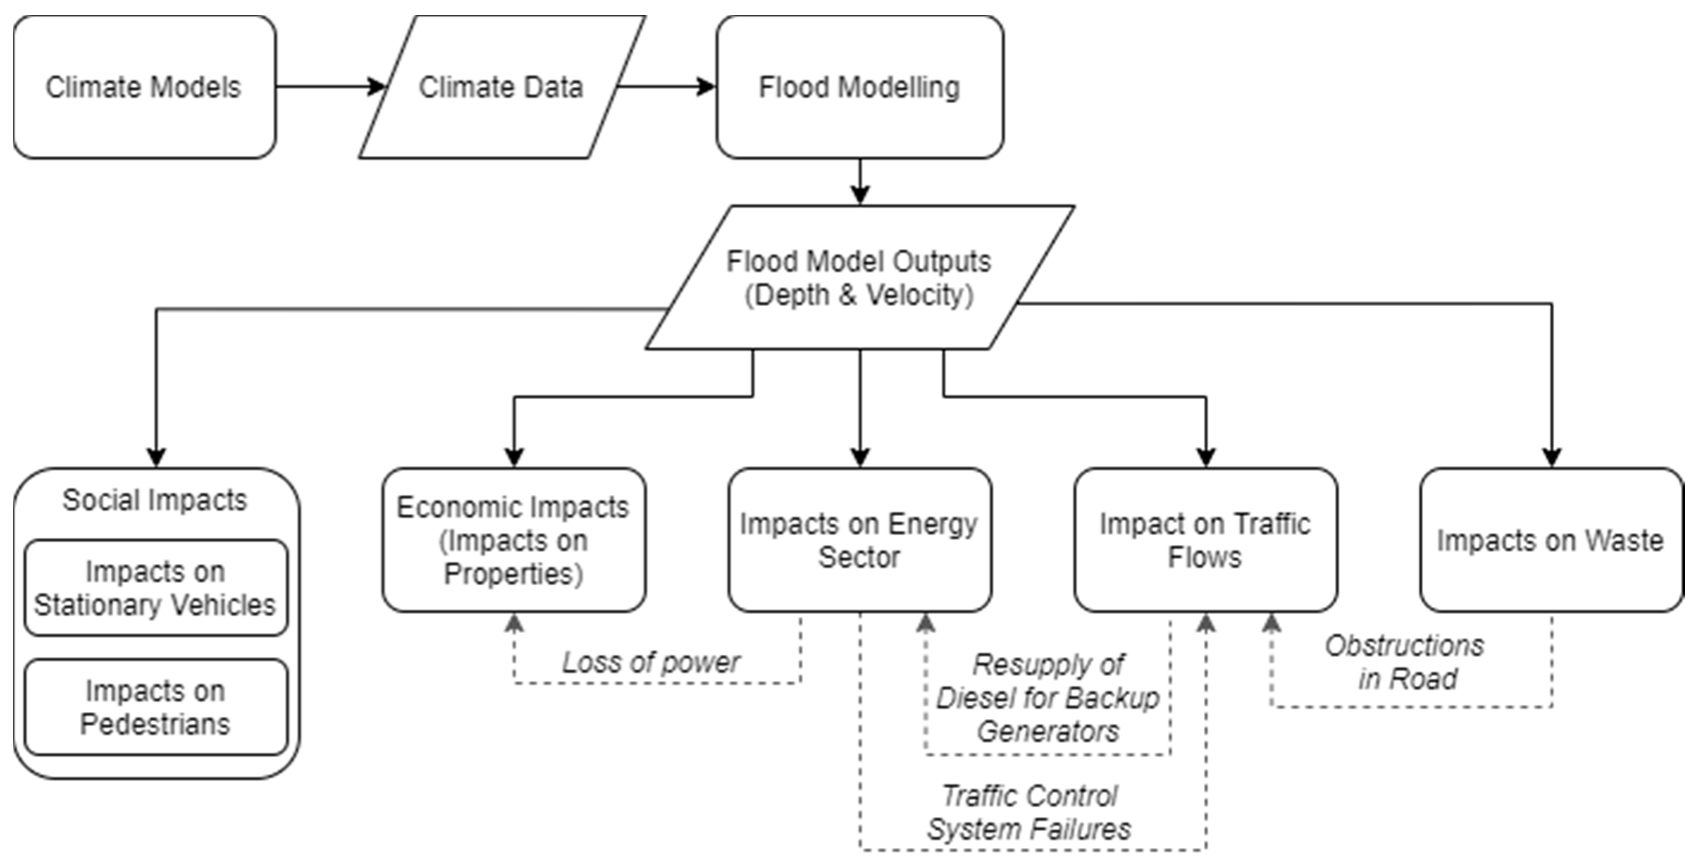
2.4. Modeling of the Effects of Pluvial Floods on Several Urban Services
2.5. Social Flood Impacts Model
2.6. Economic Flood Impacts Models
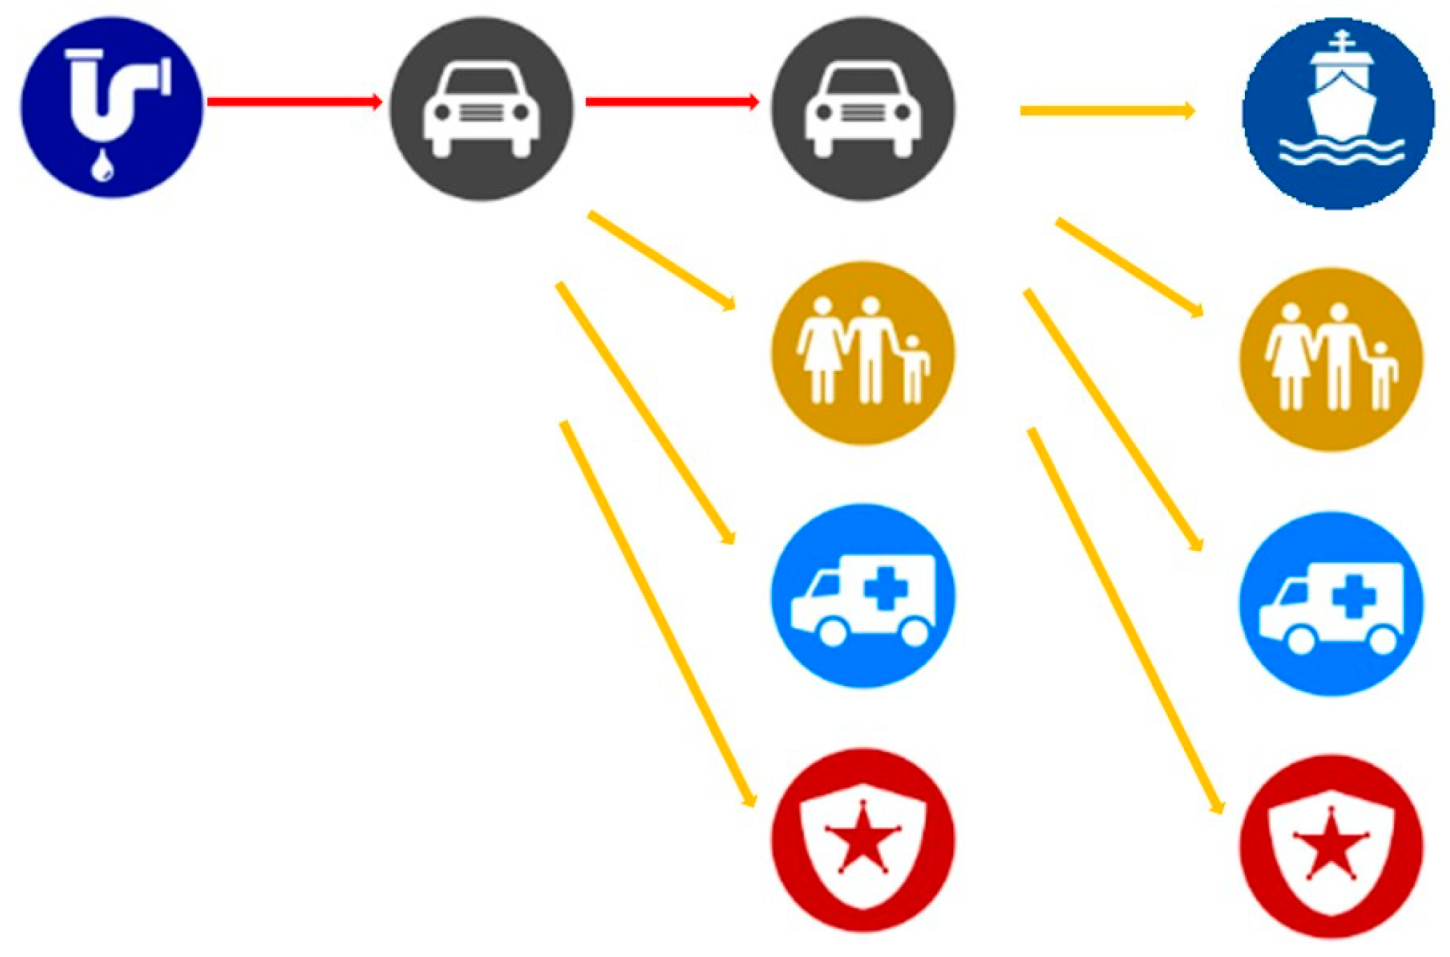
2.7. Integrated Flooding–Surface Traffic Model
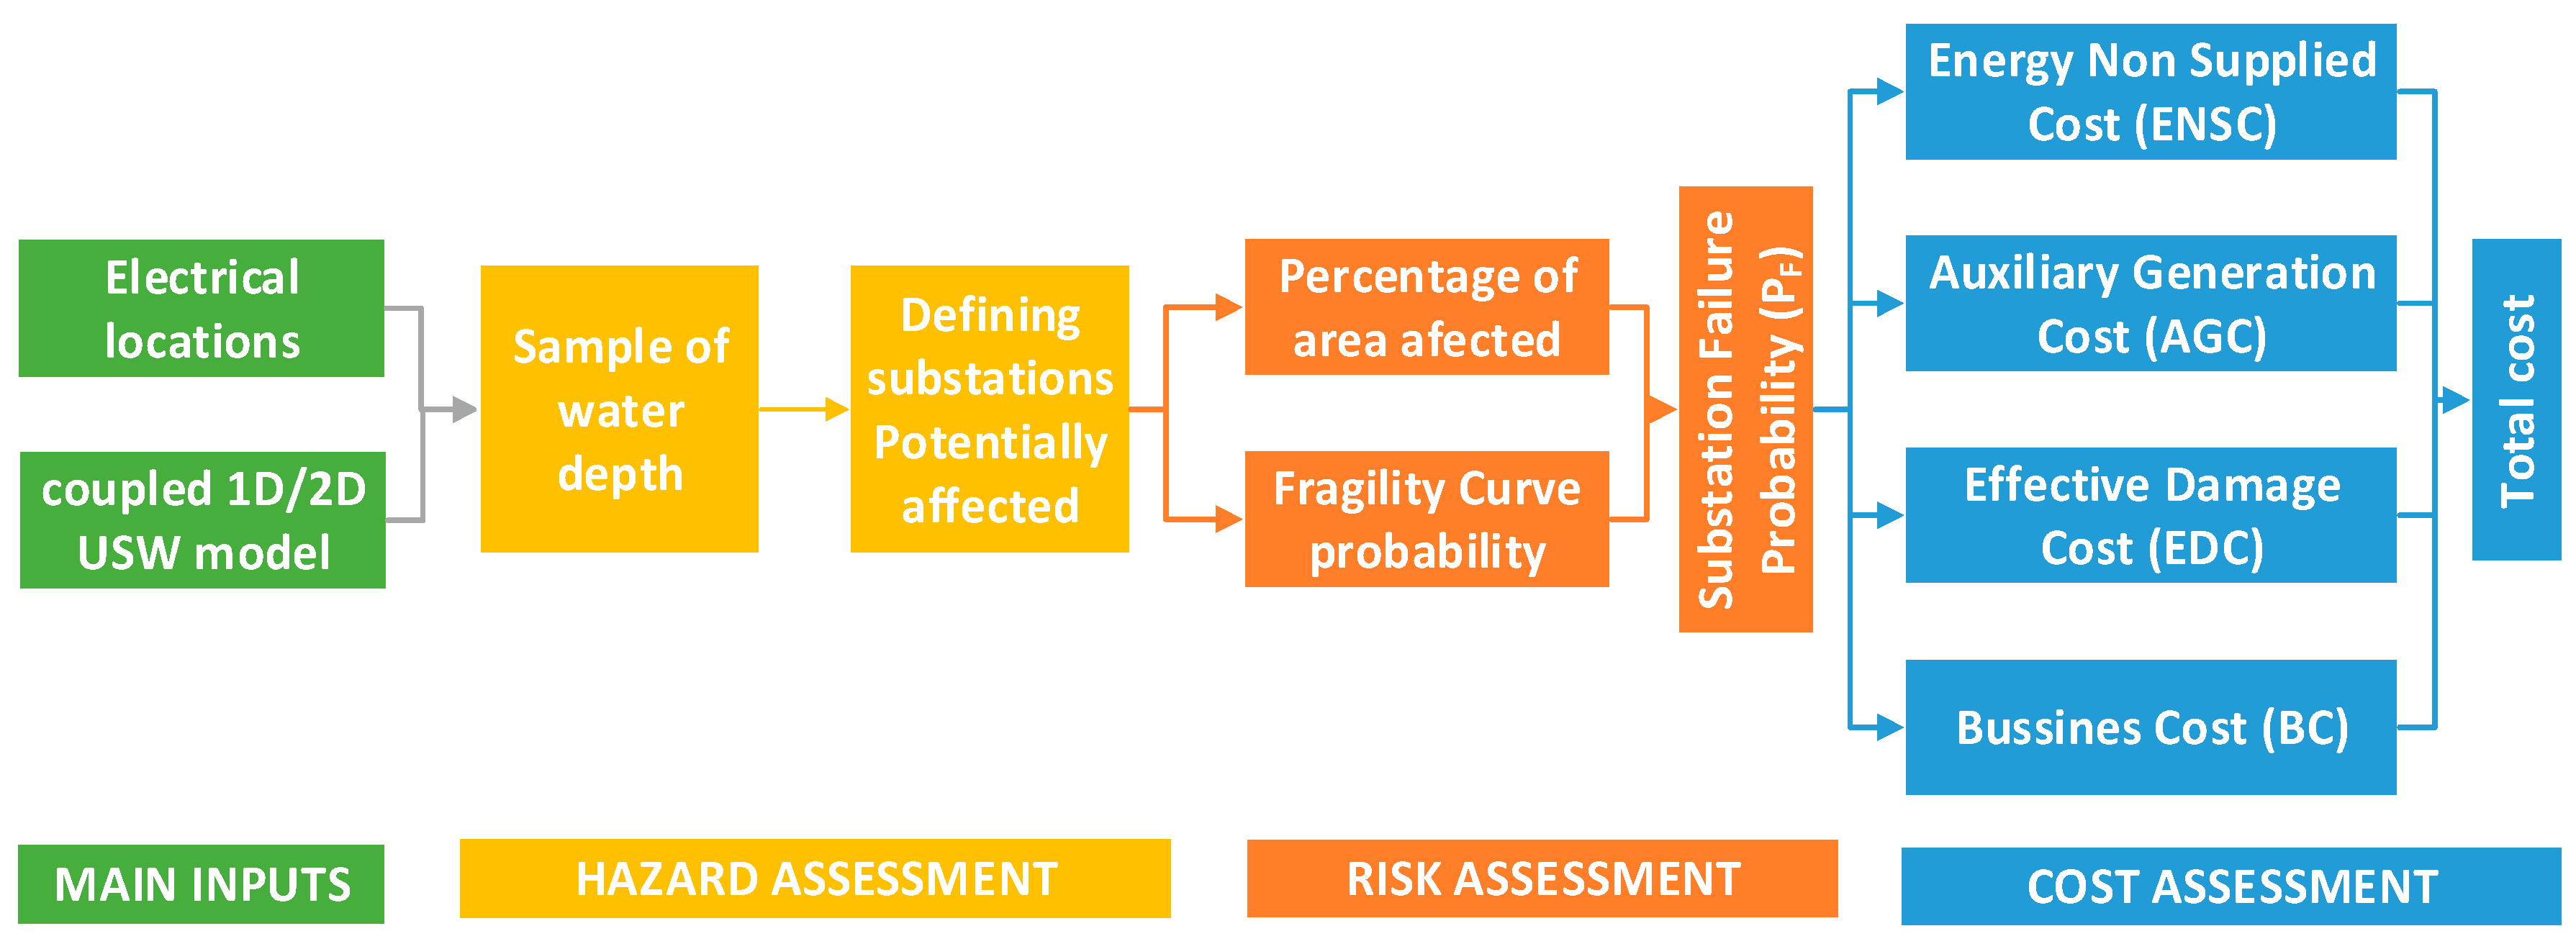
2.8. Integrated Flooding–Electric System Model
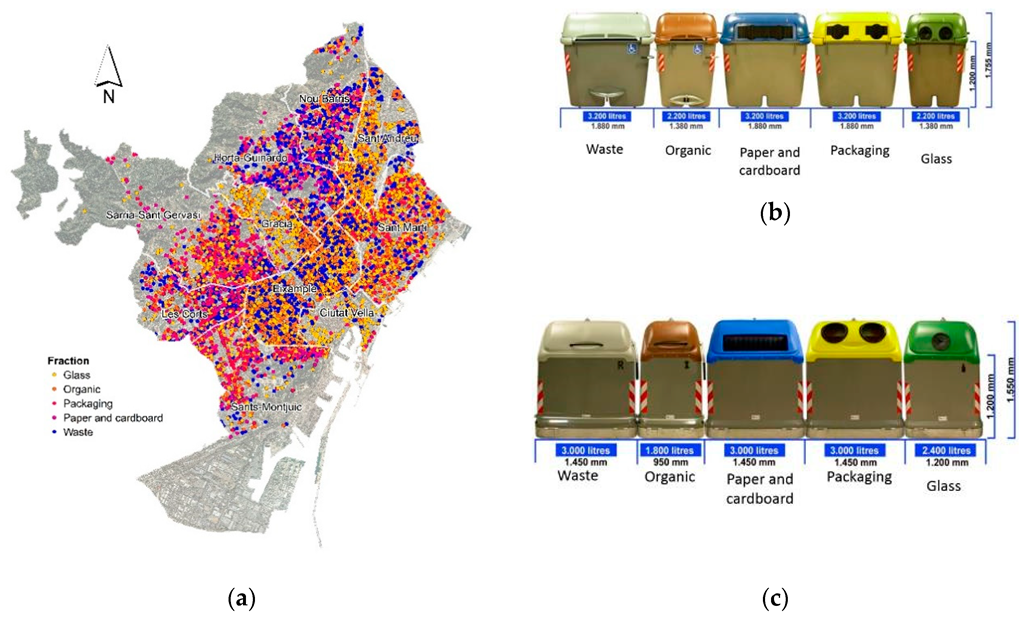
2.9. Integrated Flooding–Waste Collection System Model
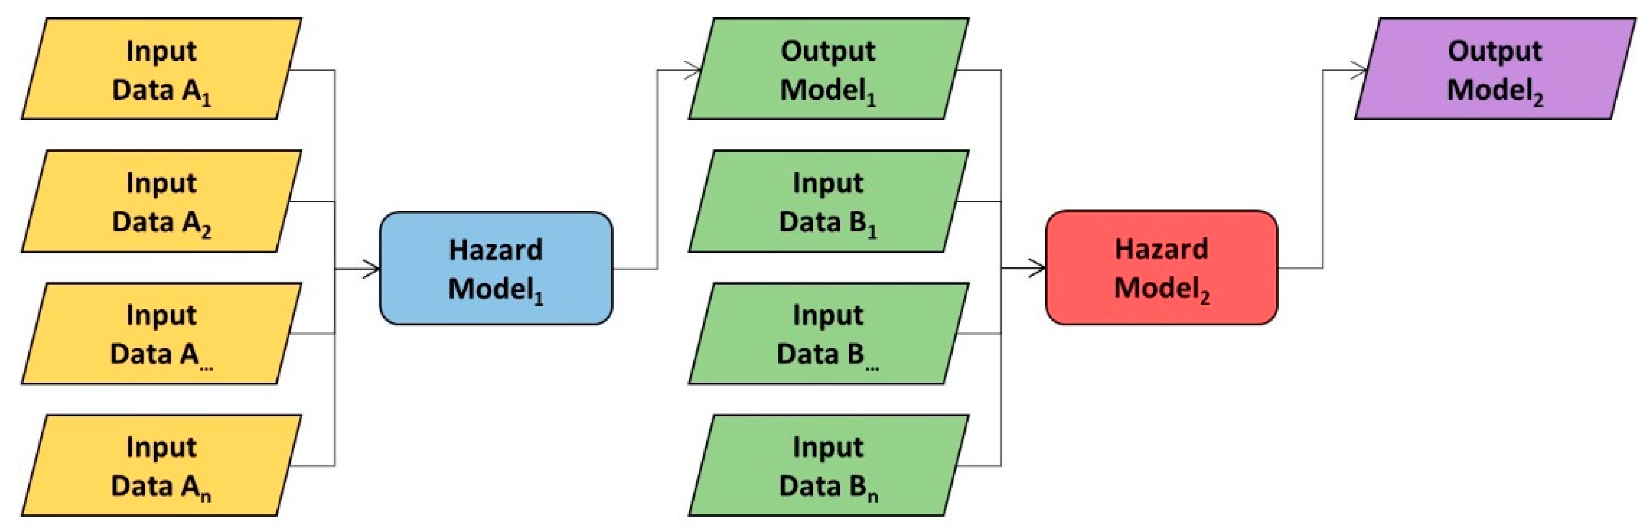
2.10. Holistic Model of Urban Resilience
3. Results
3.1. Assessment of Social Impacts Produced by Pluvial Floods
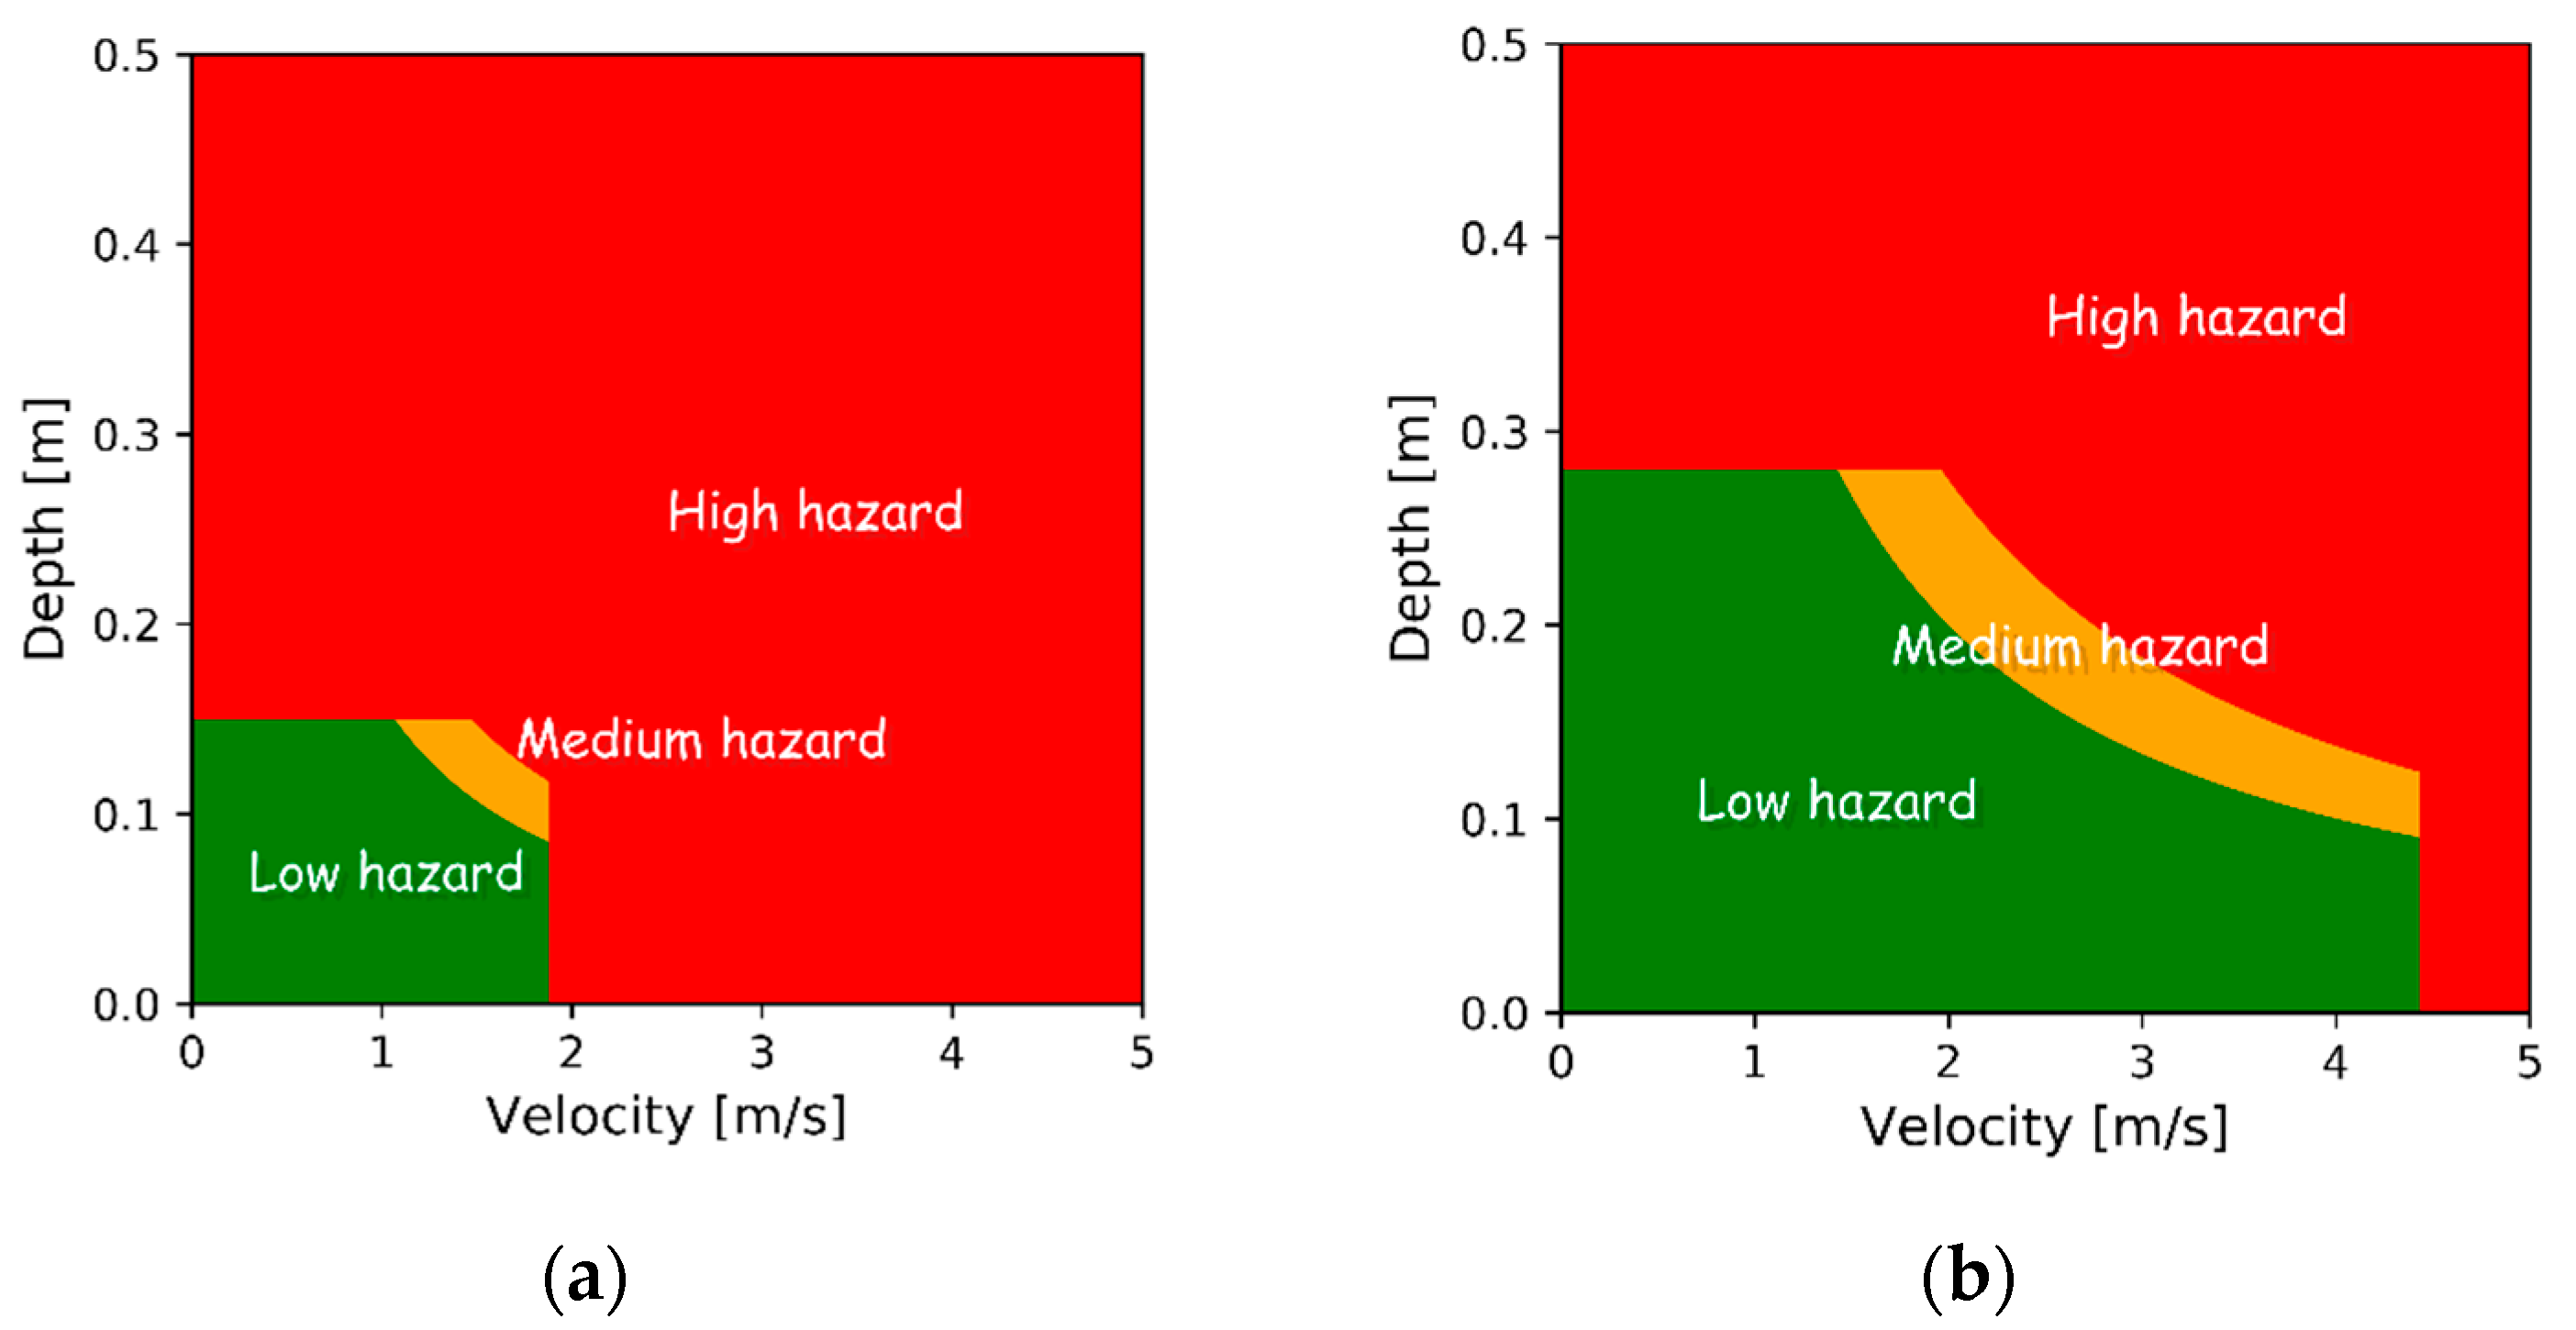
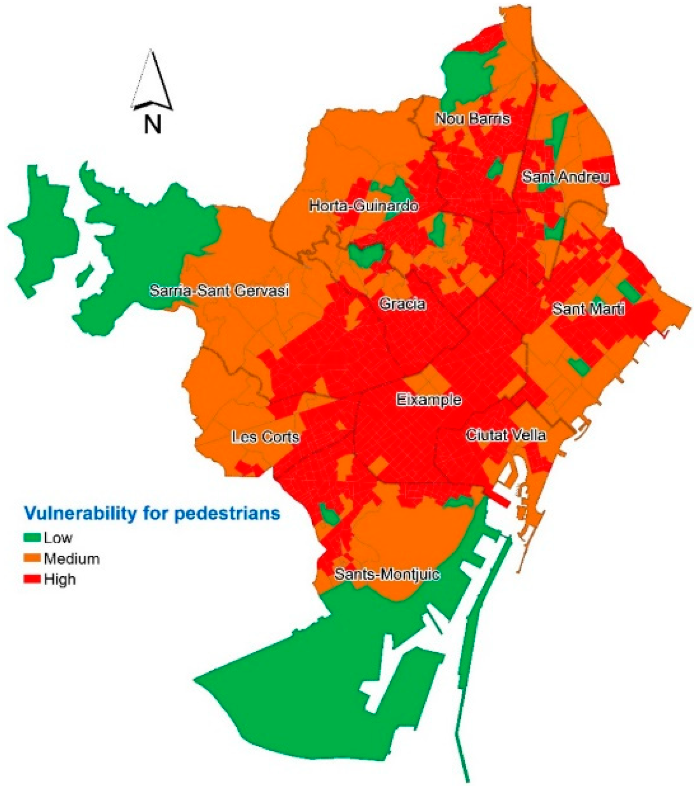
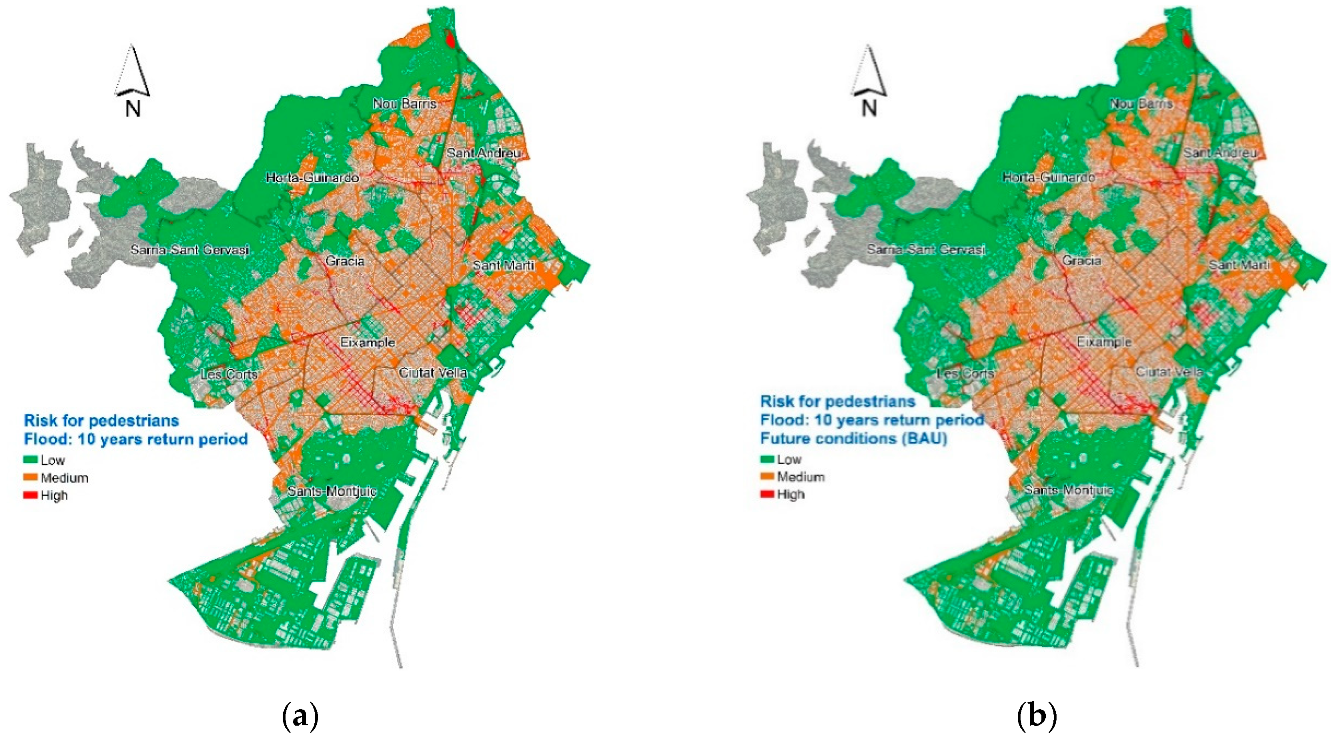
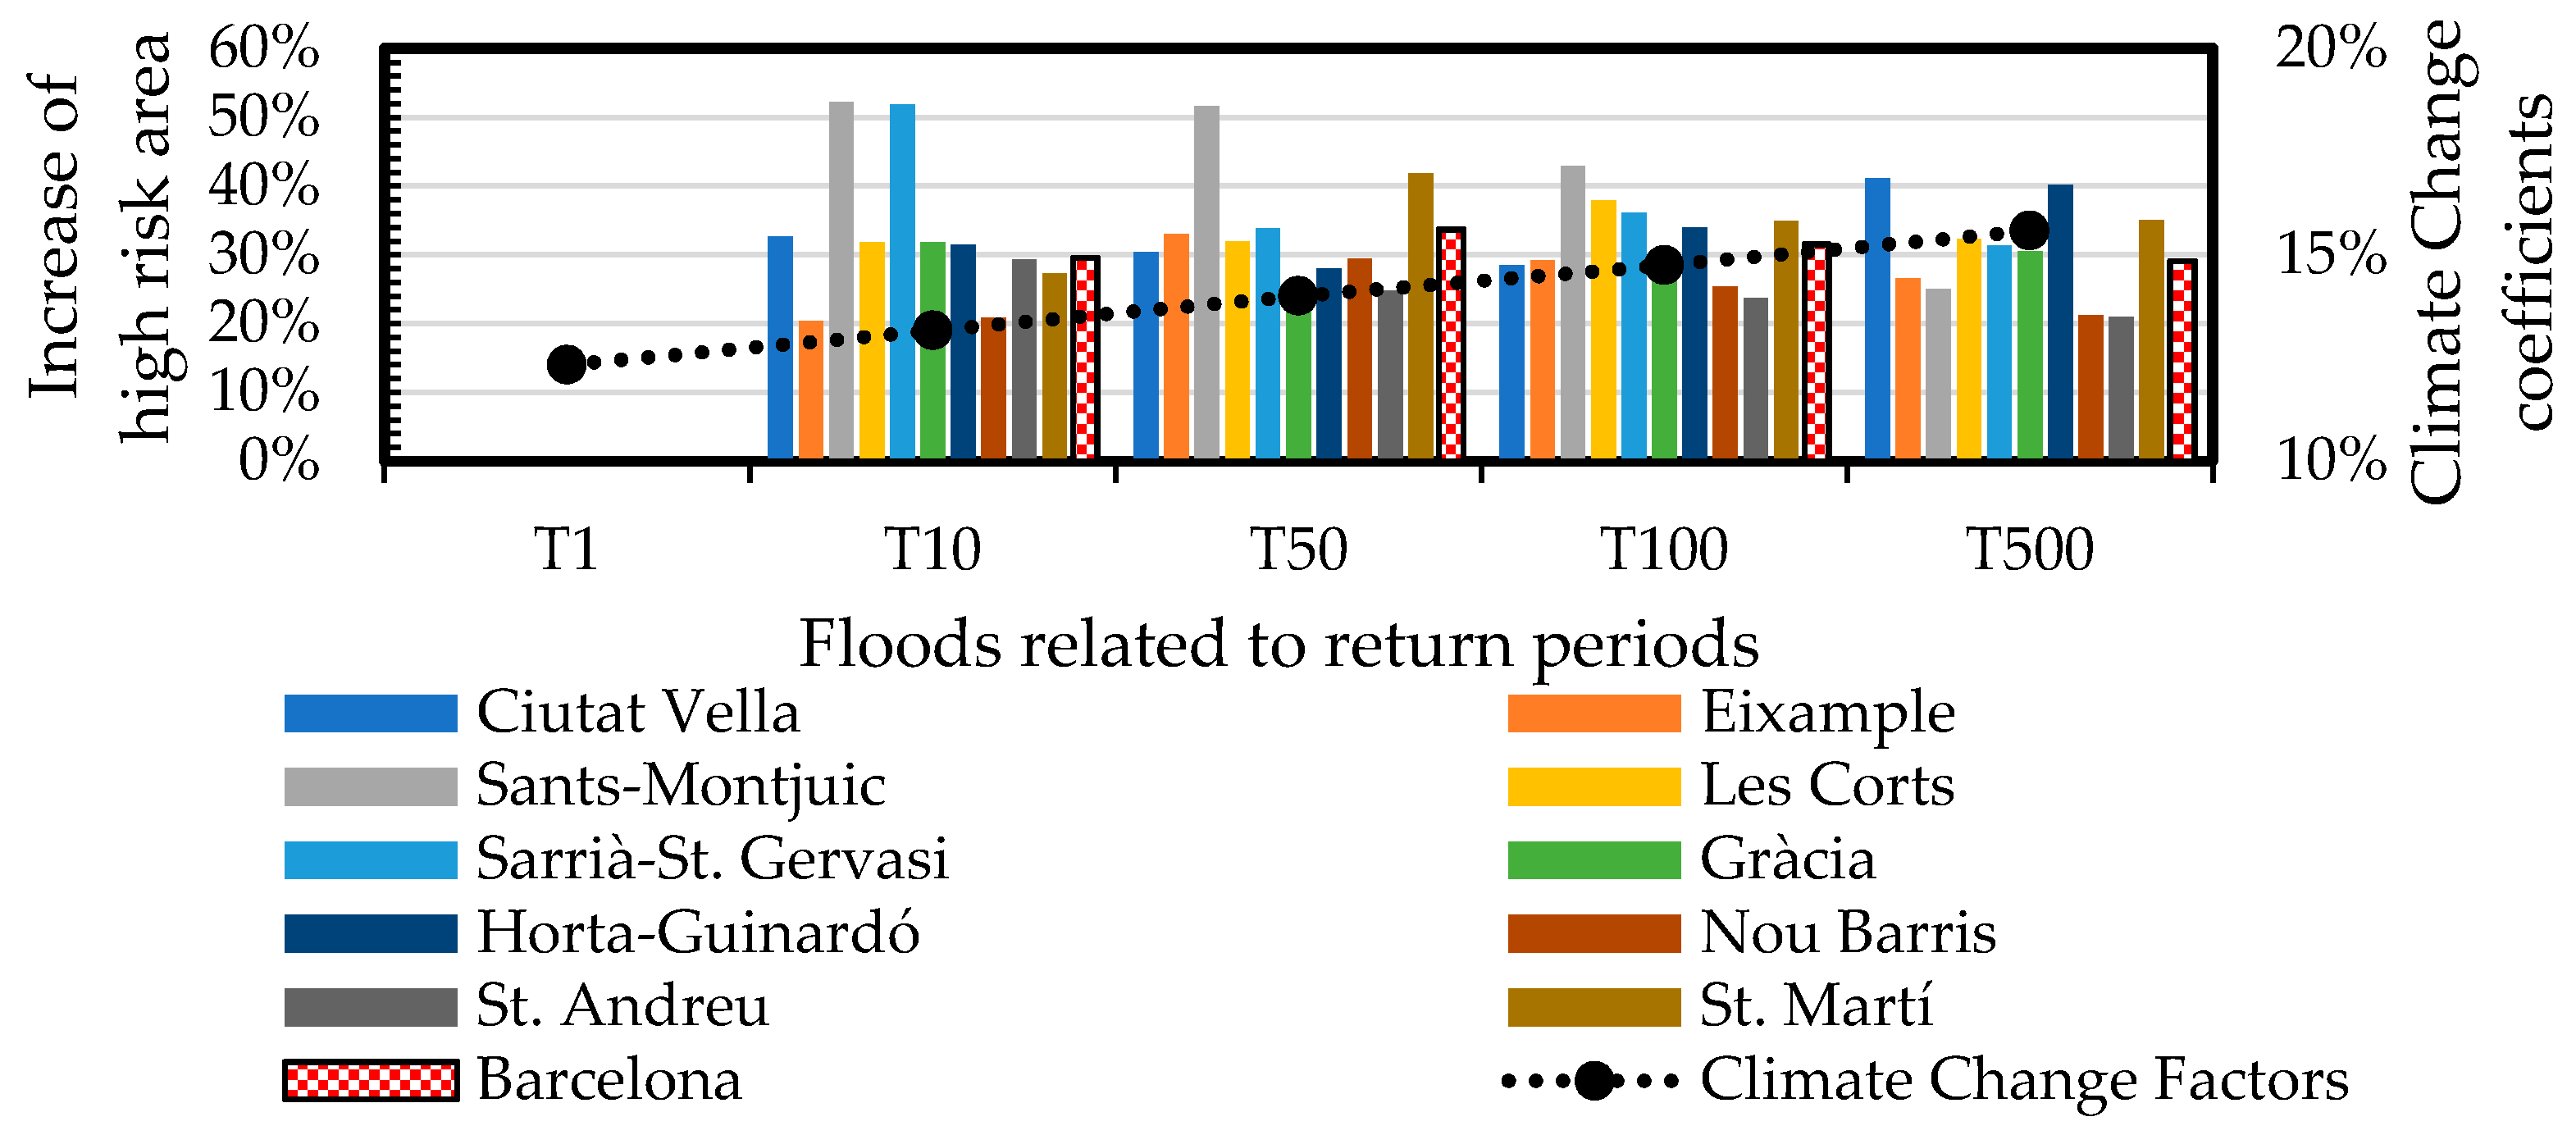
3.1.1. Flood Risk for Pedestrians
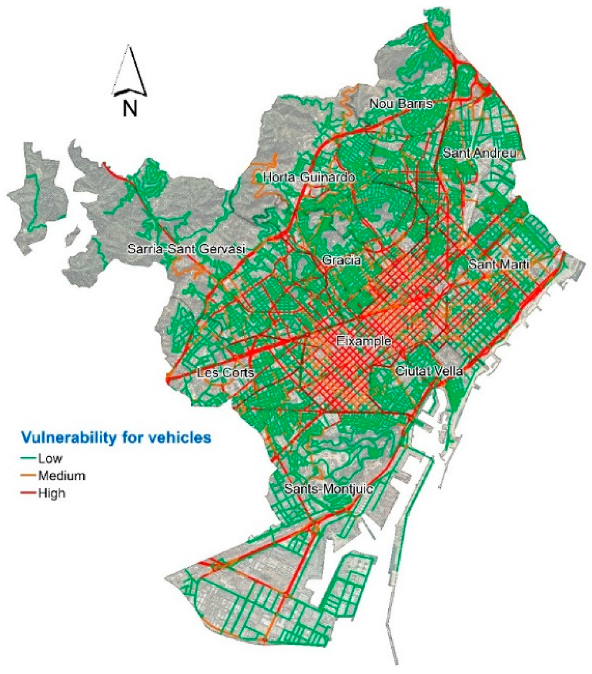
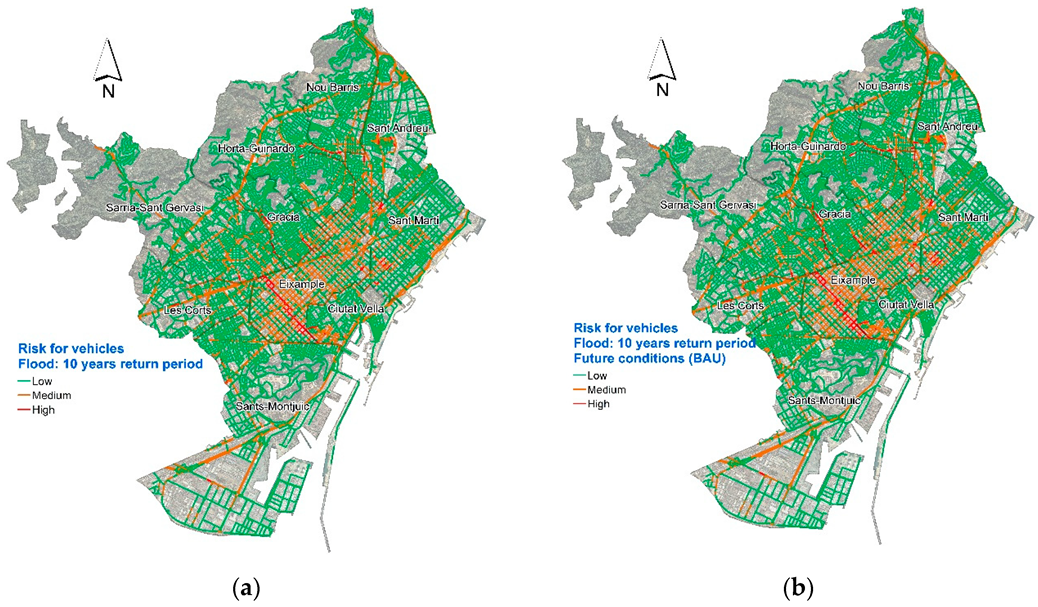
3.1.2. Flood Risk for Vehicles
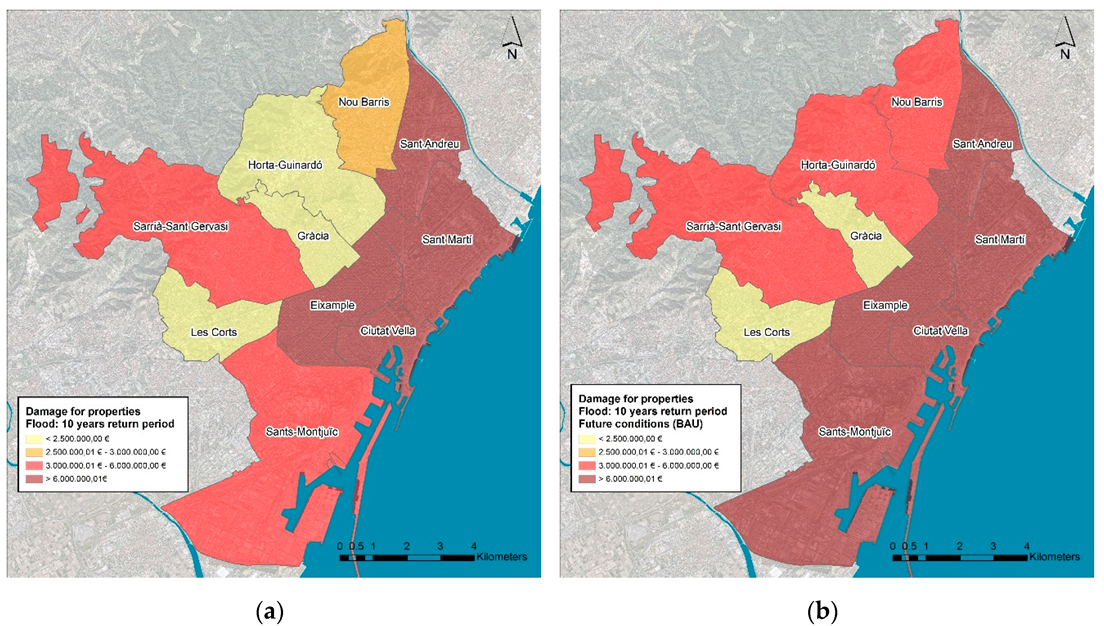
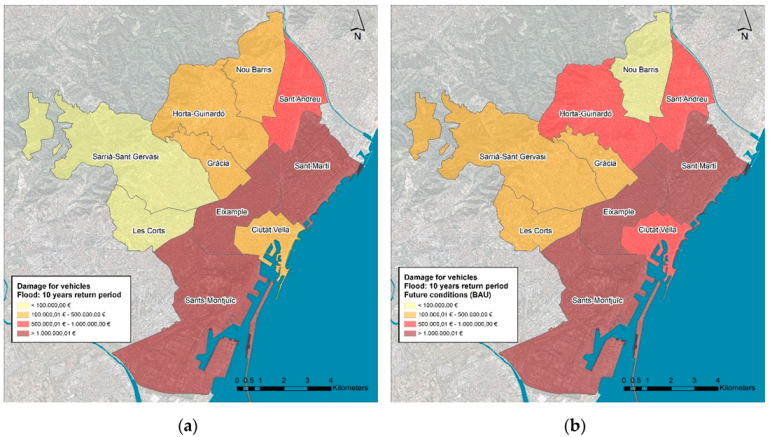
3.2. Assessment of Economic Impacts Produced by Pluvial Floods
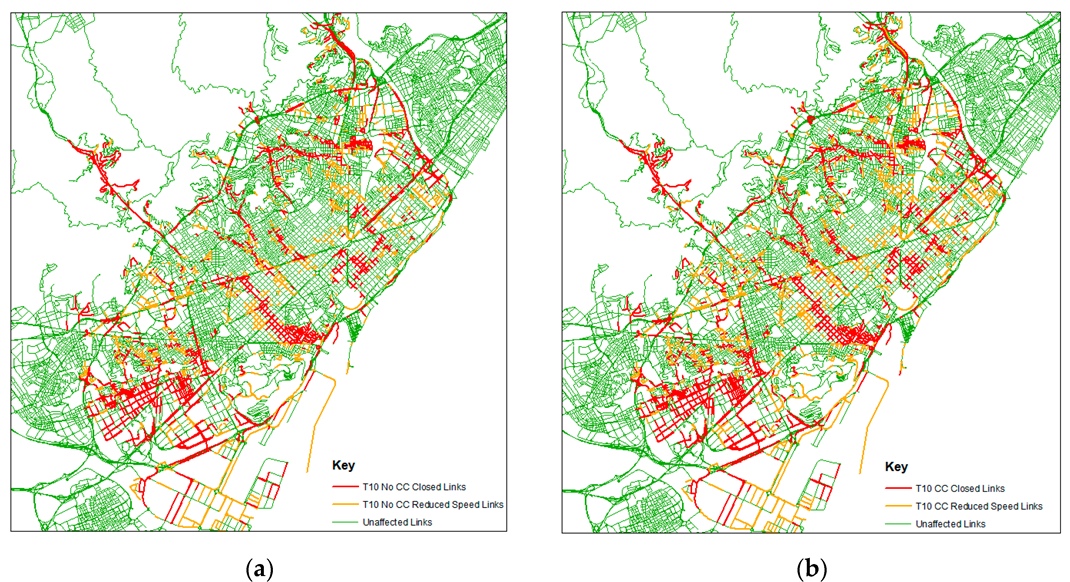
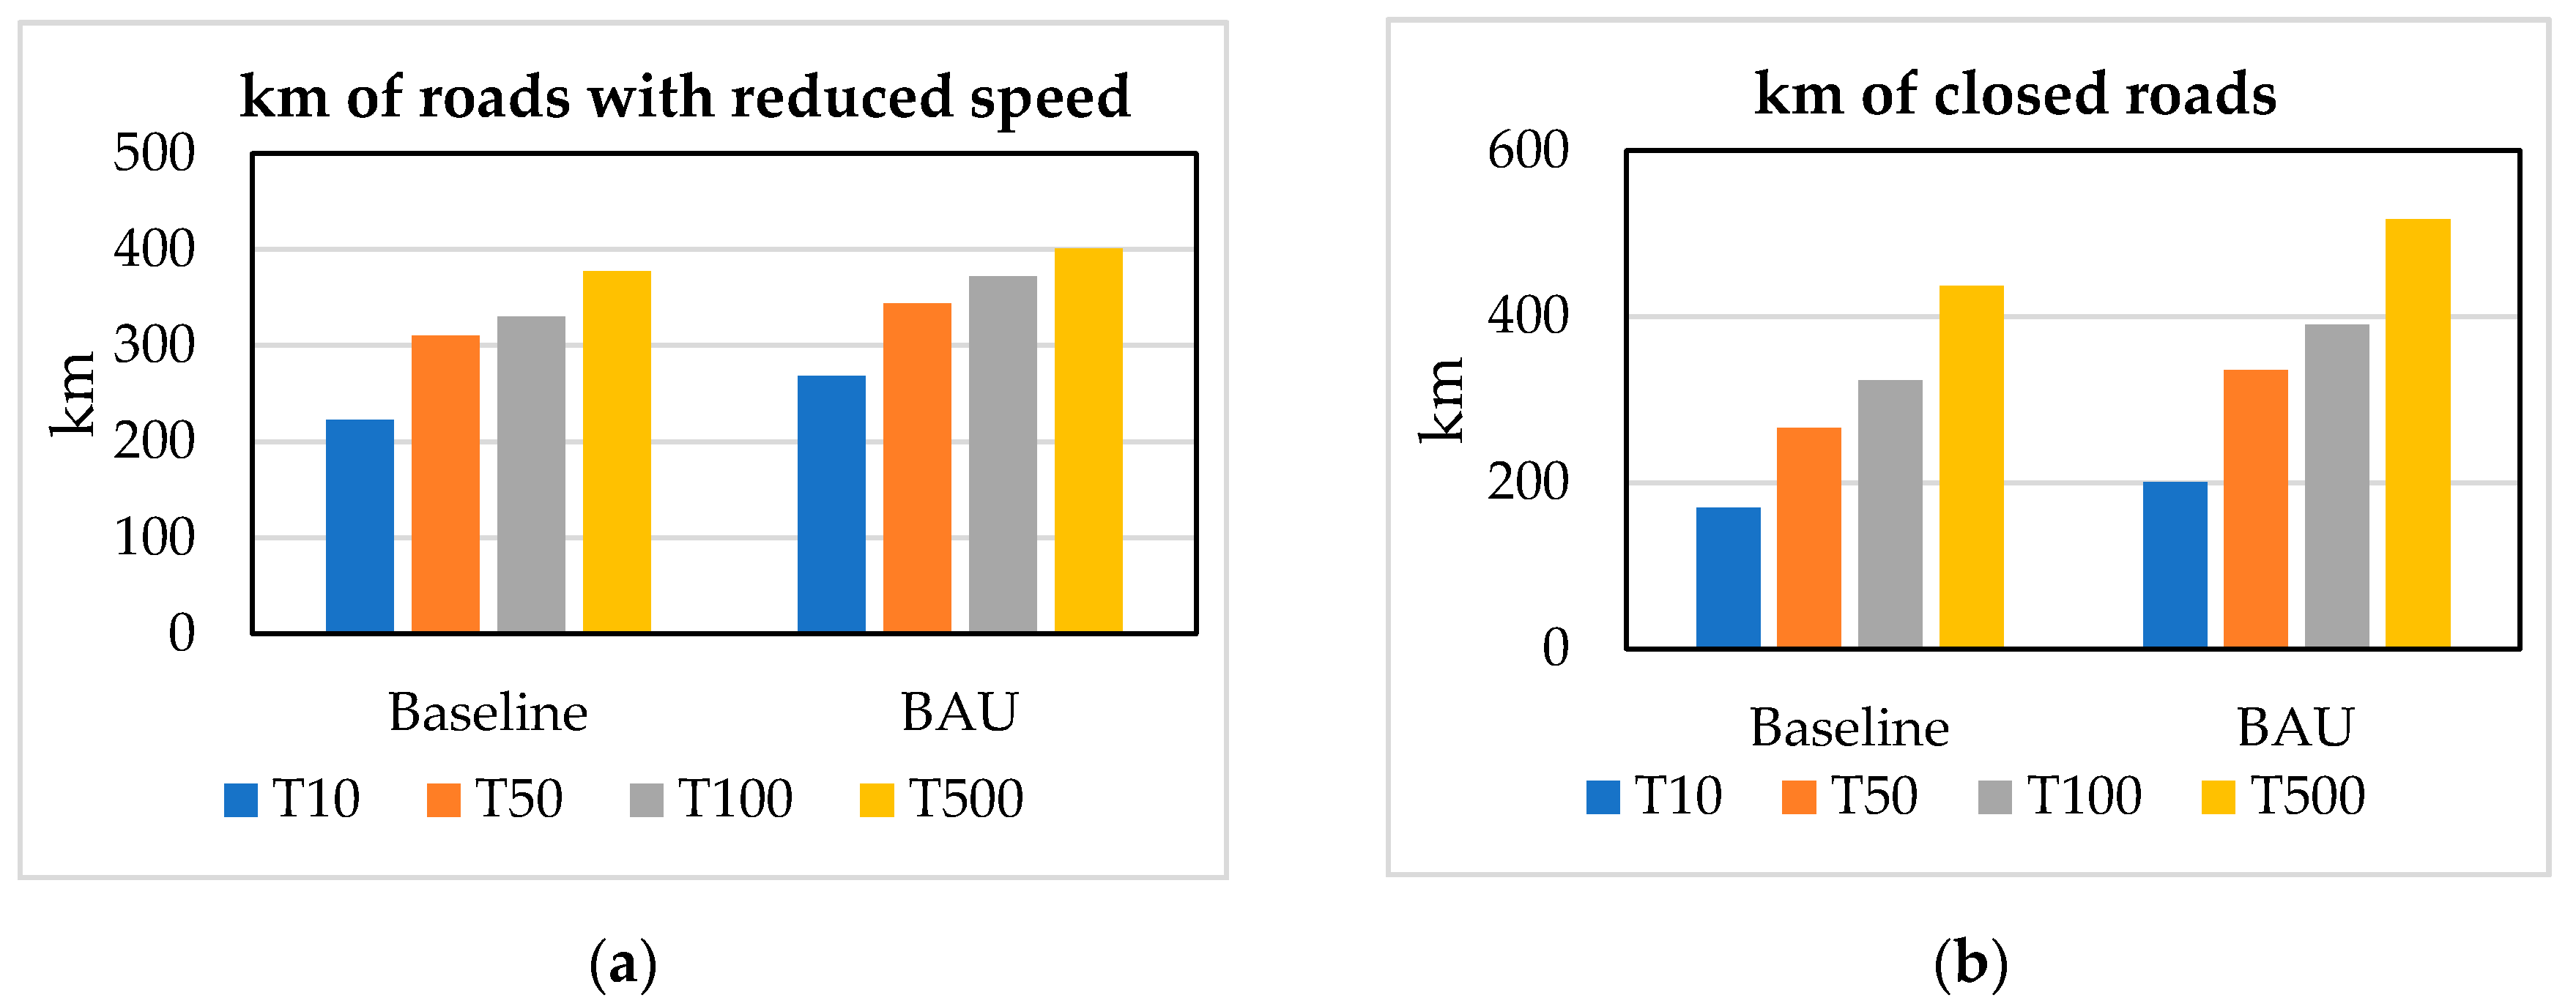
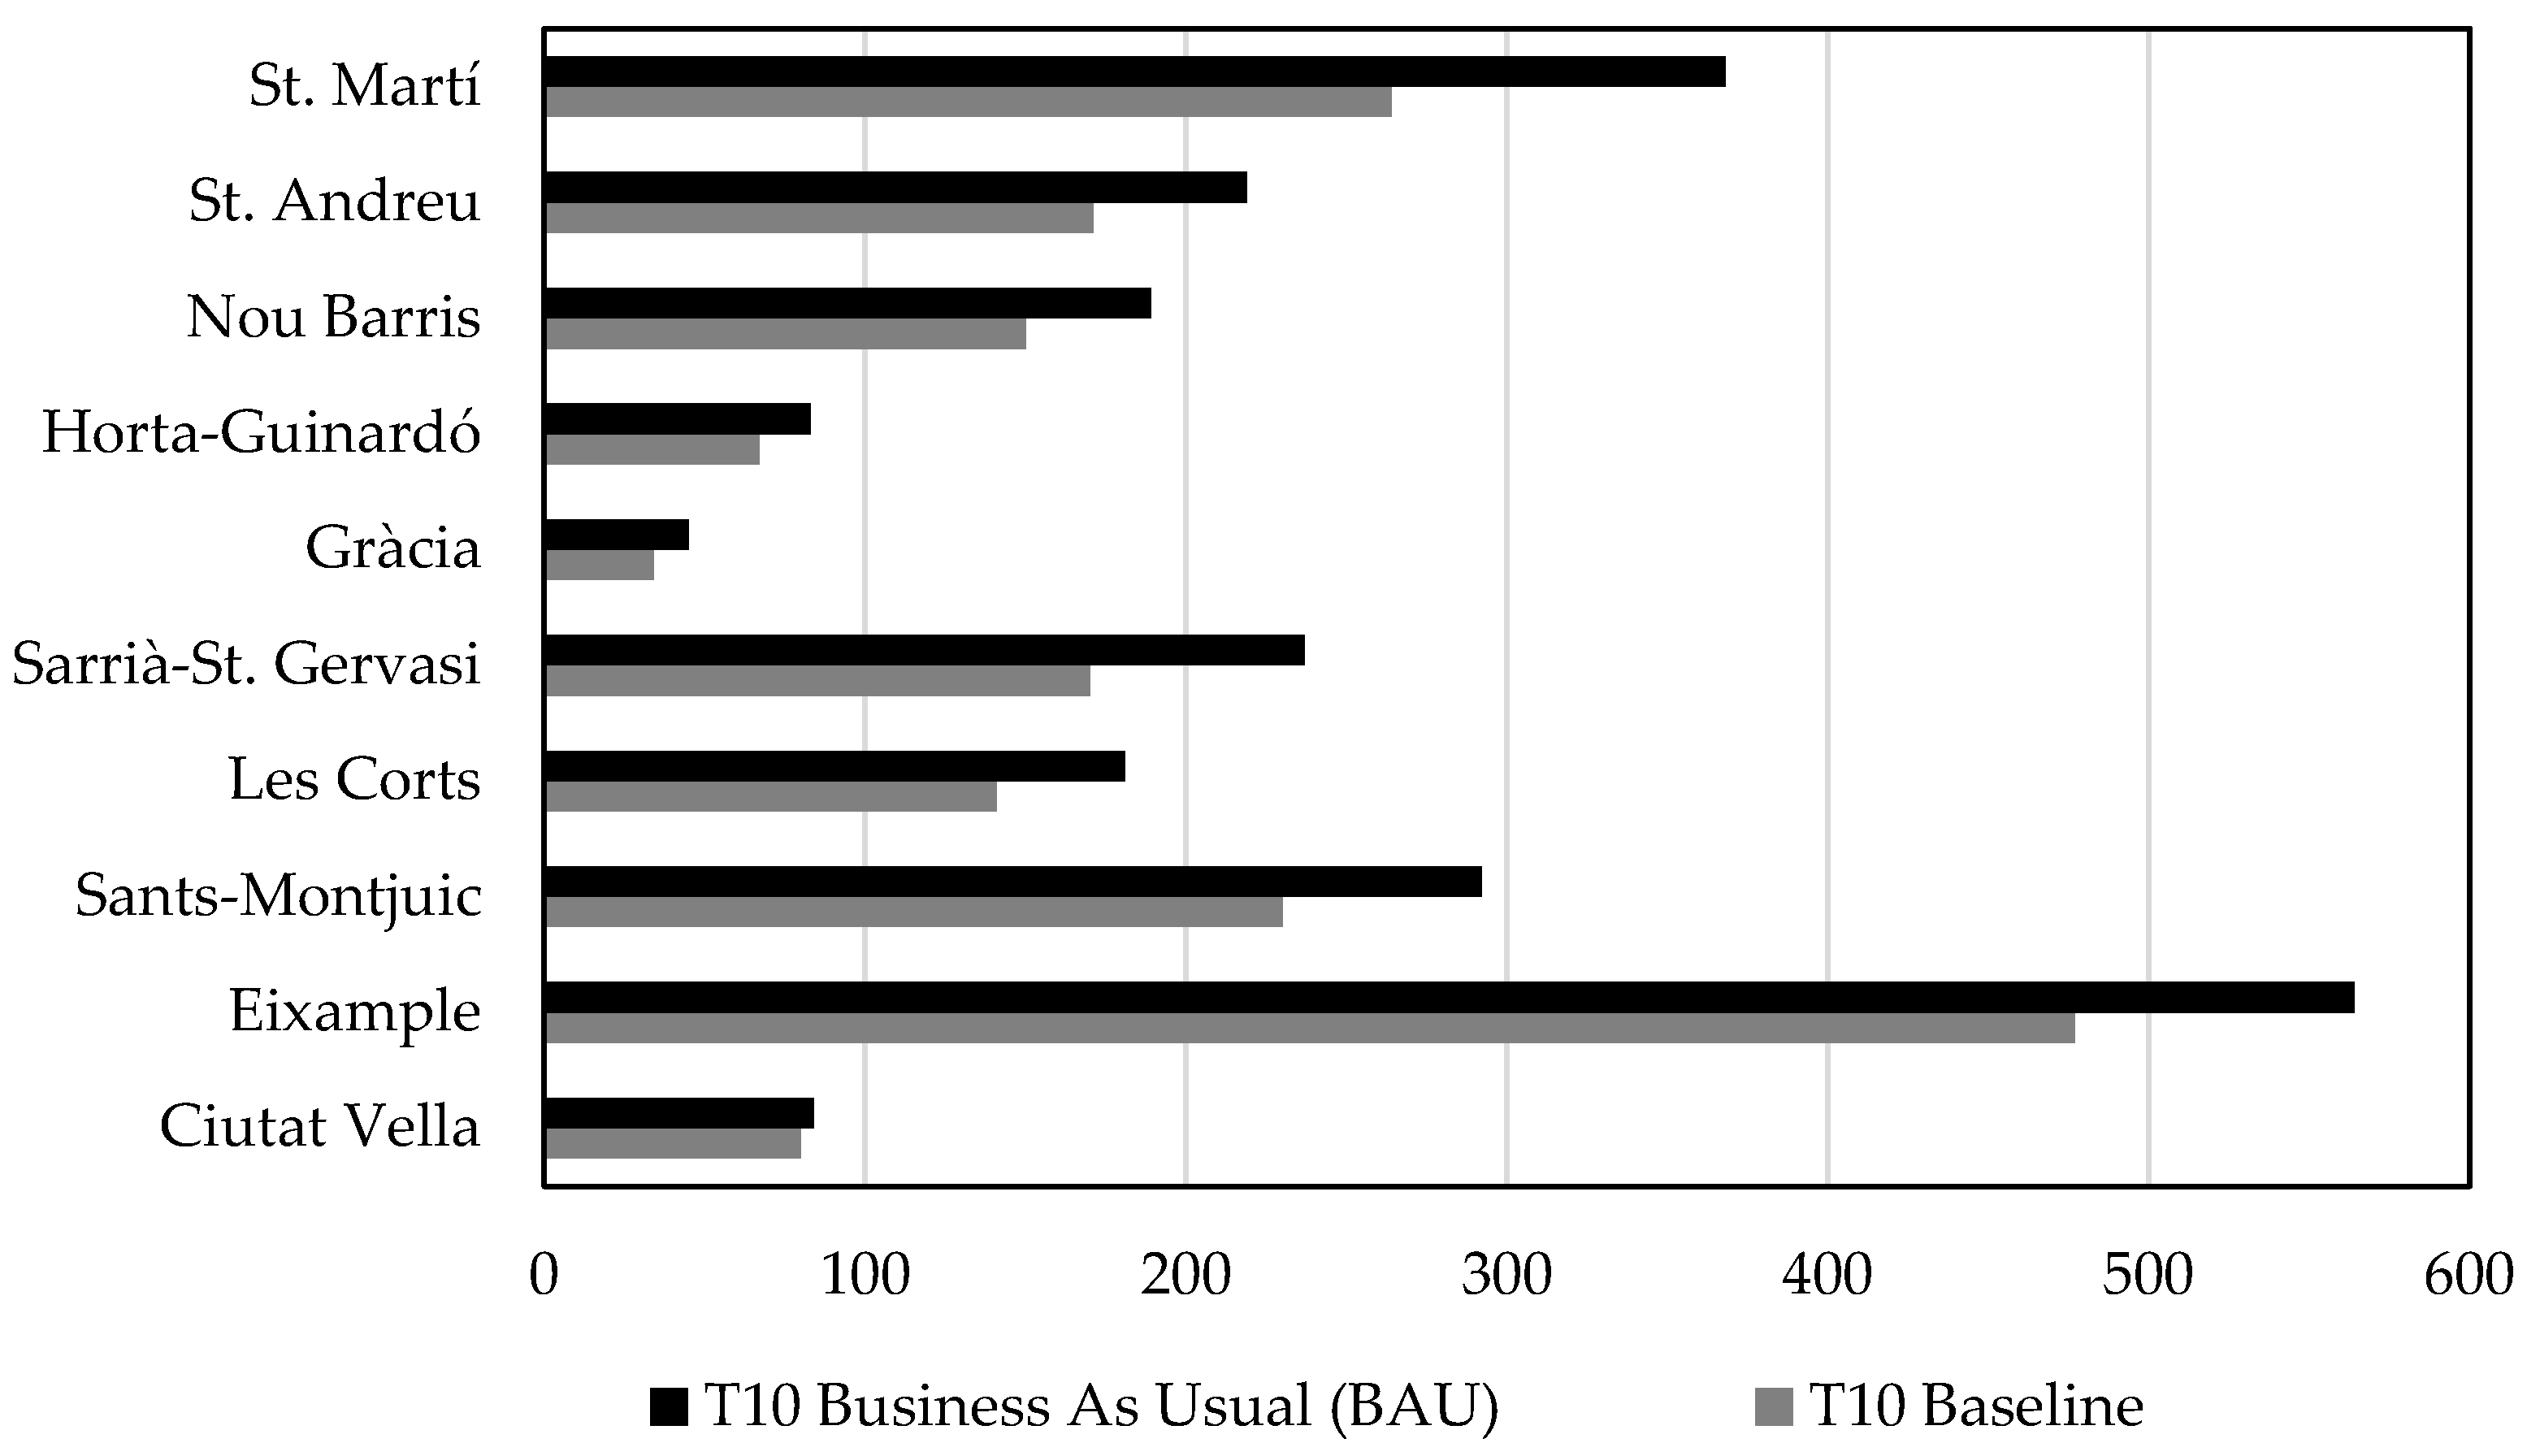
3.3. Assessment of the Effects of Pluvial Floods on the Surface Traffic Service
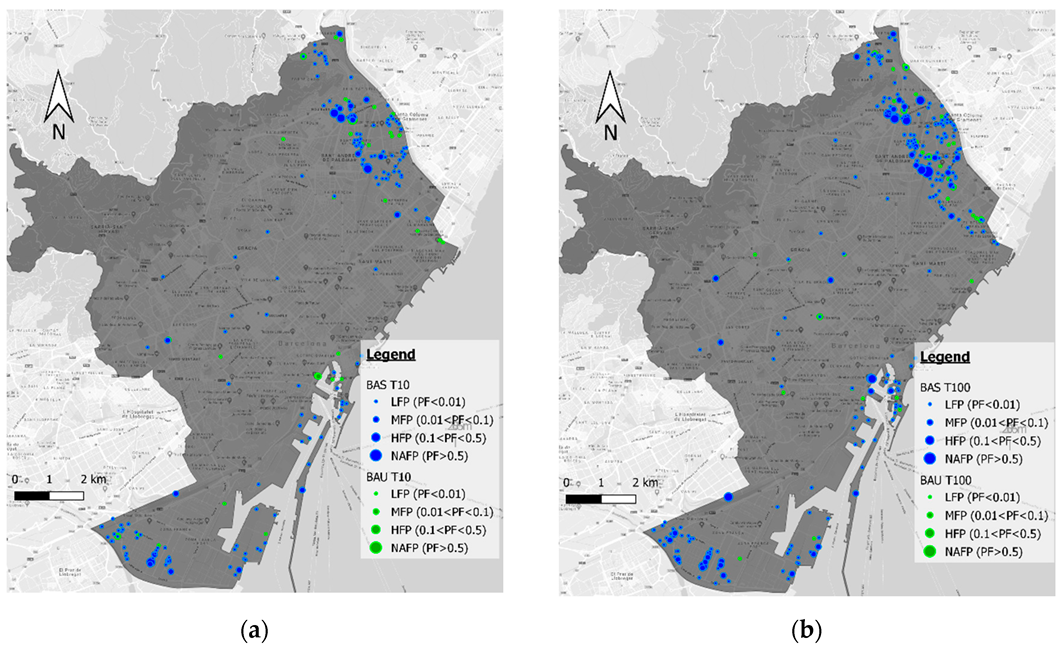
3.4. Assessment of the Effects of Pluvial Floods on the Electric System
3.5. Assessment of the Effects of Pluvial Floods on Waste Collection System
3.6. Assessment of Flood Resilience through a Holistic Approach
4. Discussion
5. Conclusions
Author Contributions
Funding
Acknowledgments
Conflicts of Interest
References
- Meerow, S.; Newell, J.P.; Stults, M. Defining urban resilience: A review. Landsc. Urban Plan. 2016, 147, 38–49. [Google Scholar] [CrossRef]
- Velasco, M.; Russo, B.; Martínez, M.; Malgrat, P.; Monjo, R.; Djordjevic, S.; Fontanals, I.; Vela, S.; Cardoso, M.A.; Buskute, A. Resilience to cope with climate change in urban areas—A multisectorial approach focusing on water—The RESCCUE project. Water 2018, 10, 1356. [Google Scholar] [CrossRef]
- Walloth, C.; Gurr, J.M.; Schmidt, J.A. Understanding Complex Urban Systems: Multidisciplinary Approaches to Modeling; Springer International Publishing: Cham, Switzerland, 2014; ISBN 978-3-319-02996-2. [Google Scholar]
- Visvizi, A.; Lytras, M. Smart Cities: Issues and Challenges. Mapping Political, Social and Economic Risks and Threats, 1st ed.; Lytras, A., Visvizi, M., Eds.; Elsevier: Amsterdam, The Netherlands, 2019; ISBN 9780128166390. [Google Scholar]
- Calzada, I.; Almirall, E. Data ecosystems for protecting European citizens’ digital rights. Transform. Gov. People Process Policy 2020, 14, 133–147. [Google Scholar] [CrossRef]
- Monjo, R.; Paradinas, C.; Gaitán, E.; Redolat, D.; Prado, C.; Pórtoles, J.; Torres, L.; Russo, B.; Velasco, M.; Pouget, L.; et al. Report on Extreme Events Prediction. Deliverable 1.3, RESCCUE EU H2020 Project. Available online: http://www.resccue.eu/ (accessed on 24 April 2020).
- Hammond, M.J.; Chen, A.S.; Djordjević, S.; Butler, D.; Mark, O. Urban flood impact assessment: A state-of-the-art review. Urban Water J. 2015, 12, 14–29. [Google Scholar] [CrossRef]
- Barcelona City Council. Climate Plan 2018–2030; Urban Ecology: Barcelona, Spain, 2018. [Google Scholar]
- Monjo, R.; Gaitán, E.; Pórtoles, J.; Ribalaygua, J.; Torres, T. Changes in extreme precipitation over Spain using statistical downscaling of CMIP5 projections. Int. J. Climatol. 2016, 36, 757–769. [Google Scholar] [CrossRef]
- Arnbjerg-Nielsen, K. Quantification of climate change effects on extreme precipitation used for high resolution hydrologic design. Urban Water J. 2012, 9, 57–65. [Google Scholar] [CrossRef]
- Russo, B. Multi-Hazards Assessment Related to Water Cycle Extreme Events for Future Scenarios-Business As Usual. Deliverable 2.3; RESCCUE EU H2020 Project. Internal report.
- Hénonin, J.; Russo, B.; Mark, O.; Goubersville, P. Real-time urban flood forecasting and modelling—A state of the art. J. Hydroinform. 2013, 15, 717–736. [Google Scholar] [CrossRef]
- Phillips, B.C.; Yu, S.; Thompson, G.R.; Silva, N. De 1D and 2D Modelling of Urban Drainage Systems using XP-SWMM and TUFLOW. In Proceedings of the 10th International Conference on Urban Drainage, Copenhagen, Denmark, 21–26 August 2005; pp. 21–26. [Google Scholar]
- Lipeme Kouyi, G.; Fraisse, D.; Rivière, N.; Guinot, V.; Chocat, B. 1D modelling of the interactions between heavy rainfall-runoff in urban area and flooding flows from sewer network and river. In Proceedings of the 11th International Conference on Urban Drainage, Edinburgh, UK, 31 August–5 September 2008. [Google Scholar]
- Obermayer, A.; Guenthert, F.W.; Angermair, G.; Tandler, R.; Braunschmidt, S.; Milojevic, N. Different approaches for modelling of sewer caused urban flooding. Water Sci. Technol. 2010, 62, 2175–2182. [Google Scholar] [CrossRef]
- Leandro, J.; Chen, A.S.; Djordjević, S.; Savić, D.A. Comparison of 1D/1D and 1D/2D coupled (sewer/surface) hydraulic models for urban flood simulation. J. Hydraul. Eng. 2009, 135, 495–504. [Google Scholar] [CrossRef]
- Kandori, C.; Willems, P. Impact of the two-directional interaction of sewer and river systems on the flood risk. In Proceedings of the 11th International Conference of Urban Drainage, Edinburgh, UK, 31 August–5 September 2008; pp. 1–10. [Google Scholar]
- Mark, O.; Weesakul, S.; Apirumanekul, C.; Aroonnet, S.B.; Djordjevic, S. Potential and limitations of 1D modelling of urban flooding. J. Hydrol. 2004, 299, 284–299. [Google Scholar] [CrossRef]
- Pina, R.D.; Ochoa-Rodriguez, S.; Simões, N.E.; Mijic, A.; Marques, A.S.; Maksimović, Č. Semi- vs. Fully-distributed urban stormwater models: Model set up and comparison with two real case studies. Water 2016, 8, 58. [Google Scholar] [CrossRef]
- Russo, B.; Sunyer, D.; Velasco, M.; Djordjevic, S. Analysis of extreme flooding events through a calibrated 1D/2D coupled model: The case of Barcelona (Spain). J. Hydroinform. 2015, 17, 473–491. [Google Scholar] [CrossRef]
- Gómez, M.; Russo, B. Methodology to estimate hydraulic efficiency of drain inlets. Proc. Inst. Civ. Eng. Water Manag. 2011, 164, 81–90. [Google Scholar] [CrossRef]
- Gómez, M.; Russo, B. Hydraulic efficiency of continuous transverse grates for paved areas. J. Irrig. Drain. Eng. 2009, 135. [Google Scholar] [CrossRef]
- Gómez, M.; Parés, J.; Russo, B.; Martínez-Gomariz, E. Methodology to quantify clogging coefficients for grated inlets. Application to SANT MARTI catchment (Barcelona). J. Flood Risk Manag. 2019, 12. [Google Scholar] [CrossRef]
- Gómez, M.; Rabasseda, G.H.; Russo, B. Experimental campaign to determine grated inlet clogging factors in an urban catchment of Barcelona. Urban Water J. 2013, 10. [Google Scholar] [CrossRef]
- Innovyze. InfoWorks Integrated Catchment Modelling (ICM), version 10.0; Innovyze: Monrovia, CA, USA, 2020. [Google Scholar]
- Russo, B.; Pouget, L.; Malgrat, P. Evaluacion del impacto del cambio climatico en un caso de estudio de Barcelona a través de una modelización 2D-1D del drenaje dual. In Proceedings of the Jornadas de Ingeniería del Agua (JIA), Barcelona, Spain, 5–6 October 2011. [Google Scholar]
- Russo, B. Multi-Hazards Assessment Related to Water Cycle Extreme Events for Current Scenario. (Public Summary) Deliverable 2.4. RESCCUE EU H2020 Project. Available online: http://www.resccue.eu/sites/default/files/d2.4._multi-hazards_assessment_related_to_water_cycle_extreme.pdf (accessed on 24 April 2020).
- Evans, B. Impact Assessments of Multiple Hazards in Case Study Areas. Deliverable 3.4; RESCCUE EU H2020 Project. Internal report.
- Velasco, M.; Russo, B.; Cabello, À.; Termes, M.; Sunyer, D.; Malgrat, P. Assessment of the effectiveness of structural and nonstructural measures to cope with global change impacts in Barcelona. J. Flood Risk Manag. 2018, 11. [Google Scholar] [CrossRef]
- Martínez-Gomariz, E.; Locatelli, L.; Guerrero, M.; Russo, B.; Martínez, M. Socio-Economic Potential Impacts Due to Urban Pluvial Floods in Badalona (Spain) in a Context of Climate Change. Water 2019, 11, 2658. [Google Scholar] [CrossRef]
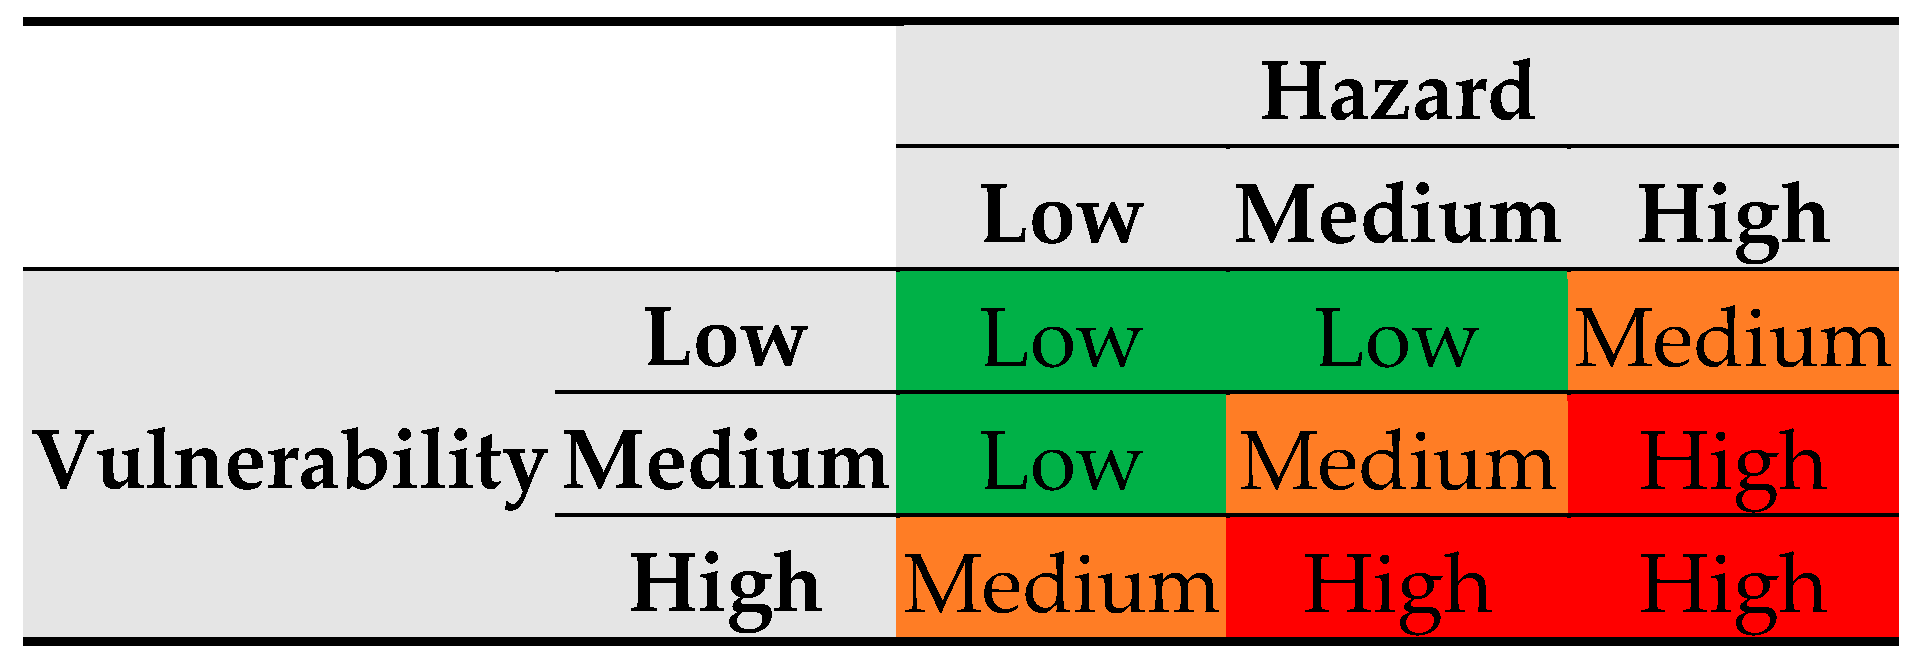
- Turner, B.L.; Kaspersonb, R.C.; Matsone, P.A.; McCarthy, J.; Corell, R.; Christensene, L.; Eckley, N.; Kasperson, J.X.; Luers, A.; Martello, M.L.; et al. A framework for vulnerability analysis in sustainability science. Proc. Natl. Acad. Sci. USA 2003, 100, 8074–8079. [Google Scholar] [CrossRef]
- Russo, B.; Gómez, M.; Macchione, F. Pedestrian hazard criteria for flooded urban areas. Nat. Hazards 2013, 69, 251–265. [Google Scholar] [CrossRef]
- Martínez-Gomariz, E.; Gómez, M.; Russo, B. Experimental study of the stability of pedestrians exposed to urban pluvial flooding. Nat. Hazards 2016, 82, 1259–1278. [Google Scholar] [CrossRef]
- Martínez-Gomariz, E.; Gómez, M.; Russo, B.; Djordjević, S. A new experiments-based methodology to define the stability threshold for any vehicle exposed to flooding. Urban Water J. 2017, 14, 930–939. [Google Scholar] [CrossRef]
- Martínez-Gomariz, E.; Guerrero-Hidalga, M.; Russo, B.; Yubero, D.; Gómez, M.; Castán, S. Desarrollo y aplicación de curvas de daño y estanqueidad para la estimación del impacto económico de las inundaciones en zonas urbanas españolas. Ingenieria del Agua 2019, 23, 229. [Google Scholar] [CrossRef]
- Martínez-Gomariz, E.; Forero-Ortiz, E.; Guerrero-Hidalga, M.; Castán, S.; Gómez, M. Flood Depth—Damage Curves for Spanish Urban Areas. Sustainability 2020, 12, 2666. [Google Scholar] [CrossRef]
- Martínez-Gomariz, E.; Gómez, M.; Russo, B.; Sánchez, P.; Montes, J.A. Methodology for the damage assessment of vehicles exposed to flooding in urban areas. J. Flood Risk Manag. 2019, 12, 1–15. [Google Scholar] [CrossRef]
- Evans, B.; Chen, A.S.; Djordjevi, S.; Webber, J.; Gonzalez, A.; Stevens, J. Investigating the Effects of Pluvial Flooding and Climate Change on Traffic Flows in Barcelona and Bristol. Sustainability 2020, 12, 2330. [Google Scholar] [CrossRef]
- Pyatkova, K.H. Flood Impacts on Road Transportation; University of Exeter: Exeter, UK, 2019. [Google Scholar]
- Sánchez-Muñoz, D.; Domínguez-García, J.L.; Martínez-Gomariz, E.; Russo, B.; Stevens, J.; Pardo, M. Electrical grid risk assessment against flooding in Barcelona and Bristol cities. Sustainability 2020, 12, 1527. [Google Scholar] [CrossRef]
- FEMA. Multi-Hazard Loss Estimation Methodology, Flood Model: Hazus-MH MR4 Technical Manual; FEMA: Washington, DC, USA, 2009.
- Martínez-Gomariz, E.; Russo, B.; Gómez, M.; Plumed, A. An approach to the modelling of stability of waste containers during urban flooding. J. Flood Risk Manag. 2019. [Google Scholar] [CrossRef]
- Russo, B.; Velasco, M.; Monjo, R.; Martínez-Gomariz, E.; Sánchez, D.; Domínguez, J.L.; Gabàs, A.; Gonzalez, A. Evaluación de la resiliencia de los servicios urbanos frente a episodios de inundación en Barcelona. El Proyecto RESCCUE. Ingenieria del Agua 2020, 24, 101. [Google Scholar] [CrossRef]
- U.S. Army Corps of Engineers (USACE). Economic Guidance Memorandum, 09-04, Generic Depth-Damage Relationships for Vehicles; USACE: Washington, DC, USA, 2009.
- Penning-Rowsell, E.; Viavattene, C.; Pardoe, J.; Chatterton, J.; Parker, D.; Morris, J. The Benefits of Flood and Coastal Risk Management: A Handbook ofAssessment Techniques; Flood Hazard Research Centre, Middlesex University: London, UK, 2010. [Google Scholar]
- Guerrero-Hidalga, M.; Martínez-Gomariz, E.; Evans, B.; Webber, J.; Termes-Rifé, M.; Russo, B.; Locatelli, L. Methodology to Prioritize Climate Adaptation Measures in Urban Areas. Barcelona and Bristol Case Studies. Sustainability 2020, 12, 4807. [Google Scholar] [CrossRef]


| Loosely Coupled Model | Involved Sectors | Main Purposes |
|---|---|---|
| 1D/2D coupled model | Urban drainage | Flood hazard assessment and socio-economic flood risk assessment for people and properties |
| Flooding—traffic model | Urban drainage and surface traffic | Assessment of flood hazard and flood impacts on traffic system |
| Flooding—electric model | Urban drainage and electric system | Assessment of flood hazard and flood impacts on electric system |
| Flooding—waste collecting model | Urban drainage and waste collecting model | Assessment of flood hazard on waste collecting system |
| Flood Depth Range (m) | Hazard Classification | Maximum Vehicle Speed (km/h) |
|---|---|---|
| Flow depth < 0.1 | Low | Road speed limit |
| 0.1 < Flow depth < 0.3 | Medium | 20 |
| Flow depth > 0.3 m | High | 0 (Road closed) |
| Probability Range | Categorical Description |
|---|---|
| Low Failure Probability (LFP) | |
| Moderate Failure Probability (MFP) | |
| High Failure Probability (HFP) | |
| Non-Acceptable Failure Probability (NAFP) |
| Return Period | Scenario | Type of Location | Number of Locations Affected | Customers Affected | Costs Provoked |
|---|---|---|---|---|---|
| T10 | BAS | DC | 165 | 14,984 | 90,403.68 € |
| HV | 6 | 116,872 | 2377.23 € | ||
| MV | 11 | 94,231 | 5585.61 € | ||
| BAU | DC | 187 | 290,613 | 192,823.10 € | |
| HV | 6 | 116,872 | 3709.35 € | ||
| MV | 13 | 150,723 | 2231.57 € | ||
| T50 | BAS | DC | 227 | 295,490 | 304,720.21 € |
| HV | 6 | 116,872 | 11,267.27 € | ||
| MV | 13 | 372,311 | 6627.44 € | ||
| BAU | DC | 254 | 314,932 | 476,756.76 € | |
| HV | 7 | 116,872 | 20,367.44 € | ||
| MV | 15 | 372,311 | 18,549.21 € | ||
| T100 | BAS | DC | 249 | 314,044 | 451,294.19 € |
| HV | 7 | 116,872 | 19,438.12 € | ||
| MV | 13 | 372,311 | 12,771.98 € | ||
| BAU | DC | 272 | 315,991 | 556,183.29 € | |
| HV | 8 | 116,872 | 28,873.49 € | ||
| MV | 15 | 581,566 | 41,375.86 € | ||
| T500 | BAS | DC | 296 | 318,232 | 633,795.69 € |
| HV | 9 | 215,368 | 56,870.91 € | ||
| MV | 17 | 582,487 | 28,035.45 € | ||
| BAU | DC | 324 | 320,679 | 771,129.01 € | |
| HV | 11 | 215,368 | 66,869.66 € | ||
| MV | 18 | 725,119 | 53,948.15 € |
| Model | Type of Impact | Indicator (BAU vs. Baseline) | Values for T/EAD |
|---|---|---|---|
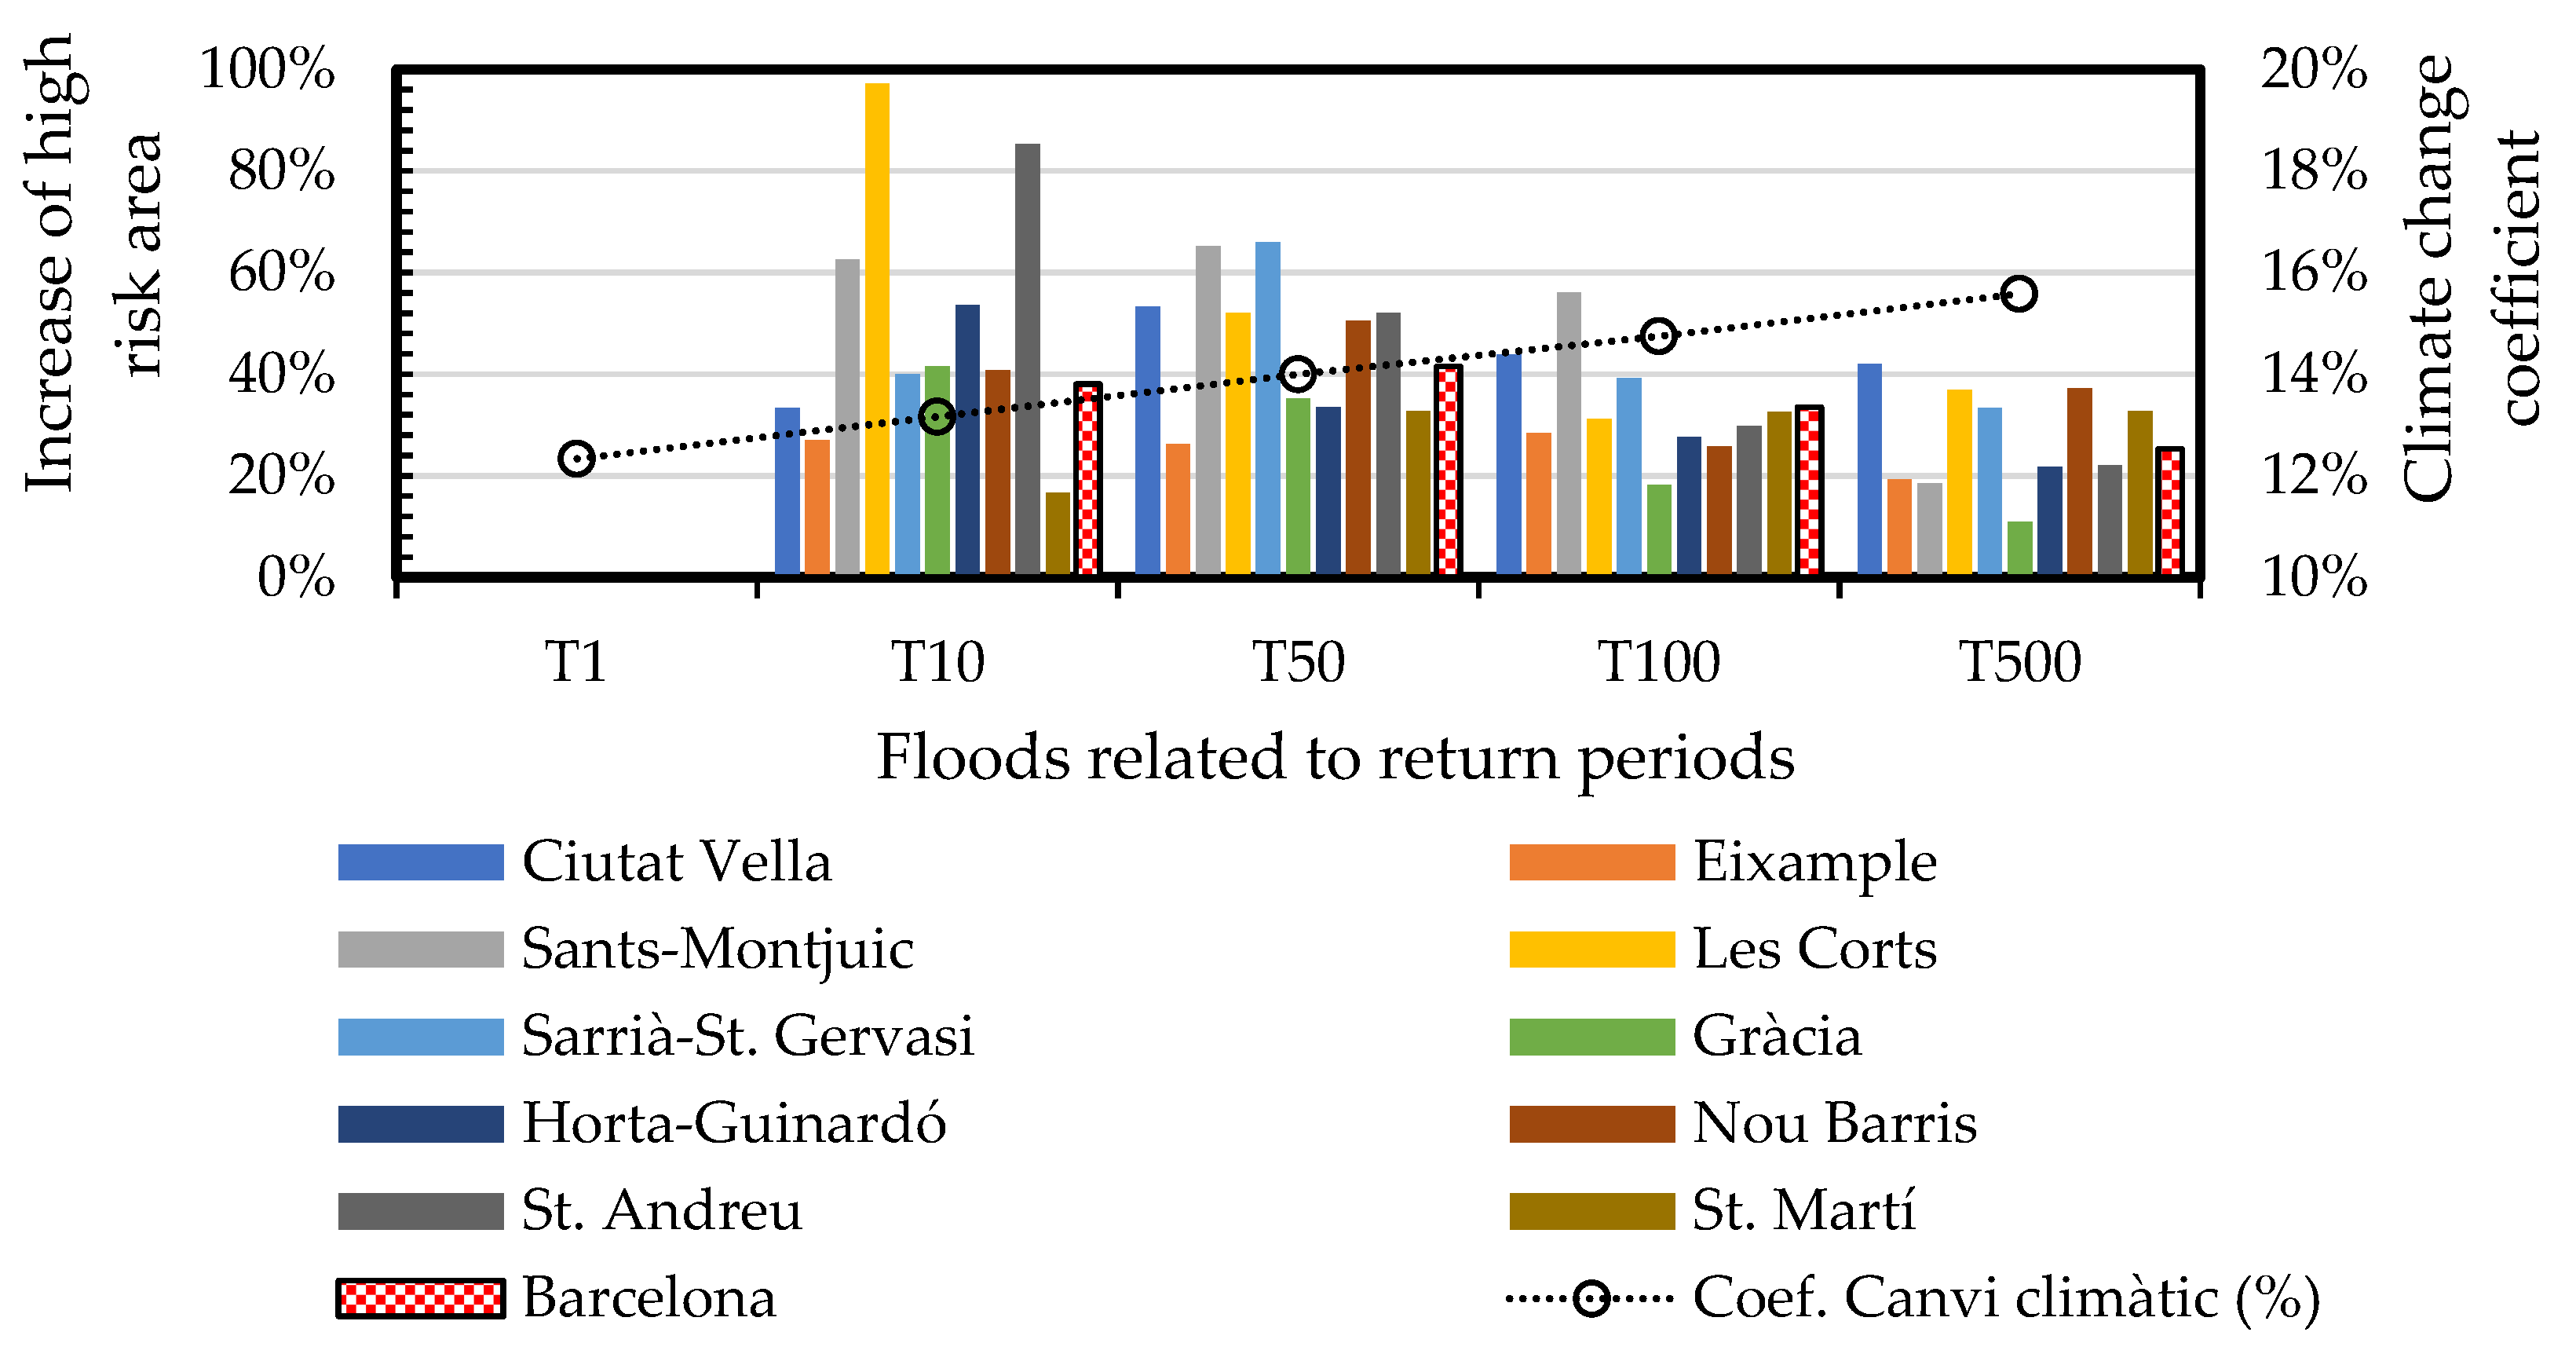
| 1D/2D USM | Intangible | Increase (%) of high flood risk area for pedestrian and vehicles | Pedestrians: +30 (T10), +34 (T50), +32 (T100), +30 (T500) Vehicles: +38 (T10), +42 (T50), +34 (T100), +25 (T500) |
| 1D/2D USM + Damage model | Tangible | Increase (%) of EAD (including properties, vehicles and indirect damages) | +42% |
| 1D/2D USM + Traffic model | Tangible and Intangible | Increase (%) of km of closed roads; EAD due to travelling time rise | +31 (T10), +60 (T50), +66 (T100), +116 (T500); +0.18 M€ |
| 1D/2D USM + Electric model | Tangible and Intangible | Increase (%) of the number of flooded electric infrastructures; related EAD | +13 (T10), +12 (T50), +11 (T100), +10 (T500); +0.12M€ |
| 1D/2D USM + Waste model | Intangible | Increase (%) of the number of unstable waste containers | Empty: +27 (T10), +28 (T50) 50% full: +28 (T10), +32 (T50) 100% full: +28 (T10), +36 (T50) |
© 2020 by the authors. Licensee MDPI, Basel, Switzerland. This article is an open access article distributed under the terms and conditions of the Creative Commons Attribution (CC BY) license (http://creativecommons.org/licenses/by/4.0/).
Share and Cite
Russo, B.; Velasco, M.; Locatelli, L.; Sunyer, D.; Yubero, D.; Monjo, R.; Martínez-Gomariz, E.; Forero-Ortiz, E.; Sánchez-Muñoz, D.; Evans, B.; et al. Assessment of Urban Flood Resilience in Barcelona for Current and Future Scenarios. The RESCCUE Project. Sustainability 2020, 12, 5638. https://doi.org/10.3390/su12145638
Russo B, Velasco M, Locatelli L, Sunyer D, Yubero D, Monjo R, Martínez-Gomariz E, Forero-Ortiz E, Sánchez-Muñoz D, Evans B, et al. Assessment of Urban Flood Resilience in Barcelona for Current and Future Scenarios. The RESCCUE Project. Sustainability. 2020; 12(14):5638. https://doi.org/10.3390/su12145638
Chicago/Turabian StyleRusso, Beniamino, Marc Velasco, Luca Locatelli, David Sunyer, Daniel Yubero, Robert Monjo, Eduardo Martínez-Gomariz, Edwar Forero-Ortiz, Daniel Sánchez-Muñoz, Barry Evans, and et al. 2020. "Assessment of Urban Flood Resilience in Barcelona for Current and Future Scenarios. The RESCCUE Project" Sustainability 12, no. 14: 5638. https://doi.org/10.3390/su12145638
APA StyleRusso, B., Velasco, M., Locatelli, L., Sunyer, D., Yubero, D., Monjo, R., Martínez-Gomariz, E., Forero-Ortiz, E., Sánchez-Muñoz, D., Evans, B., & Gómez, A. G. (2020). Assessment of Urban Flood Resilience in Barcelona for Current and Future Scenarios. The RESCCUE Project. Sustainability, 12(14), 5638. https://doi.org/10.3390/su12145638