Methodology to Prioritize Climate Adaptation Measures in Urban Areas. Barcelona and Bristol Case Studies

 , , , , and
Abstract
1. Introduction
2. Literature Review
- Cost-effectiveness analysis (CEA) is a simple method that offers guidance to rank different alternatives, providing a ratio of necessary investment to achieve a unit of effectiveness (to be selected based on a pre-set objective) [5]. It is attractive as it can quickly scan and rank different options whose benefits are not easily measurable. Although it has limitations on assessing whether the policies are “worth doing”, in the sense that it does not determine whether benefits are greater than costs [6] and lacks the capacity to identify non-direct impacts [7].
- Multi-criteria analysis (MCA) is a multi-step method based on the synthesis of already existing assessment studies [3]. It has diverse forms, but the general MCA method uses a scoring system to determine the potential accomplishment of a policy objective, giving weights (allocated by experts) to the different indicators included, previously normalized [8]. The major benefit is the possibility to assess variables of different nature and scales into the same framework (i.e., monetary, quantitative, or qualitative data). This is at the same time its major disadvantage, as trying to simplify and normalize different units and criteria can lead to a loss of accuracy [9]. Another characteristic of MCA is the consideration of multiple stakeholders in the evaluation process of indicators that are not measurable with quantitative data. If participants are impartial experts in relevant fields, results will be relevant, otherwise the scores risk being biased [6].
- Risks reduction assessment involves assessing either the health or environmental risks (or both) attached to a policy or project [6]. It is a valuable method for urban adaptation and mitigation appraisals as it is based in the concept of the disaster risk triangle (hazard, vulnerability, and exposure) [10]. It provides detailed results in terms of probability of damage for the selected return periods for the design storms, which facilitate the estimation of the potential damage reduction indicators compared to the do-nothing option [11]. A significant disadvantage of the method is its high time resources and specialized personnel requirements.
- Cost-benefit analysis (CBA) is a popular method to appraise the expected net results of different investment or policy options. It considers all costs and resulting benefits through the project or policy life, including economic (actual revenues and costs), social, and environmental changes derived from their implementation, through different available monetization methods [6]. In addition, in the context of natural hazards, this monetization usually implies consideration of risk reduction efficiency.
3. Methodology
3.1. Key Terminology
- Adaptation strategies are understood as sets of measures that aim to tackle one concrete issue related to climate change adaptation. Measures contain specific actions targeted to address a problem within the scope of the strategy they belong to. It means that a measure can be displayed in more than one strategy, because it tackles more than one problem (e.g., green areas could support flooding control and air pollution strategies).
- Initial and recurrent investments of each measure are required. As it is an ad-hoc analysis, costs are expected to be estimates transferred from similar actions in different locations, scaled to the new location’s size. It can be done using unitary values (€/m2), and GDP to adjust through the purchasing power parity index [12] and exchange rate if necessary. For accuracy purposes, researchers should always try to find budget references from sites as similar to the research site as possible.
- Economic, social, and environmental co-benefits are those benefits or positive effects generated in parallel to the main objective of the policy [13], understood as the specific climate change adaptation goal. Specific indicators for each co-benefit category, are presented in Table 1 below. The quantification and monetization of co-benefits is surrounded by uncertainty [14], thus co-benefits were accounted for using a specific scoring system evaluated by experts from diverse disciplines in each case study. This method also involves uncertainty, but the method is less time-consuming and considers local knowledge.
- An effectiveness indicator helps to assess the success of the resources used in achieving the objective of each measure [15]. It is important to select one that is valid across measures of different characteristics, and that requires available information. The effectiveness indicator selected in the present study is the reduction of downtime of urban services after an extreme weather event—recovery time reduction. This indicator provides information about the duration of modeled floods scenarios, and if scenarios with and without measures are compared, the variation of recovery time can be used as an effectiveness indicator.
- Climate risks reduction is understood as a percentage of high-risk area reduced, may be used as an indicator of the adaptation effectiveness. The higher the number of risks assessed, the more comprehensive the prioritization of adaptation measures would be. Risks, such as the stability of pedestrians or vehicles exposed to water flows and damages caused to properties and vehicles, have been assessed among the case studies presented herein. Results are sought for both the business as usual scenario and the scenarios where adaptation measures are implemented.
3.2. Stage 1: Problem Characterization
- By type of hazard (e.g., flooding events and droughts);
- By specific urban service targeted (e.g., transport, energy, and water supply);
- By type of measure (e.g., engineering, nature-based, or technological).
3.3. Stage 2: Preliminary Rank of Adaptation Measures
3.4. Stage 3: Detailed Assessment of Adaptation Scenarios
3.4.1. Stakeholders’ Selection of Sets of Measures for Detailed Assessment
3.4.2. Technical Detailed Assessment: Risks Modeling
- Economic damage assessment: a detailed estimation of pluvial flood damages to properties and vehicles was conducted. A 1D/2D hydrodynamic model of the entire city permitted estimation of the flow parameters (i.e., water depth and velocity) on the surface (i.e., city streets) for different return periods of rainfall (i.e., 1, 10, 50, 100, and 100) [29]. Therefore, this urban drainage model output has been used as an input for the flood damage models. The model proposed by Martínez-Gomariz et al. [30] was applied to estimate damages to vehicles, based on the depth-damage curves developed by the US Army Corps of Engineers [31]. A new model to estimate damage to properties in dense urban environments has been developed within the framework of the RESCCUE project. The model was constructed according to the suggestions of an insurance surveyor expert in flood damage appraisals [32]. This model relies on the accuracy of depth-damage curves that were constructed specifically for the city of Barcelona. These curves were developed based on damage claims of previous flood events together with the expert opinion when there was a lack of data [33]. Both models provided a total amount of direct economic damage for properties and vehicles that were aggregated per each return period. With this aggregation, the expected annual damage (EAD) [34] could be determined and used as a risk indicator. Therefore, the difference between the EAD before and after measures implementation provides an indicator of effectiveness of adaptation measures in terms of economic damages reduction.
- Intangible damage assessment: social impacts focused on safety of pedestrians and vehicles exposed to extreme pluvial flood events. Risk was defined as the combination of hazard and vulnerability by Turner et al. [35]. According to this approach, implemented in other previous studies [36,37], hazard assessment is based on the severity and frequency of the surface hydrodynamic variables and is classified based on specific flood hazard experimental criteria regarding pedestrian and vehicular stability in urban flooded areas [38,39,40]. On the other hand, flood vulnerability for pedestrian was assessed through several indicators like demographic density, percentage of people with critical age, and foreign inhabitants, and the number of critical infrastructures [36,37]. Vulnerability for vehicular circulation was assessed based on the vehicular daily intensity. Finally, a risk matrix combined hazard and vulnerability indexes to express flood risk.
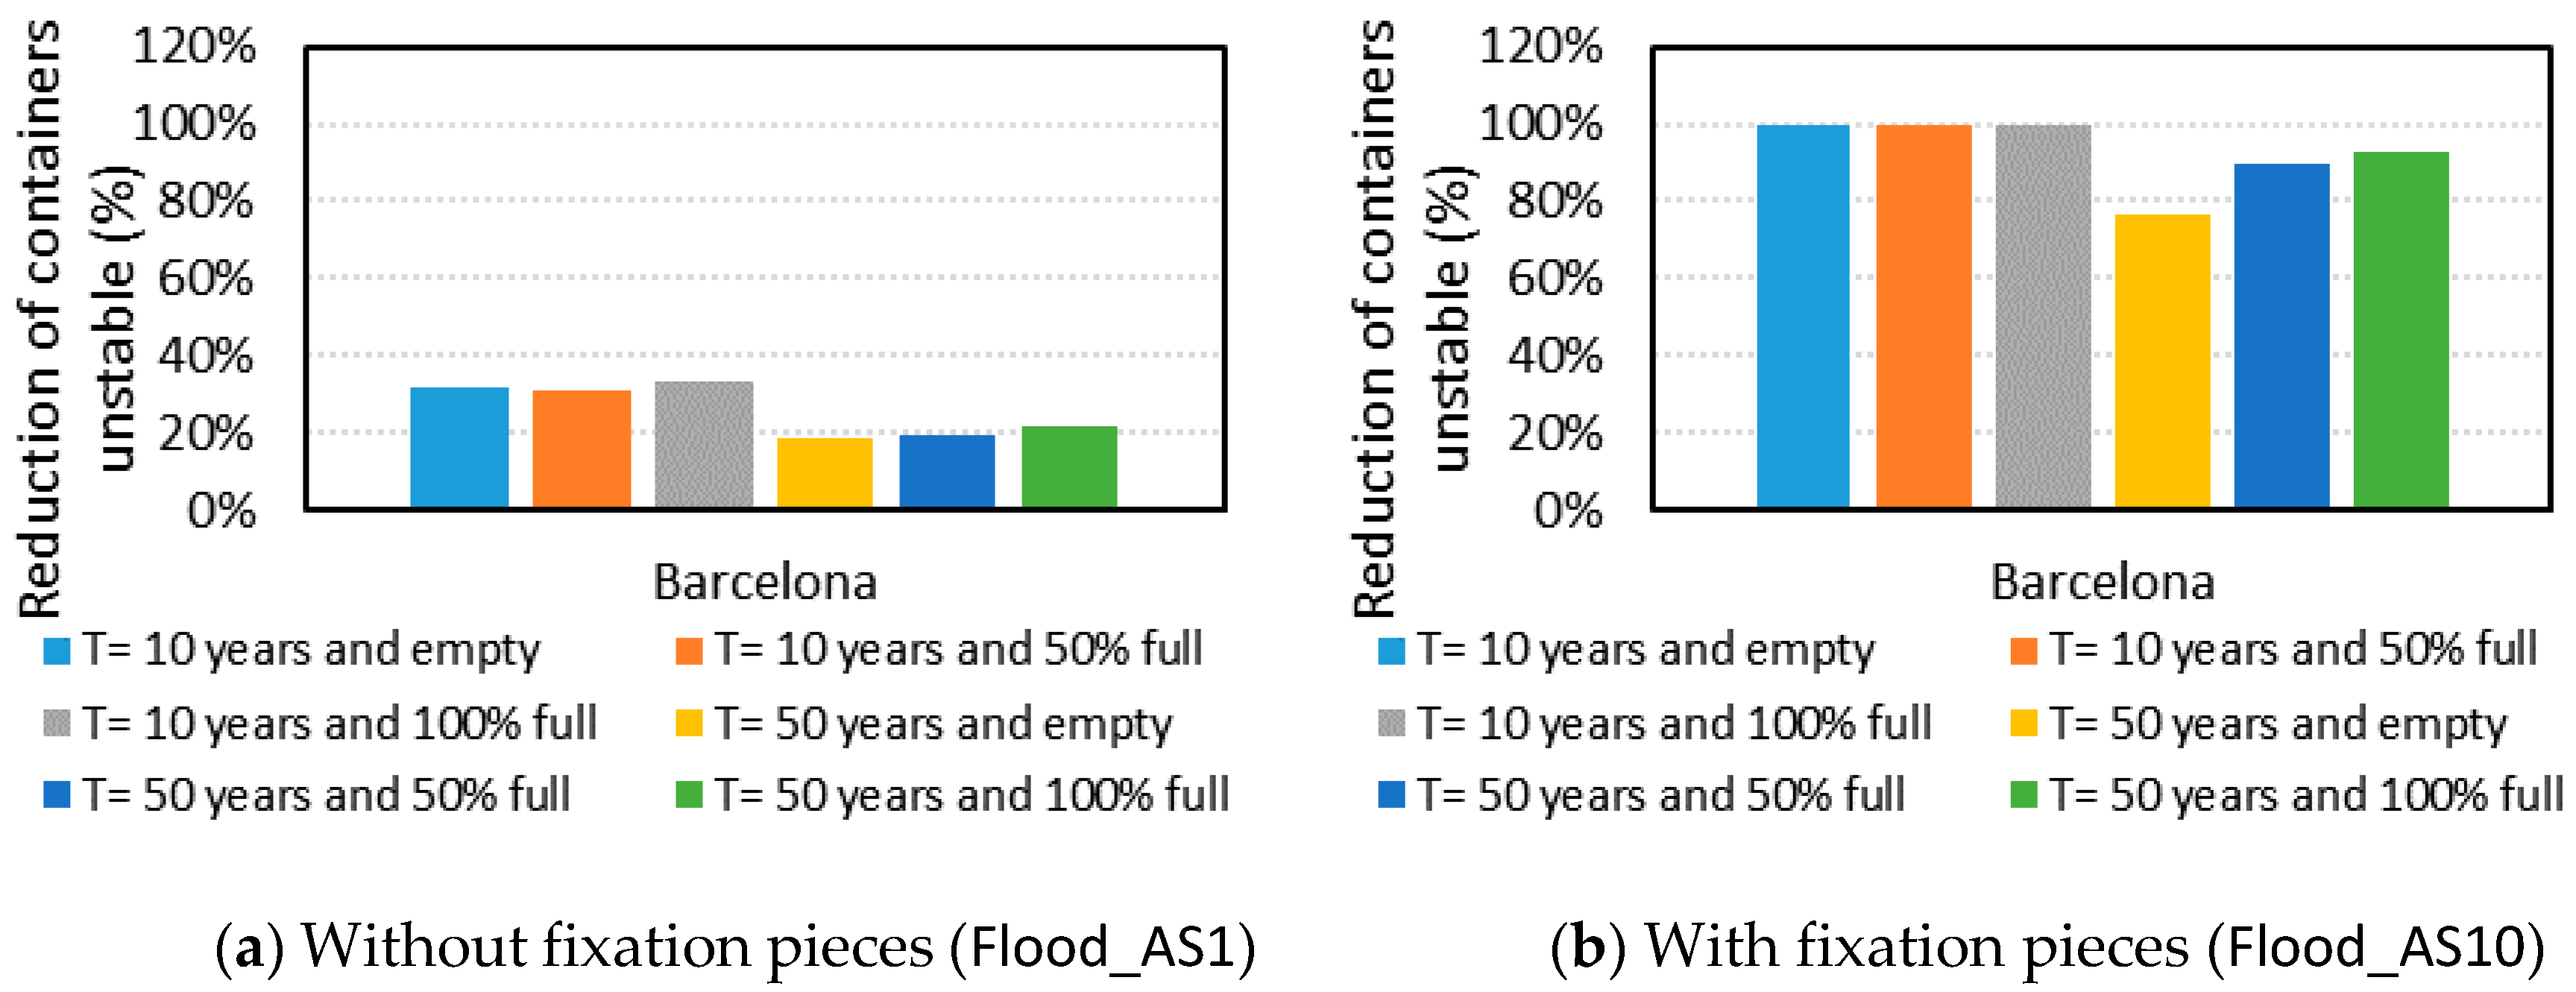
- Stability of street waste containers: flood impacts over the waste collection system were assessed. A specific measure about fixation of waste containers was included in 2 scenarios [29]. The indicator displays results in terms of percentage of reduction of unstable containers.
- Direct impacts on human health: insufficient bathing quality time (in hours) during the bathing season was carried, modeled for the coastal areas of Barcelona where CSO events occur [22]. Specifically, pollutant hazard was assessed through a coupled urban drainage and seawater quality model that was developed, calibrated, and validated based on local observations. The study quantified the health hazard of bathing waters affected by CSOs based on two novel indicators: the mean duration of insufficient bathing water quality (1) per bathing season and (2) after single CSO/rain events. More information about the proposed technique to assess human health hazard produced by CSO could be found in [41].
- Indirect impacts on business: potential economic losses as a consequence of closing related businesses (water sports, restaurants by the seaside, and fishing activities) due to bathing waters contamination [42]. Estimations were obtained using revenues of the affected sectors and neighborhoods where CSO spills occur. The relative damage proportion to the total revenue was assigned using the results of a survey and questionnaire carried out to citizens and business owners of the area. Results were expressed in monetary terms.
- Damage assessment: flood models were developed evaluating property damage through application of the damage assessment tool developed in EU project CORFU (Collaborative Research on Flood Resilience in Urban Areas) [43] and designing intervention scenarios representing property level protection. Flood models included fluvial and pluvial events at a range of return periods (T20 to T1000 and T10 to T100, respectively). Analysis of peak flood depth mapping for a baseline representing current day conditions and a climate change scenario derived from UKCP09 [19], assuming BAU emissions up to the year 2115 was carried out.
- Traffic impact assessment: The flood maps that were used for the damage assessment were loosely coupled with micro-simulation traffic model SUMO (Simulation of urban Mobility) [47]. A modified approach outlined by [48] was applied to simulate the effects of flooding on traffic, whereby the speed limits on specific sections of roads were reduced or road sections were close temporarily during a thirty-minute flood event depending on the maximum-recorded flood-depths. For the adaptation scenario, the bridges that cross the central river sections within the city were assumed to be locally protected from flooding in order to observe how—by keeping these specific roads open and unflooded—the flows of traffic within the network could be greatly improved. The impact costs values were derived via the use of speed versus cost table from the multicolored manual (MCM) [45].
- Electricity system: within the Bristol case study, the effect of localized improvements to infrastructure protection were analyzed [49]. Detailed assessment results were achieved by carrying out a sensitivity analysis that altered the fragility (depth vs. infrastructure failure) curves of the electrical substations.
3.4.3. Economic Assessment: Environmental Cost-Benefit Analysis
3.5. Stage 4: Final Ranking
4. Results: Application in Two European Cities
4.1. Problem Characterization in Practice
4.2. Preliminary Assessment of Adaptation Measures in Practice
4.3. Detailed Assessment in Practice
4.3.1. Selection of Adaptation Scenarios
4.3.2. Detailed Assessment Results
4.4. Final Ranking: Results of the Detailed Assessment
5. Discussion
6. Conclusions
Author Contributions
Funding
Acknowledgments
Conflicts of Interest
Appendix A

| Proposed Weights | 25% | 25% | 25% | 25% | |
|---|---|---|---|---|---|
| Rank | CSO Proposed Measures | CEA (€/h) | Economic | Social | Environmental |
| 1 | Inlet increase | 8750 | 36% | 60% | 35% |
| 2 | Disconnecting paved surfaces from (combined) sewer system | 6332 | 33% | 10% | 36% |
| 3 | Swale | 9629 | 26% | 40% | 55% |
| 4 | Surface water separation | 4197 | 6% | 13% | 23% |
| 5 | Filter trenches | 9629 | 26% | 40% | 41% |
| 6 | Permeable paving | 9629 | 23% | 43% | 40% |
| 7 | Raise curb height | 1319 | 4% | 4% | 0% |
| 8 | Increase of combined sewer system capacity | 32,013 | 1% | 71% | 34% |
| 9 | Sustainable Urban Drainage systems (SUDS) | 9629 | 14% | 20% | 40% |
| 10 | Detention basin | 9629 | 6% | 13% | 9% |
| 11 | Increase surface water sewer system capacity | 17,097 | 6% | 0% | 0% |
| 12 | Improvements to drainage system (watercourse)—isolation from high tide conditions in River Avon | 334,056 | 10% | 9% | 5% |
| 13 | Improvements to drainage system (watercourse)—capacity | 158,973 | 6% | 0% | 0% |
Appendix B
| Adaptation Scenario | Risk Reduction for Pedestrians | Risk Reduction for Vehicles | |||||||||
|---|---|---|---|---|---|---|---|---|---|---|---|
| T1 | T10 | T50 | T100 | T500 | T1 | T10 | T50 | T100 | T500 | ||
| 1 | SUDS Entire BCN | 0% | 34% | 20% | 17% | 14% | 0% | 45% | 25% | 21% | 14% |
| 2 | SUDS + Structural Measures Entire BCN | 0% | 99% | 87% | 76% | 59% | 0% | 99% | 94% | 87% | 66% |
| 3 | SUDS + Structural Measures Zone 1 | 0% | 79% | 65% | 58% | 48% | 0% | 87% | 74% | 65% | 49% |
| 4 | SUDS + Structural Measures Zone 2 | 0% | 79% | 63% | 56% | 47% | 0% | 90% | 76% | 67% | 51% |
| 5 | SUDS + Structural Measures Zone 3 | 0% | 76% | 63% | 55% | 45% | 0% | 87% | 75% | 66% | 50% |
| 6 | SUDS + Structural Measures Zone 4 | 0% | 74% | 59% | 53% | 47% | 0% | 84% | 69% | 59% | 48% |
| 7 | SUDS + Structural Measures Zone 5 | 0% | 77% | 62% | 55% | 48% | 0% | 90% | 71% | 61% | 48% |
| 8 | SUDS + Structural Measures Zone 6 | 0% | 65% | 60% | 55% | 45% | 0% | 85% | 68% | 60% | 45% |
| Scenario | EAD to Properties | EAD to Vehicles | EAD Variation | |
|---|---|---|---|---|
| 0 | Baseline (current rainfall) | 31,150,112 € | 3,275,292.05 € | - |
| 1 | BAU 1 (future rainfall) | 44,494,008 € | 4,482,544.03 € | +42% (vs. Baseline) |
| 2 | SUDS Entire city 2 | 23,680,855 € | 2,747,960.30 € | −46% |
| 3 | SUDS + Structural Measures (SM) Entire city | 2,235,685 € | 341,720.20 € | −95% |
| 4 | SUDS + SM Zone 1 | 10,270,756 € | 825,019.44 € | −77% |
| 5 | SUDS + SM Zone 2 | 8,408,240 € | 927,384.48 € | −81% |
| 6 | SUDS + SM Zone 3 | 8,509,119 € | 970,750.84 € | −81% |
| 7 | SUDS + SM Zone 4 | 9,821,973 € | 999,403.93 € | −78% |
| 8 | SUDS + SM Zone 5 | 7,403,553 € | 771,070.23 € | −83% |
| 9 | SUDS + SM Zone 6 | 8,888,035 € | 1,008,856.05 € | −80% |


References
- Reckien, D.; Salvia, M.; Heidrich, O.; Church, J.M.; Pietrapertosa, F.; De Gregorio-Hurtado, S.; D’Alonzo, V.; Foley, A.; Simoes, S.G.; Krkoška Lorencová, E.; et al. How are cities planning to respond to climate change? Assessment of local climate plans from 885 cities in the EU-28. J. Clean. Prod. 2018, 191, 207–219. [Google Scholar] [CrossRef]
- Jo, Y.C.H. Climate change adaptation measures for priority ranking. Methodol. Adapt. Meas. 2013, 12, 23–44. [Google Scholar]
- Gianoli, A.; Grafakos, S.; Olivotto, V.; Haqua, A.N. Climate Change Adaptation Projects: Integrating Prioritization and Evaluation. In The Sixth Urban Research and Knowledge Symposium; The World Bank: Barcelona, Spain, 2012; Available online: https://www.researchgate.net/profile/Anika_Haque/publication/322363707_CLIMATE_CHANGE_ADAPTATION_PROJECTS_INTEGRATING_PRIORITIZATION_AND_EVALUATION/links/5a560702aca272bb6962d410/CLIMATE-CHANGE-ADAPTATION-PROJECTS-INTEGRATING-PRIORITIZATION-AND-EVALUATION.pdf. (accessed on 25 February 2020).
- Velasco, M.; Russo, B.; Martínez, M.; Malgrat, P.; Monjo, R.; Djordjevic, S.; Fontanals, I.; Vela, S.; Cardoso, M.A.; Buskute, A. Resilience to cope with climate change in urban areas-A multisectorial approach focusing on water-The RESCCUE project. Water (Switzerland) 2018, 10, 1356. [Google Scholar] [CrossRef]
- Brouwer, R.; Georgiou, S. Animal Waste, Water Quality and Human Health; Dufour, A., Bartram, J., Bos, R., Gannon, V., Eds.; IWA Publishing: London, UK, 2012; ISBN 9781780401232. [Google Scholar]
- Atkinson, G.; Braathen, A.; Groom, B.; Mourato, S. Cost-Benefit Analysis and the Environment: Further Developments and Policy Use; OECD: Paris, France, 2018; Volume 2, ISBN 978-92-64-08516-9. [Google Scholar]
- Ürge-Vorsatz, D.; Novikova, A.; Sharmina, M. Counting Good: Quantifying the Co-Benefits of Improved Efficiency in Buildings. In Proceedings of the European Council for an Energy Efficient Economy (ECEEE) Summer Study, La Colle sur Loup, France, 1–6 June 2009. [Google Scholar]
- Noleppa, S. Economic Approaches for Assessing Climate Change Adaptation Options under Uncertainty; Deutsche Gesellschaft für Internationale Zusammenarbeit (GIZ) GmbH: Bonn, Germany, 2013. [Google Scholar]
- Meyer, V.; Becker, N.; Markantonis, V.; Schwarze, R. Costs of Natural Hazards—A Synthesis; CONHAZ Project: London, UK, 2012. [Google Scholar]
- Li, C.; Cheng, X.; Li, N.; Du, X.; Yu, Q.; Kan, G. A framework for flood risk analysis and benefit assessment of flood control measures in Urban Areas. Int. J. Environ. Res. Public Health 2016, 13, 787. [Google Scholar] [CrossRef]
- Messner, F.; Penning-Rowsell, E.; Green, C.; Meyer, V.; Tunstall, S.; Van der Veen, A. Guidelines for Socio-economic Flood Damage Evaluation; FloodSite Project: Wallingford, UK, 2007. [Google Scholar]
- Vachris, M.A.; James, T. International price comparisons based on purchasing power parity|Request PDF. Mon. Labor. Rev. 1999, 122, 3–12. [Google Scholar]
- Floater, G.; Heeckt, C.; Ulterino, M.; Mackie, L.; Rode, P.; Bhardwaj, A.; Carvalho, M.; Gill, D.; Bailey, T.; Huxley, R. Co-Benefits of Urban Climate Action: A Framework for Cities; London School of Economics and Political Science: London, UK, 2016. [Google Scholar]
- Azqueta, D.; Alviar, M.; Dominguez, L.; O’Ryan, R. Introducción a la Economía Ambiental; McGraw-Hill Interamericana de España: Madrid, Spain, 2007; ISBN 8448160584-9788448160586. [Google Scholar]
- Mandl, U.; Dierx, A.; Ilzkovitz, F. The Effectiveness and Efficiency of Public Spending. In Economic Papers; DG Economic and Financial Affairs, European Commision: Brussels, Belgium, 2008; ISBN 9789279082269. [Google Scholar]
- Máñez, M.; Cerdà, A. Prioritisation Method for Adaptation Measures to Climate Change in the Water Sector. CSC Report 18; Climate Service Center: Hamburg, Germany, 2014. [Google Scholar]
- Guerreiro, S.B.; Dawson, R.J.; Kilsby, C.; Lewis, E.; Ford, A. Future heat-waves, droughts and floods in 571 European cities. Environ. Res. Lett. 2018, 13. [Google Scholar] [CrossRef]
- Climate Research Foundation (FIC). Downscaled Climate Model Outputs of the RESCCUE Project. Available online: https://www.ficlima.org/intercambio/indexed/RESCCUE/ (accessed on 25 February 2020).
- Met Office UKCP UK Climate Predictions (UKCP09). Available online: https://webarchive.nationalarchives.gov.uk/20181204111018/http://ukclimateprojections-ukcp09.metoffice.gov.uk/ (accessed on 26 February 2020).
- Van den Berg, M.; van Gils, P.F.; de Wit, G.A.; Schuit, A.J. Economic Evaluation of Prevention, Fourth Report on the Cost-Effectiveness of Preventive Interventions; National Institure for Public Health and the Environment: Amsterdam, The Netherlans, 2008. [Google Scholar]
- Russo, B.; Velasco, M.; Monjo, R.; Martínez-Gomariz, E.; Domínguez-García, J.L.; Sánchez-Muñoz, D.; Gabàs, A.; Gonzalez, A. Assessment of the resilience of Barcelona urban services in case of flooding. The RESCCUE project. Ing. del Agua 2020, 24, 2. [Google Scholar]
- Locatelli, L.; Russo, B.; Martinez, M. Evaluating health hazard of bathing waters affected by combined sewer overflows. Nat. Hazards Earth Syst. Sci. Discuss. 2019. [Google Scholar] [CrossRef]
- Verlaan, J.; Vos, R.; Matthijs, M. The use of equivalent annual cost for cost-benefit analyses in flood risk reduction strategies. E3S Web Conf. 2016, 7. [Google Scholar] [CrossRef]
- Chiabai, A.A.; Galarraga, I.; Markanday, A.; de Murieta, E.S. Determining Discount Rates: An Application of the Equivalency Principle; EconAdapt Project: Bath, UK, 2015. [Google Scholar]
- Stern, N. The economics of climate change. Econ. Clim. Chang. 2004, 7, 1–297. [Google Scholar]
- Dasgupta, P. Commentary: The Stern Review’s Economics of Climate Change. Natl. Inst. Econ. Rev. 2007, 199, 4–7. [Google Scholar] [CrossRef]
- Blue, J.; Hiremath, N.; Gillette, C.; Julius, S. Evaluating Urban Resilience to Climate Change: A Multi-Sector Approach; U.S. Environmental Protection Agency: Washington, DC, USA, 2017.
- Velasco, M.; Cabello, À.; Russo, B. Flood damage assessment in urban areas. Application to the Raval district of Barcelona using synthetic depth damage curves. Urban Water J. 2016, 13, 426–440. [Google Scholar] [CrossRef]
- Russo, B.; Velasco, M.; Martínez-Gomariz, E.; Domínguez, J.-L.; Sánchez, D.; Gabàs, A.; Gonzalez, A. Evaluación de la resiliencia de los servicios urbanos frente a episodios de inundación en Barcelona. El Proyecto RESCCUE. Ing. del Agua 2020, 24, 101–118. [Google Scholar] [CrossRef]
- Martínez-Gomariz, E.; Gómez, M.; Russo, B.; Sánchez, P.; Montes, J.-A. Methodology for the damage assessment of vehicles exposed to flooding in urban areas. J. Flood Risk Manag. 2019, 12, e12475. [Google Scholar] [CrossRef]
- Gulf Engineers & Consultants (GEC). Depth-Damage Relationships for Structures, Contents, and Vehicles and Content-to-Structure Value Ratios (CSVR) in Support of the Donaldsonville to the Gulf, Luisiana, Feasibility Study; Gulf Engineers & Consultants (GEC): New Orleans, LA, USA, 2006. [Google Scholar]
- Martínez-Gomariz, E.; Guerrero-Hidalga, M.; Russo, B.; Yubero, D.; Gómez, M.; Castán, S. Desarrollo y aplicación de curvas de daño y estanqueidad para la estimación del impacto económico de las inundaciones en zonas urbanas españolas. Ing. Agua 2019, 23, 229–245. [Google Scholar]
- Martínez-Gomariz, E.; Forero-Ortiz, E.; Guerrero-Hidalga, M.; Castán, S.; Gómez, M. Flood Depth‒Damage Curves for Spanish Urban Areas. Sustainability 2020, 12, 2666. [Google Scholar] [CrossRef]
- Martínez-Gomariz, E.; Locatelli, L.; Guerrero, M.; Russo, B.; Martínez, M. Socio-Economic Potential Impacts Due to Urban Pluvial Floods in Badalona (Spain) in a Context of Climate Change. Water 2019, 11, 2658. [Google Scholar]
- Turner, B.L.; Kasperson, R.E.; Matsone, P.A.; McCarthy, J.J.; Corell, R.W.; Christensene, L.; Eckley, N.; Kasperson, J.X.; Luers, A.; Martello, M.L.; et al. A framework for vulnerability analysis in sustainability science. Proc. Natl. Acad. Sci. USA 2003, 100, 8074–8079. [Google Scholar] [CrossRef]
- Velasco, M.; Russo, B.; Cabello, À.; Termes, M.; Sunyer, D.; Malgrat, P. Assessment of the effectiveness of structural and nonstructural measures to cope with global change impacts in Barcelona. J. Flood Risk Manag. 2018, 11, S55–S68. [Google Scholar] [CrossRef]
- Martínez-Gomariz, E.; Gómez, M.; Russo, B. Experimental study of the stability of pedestrians exposed to urban pluvial flooding. Nat. Hazards 2016, 82, 1259–1278. [Google Scholar]
- Martínez-Gomariz, E.; Gómez, M.; Russo, B. Experimental study of the stability of pedestrians exposed to urban pluvial flooding. Nat. Hazards 2016, 82, 1259–1278. [Google Scholar] [CrossRef]
- Russo, B.; Gómez, M.; Macchione, F. Pedestrian hazard criteria for flooded urban areas. Nat. Hazards 2013, 69, 251–265. [Google Scholar] [CrossRef]
- Martínez-Gomariz, E.; Gómez, M.; Russo, B.; Djordjević, S. A new experiments-based methodology to define the stability threshold for any vehicle exposed to flooding. Urban Water J. 2017, 14, 930–939. [Google Scholar] [CrossRef]
- Locatelli, L.; Russo, B.; Acero Oliete, A.; Sánchez Catalán, J.C.; Martínez-Gomariz, E.; Martínez, M. Modeling of E. coli distribution for hazard assessment of bathing waters affected by combined sewer overflows. Nat. Hazards Earth Syst. Sci. 2020, 20, 1219–1232. [Google Scholar] [CrossRef]
- Evans, B.; Chen, A.; Djordjevic, S.; Webber, J.; Almeida, M.C.; Morais, M.; Telhado, M.J.; Silva, I.; Duarte, N.; Martínez-Gomariz, E.; et al. Impact Assessments of Multiple Hazards in Case Study Areas with Adaptation Strategies; RESCCUE Project: Barcelona, Spain, 2020. [Google Scholar]
- Chen, A.S.; Hammond, M.J.; Djordjević, S.; Butler, D.; Khan, D.M.; Veerbeek, W. From hazard to impact: Flood damage assessment tools for mega cities. Nat. Hazards 2016, 82, 857–890. [Google Scholar] [CrossRef]
- National Receptor Dataset (NRD). Risk of Flooding from Rivers and Sea. Available online: https://data.gov.uk/dataset/50545819-8149-4999-9d9f-c082e7234257/risk-of-flooding-from-rivers-and-sea-key-summary-information (accessed on 3 March 2020).
- Penning-Rowsell, E.; Viavattene, C.; Pardoe, J.; Chatterdon, J.; Parker, D.; Morris, J. The Benefits of Flood and Coastal Risk Management: A Handbook of Assessment Techniques; Flood Hazard Research Centre: London, UK, 2010. [Google Scholar]
- Bowker, P. Flood Resistance and Resilience Solutions: An R&D Scoping Study; R&D Technical Report; Joint Defra/EA Flood and Coastal Erosion Risk Management R&D Programme: London, UK, 2007. [Google Scholar]
- Alvarez Lopez, P.; Behrisch, M.; Bieker-Walz, L.; Erdmann, J.; Flötteröd, Y.-P.; Hilbrich, R.; Lücken, L.; Rummel, J.; Wagner, P.; Wießner, E. Microscopic Traffic Simulation using SUMO. In Proceedings of the 21st International Conference on Intelligent Transportation Systems (ITSC), Maui, HI, USA, 4–7 November 2018; pp. 2575–2582. [Google Scholar] [CrossRef]
- Pyatkova, K.; Chen, A.S.; Djordjević, S.; Butler, D.; Vojinović, Z.; Abebe, Y.A.; Hammond, M. Flood Impacts on Road Transportation Using Microscopic Traffic Modelling Techniques BT—Simulating Urban Traffic Scenarios; Behrisch, M., Weber, M., Eds.; Springer International Publishing: New York, NY, USA, 2015. [Google Scholar]
- Sánchez-Muñoz, D.; Domínguez-García, J.L.; Martínez-Gomariz, E.; Russo, B.; Stevens, J.; Pardo, M. Electrical Grid Risk Assessment Against Flooding in Barcelona and Bristol Cities. Sustainability 2020, 12, 1527. [Google Scholar] [CrossRef]
- Brouwer, R.; Barton, D.; Bateman, I.J.; Brander, L.; Georgiou, S.; Martin-Ortega, J.; Navrud, S.; Pulido-Velazquez, M.; Schaafsma, M.; Wagtendonk, A. Economic Valuation of Environmental and Resource Costs and Benefits in the Water Framework Directive: Technical Guidelines for Practitioners; Project AquaMoney: Amsterdam, The Netherlands, 2009. [Google Scholar]
- TEEB. Available online: http://www.teebweb.org/resources/glossary-of-terms/ (accessed on 25 February 2020).
- Vojinovic, Z.; Keerakamolchai, W.; Weesakul, S.; Pudar, R.S. Combining Ecosystem Services with Cost-Benefit Analysis for Selection of Green and Grey Infrastructure for Flood Protection in a Cultural Setting. Environments 2017, 4, 3. [Google Scholar] [CrossRef]
- Botzat, A.; Fischer, L.K.; Kowarik, I. Unexploited opportunities in understanding liveable and biodiverse cities. A review on urban biodiversity perception and valuation. Glob. Environ. Chang. 2016, 39, 220–233. [Google Scholar] [CrossRef]
- Cooper, W.; Garcia, F.; Pape, D.; Ryder, D.; Witherell, B. Climate Change Adaptation Case Study: Benefit-Cost Analysis of Coastal Flooding Hazard Mitigation. J. Ocean Coast. Econ. 2016, 3. [Google Scholar] [CrossRef]
- Li, J.; Mullan, M.; Helgeson, J. Improving the practice of economic analysis of climate change adaptation. J. Benefit Cost Anal. 2014, 5, 445–467. [Google Scholar] [CrossRef]
- Fairbrass, A.; Jones, K.; McIntosh, A.; Yao, Z.; Malki-Epshtein, L.; Bell, S. Green Infrastructure for London: A Review of the Evidence; A Report by the Engineering Exchange for Just Space and the London Sustainability Exchange; Engineering Exchange: London, UK, 2018. [Google Scholar]
- Atkinson, G.; Groom, B.; Hanley, N.; Mourato, S. Environmental Valuation and Benefit-Cost Analysis in U.K. Policy. J. Benefit Cost Anal. 2018, 9, 97–119. [Google Scholar] [CrossRef]
- Feng, H.; Hewage, K.N. Nature Based Strategies for Urban and Building Sustainability; Elsevier Inc.: Oxford, UK, 2018; pp. 307–318. ISBN 9780128123249. [Google Scholar]
- Bianchini, F.; Hewage, K. Probabilistic social cost-benefit analysis for green roofs: A lifecycle approach. Build. Environ. 2012, 58, 152–162. [Google Scholar] [CrossRef]
- Met Office UKCP UK Climate Projections (UKCP18). Available online: https://www.metoffice.gov.uk/research/approach/collaboration/ukcp/index (accessed on 26 February 2020).
- Evans, B.; Chen, A.; Djordjević, S.; Webber, J.; González Gómez, A.; Stevens, J. Investigating the Effects of Pluvial Flooding and Climate Change on Traffic Flows in Barcelona and Bristol. Sustainability 2020, 12, 2330. [Google Scholar] [CrossRef]
- Ürge-Vorsatz, D.; Herrero, S.T.; Dubash, N.K.; Lecocq, F. Measuring the Co-Benefits of Climate Change Mitigation. Annu. Rev. Environ. Resour. 2014, 39, 549–582. [Google Scholar] [CrossRef]
- Dai, L.; Wörner, R.; van Rijswick, H.F.M.W. Rainproof cities in the Netherlands: Approaches in Dutch water governance to climate-adaptive urban planning. Int. J. Water Resour. Dev. 2018, 34, 652–674. [Google Scholar] [CrossRef]


| Economic | Social | Environmental |
|---|---|---|
| Cost savings | Reduced mortality impacts | Improved air quality |
| Reduced energy losses | Reduced health impacts | Improved water quantity |
| Job creation | Reduced mortality from diseases | Reduced aquifer depletion |
| Possible reduction in prices | Enhanced public amenity | Reduced water pollution |
| Increased labor productivity | Reduced impacts on vulnerable groups | Reduced land contamination |
| Increased economic production | Reduced number of householder/business forced from home/workplace | Improved biodiversity and ecosystems |
| Increased property values | Social inclusion | Maintained and increased green space |
| Reduced environmental impacts through associated awareness | ||
| Increased biodiversity and ecosystem services | ||
| Effective/uninterrupted water collection and security | ||
| Erosion control | ||
| Average (economic) = ∑ Scores/number of indicators (n = 7) | Average (social) = ∑ Scores/number of indicators (n = 7) | Average (environmental) = ∑ Scores/number of indicators (n = 11) |
| Case Study | Hazard | Risk Assessment |
|---|---|---|
| Barcelona | Pluvial floods | Damage impact to properties and vehicles |
| Intangible damages to pedestrians and vehicles | ||
| Street waste containers instabilities | ||
| Water quality | CSO spills in bathing areas | |
| Bristol | Pluvial and fluvial floods | Damage impacts to general infrastructures |
| Traffic disruption | ||
| Energy sector damage | ||
| Water quality | CSO spills |
| Case Study | Extreme Event under Assessment | Relevance |
|---|---|---|
| Barcelona | Pluvial flooding CSO spills | Climate forecasts predict increases in the frequency of extreme weather events: Increase of 20% for 100 years return period rain (T100) is expected for the period 2041–2070, + 40% expected by the end of the century [18]. |
| Bristol | Fluvial flooding Pluvial flooding CSO spills | Climate forecasts indicate that fluvial and pluvial flood events are likely to worsen in response to an increasing likelihood of extreme rainfall. For example, between 2041 and 2070, the 1 year extreme daily rainfall is predicted to increase from 33 to 58 mm (UKCP09 median value) [19]. The fluvial system is also particularly vulnerable to tidal interference increasing river levels in the city, with UKCP18 projections indicating a 10 cm sea level rise across the 2041 to 2070 horizon, leading to significant areas of the city facing a future threat [60]. |
| Case Study | Selected Strategies and Their Measures |
|---|---|
| Barcelona | Pluvial flooding
|
| Bristol | Pluvial flooding
|
| Weights Given | 25% | 25% | 25% | 25% | |
| Rank | Pluvial Flooding Strategy Measures | CEA (€/h) | Economic | Social | Environmental |
| 1 | SUDS (green roofs, infiltration trenches, detention basins for rural catchments) | 16,466,678 | 56% | 69% | 85% |
| 2 | Ensure the stability of waste containers | 24,010 | 13% | 13% | 5% |
| 3 | Early Warning System | 29,478 | 13% | 13% | 5% |
| 4 | Increase of sewer system capacity—new pipes (I) | 5,597,181 | 13% | 60% | 35% |
| 5 | Increase of sewer system capacity—new detention tanks (II) | 18,687,976 | 1% | 71% | 34% |
| 6 | Improvements of surface drainage system | 4,072,897 | 11% | 41% | 9% |
| 7 | Self-healing algorithm in the electrical distribution grid | 127,304 | 10% | 0% | 0% |
| Rank | CSO Strategy Measures | CEA (€/h) | Economic | Social | Environmental |
| 1 | SUDS | 584,465 | 56% | 69% | 85% |
| 2 | Early Warning System | 1528 | 13% | 13% | 5% |
| 3 | Detention tanks | 452,461 | 1% | 71% | 34% |
| 4 | End of pipe CSO treatment | 4,687,158 | 9% | 29% | 8% |
| 5 | Improvements of the capacity of sewer interceptor | 59,500 | 1% | 17% | 8% |
| Weights Given | 25% | 25% | 25% | 25% | |
| Rank | Pluvial Flood Strategy Measures | CEA (€/h) | Economic | Social | Environmental |
| 1 | Demountable flood protection barriers | 7243 | 39% | 81% | 39% |
| 2 | Identify high risk areas (flood modeling analysis studies) | 60,790 | 23% | 57% | 14% |
| 3 | Flood proof crucial infrastructures | 134,608 | 7% | 3% | 14% |
| Rank | Fluvial/tidal Flood Strategy Measures | CEA (€/h) | Economic | Social | Environmental |
| 1 | Demountable flood protection barriers | 8450 | 39% | 81% | 39% |
| 2 | Build riverside flood defense walls | 3,749,280 | 64% | 87% | 41% |
| 3 | Identify high risk areas by conducting studies involving flood modeling analysis | 56,509 | 23% | 57% | 14% |
| 4 | Flood proof crucial infrastructure | 177,683 | 7% | 3% | 14% |
| Strategy Name | Adaptation Scenarios (AS) |
|---|---|
| Pluvial flooding impacts reduction |
|
| CSO spills reduction |
|
| Strategy Name | Adaptation Scenarios (AS) |
|---|---|
| Pluvial flooding impacts reduction |
|
| Fluvial flooding impacts reduction |
|
| Rank | Avoided Damage | ||
| ID | Scenario | AEPV (Million €/Year) | |
| 1 | Flood_AS2 | SUDS + Structural measures entire city (SM) | 49.0 |
| 2 | Flood_AS7 | SUDS + SM in Z5 | 43.1 |
| 3 | Flood_AS4 | SUDS + SM in Z2 | 41.9 |
| 4 | Flood_AS5 | SUDS + SM in Z3 | 41.7 |
| 5 | Flood_AS8 | SUDS + SM in Z6 | 41.2 |
| 6 | Flood_AS6 | SUDS + SM in Z4 | 40.2 |
| 7 | Flood_AS3 | SUDS + SM in Z1 | 40.0 |
| 8 | Flood_AS1 | SUDS entire city | 23.7 |
| Rank | Costs | ||
| ID | Scenario | AEPV (Million €/Year) | |
| 1 | Flood_AS1 | SUDS entire city | 9.9 |
| 2 | Flood_AS6 | SUDS + SM in Z4 | 10.9 |
| 3 | Flood_AS8 | SUDS + SM in Z6 | 11.0 |
| 4 | Flood_AS5 | SUDS + SM in Z3 | 11.6 |
| 5 | Flood_AS7 | SUDS + SM in Z5 | 12.2 |
| 6 | Flood_AS4 | SUDS + SM in Z2 | 12.3 |
| 7 | Flood_AS3 | SUDS + SM in Z1 | 15.1 |
| 8 | Flood_AS2 | SUDS + SM entire city | 22.4 |
| Rank | Net Benefits | ||
| ID | Scenario | AEPV (Million €/Year) | |
| 1 | Flood_AS7 | SUDS + SM in Z5 | 39.6 |
| 2 | Flood_AS8 | SUDS + SM in Z6 | 38.9 |
| 3 | Flood_AS5 | SUDS + SM in Z3 | 38.7 |
| 4 | Flood_AS4 | SUDS + SM in Z2 | 38.3 |
| 5 | Flood_AS6 | SUDS + SM in Z4 | 38.1 |
| 6 | Flood_AS2 | SUDS + SM entire city | 35.3 |
| 7 | Flood_AS3 | SUDS + SM in Z1 | 33.6 |
| 8 | Flood_AS1 | SUDS entire city | 22.5 |
| Rank | Risk Reduction (T10) | |||||
|---|---|---|---|---|---|---|
| ID | Scenario | Risk for Pedestrians | ID | Scenario | Risk for Vehicles | |
| 1 | Flood_AS2 | SUDS + SM entire city | 99% | AS2 | Str. BCN + SUDS | 99% |
| 2 | Flood_AS3 | SUDS + SM in Z1 | 79% | AS7 | Z5 + SUDS | 90.4% |
| 3 | Flood_AS4 | SUDS + SM in Z2 | 79% | AS4 | Z2 + SUDS | 90.2% |
| 4 | Flood_AS7 | SUDS + SM in Z5 | 77% | AS3 | Z1 + SUDS | 87.2% |
| 5 | Flood_AS5 | SUDS + SM in Z3 | 76% | AS5 | Z3 + SUDS | 86.6% |
| 6 | Flood_AS6 | SUDS + SM in Z4 | 74% | AS8 | Z6 + SUDS | 85.4% |
| 7 | Flood_AS8 | SUDS + SM in Z6 | 65% | AS6 | Z4 + SUDS | 84.1% |
| 8 | Flood_AS1 | SUDS entire city | 34% | AS1 | SUDS | 45% |
| Rank | Avoided Damage | |
| Scenario | AEPV (€/year) | |
| 1 | CSO_AS2. SUDS and detention tanks | 18,352,567 |
| 2 | CSO_AS1. SUDS (entire city) | 10,041,691 |
| Rank | Costs | |
| Scenario | AEPV (€/year) | |
| 1 | CSO_AS1. SUDS (entire city) | 9,918,794 |
| 2 | CSO_AS2. SUDS and detention tanks | 16,145,628 |
| Rank | Net Benefits | |
| Scenario | AEPV (€/year) | |
| 1 | CSO_AS2. SUDS and detention tanks | 10,850,498 |
| 2 | CSO_AS1. SUDS (entire city) | 9,078,777 |
| Rank | Scenarios | T10 | T20 | T30 | T100 |
|---|---|---|---|---|---|
| 1 | BAU CC with individually targeted interventions | 31,880,000 | 45,322,000 | - | 96,796,000 |
| 2 | BAU CC with zonally targeted interventions | 35,218,000 | 48,312,000 | - | 98,804,000 |
| 3 | Business as usual, considering climate change impact (BAU-CC) | 36,692,000 | 50,088,000 | - | 100,757,000 |
| Rank | Scenarios | T20 | T100 | T200 | T1000 |
|---|---|---|---|---|---|
| 1 | BAU CC with individually targeted interventions | - | 155,695,000 | 482,760,000 | 537,228,000 |
| 2 | BAU CC with zonally targeted interventions | - | 156,622,000 | 482,738,000 | 537,258,000 |
| 3 | BAU-CC | - | 160,006,000 | 483,009,000 | 537,446,000 |
© 2020 by the authors. Licensee MDPI, Basel, Switzerland. This article is an open access article distributed under the terms and conditions of the Creative Commons Attribution (CC BY) license (http://creativecommons.org/licenses/by/4.0/).
Share and Cite
Guerrero-Hidalga, M.; Martínez-Gomariz, E.; Evans, B.; Webber, J.; Termes-Rifé, M.; Russo, B.; Locatelli, L. Methodology to Prioritize Climate Adaptation Measures in Urban Areas. Barcelona and Bristol Case Studies. Sustainability 2020, 12, 4807. https://doi.org/10.3390/su12124807
Guerrero-Hidalga M, Martínez-Gomariz E, Evans B, Webber J, Termes-Rifé M, Russo B, Locatelli L. Methodology to Prioritize Climate Adaptation Measures in Urban Areas. Barcelona and Bristol Case Studies. Sustainability. 2020; 12(12):4807. https://doi.org/10.3390/su12124807
Chicago/Turabian StyleGuerrero-Hidalga, María, Eduardo Martínez-Gomariz, Barry Evans, James Webber, Montserrat Termes-Rifé, Beniamino Russo, and Luca Locatelli. 2020. "Methodology to Prioritize Climate Adaptation Measures in Urban Areas. Barcelona and Bristol Case Studies" Sustainability 12, no. 12: 4807. https://doi.org/10.3390/su12124807
APA StyleGuerrero-Hidalga, M., Martínez-Gomariz, E., Evans, B., Webber, J., Termes-Rifé, M., Russo, B., & Locatelli, L. (2020). Methodology to Prioritize Climate Adaptation Measures in Urban Areas. Barcelona and Bristol Case Studies. Sustainability, 12(12), 4807. https://doi.org/10.3390/su12124807