Article

Effect of Nitrogen Fertilizer on Soil CO2 Emission Depends on Crop Rotation Strategy

1
College of Agronomy, Northwest A & F University, Yangling 712100, China
2
Agricultural Biotechnology Center of NingXia Academy of Agriculture and Forestry Sciences, Yinchuan 750002, China
3
Research Center for Recycling Agriculture Engineering Technology of Shaanxi Province, Yangling 712100, China
4
Ningxia Agricultural Institute of Survey Design, Yinchuan 750002, China
5
Forest and Desert Control Research Institute of Alxa League, Alxa League 750306, China
*
Authors to whom correspondence should be addressed.
Sustainability 2020, 12(13), 5271; https://doi.org/10.3390/su12135271
Submission received: 14 May 2020 / Revised: 11 June 2020 / Accepted: 21 June 2020 / Published: 29 June 2020
(This article belongs to the Special Issue Sustainable Soil Health Management)

Abstract

:
Developing environmentally friendly and sustainable nitrogen (N) fertilizer management strategies is crucial in mitigating carbon dioxide (CO2) emission from soil. How N fertilizer management practices influence soil CO2 emission rates under different crop rotations remains unclear. The aim of this study was to assess the impact on soil CO2 emission and soil physicochemical properties of three N fertilizer treatments including traditional rate (TF), optimized rate (0.8TF), and no fertilizer (NF) under three different crop rotation treatments: wheat-fallow (WF), wheat-soybean (WS), and wheat-maize (WM) over two years in a field experiment in northwest China. The rates were 5.51, 5.60, and 5.97 μmol·m−2·s−1 of mean soil CO2 emission under the TF, 0.8TF, and NF treatments, respectively. Mean soil CO2 emission rates were 21.33 and 26.99% higher under the WM rotation compared with the WF and WS rotations, respectively. The WS rotation showed higher soil nutrient content and lower soil CO2 emissions, and reduced fertilizer application. Importantly, soil organic carbon (SOC) concentration in the topsoil can be maximized by including either a summer legume or a summer maize crop in winter wheat rotations, and by applying N fertilizer at the optimal rate. This may be particularly beneficial in the dryland cropping systems of northern China.

1. Introduction

Agricultural practices contribute significantly contribute to global climate change, and agricultural soil is a major source of greenhouse gases globally [1]. Agriculture is also considered to increase soil organic carbon (SOC) and net primary production of plants during the growth period to mitigate net greenhouse gas emissions from soil [2]. CO2 emissions from the soil are determined by various environmental factors. (1) Physical properties, such as the activity, communities and function of soil microorganisms [3,4], the quality and amount of organic matter in the soil [5], and texture [6]; (2) environmental conditions of soil such as moisture, pH value, ventilation and temperature [6,7]; and (3) management practices such as land-cover types [8,9], tillage [10], crop rotation [11], irrigation and fertilization [12,13], have been identified as the most important factors influencing soil CO2 emissions. Because soil is a living biological system, CO2 emission is a complex problem, and limited information exists for different rotation and nitrogen (N) fertilizer treatments.
Fertilizer is a key tool in enhancing crop production and is necessary to ensure food security in China [14,15]. The increasing population in China demands much food, but farmland has decreased and water resources are scarce [16]. Farmers are trying to maximize yields, and therefore are compelled to apply more fertilizer, leading to an over-application of N fertilizers [17]. This has become a common problem in village regions in most areas in China [18], and has led to low nutrient use efficiency, which has negative impacts on the environment, and threatens the long-term sustainability of Chinese agriculture [17,19]. After half a century of development, China’s N fertilizer production and consumption rank first in the world, and alone approximately account for around 38% of global N fertilizer applications [20]. Management practices that accumulate soil nutrient resources, such as intercropping practices, and crop rotation, have been gradually discontinued [18]. Farm management has shifted towards a dependence on mineral fertilizers to ensure adequate N supply for crops, and much more N fertilizer than is required is often added to the soil [21]. Average N surplus in crop fields in China has been modeled at 184 kg/ha for rice, 144 kg/ha for wheat, and 120 kg/ha for maize [22]. The greenhouse gas emissions from N fertilizer production, transport, and consumption constitute a large part of the total agricultural emissions in China [19]. Therefore, improvements in N use efficiency in crop production will have significant implications for reducing fertilizer inputs and environmental protection [23,24].
Previous studies have documented that effectively designed and managed crop rotation systems can improve conditions for soil organisms, and reduce the amount of agro-chemical application [25]. Crop rotation is beneficial for agriculture and can improve soil structure, water availability, and root penetration, ultimately improving the fertility of soil and maintaining high productivity [26]. Rotations that include a summer crop and a winter wheat (Triticumaestivum L.) crop are regular in western China and have been used for thousands of years. There has been some research that evaluates the influence of change in SOC concentrations and soil CO2 emissions under long-term cropping system experimentation. However, few studies have investigated soil CO2 emissions under different fertilizer applications in winter wheat plus summer crops such as soybean, maize, and fallow crop rotation.
Knowledge of soil CO2 emissions and the influencing factors, such as biotic and abiotic processes [4], and land-cover types [8], are necessary to further research the response of soil carbon dynamics to soil respiration change. This has been widely adopted in the field of sustainable development in agriculture with agronomic functions such as fertilizer application and crop rotations [25]. A recent study showed that crop rotation with no tillage improved soil microbial biomass compared to fallow fields during winter due to more residue being returned to the soil [26]. However, there has been limited evidence of soil CO2 emission, which is important to soil carbon management in arid regions [27]. The management of crop rotations and fertilizer application increases the productivity of yield and biomass and has a large impact on soil CO2 emission and SOC concentrations, all of which influence soil quality [13]. To find more economically effective and sustainable agriculture systems of using crop rotation and fertilizer rate in the drylands of northwest China, the aims of the current study were to: (1) verify the influences of these practices on soil temperature, soil moisture, soil nutrients, SOC content, and soil CO2 emission dynamics, and (2) determine the relationship between SOC and CO2 emissions and the influencing factors.

2. Materials and Methods

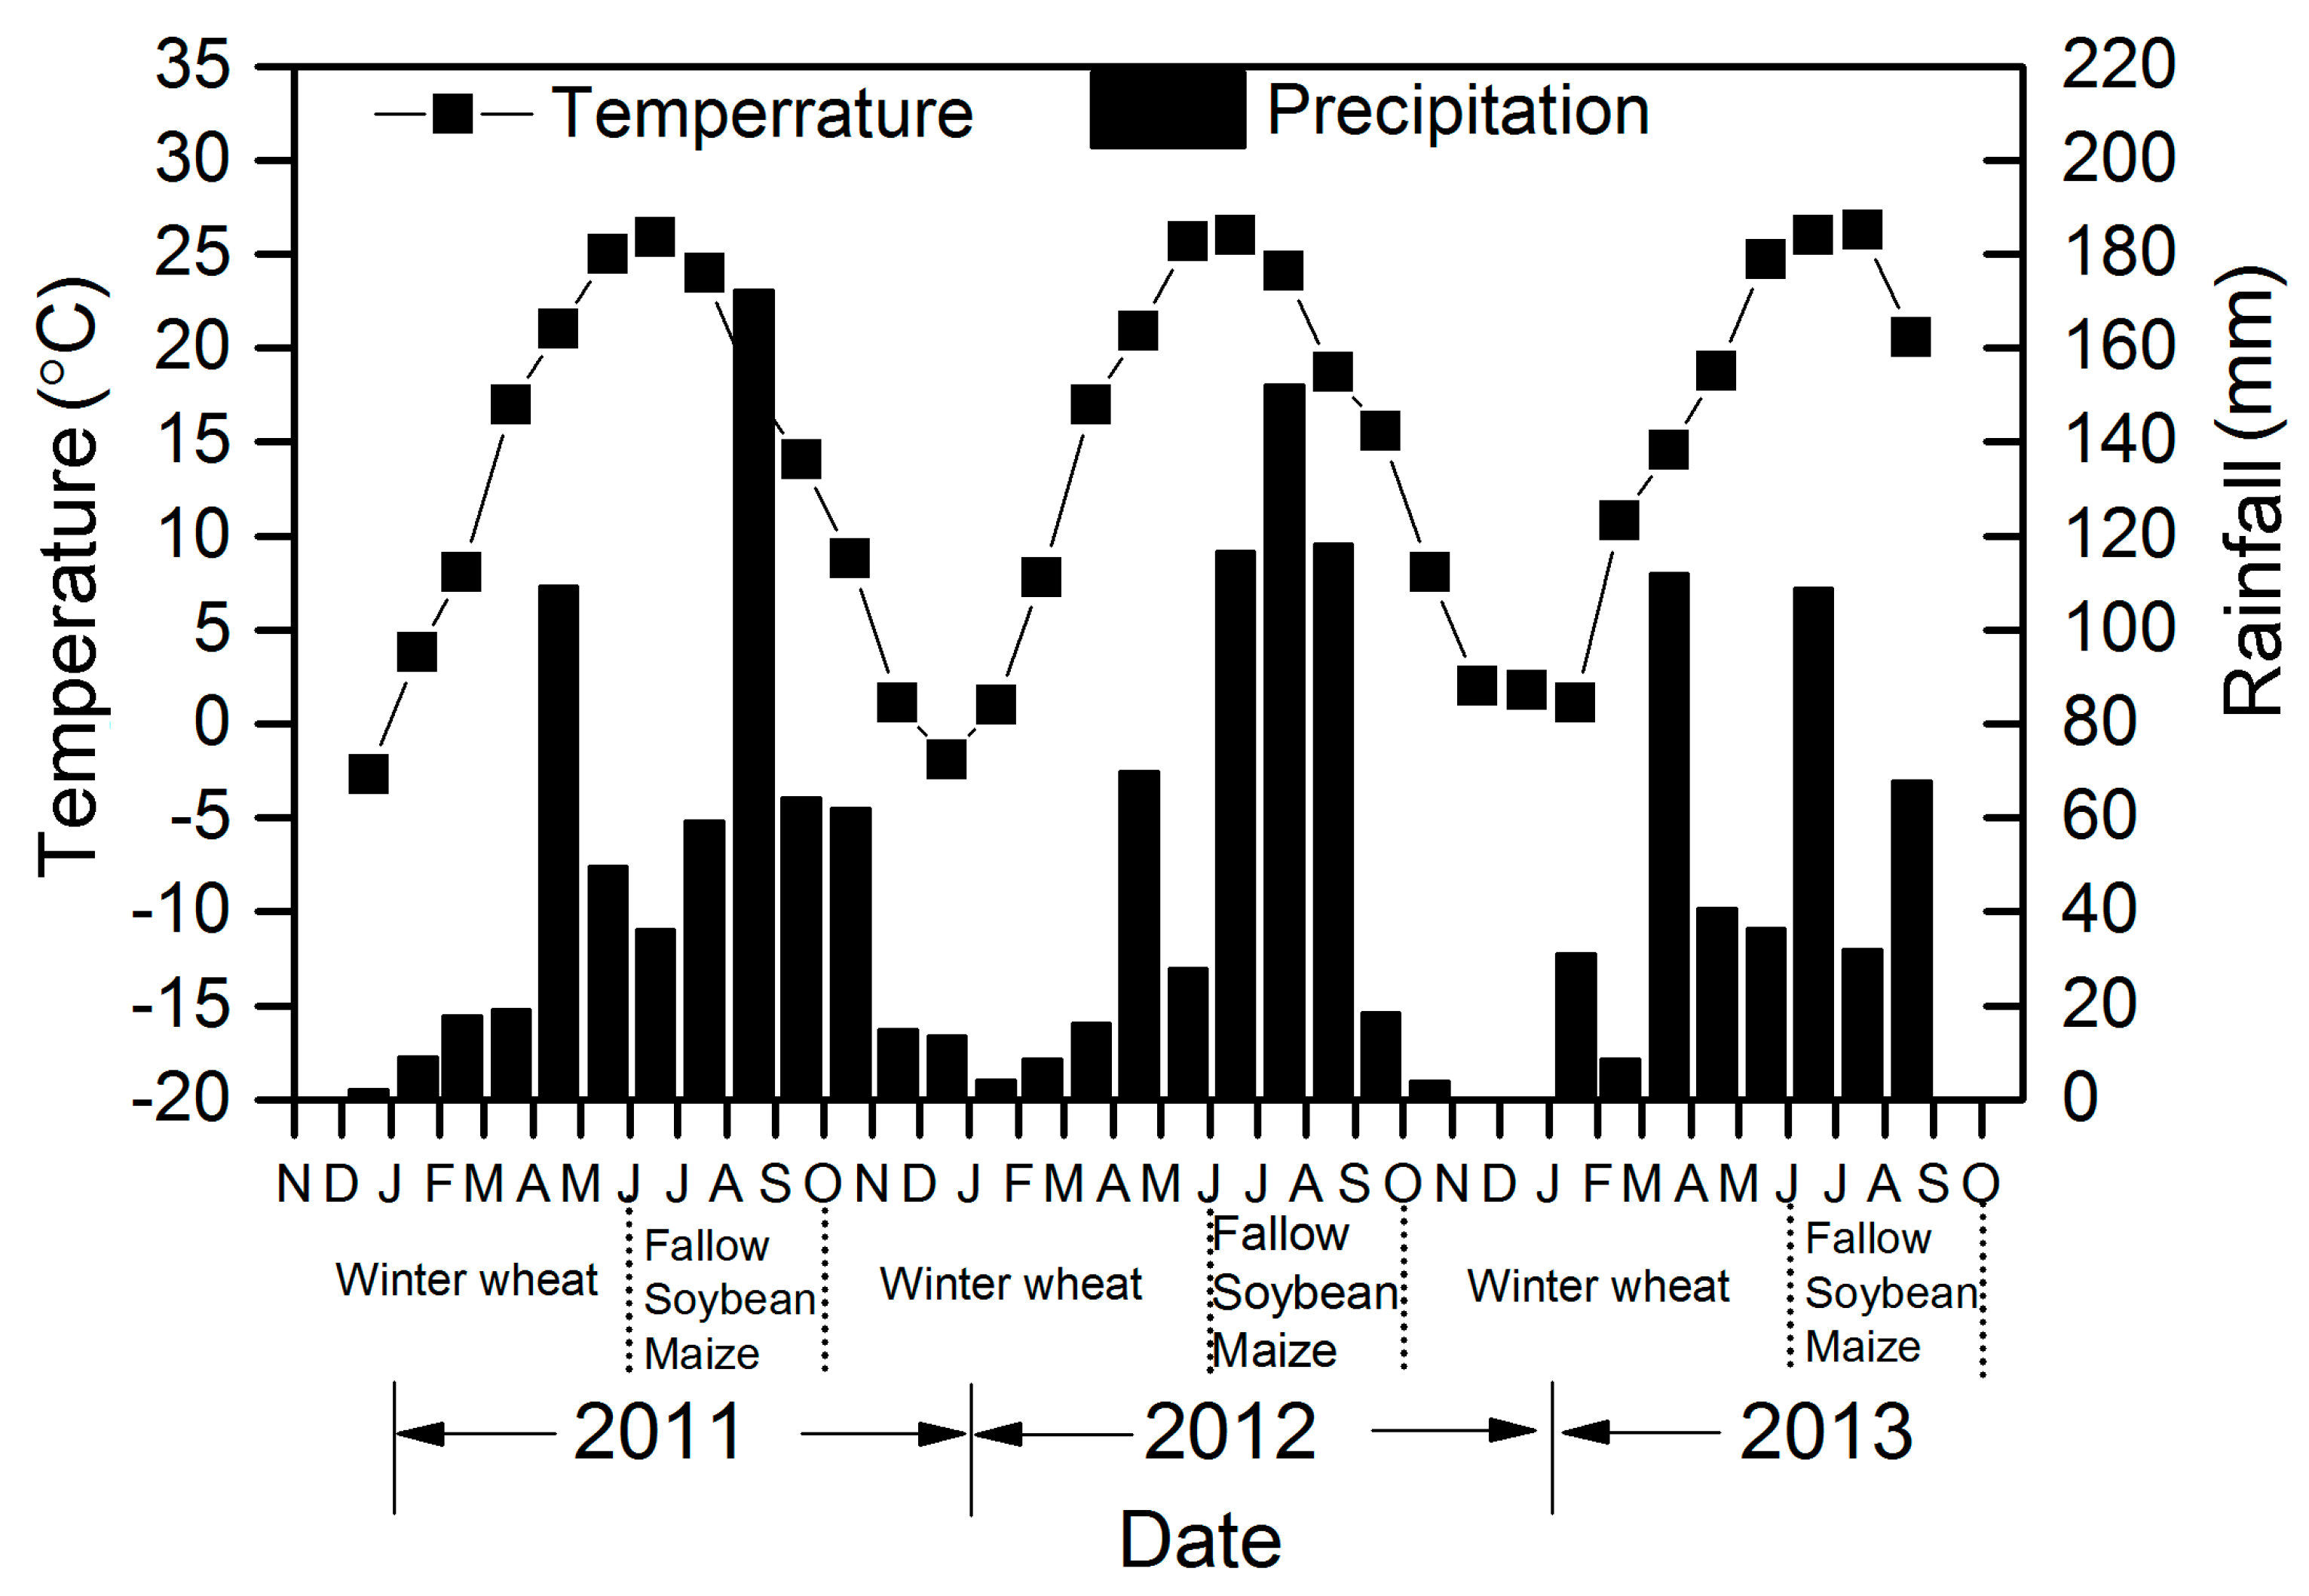
2.1. Site Description

This experiment was conducted in the drylands of Yangling village (34°12′ N and 108°7′ E, at 520 m altitude), Ghuanzhong region, Shaanxi Province, northwest China. The site has an annual mean air temperature of 12.9 °C and an average annual rainfall of 630 mm. The warmest time occurred from July to September, which also had the highest rainfall (Figure 1). The saturated soil water percentage and field capacity were 42.8 and 23%, respectively. The soil texture is silt clay loam, and the soil is classified as Lou soil (anthrosol), with a bulk density of 1.49 g·cm−3. In 2008, at the beginning of the experiment, the soil was found to contain 0.86% organic matter, 12.74 mg·kg−1 alkali-hydrolysable N, 21.72 mg·kg−1 available phosphorus, and 54.52 mg·kg−1 available potassium.

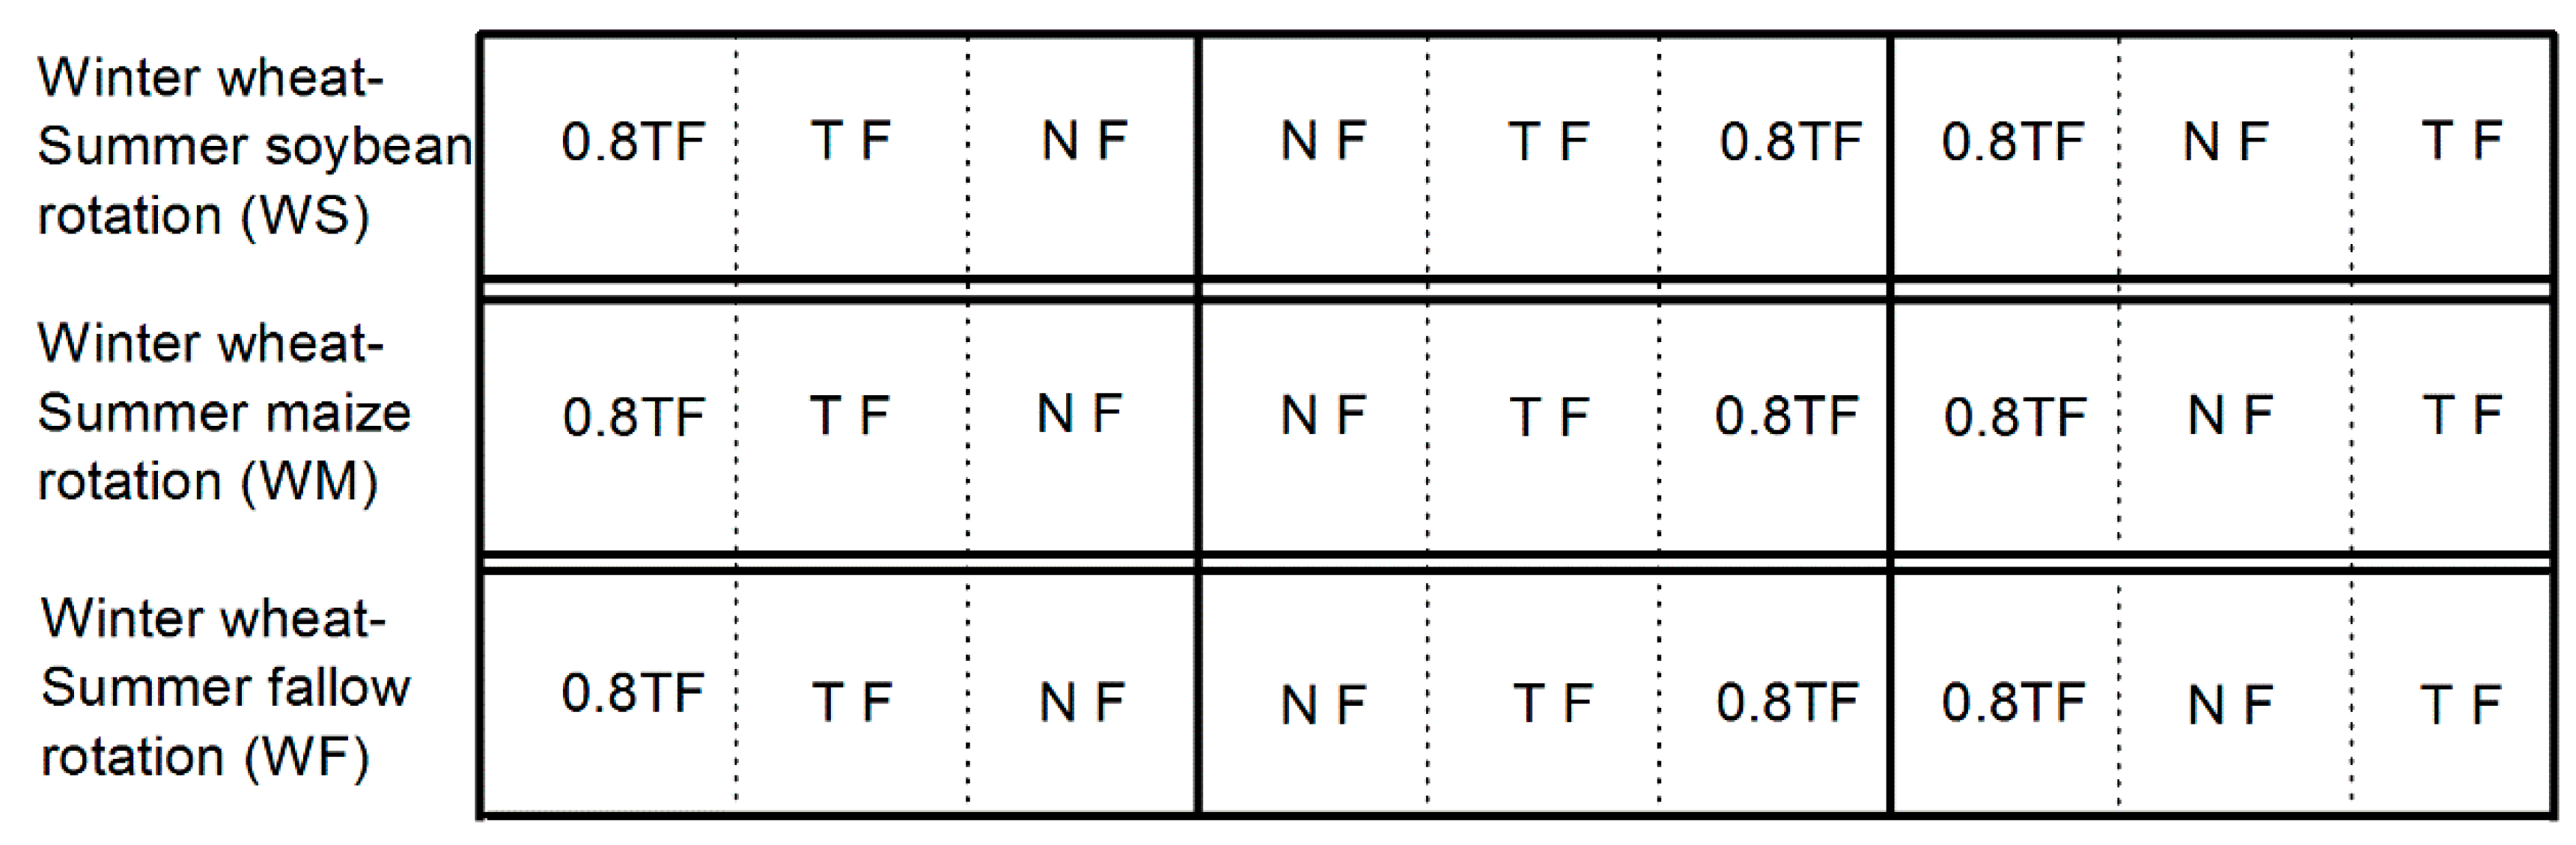
2.2. Experimental Design and Management

The field experiment (established for more than 10 years) was a split-plot design (three replications) with rotation in the main plot and fertilizer treatment in the subplot (Figure 2). The measurements were carried out from June of 2011 to June of 2013. Three rotation strategies that are common in the uplands of this region were used in this study. These included a winter wheat and summer fallow (WF) rotation, a winter wheat (Triticumaestivum L.) and summer soybean (Glycine max L.Merr.) rotation (WS), and a winter wheat and summer maize (Zea mays L.) rotation (WM) (Figure 2). The growing season of summer crops in this area is generally from June to September. The winter wheat growth period is from October to June of the following year (Figure 1). Three fertilizer application treatments were used: (1) the local farmers’ traditional practice rate (TF), in which a base fertilizer was applied once during the winter wheat season providing phosphorus pentoxide (P2O5) at 300 kg·ha−1 and urea (CON2H4) at 300 kg·ha−1, and the WM rotation system had a top-dressing fertilizer providing 300 kg of urea (CON2H4) ha−1, similar to the local farmers’ practice rate and times; (2) optimized fertilization (0.8TF), corresponding to 80% of TF fertilizer amount; and (3) no fertilizer application (NF) (Figure 2).

2.3. Soil CO2 Emission Measurements

Soil CO2 emission was measured using the open-flow dynamic method described by Kong and Wang [28,29,30]. Soil CO2 emission was measured during the growing seasons from 9 August 2011 to 24 May 2013. All measurements occurred between 9:00 and 11:00 a.m. once every 2 weeks. The measurements were delayed by 1–2 days if it was raining on measurement day. The system consisted of a chamber and an infrared CO2 analyzer (Huayun Co. Ltd., Beijing, China; model GXH-3010E1). The chamber was made of PVC, which was 16 cm in diameter and 15 cm in height, and was inserted 4 cm into the soil. Soil CO2 emission was determined as described by Kong and Wang [29,30].
Soil moisture and soil temperature were measured adjacent to the chamber. Soil temperature was measured at depths of 5, 10, 15, 20, and 25 cm in the middle of the crop rows using a buried geothermometer. After crops were harvested, soil cores were taken from 0–100 cm of the topsoil at three points in each plot. Soil samples from three repetitions at the same level were mixed to form a composite sample. Soil samples were air-dried in a room, and then passed through a 0.25 mm mesh, similar to the method described by Kong and Wang [28,30]. The gravimetric soil water content was determined as described by Wang in which soil samples were dried at 105 °C for 48 h [30]. SOC constants were measured using the K2Cr2O7 oxidation method as described by Liu [1]. Alkali-hydrolysable N was analyzed by alkaline hydrolysis [31]. Available phosphorus in the soil at the experimental site was analyzed using the Mo-Sb colorimetric method [32]. Available potassium was analyzed by flame photometry after NH4OAc extraction according to the method by Cambardella et al. [31].

2.4. Statistical Analyses

All data collected from the different treatments were subjected to analysis of variance (ANOVA) using SPSS software (version19.0, Amos Development Corporation, Wexford, PA, USA). Rotation and N fertilization treatments were fixed effects, and the average date of each crop growth period was a repeated measure variable in the mixed-model analysis which was used to evaluate the contribution of individual factors of fertilizer treatments and crop rotation modes. The statistical significance of variance and normality tests was determined using the data (p < 0.05). Correlations between soil moisture, soil temperature, SOC, and soil CO2 were determined using CANOCO 4.5 (Biometris, Wageningen, Netherlands) [33].

3. Results

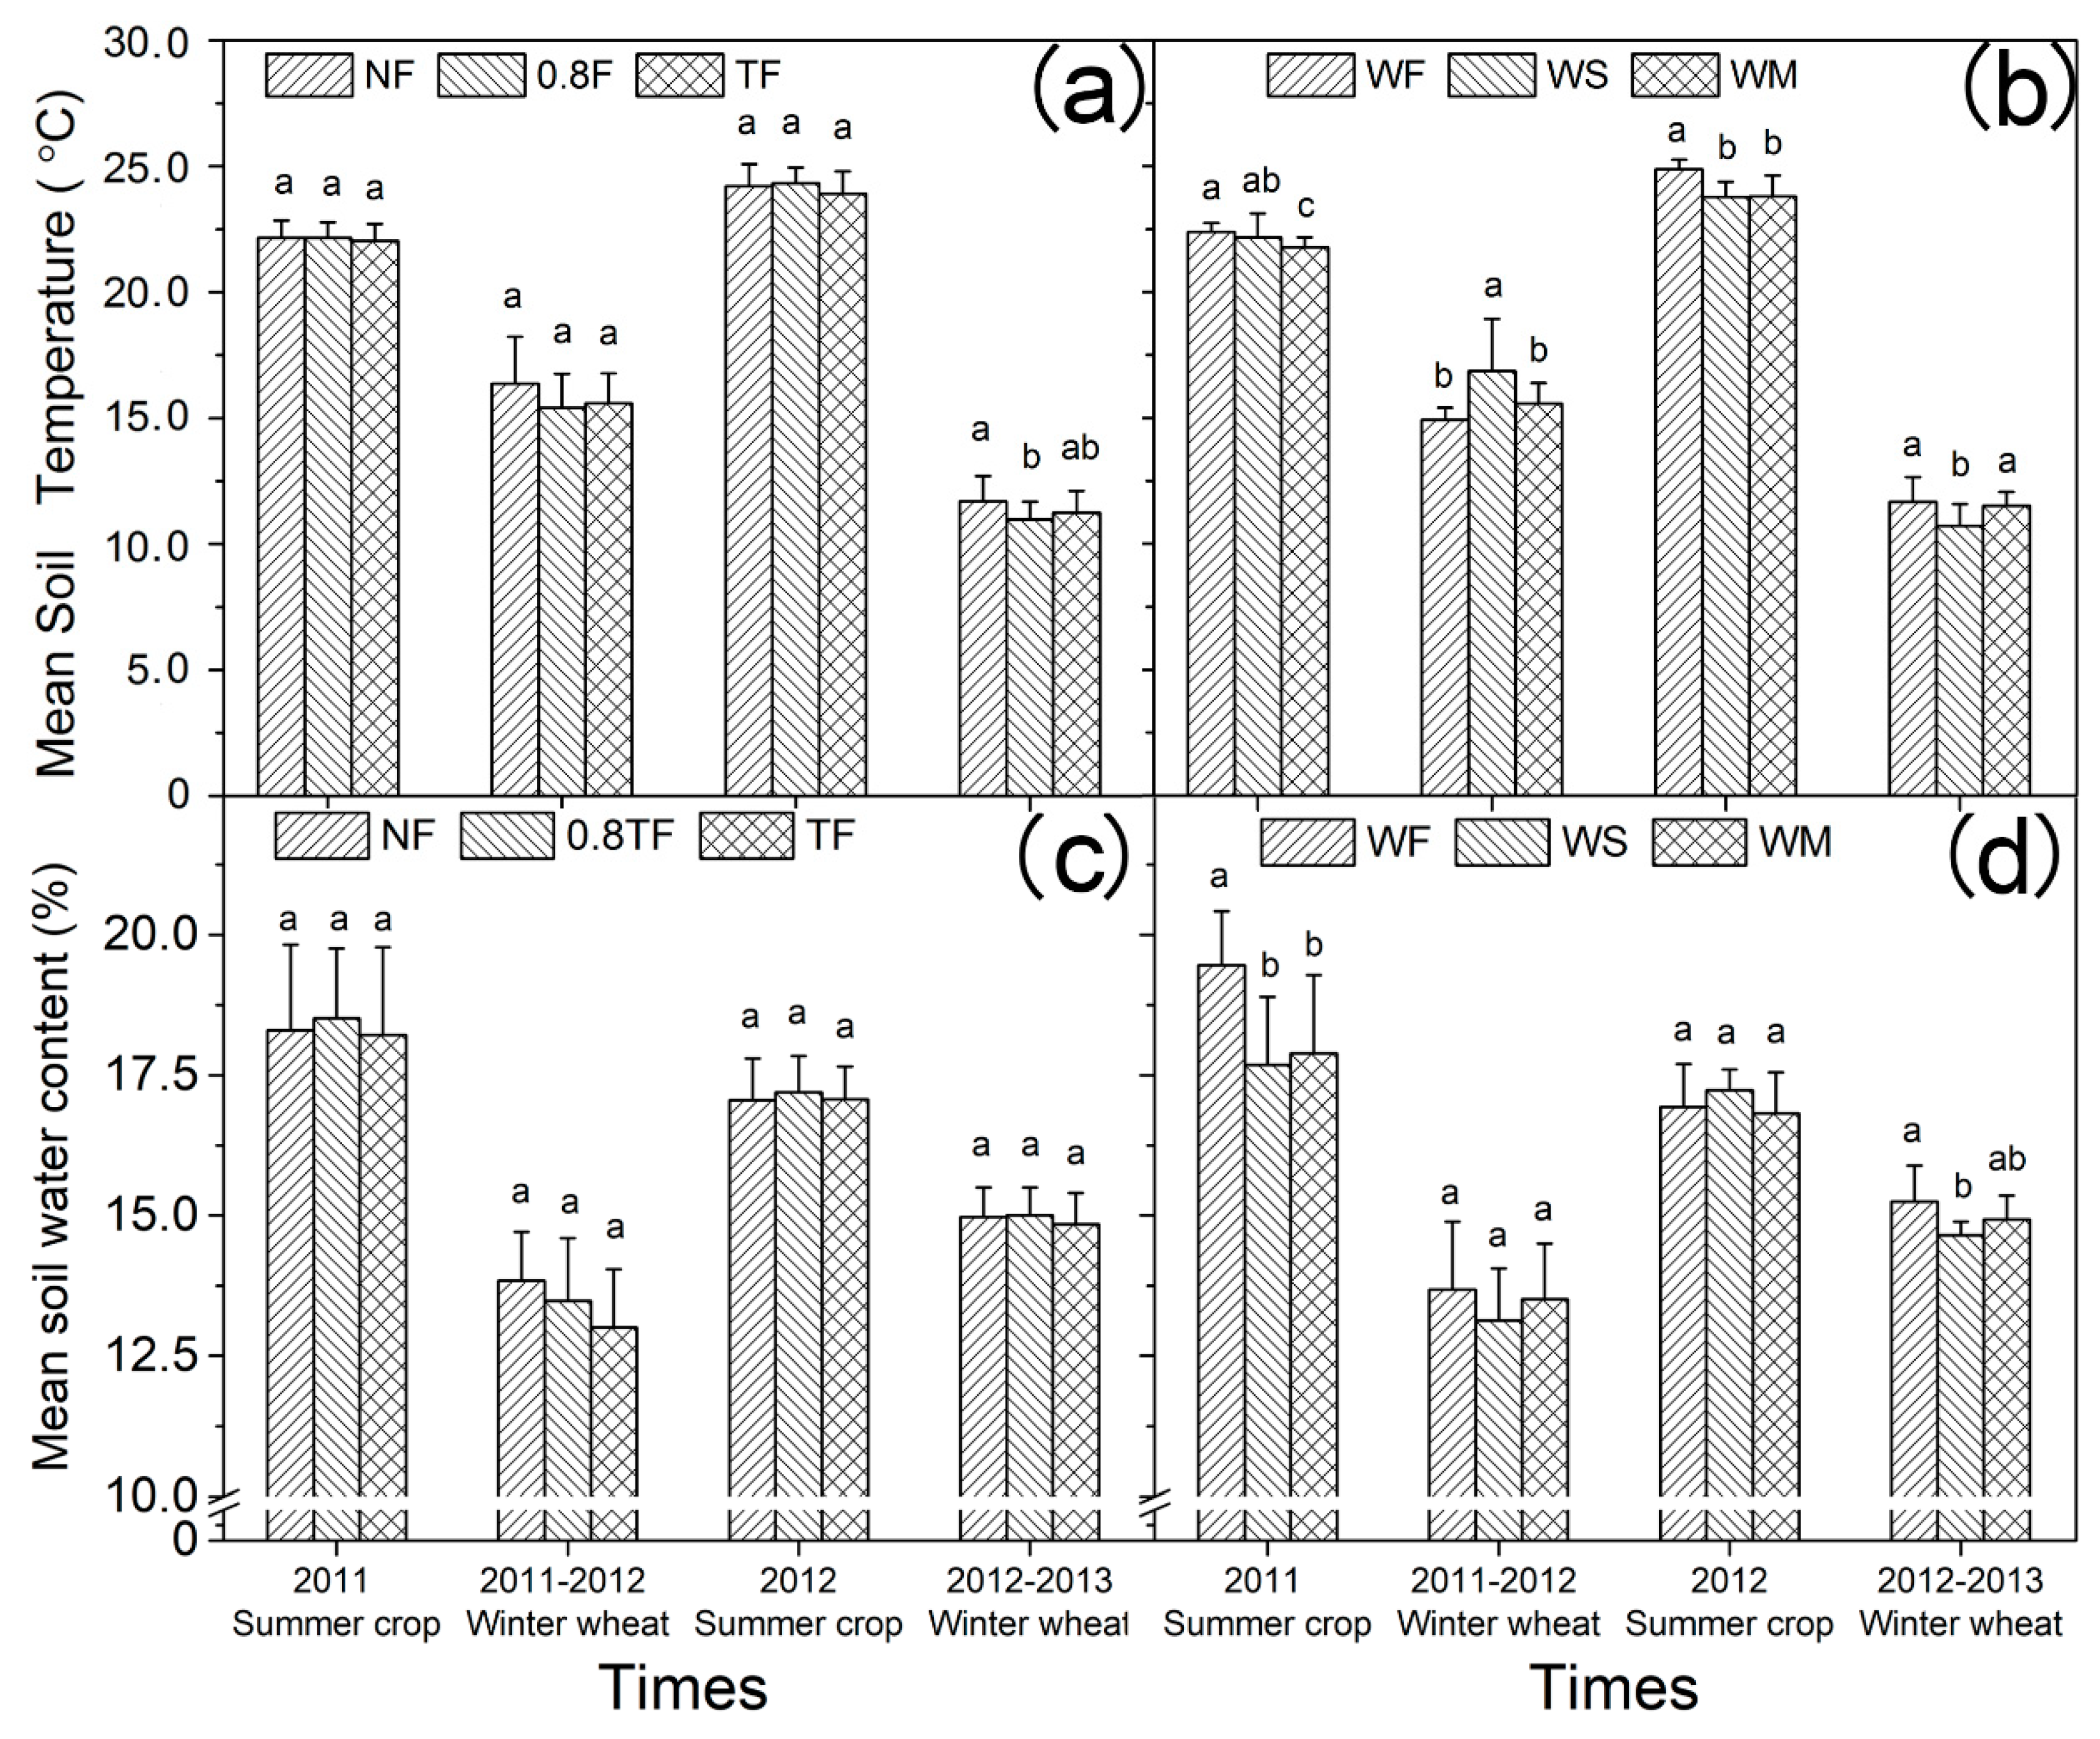
3.1. Soil Temperature and Moisture Content

Soil temperature in the 0–25 cm soil layer was similar between N fertilizer and rotation treatments (Figure 3a,b, Figure S1). The mean soil temperature under WF, WS, and WM was 17.24, 17.21, and 17.19 °C, respectively, and the soil temperature under NF, 0.8TF, and TF, was 17.49, 17.06, and 17.09 °C, respectively. The average soil temperature under the NF treatment was higher than that under the other two fertilizer treatments during the growth period of winter wheat. The average soil temperature under the WF rotation was higher than that under the other two rotations during the summer crop growth period. During the 2011 summer crop, 2011–2012 winter wheat, and 2012 summer crop growing seasons, soil temperature significantly differed among the three rotation modes, but there were no significant differences between the three fertilizer treatments.
The mean soil moisture content of the WS and WM rotation modes was lower than that of the WF rotation under the same rainfall conditions (Figure 3c,d, Figure S2). Average soil moisture was 15.90, 15.43, and 15.62% under WF, WS, and WM, respectively. The average soil moisture levels were 15.72, 15.72, and 15.52% under the NF, 0.8TF, and TF treatments, respectively. Soil moisture content was 17%–21% during the summer crop growth periods over the two years, since this was the season when precipitation increased (Figure 1 and Figure 3). Soil water content during the maturity stage of winter wheat, when wheat growth requires extra water, was 8%–15%. Mean soil moisture varied significantly under the 2011 summer crop and the 2012–2013 winter wheat among the three rotation treatments. However, N fertilizer showed no significant differences in mean soil moisture content.

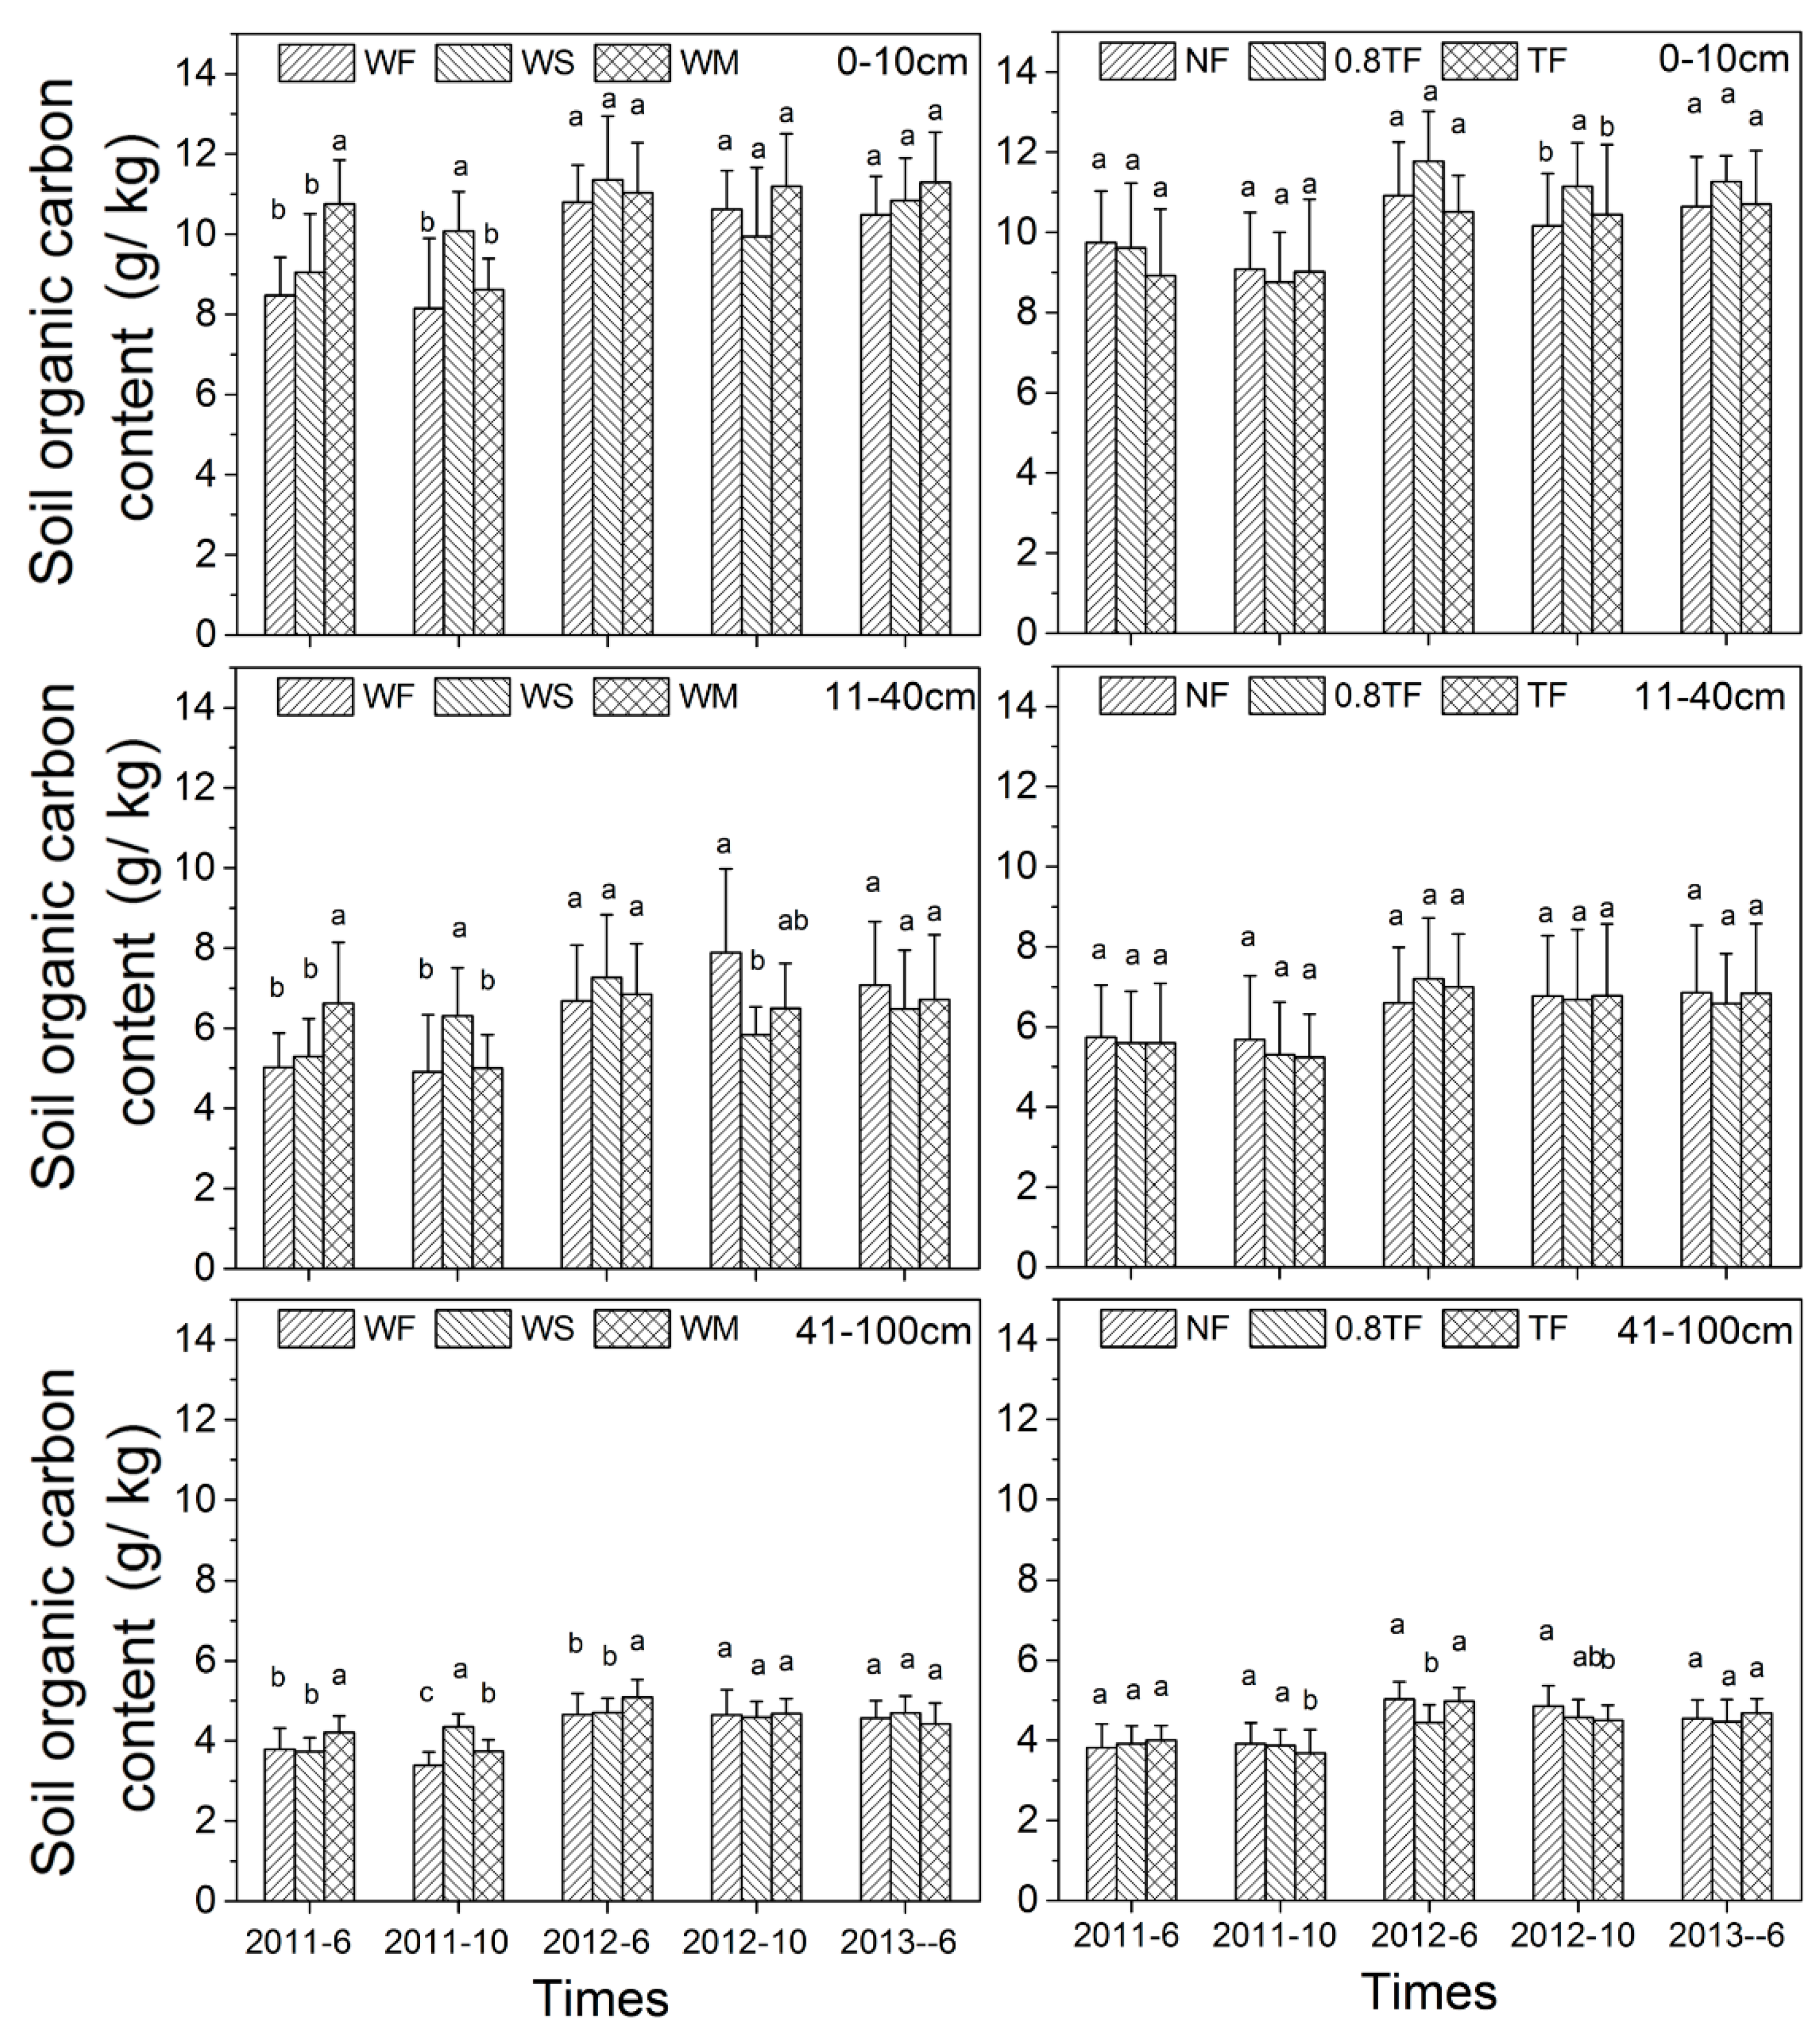
3.2. Soil Organic Carbon (SOC)

The mean SOC content in the 0–100 cm soil layer varied under different rotations and N fertilizer treatments. Under the WF rotation, the SOC content was 5.45, 5.31, and 5.41 g/kg, under the WS rotation it was 5.53, 5.68, and 5.42 g/kg, and under the WM rotation it was 5.72, 5.47, and 5.66 g/kg for the N fertilizer treatments NF, 0.8TF, and TF, respectively (Figure S3). After 10 years under the crop rotations and N treatments, treatments showed significant differences with respect to SOC content. The mean SOC content increased by 24.56, 20.44, and 5.58% under the MF, MS, and MW rotations mode over the study period in the 0–10 cm soil layer, and by 10.30, 20.12, and 20.17% under the TF, 0.8TF, and NF treatments, respectively (Figure 4). During the 2011 summer crop period, significant differences in SOC were found between the three rotation modes in the 0–10 cm and 11–40 cm soil layers.

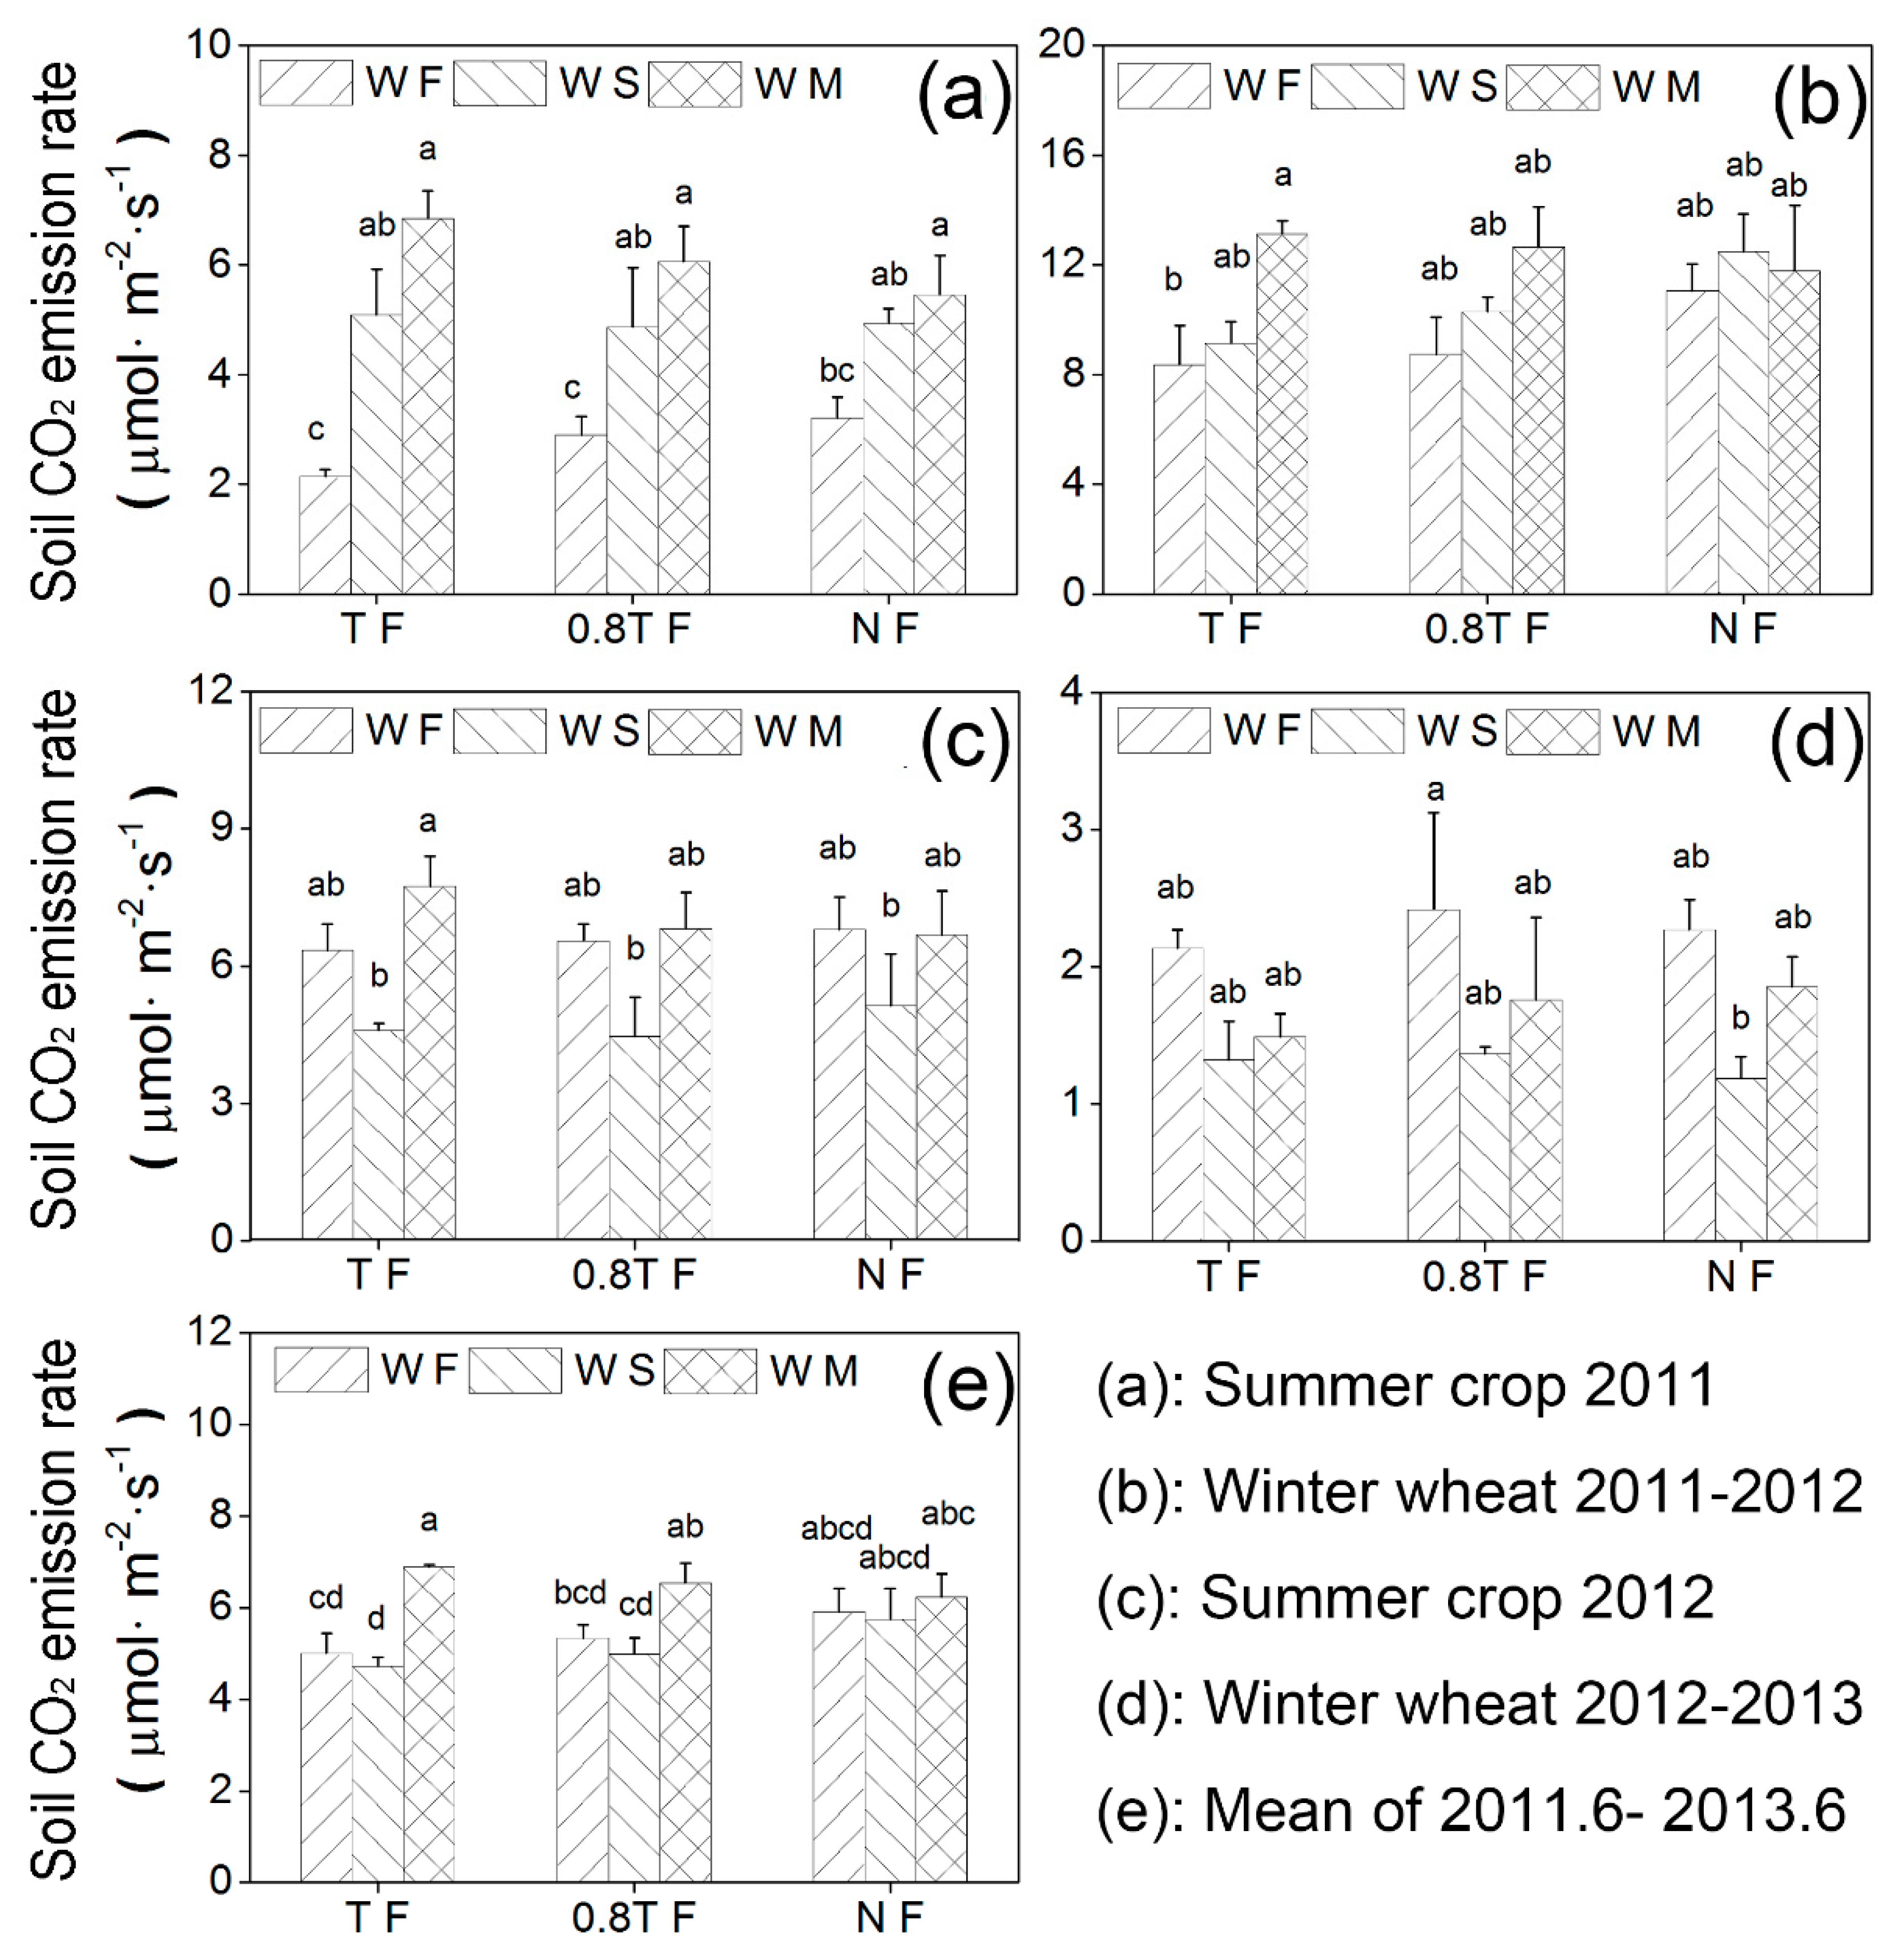
3.3. Soil CO2 Emission
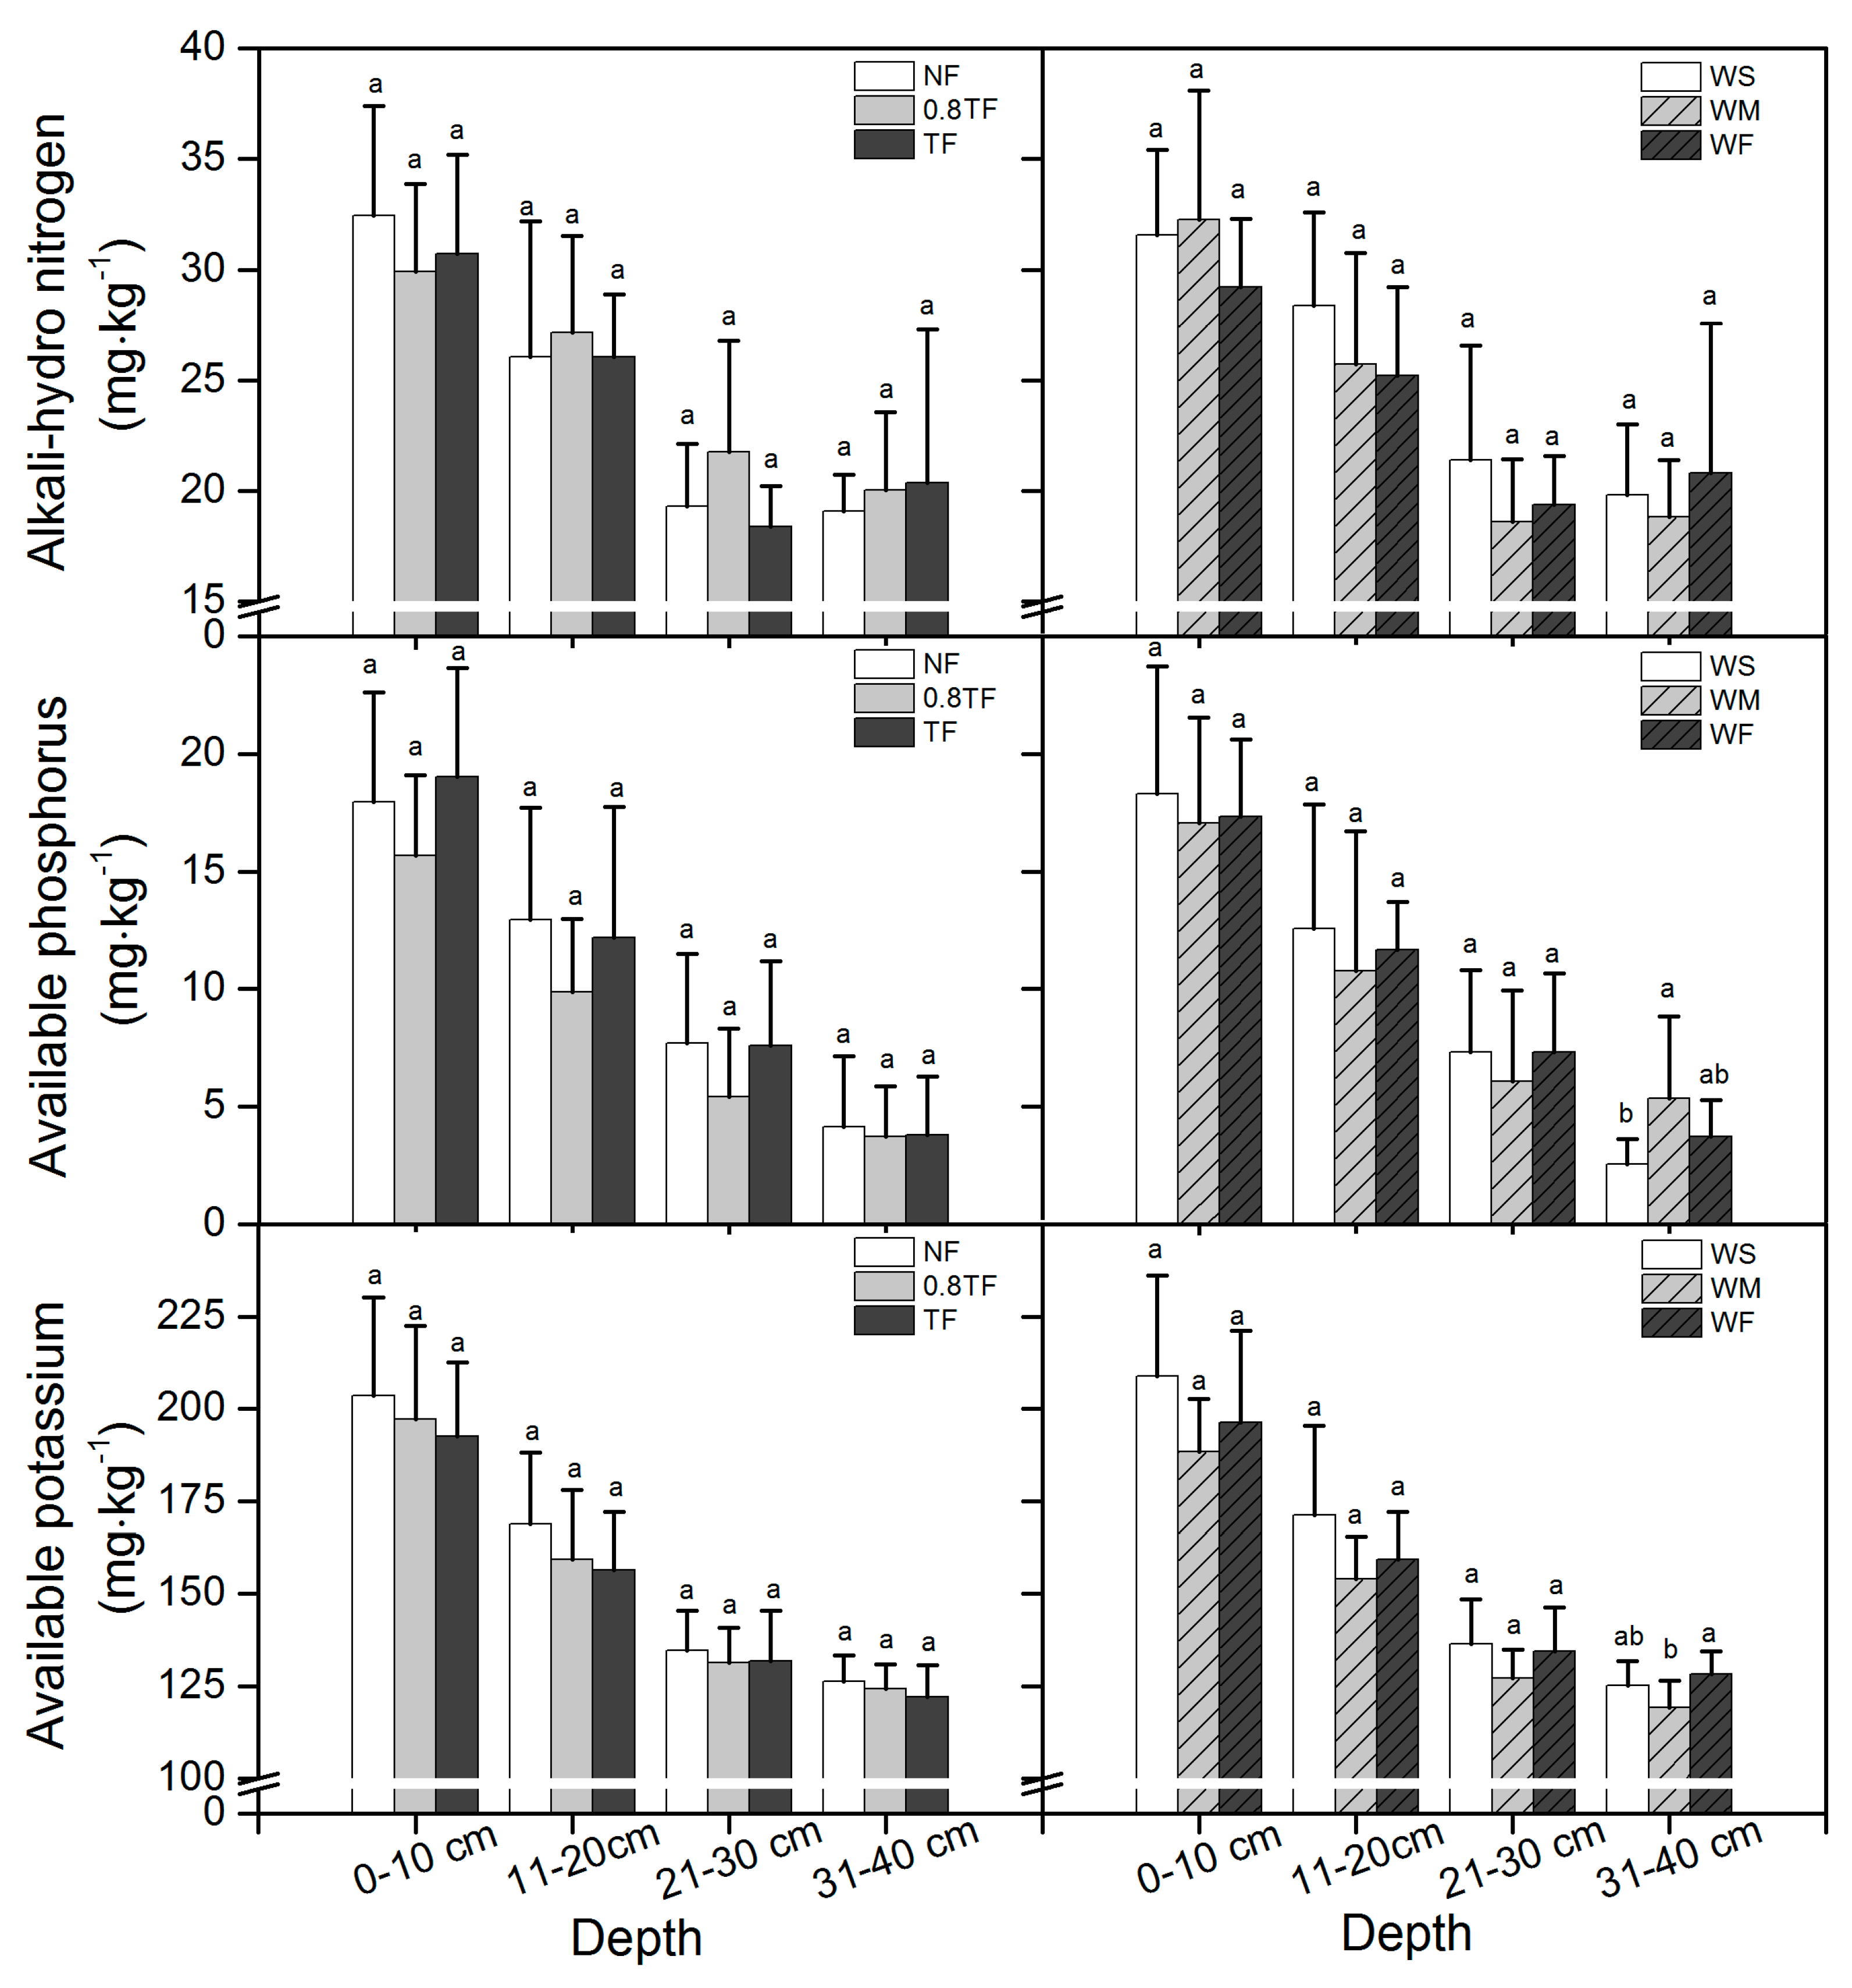
Soil CO2 emission under the three N fertilizer treatments and three rotation treatments followed similar trends over time (Figure 5, Figure S4). High soil CO2 emission rates occurred when soil temperature was high, and low soil CO2 emission rates occurred when soil temperature was low (Figure 5). The average soil CO2 emission was 5.51, 5.60, and 5.97 μmol·m−2·s−1 under the TF, 0.8TF, and NF treatments, respectively. The average soil CO2 emission rate under the WF, WS, and WM rotation modes was 5.39, 5.15, and 6.54 μmol·m−2·s−1, respectively (Figure 5). Except for during winter wheat growth in the 2011–2012 season, there were no significant differences in average soil CO2 emission rate between the three rotation modes or between the N treatments. During the study period, mean soil CO2 emission under the WF and WS rotations decreased with increasing amounts of N fertilizer, while under the WM rotation it increased with increasing amounts of N fertilizer.
During the summer crop growing seasons (Figure 5), the soil CO2 emission differed significantly (p = 0.0095 and p = 0.03 in 2011 and 2012, respectively) between the three rotation modes. The average soil CO2 emission rate of the WF rotation mode was the lowest of the three rotation modes, and the WM rotation was the highest. During the summer growth period of 2011, the average CO2 emission rates were 2.75, 4.96, and 6.12 μmol·m−2·s−1 under the WF, WS, and WM rotation modes, respectively. The average CO2 emission rate was 4.69, 4.61, and 4.53 μmol·m−2·s−1 under the TF, 0.8TF, and NF treatments, respectively. The average soil CO2 emission rate during the 2012 summer growth period under the WF, WS, and WM rotation modes was 6.57, 4.73, and 7.01 μmol·m−2·s−1, respectively, and it was 6.16, 5.94, and 6.20 μmol·m−2·s−1 under the TF, 0.8TF, and NF treatments, respectively.
The results of this study show that the three rotation modes produced significant differences in soil CO2 emission rates during the 2012–2013 winter wheat growing season, but there was no effect of N fertilizer treatment (Figure 5). The mean soil CO2 emission rate under the WF, WS, and WM rotation modes was 9.39, 10.64, and 12.52 μmol·m−2·s−1, respectively in the 2011–2012 winter wheat growing period, and 2.27, 1.29, and 1.70 μmol·m−2·s−1, respectively, during the 2012–2013 winter wheat growing season. The mean soil CO2 emission in the 2011–2012 winter wheat growing period under the TF, 0.8TF, and NF treatments was 10.21, 10.56, and 11.77 μmol·m−2·s−1, respectively, and it was 1.63, 1.85, and 1.77 μmol·m−2·s−1, respectively, during the 2012–2013 winter wheat growing period.

3.4. Soil Nutrients

The alkali-hydro N, available phosphorus, and available potassium concentrations varied under different crop rotations and N fertilizer treatments in the 0–40 cm soil layer over the two years (Figure 6). No significant difference in alkali-hydro N concentration between the two years was found. The mean alkali-hydro N concentrations were 24.22, 24.72, and 23.87 mg/kg under the TF, 0.8TF, and NF treatments, respectively, and 23.66, 25.29, and 23.86 mg/kg under the WF, WS, and WM crop rotations, respectively. The mean available phosphorus concentrations were 10.68, 8.67, and 10.65 mg/kg under the TF, 0.8TF, and NF treatments, respectively, and 10.01, 10.18, and 9.82 mg/kg under the WF, WS, and WM crop rotations, respectively. The mean available potassium concentrations were 158.31, 153.05, and 150.77 mg/kg under the TF, 0.8TF, and NF treatments, respectively, and 154.52, 160.41, and 147.20 mg/kg under the WF, WS, and WM crop rotations, respectively.

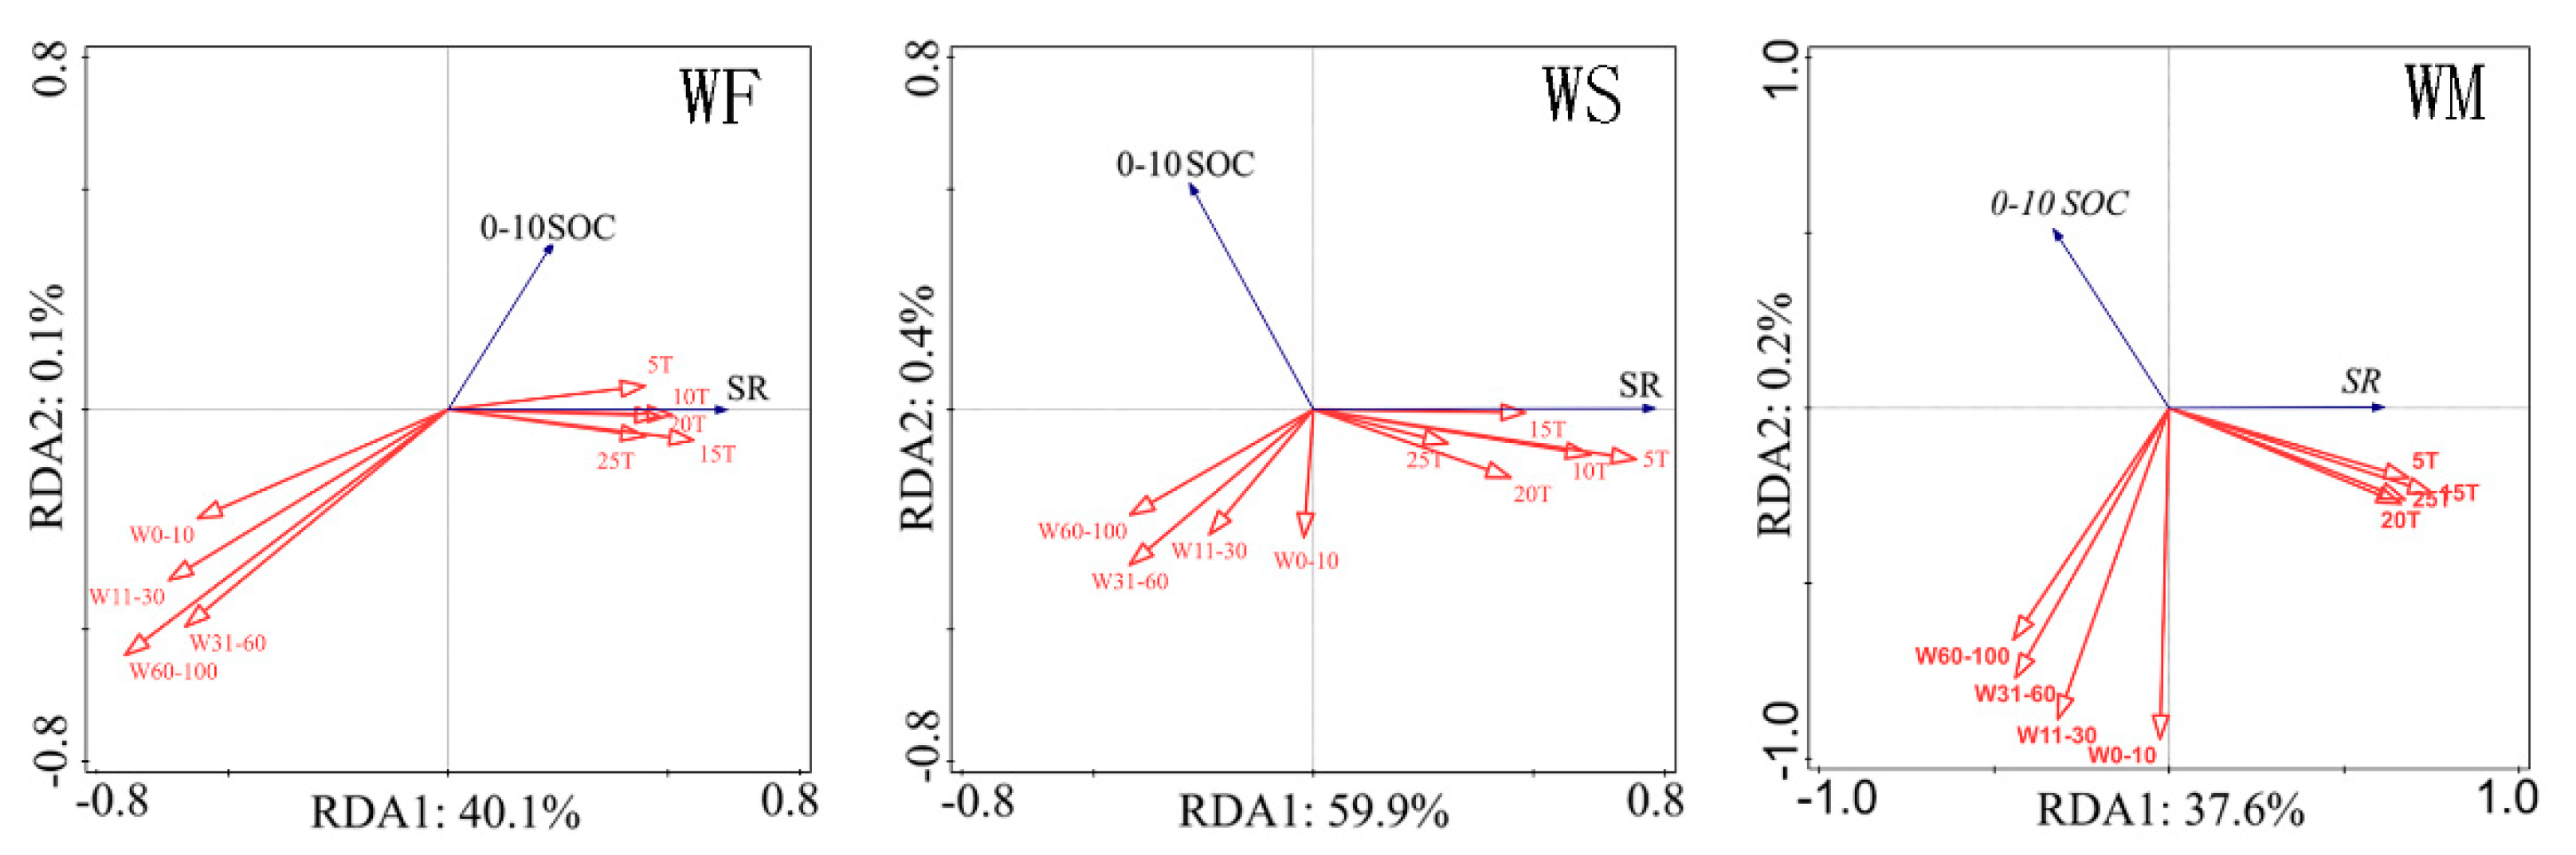
3.5. Relationship between Soil Organic Carbon and CO2 Emission and Treatment Factors

Crop and soil variability affected soil CO2 emission. The relationship between soil temperature and soil CO2 emissions was identified by a redundancy analysis (RDA) (Figure 7). Soil temperature was strongly correlated with soil CO2 emission rate and SOC concentration during the two-year study under the three N fertilizer treatments and the three rotation modes, and explained 16.8, 47.40, and 24.10% of variation in the WF, WS, and WM rotations, respectively. Correlation analysis showed that soil CO2 emission rate was negatively correlated with soil water content, and that soil water content may decrease the release of CO2 from deep soil.

4. Discussion

4.1. Effect on Soil Temperature, Soil Moisture, SOC, and Soil CO2 Emission in the Rotation Mode

It has been reported that adopting intensified rotation can lower the carbon footprint in semiarid areas [34]. Winter wheat plus summer soybean or summer maize are the most common double cropping systems in the Ghuanzhong region, Shaanxi Province in north-central China [35]. A previous study found that the yields of crop residue varied under different rotation modes [36]. The quality and quantity of crop residues returned to the soil changes with the different cropping structures, with the C/N ratio of the residues varying with the different crop rotation modes [37], which can influence CO2 emissions, and concurs with previous findings [38]. The current study shows that the average CO2 emission from the WM and WF rotation modes was higher than that from the WS rotation during the growing seasons over the two-year study period. The soil CO2 emission rate was low during the summer crop growth period under the WF rotation mode, possibly due to the lack of plants during this period. The average soil CO2 emission rate decreased with increasing amounts of N fertilizer under the WF rotation mode, while the average soil CO2 emission rate under the WM rotation increased with increasing amounts of N fertilizer. The average soil CO2 emission rate was similar under the WS rotation among N fertilizer treatments. A crop rotation strategy that included a legume reduced carbon losses, which is in line with the findings of Miao [18].
Crop communities are drivers of soil CO2 emissions [39]. Soil CO2 emission rate had a stronger correlation with SOC under the WF rotation mode in the 0–10 cm soil layer than the correlation under the WS and WM rotations (Figure 7). The main reason for this is that the WF rotation did not include crops during the summer period, contrary to the WS and WM crop rotation, leading to a decrease in crop root CO2 emission. Soil CO2 emission under the WF rotation came from the transformation of organic matter and microbial CO2 emission, which is a source of CO2 emissions [40]. Microbial activity is positively influenced by soil organic matter content and climate change [41]. Soil microbial activities are enhanced when legumes and non-legumes are grown together compared to non-legumes grown alone [42], and legume and non-legumes grown individually [43]. Soil CO2 emissions are strongly affected by plant roots [4], which was reflected in the differences between the summer crop soils and the summer fallow soil in the current study.
Changes in land use might affect efforts to improve the quantity and activity of the SOC pool [44]. In the current study, SOC in the topsoil (0–10 cm) increased over the two-year study period under all three rotations. Early data have shown that proper adoption of crop rotation can improve soil chemical and physical properties, increase the quality of SOC and soil environmental conditions, limit soil erosion, and increase agricultural productivity, thus contributing to sustainable agriculture [11]. Higher SOC content under the WM rotation than WF and WS rotation indicates that soybean, a leguminous crop, decreased SOC content despite increasing soil N content, which concurs with previous studies [11]. Ardell (2012) also reported that the rate of gain in SOC under continuous corn rotations was higher than that under a corn–winter wheat–grain sorghum–soybean rotation [37]. This might be due to different crop rotations influencing the amount of crop root residue and root exudation that is returned to the soil, which in turn affects C and N content, and can be used to increase SOC [30]. However, soil organic matter changes slowly over time [11].
Temperature was the main factor driving variation in soil CO2 emission rates [30]. This may be due to its effect on the decomposition of plant residues and SOC by microbes, the diffusion of enzymes, and root CO2 emission [30,41]. A redundancy analysis (RDA) showed that soil temperature at 10 cm was positively correlated with soil CO2 emission. The main reason for this might be that the temperature of soil at 5 cm was affected by air temperature. Soil temperature was measured between 9:00 and 11:00 a.m., and soil temperature at 5 cm increased with air temperature, while the response in soil temperature at 10 cm was delayed.
Soil moisture plays an integral role in determining CO2 emissions; a prolonged period with deficient or excess water in the soil can cause soil CO2 emission rates to fall [45]. The rate of soil CO2 emission under winter wheat in 2011–2012 was higher than that in 2012–2013, which may be due to the low level of soil moisture in 2011–2012 compared with 2012–2013, and the soil temperature was higher in 2011–2012 than it was in 2012–2013. During the winter wheat growth period, precipitation was below average, and thus, the soil was almost dry with minimal water content. Soil water can restrict the diffusion of soil CO2 in soil pores, and lower temperatures reduce the activity of microorganisms [6]. Redundancy analysis (RDA) showed that soil CO2 emission was negatively correlated with soil moisture and positively correlated with soil temperature. However, soil water responded to precipitation events during the summer crop period with higher water levels. Water content was greater in the WF rotation than in the WS and WM rotations, which may be due to the absence of plants during the fallow period, which reduces the consumption of soil water, which is in line with the observations made in previous studies [38].

4.2. Influence of N Fertilizer on Soil Organic Carbon (SOC), Soil Temperature, Soil Moisture, and Soil CO2 Emissions

China’s N fertilizer production exceeds its consumption, and N fertilizer application rates exceed crop requirements for maximum yield, which is a common problem in the North China Plain [46]. Small-scale farmers lack knowledge of N management, and hand application of fertilizers (to increase yield) has led to excessive application and low fertilizer use efficiency in farming systems in China [18]. Improving fertilizer use efficiency in crop production is a key issue for addressing the triple problem of food security, environmental degradation, and climate change, and has major ramifications for global emissions [22,23]. Agricultural CO2 emissions are augmented by N fertilization [19,47]. This is probably due to increased root CO2 emission, large amounts of crop root residue, and root exudations, which increase carbon substrate availability, and lead to soil organic matter decomposition and enhanced microbial activity [47]. However, N fertilization can have variable effects on CO2 emissions [48]. Compared to unfertilized soil, another study showed that N fertilization decreased CO2 emissions by 27–42% [49]. In the current study, the soil CO2 emission rates under different N fertilizer treatments were in the following order: NF > 0.8TF > TF. This indicates that N application can reduce CO2 emissions from croplands. This is likely due to reduced soil organic matter mineralization [49]. Due to lack of fertilizer treatment, decomposition of native soil organic matter was likely to have occurred [19,48].
Plant yield, biomass, tiller number, and leaf size of wheat are affected by N fertilizer application and result in different soil temperature and water moisture levels [14]. Crop height, tiller height, and leaf area of winter wheat under N fertilizer application was significantly greater than it was with no N fertilizer application. In the current study, average temperature across the winter wheat growth periods was higher under the NF treatment than the 0.8TF and TF treatments. The temperatures of soil under NF treatment were higher than those under the 0.8TF and TF treatments, because the shading of straw in the NF treatment was lower than it was under 0.8TF and TF treatments, in agreement with Sainju et al. [38]. Crop production is limited by soil water content in dryland agriculture in China [50]. There were no significant differences in average soil moisture levels under the three N fertilizer treatments.
A previous study found that enhancing soil carbon sequestration can improve soil quality, increase net primary productivity of plant biomass, and reduce agriculture’s contribution to soil CO2 emissions [34]. The results demonstrated that the concentration of easily decomposed SOC is the main factor affecting the soil CO2 emission rate, which is influenced by N fertilization. A similar conclusion was reached by Ding [48]. However, it is debatable whether N fertilizer application is beneficial for SOC sequestration. Limited N application may reduce total crop biomass [23], whereas optimized N application can improve plant growth and increase the amount of residues returned to the soil. We found that optimized N application can increase soil organic matter content and carbon sequestration [51]. In this study, SOC content in the 0–10 cm soil layer increased by 10.30, 20.12, and 20.17% between the summer of 2011 and the summer of 2013 under NF, 0.8TF, and TF, respectively. However, chemical fertilizer application can accelerate the decomposition of original SOC [47]. As a result, the average SOC content in the 0–10 cm soil layer of the 0.8TF treatment under all the three rotation modes was higher than that under the other two fertilizer treatments.

5. Conclusions

This research demonstrates that crop rotations and N fertilizer application can affect soil CO2 emission and SOC in the field. The different crops in the three rotations under the three N fertilizer treatments led to different soil CO2 emission rates, soil temperatures, and soil water moisture levels, with the soil CO2 emission rate under the WM rotation higher than the WF and WS rotations. The mean soil CO2 emission rate under the NF treatments was higher than those under the TF and 0.8TF treatments. Based on this, it is concluded that under the WS rotation the soil CO2 emission rate was lower and the N use efficiency was higher because of the leguminous summer crop, which produces symbiotically fixed N. In the future, WS rotation with higher soil nutrient content, lower soil CO2 emissions, and reduced fertilizer application will be the most effective protocol for sustainable agriculture, as well as being a better option in this region.

Supplementary Materials

The following are available online at https://www.mdpi.com/2071-1050/12/13/5271/s1—Figure S1: Changes in soil temperature under different crop rotations and N fertilizer treatments. Bars show means± s. e. m. Figure S2: Changes in soil water content under different crop rotations and N fertilizer treatments. Figure S3: Soil organic carbon content of the 0–100 cm soil layer under three N fertilizer treatments and three rotation treatments. Figure S4: Changes in soil respiration rate under different crop rotations and fertilizer treatments.

Author Contributions

G.Y., G.R. and Y.F. initiated and designed the experiments. H.L. and W.W. performed the experiments; C.R. contributed reagents/materials/analysis tools and analyzed the relationship between SOC and CO2 emission by RDA; N.L. (Nana Liu) and N.L. (Na Li) analyzed the data of SOC; D.K. wrote the manuscript. All authors have read and agreed to the published version of the manuscript.

Funding

This research was supported by Shaanxi Provincial Government (Projects 2016KTCL02-11) and supported by NingXia Academy of Agriculture and Forestry Sciences (Projects QCYL2018-09), and (Projects YES-16-09).

Conflicts of Interest

The authors declare no conflict of interest. The funders had no role in the design of the study; in the collection, analyses, or interpretation of data; in the writing of the manuscript, or in the decision to publish the results.

References

  1. Liu, Y.; Hu, C.; Mohamed, I.; Wang, J.; Zhang, G.S.; Li, Z.G.; Chen, F. Soil CO2 emissions and drivers in rice-Wheat rotation fields subjected to different long-term fertilization practices. Clean-Soil Air Water 2016, 44, 867–876. [Google Scholar] [CrossRef]
  2. Kuhn, N.J.; Hu, Y.X.; Bloemertz, L.; He, J.; Li, H.W.; Greenwood, P. Conservation tillage and sustainable intensification of agriculture: Regional vs. global benefit analysis. Agric. Ecosyst. Environ. 2016, 216, 155–165. [Google Scholar] [CrossRef]
  3. Ren, C.J.; Wang, T.; Xu, Y.D.; Deng, J.; Zhao, F.Z.; Yang, G.H.; Han, X.H.; Feng, Y.Z.; Ren, G.X. Differential soil microbial community responses to the linkage of soil organic carbon fractions with respiration across land-use changes. For. Ecol. Manag. 2018, 409, 170–178. [Google Scholar] [CrossRef]
  4. Acosta-Martínez, V.; Burow, G.; Zobeck, T.M.; Allen, V.G. Soil Microbial Communities and Function in Alternative Systems to Continuous Cotton. Soil Sci. Soc. Am. J. 2010, 74, 1181–1192. [Google Scholar] [CrossRef] [Green Version]
  5. Li, L.J.; You, M.Y.; Shi, H.A.; Ding, X.L.; Qiao, Y.F.; Han, X.Z. Soil CO2 emissions from a cultivated Mollisol: Effects of organic amendments, soil temperature, and moisture. Eur. J. Soil Biol. 2013, 55, 83–90. [Google Scholar] [CrossRef]
  6. Dilustro, J.J.; Collins, B.; Duncan, L.; Crawford, C. Moisture and soil texture effects on soil CO2 efflux components in southeastern mixed pine forests. For. Ecol. Manag. 2005, 204, 87–97. [Google Scholar] [CrossRef]
  7. Schlesinger, W.H.; Andrews, J.A. Soil respiration and the global carbon cycle. Biogeochemistry 2000, 48, 7–20. [Google Scholar] [CrossRef]
  8. Yang, F.; Ali, M.; Zheng, X.Q.; He, Q.; Yang, X.H.; Huo, W.; Liang, F.C.; Wang, S.M. Diurnal dynamics of soil respiration and the influencing factors for three land-cover types in the hinterland of the Taklimakan Desert, China. J. Arid Land 2017, 9, 568–579. [Google Scholar] [CrossRef]
  9. Liu, Q.F.; Chen, Y.; Li, W.W.; Liu, Y.; Han, J.; Wen, X.X.; Liao, Y.C. Plastic-film mulching and urea types affect soil CO2 emissions and grain yield in spring maize on the Loess Plateau, China. Sci. Rep. 2016, 6, 1–10. [Google Scholar] [CrossRef] [Green Version]
  10. Tanveer, S.K.; Wen, X.X.; Lu, X.L.; Zhang, J.L.; Liao, Y.C. Tillage, Mulch and N Fertilizer Affect Emissions of CO2 under the Rain Fed Condition. PLoS ONE 2013, 8, e72140. [Google Scholar] [CrossRef] [Green Version]
  11. Sainju, U.M.; Lenssen, A.; Caesar-Tonthat, T.; Waddell, J. Tillage and crop rotation effects on dryland soil and residue carbon and nitrogen. Soil Sci. Soc. Am. J. 2006, 70, 668–678. [Google Scholar] [CrossRef]
  12. Sainju, U.M. A Global Meta-Analysis on the Impact of Management Practices on Net Global Warming Potential and Greenhouse Gas Intensity from Cropland Soils. PLoS ONE 2016, 11, e0148527. [Google Scholar] [CrossRef] [PubMed] [Green Version]
  13. Gan, Y.T.; Liang, C.; Hamel, C.; Cutforth, H.; Wang, H. Strategies for reducing the carbon footprint of field crops for semiarid areas. A review. Agron. Sustain. Dev. 2011, 31, 643–656. [Google Scholar] [CrossRef] [Green Version]
  14. Chen, X.P.; Cui, Z.L.; Fan, M.S.; Vitousek, P.; Zhao, M.; Ma, W.Q.; Wang, Z.L.; Zhang, W.J.; Yan, X.Y.; Yang, J.C.; et al. Producing more grain with lower environmental costs. Nature 2014, 514, 486–489. [Google Scholar] [CrossRef] [PubMed]
  15. Cui, Z.L.; Dou, Z.X.; Chen, X.P.; Ju, X.T.; Zhang, F.S. Managing Agricultural Nutrients for Food Security in China: Past, Present, and Future. Agron. J. 2014, 106, 191–198. [Google Scholar] [CrossRef]
  16. Zhao, J.Z.; Luo, Q.S.; Deng, H.B.; Yan, Y. Opportunities and challenges of sustainable agricultural development in China. Philos. Trans. R. Soc. B Biol. Sci. 2008, 363, 893–904. [Google Scholar] [CrossRef] [PubMed] [Green Version]
  17. Norse, D.; Ju, X.T. Environmental costs of China’s food security. Agric. Ecosyst. Environ. 2015, 209, 5–14. [Google Scholar] [CrossRef]
  18. Miao, Y.X.; Stewart, B.A.; Zhang, F.S. Long-term experiments for sustainable nutrient management in China. A review. Agron. Sustain. Dev. 2011, 31, 397–414. [Google Scholar] [CrossRef] [Green Version]
  19. Liu, X.J.; Zhang, F.S. Nitrogen fertilizer induced greenhouse gas emissions in China. Curr. Opin. Environ. Sustain. 2011, 3, 407–413. [Google Scholar]
  20. Cui, Z.L.; Chen, X.P.; Zhang, F.S. Current Nitrogen Management Status and Measures to Improve the Intensive Wheat–Maize System in China. Ambio 2010, 39, 376–384. [Google Scholar] [CrossRef] [Green Version]
  21. Liu, J.; Liu, H.; Huang, S.M.; Yang, X.Y.; Wang, B.R.; Li, X.Y.; Ma, Y.B. Nitrogen efficiency in long-term wheat–maize cropping systems under diverse field sites in China. Field Crop. Res. 2010, 118, 145–151. [Google Scholar] [CrossRef]
  22. Ma, W.; Li, J.H.; Ma, L.; Wang, F.H.; Sisák, I.; Cushman, G.; Zhang, F.S. Nitrogen flow and use efficiency in production and utilization of wheat, rice, and maize in China. Agric. Syst. 2008, 99, 53–63. [Google Scholar] [CrossRef]
  23. Zhang, X.; Davidson, E.A.; Mauzerall, D.L.; Searchinger, T.D.; Dumas, P.; Shen, Y. Managing nitrogen for sustainable development. Nature 2015, 528, 51–59. [Google Scholar] [CrossRef] [PubMed] [Green Version]
  24. Whitmore, A.P.; Goulding, K.W.T.; Glendining, M.J.; Dailey, A.G.; Coleman, K.; Powlson, D.S. Nutrient Management in Support of Environmental and Agricultural Sustainability. Sustainability 2012, 4, 2513–2524. [Google Scholar] [CrossRef] [Green Version]
  25. Brankatschk, G.; Finkbeiner, M. Crop rotations and crop residues are relevant parameters for agricultural carbon footprints. Agron. Sustain. Dev. 2017, 37, 58. [Google Scholar] [CrossRef] [Green Version]
  26. Bhandari, K.B.; Longing, S.D.; West, C.P. Soil Microbial Communities in Corn Fields Treated with Atoxigenic Aspergillus flavus. Soil Syst. 2020, 4, 35. [Google Scholar] [CrossRef]
  27. Plaza-Bonilla, D.; Arrúe, J.L.; Cantero-Martínez, C.; Fanlo, R.; Iglesias, A.; Álvaro-Fuentes, J. Carbon management in dryland agricultural systems. A review. Agron. Sustain. Dev. 2015, 35, 1319–1334. [Google Scholar] [CrossRef] [Green Version]
  28. Kong, D.J.; Liu, N.N.; Wang, W.Y.; Akhtar, K.; Li, N.; Ren, G.X.; Feng, Y.Z.; Yang, G.H. Soil respiration from fields under three crop rotation treatments and three straw retention treatments. PLoS ONE 2019, 14, e0219253. [Google Scholar] [CrossRef]
  29. Mariko, S.; Nishimura, N.; Mo, W.H.; Matsui, Y.; Kibe, T.; Koizumi, H. Winter CO2 flux from soil and snow surfaces in a cool-temperate deciduous forest, Japan. Ecol. Res. 2000, 15, 363–372. [Google Scholar] [CrossRef]
  30. Wang, W.Y.; Akhtar, K.; Ren, G.X.; Yang, G.H.; Feng, Y.Z.; Yuan, L.Y. Impact of straw management on seasonal soil carbon dioxide emissions, soil water content, and temperature in a semi-arid region of China. Sci. Total Environ. 2019, 652, 471–482. [Google Scholar] [CrossRef]
  31. Cambardella, C.A.; Moorman, T.B.; Novak, J.M.; Parkin, T.B.; Karlen, D.L.; Turco, R.F.; Konopka, A.E. Field-Scale Variability of Soil Properties in Central Iowa Soils. Soil Sci. Soc. Am. J. 1994, 58, 1501–1511. [Google Scholar] [CrossRef]
  32. Watanabe, F.S.; Olsen, S.R. Test of an Ascorbic Acid Method for Determining Phosphorus in Water and NaHCO3 Extracts from Soil. Soil Sci. Soc. Am. Proc. 1965, 29, 677–678. [Google Scholar] [CrossRef]
  33. Ren, C.J.; Sun, P.S.; Kang, D.; Zhao, F.Z.; Feng, Y.Z.; Ren, G.X.; Han, X.H.; Yang, G.H. Responsiveness of soil nitrogen fractions and bacterial communities to afforestation in the Loess Hilly Region (LHR) of China. Sci. Rep. 2016, 6, 1–11. [Google Scholar] [CrossRef] [Green Version]
  34. Liu, C.; Cutforth, H.; Chai, Q.; Gan, Y.T. Farming tactics to reduce the carbon footprint of crop cultivation in semiarid areas. A review. Agron. Sustain. Dev. 2016, 36, 69. [Google Scholar] [CrossRef] [Green Version]
  35. Liu, C.Y.; Wang, K.; Meng, S.X.; Zheng, X.H.; Zhou, Z.X.; Han, S.H.; Chen, D.L.; Yang, Z.P. Effects of irrigation, fertilization and crop straw management on nitrous oxide and nitric oxide emissions from a wheat-maize rotation field in northern China. Agric. Ecosyst. Environ. 2011, 140, 226–233. [Google Scholar] [CrossRef]
  36. Zhao, F.Z.; Sun, J.; Ren, C.J.; Kang, D.; Deng, J.; Han, X.H.; Yang, G.H.; Feng, Y.Z.; Ren, G.X. Land use change influences soil C, N, and P stoichiometry under ’Grain-to-Green Program’ in China. Sci. Rep. 2015, 5, 10195. [Google Scholar]
  37. Halvorson, A.D.; Schlegel, A.J. Crop Rotation Effect on Soil Carbon and Nitrogen Stocks under Limited Irrigation. Agron. J. 2012, 104, 1265. [Google Scholar] [CrossRef]
  38. Sainju, U.M.; Caesar-TonThat, T.; Lenssen, A.W.; Barsotti, J.L. Dryland Soil Greenhouse Gas Emissions Affected by Cropping Sequence and Nitrogen Fertilization. Soil Sci. Soc. Am. J. 2012, 76, 1741–1757. [Google Scholar] [CrossRef] [Green Version]
  39. Zhao, F.Z.; Wang, J.Y.; Zhang, L.; Ren, C.J.; Han, X.H.; Yang, G.H.; Doughty, R.; Deng, J. Understory Plants Regulate Soil Respiration through Changes in Soil Enzyme Activity and Microbial C, N, and P Stoichiometry Following Afforestation. Forests 2018, 9, 436. [Google Scholar] [CrossRef] [Green Version]
  40. Duiker, S.W.; Lal, R. Carbon budget study using CO2 flux measurements from a no till system in central Ohio. Soil Tillage Res. 2000, 54, 21–30. [Google Scholar] [CrossRef]
  41. Jansson, J.K.; Hofmockel, K.S. Soil microbiomes and climate change. Nat. Rev. Microbiol. 2019, 18, 1–12. [Google Scholar] [CrossRef]
  42. Krishna, B.; Charles, P. West, and Veronica Acosta-Martinez, Assessing the role of interseeding alfalfa into grass on improving pasture soil health in semi-arid Texas High Plains. Appl. Soil Ecol. 2019, 147, 103399. [Google Scholar] [CrossRef]
  43. Bhandari, K.B.; West, C.P.; Acosta-Martinez, V.; Cotton, J.; Cano, A. Soil health indicators as affected by diverse forage species and mixtures in semi-arid pastures. Appl. Soil Ecol. 2018, 132, 179–186. [Google Scholar] [CrossRef]
  44. Zhao, F.Z.; Yang, G.H.; Han, X.H.; Feng, Y.Z.; Ren, G.X. Stratification of Carbon Fractions and Carbon Management Index in Deep Soil Affected by the Grain-to-Green Program in China. PLoS ONE 2014, 9, e99657. [Google Scholar] [CrossRef] [Green Version]
  45. Wang, Y.Y.; Hu, C.S.; Ming, H.; Oenema, O.; Schaefer, D.A.; Dong, W.X.; Zhang, Y.M.; Li, X.X. Methane, Carbon Dioxide and Nitrous Oxide Fluxes in Soil Profile under a Winter Wheat-Summer Maize Rotation in the North China Plain. PLoS ONE 2014, 9, e98445. [Google Scholar] [CrossRef]
  46. Zhao, R.F.; Chen, X.P.; Zhang, F.S.; Zhang, H.L.; Schroder, J.; Römheld, V. Fertilization and Nitrogen Balance in a Wheat–Maize Rotation System in North China. Agron. J. 2006, 98, 938. [Google Scholar] [CrossRef]
  47. Gong, W.; Yan, X.Y.; Wang, J.Y. The effect of chemical fertilizer on soil organic carbon renewal and CO2 emission-a pot experiment with maize. Plant Soil 2012, 353, 85–94. [Google Scholar] [CrossRef]
  48. Ding, W.X.; Yu, H.Y.; Cai, Z.C.; Han, F.X.; Xu, Z.H. Responses of soil respiration to N fertilization in a loamy soil under maize cultivation. Geoderma 2010, 155, 381–389. [Google Scholar] [CrossRef]
  49. Zang, H.D.; Blagodatskaya, E.; Wang, J.Y.; Xu, X.L.; Kuzyakov, Y. Nitrogen fertilization increases rhizodeposit incorporation into microbial biomass and reduces soil organic matter losses. Biol. Fertil. Soils 2017, 53, 419–429. [Google Scholar] [CrossRef]
  50. Zhang, P.; Wei, T.; Wang, H.X.; Wang, M.; Meng, X.P.; Mou, S.W.; Zhang, R.; Jia, Z.K.; Han, Q.F. Effects of straw mulch on soil water and winter wheat production in dryland farming. Sci. Rep. 2015, 5, 10725. [Google Scholar]
  51. Ghimire, R.; Adhikari, K.R.; Chen, Z.S.; Shah, S.C.; Dahal, K.R. Soil organic carbon sequestration as affected by tillage, crop residue, and nitrogen application in rice-wheat rotation system. Paddy Water Environ. 2012, 10, 95–102. [Google Scholar] [CrossRef]
Figure 1. Mean monthly air temperature and rainfall from January 2011 to June 2013 during the growing seasons at the experimental site.
Sustainability 12 05271 g001
Figure 2. Experiment design. It is a split-plot design, with rotation modes in the main plot and fertilizer treatment in the subplot.
Sustainability 12 05271 g002
Figure 3. Mean temperature and water content of soil under different N treatments and crop rotation during different crop growth periods. (a) Mean soil temperature under different fertilizer treatments (traditional practice rate or TF, optimized fertilization or 0.8TF, no fertilizer or NF), (b) mean soil temperature under different crop rotations (wheat-fallow or WF, wheat-soybean or WS, wheat-maize WM), (c) mean soil water content under different fertilizer treatments (TF, 0.8TF, NF), and (d) mean soil water content under different crop rotations (WF, WS, WM). Bars show mean ± standard error. Different lower case letters indicate significant differences at p < 0.05.
Sustainability 12 05271 g003
Figure 4. Soil organic carbon content at different depths under different treatments. Bars show mean ± standard error. Different lower case letters indicate significant differences at p < 0.05.
Sustainability 12 05271 g004
Figure 5. Mean soil CO2 emission rate during different crop growth periods under different rotation and nitrogen fertilizer treatments.
Sustainability 12 05271 g005
Figure 6. Soil alkali-hydro N, available phosphorus, and available potassium concentrations in the 0–40 cm soil layer under different treatments.
Sustainability 12 05271 g006
Figure 7. Redundancy analysis (RDA) was used to explore the relationships between soil CO2 emission (SR) (blue arrows) and SOC (blue arrows), soil temperature and soil water content(red arrows) under different rotation and N fertilizer treatments. The number indicates different soil depths. WF: summer fallow and winter wheat rotation mode, WS: summer soybean and winter wheat rotation mode, WM: summer maize and winter wheat rotation mode.
Sustainability 12 05271 g007

