4.1. Survey Research Results
The survey involved 150 companies from the Polish machine production sector, located and operating throughout the country. Respondents were chosen randomly from the database of Polish manufacturers registered under the category of “manufacture of machinery and equipment”. Under this category, over 9000 companies are registered, so the sample is representative of the machinery manufacture sector. The largest number of surveyed enterprises (38%) declared the manufacturing of general-purpose machinery. According to the Polish classification of business activity, this group includes manufacturers of engines and turbines (excluding aircraft, car and motorcycle engines); equipment and accessories for a hydraulic and pneumatic drive; other pumps and compressors; bearings, gearing and driving elements; furnaces and furnace burners; lifting equipment; office machinery and equipment (excluding computers); mechanical hand tools; and industrial refrigeration and ventilation equipment. Enterprises registered as manufacturers of other special-purpose machinery constituted 35% of the surveyed group. This group included the manufacturers of machinery for metallurgy, mining, and construction; machines used in food, tobacco and beverage production; machines for the textile, clothing and leather industry; and machinery for the paper, rubber and plastic industry. Companies with their activity classified as the production of agricultural and forestry machinery represented 13% of the research sample, whereas manufacturers of mechanical machines and tools represented 11%. Finally, about 3% of surveyed enterprises chose the answer “other”, declaring, for example, activities in the field of energy or mining machinery production. The analysis of the research sample, in terms of the geographical scope of economic activity, showed that for 86% of respondents, the dominant market was the domestic market. At the same time, over 50% of enterprises indicated having some activity in the European market, and only 3% operated within a commune or city. According to the results of the study, over 80% of the machine and device manufacturers offered their clients services related to manufacturing activity. About 5% of the surveyed enterprises provided services unrelated to the production activity, indicating, for example, services related to industrial automation, electrics, or zinc coating of steel structures. Enterprises that did not provide any services accounted for 13% of the research sample. Over 95% of surveyed companies sold the manufactured machines and devices as well as services on the B2B (business-to-business) market. Approximately 33% of respondents also addressed individual clients, while 21% of producers indicated public benefit entities among their clients.
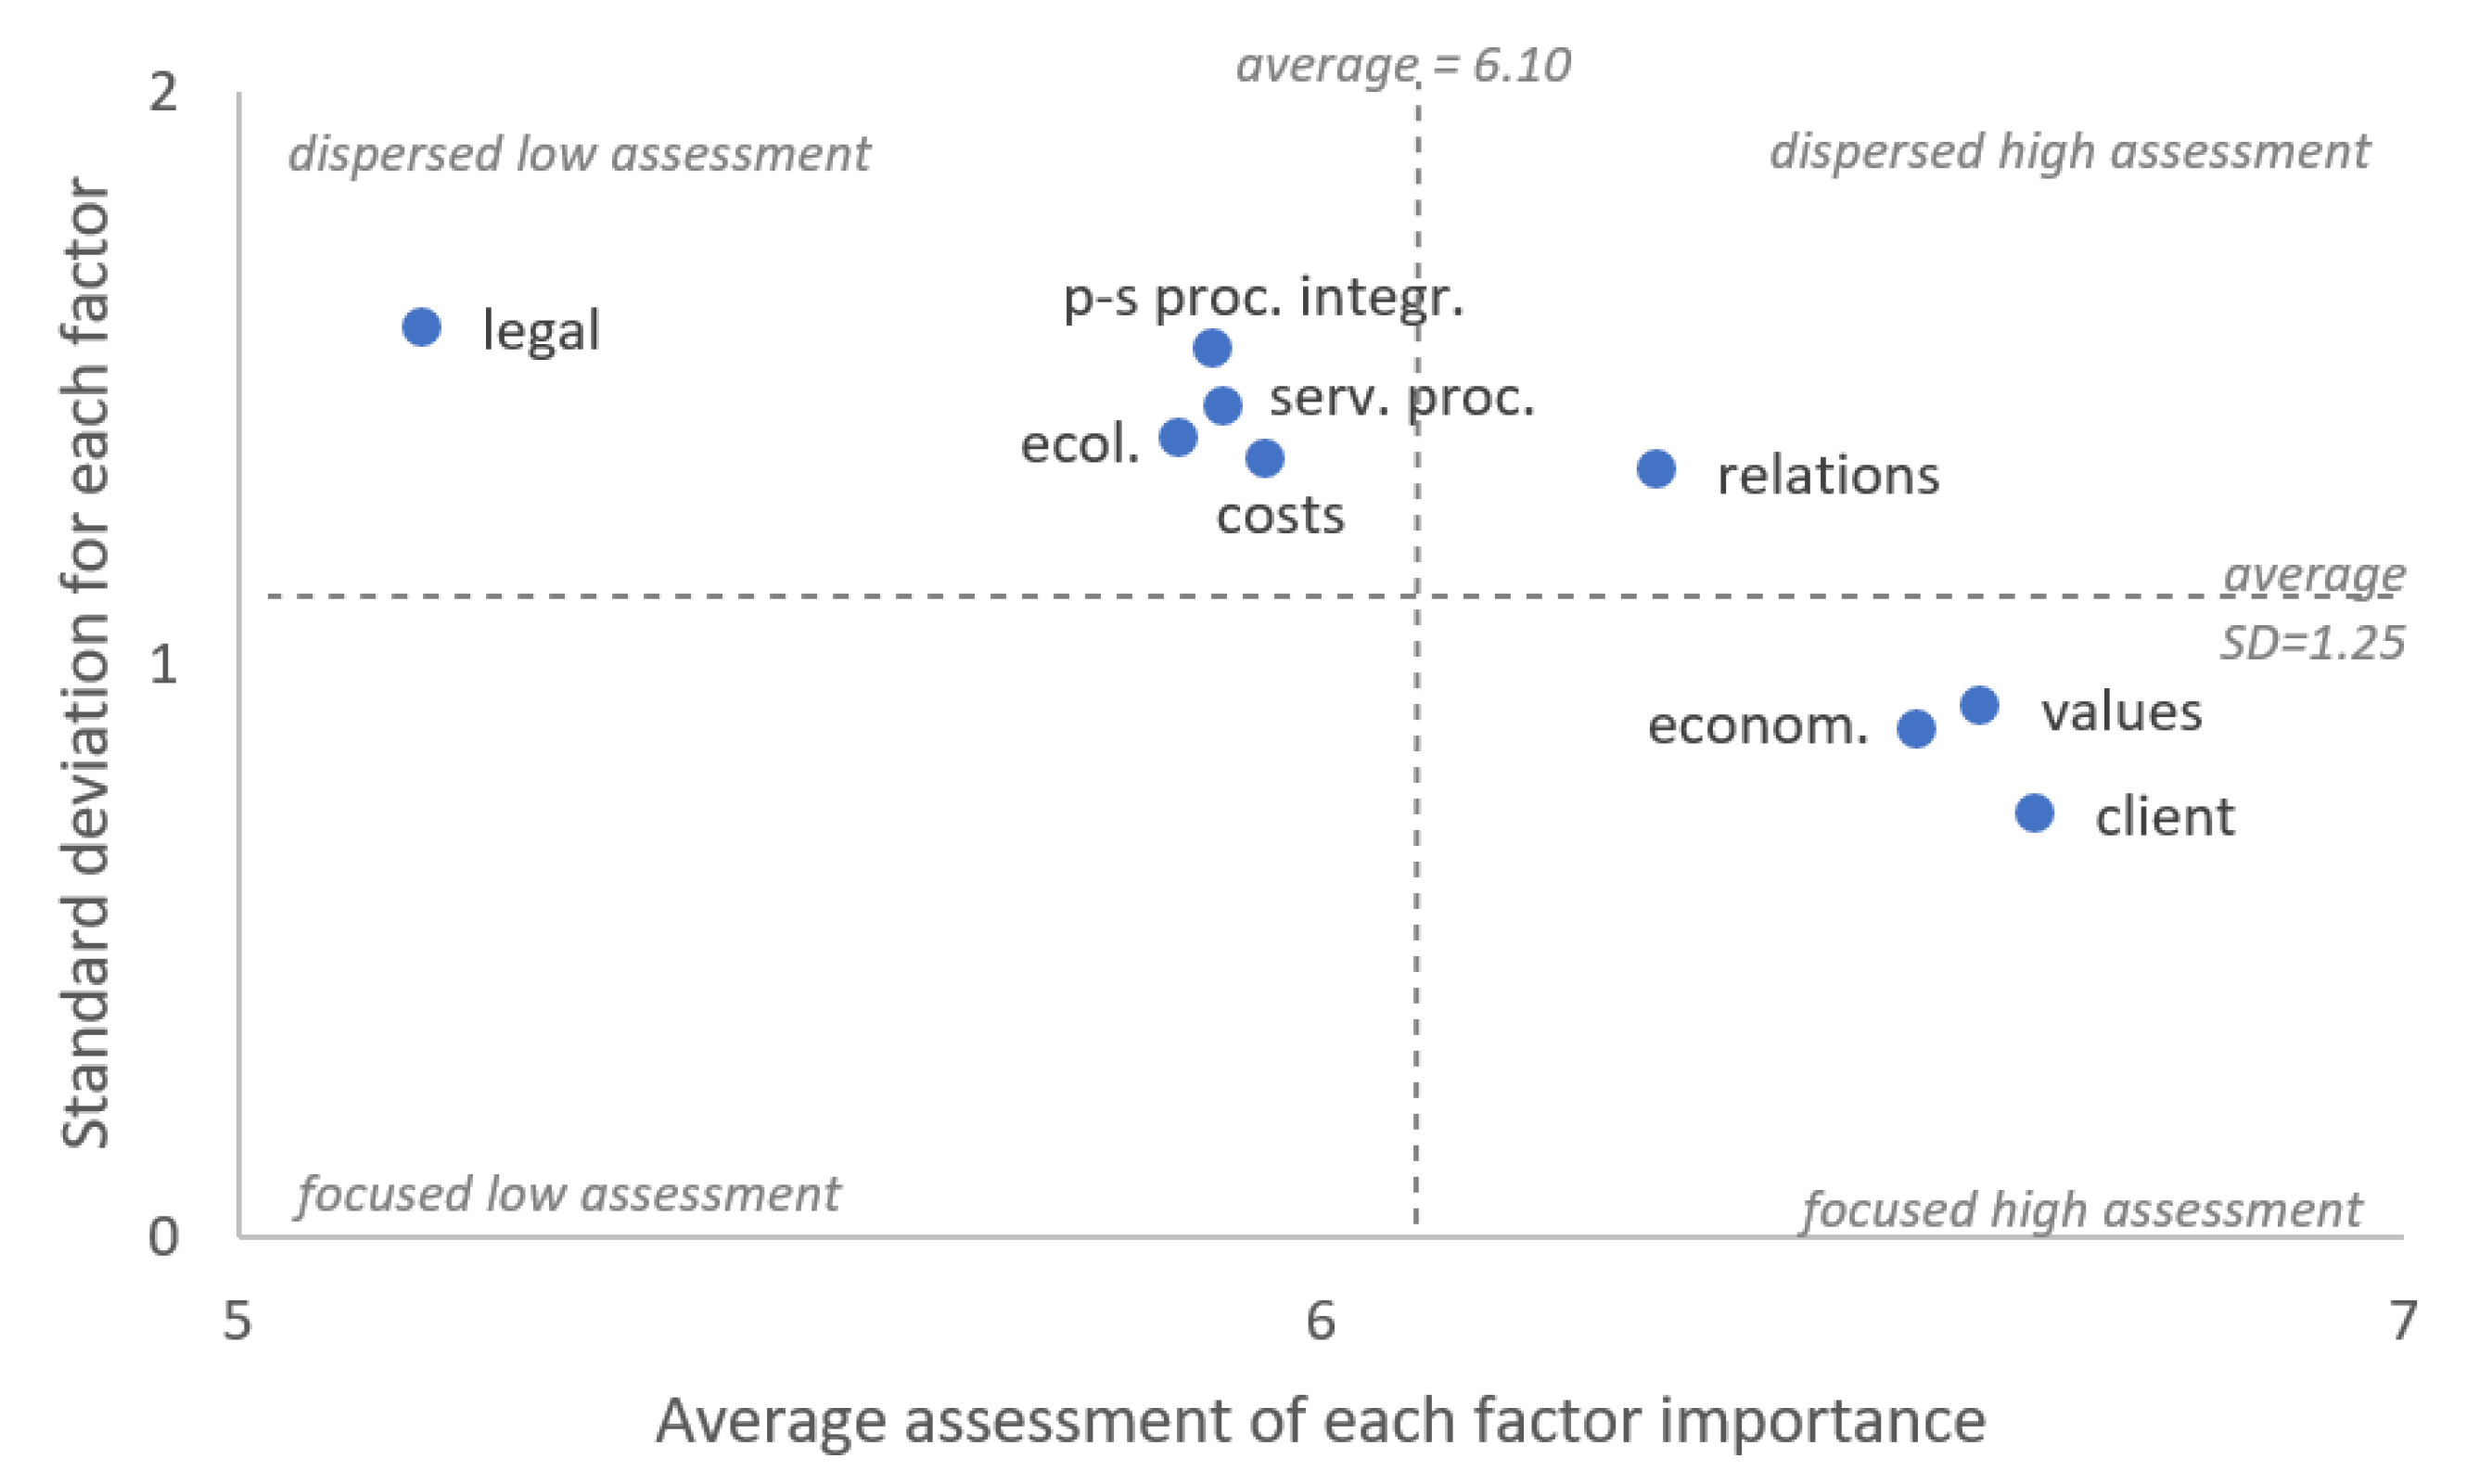
All respondents were asked about the importance of the factors that influence the servitization process to learn the opinions of manufacturers with various approaches to service provision. The study exposed that Polish machinery manufacturers considered all factors as extremely important for the product and service integration. A mean value calculated for all factors equaled 6.10 (
Table 1) on a seven-point scale. However, as the most important factors respondents indicated customer requirements and preferences (the average importance ratings of 6.66); added value for customers and the company (the importance on the level of 6.61 on average); economic and financial analysis (ratings of 6.55 on average); and also relations, stakeholders and partners in service processes (with the average importance ratings equal to 6.31). The coefficient of variation shows that for some factors, the opinions of respondents varied insignificantly (11–14% on average). For other factors, the opinions were a bit more dispersed (from 20 to 31%).
The lowest level of importance was given to technical and organizational aspects of the integration of production and service processes, ecological aspects of production and service activities, and legal conditions for the provision of services (
Figure 2).
Table 2 shows the percentage distribution of responses concerning the nine factors that determine the product–service integration process. The results indicate that the highest level of importance (note 7) was not only given to Factors 1 and 2, which were considered extremely significant by the majority of respondents (over 70% of answers), but also to the technical organization of service processes (Factor 6), which was regarded by the 65% of manufacturers as very important. However, Factor 6 assessments were more diverse (the coefficient of variation amounted to 25%), so the remaining 35% of the research sample had a somewhat varied opinion on its significance.
The distribution of ratings for some factors was right-sided (the advantage of high scores), and for others, the assessments were more evenly distributed, showing differences in the views of the producers on these matters. Therefore, a mean and standard deviation of each factor was mapped in the two-dimensional plot, which helped to discover variables (factors) that were evaluated on a similar level (namely, the opinions of respondents were homogenous) and that differed more significantly (namely, the opinions were heterogeneous).
Based on the data presented in
Figure 3, respondents gave the highest and most consistent score to the importance of the following factors: customer requirements and preferences (a point named client), added value for the customer and the company (a point named values) and economic and financial analysis (a point named economic aspects). High and convergent notes indicate similar opinions among respondents regarding the importance of the three factors named values, client, and economic aspects. They referred to the first three factors from the list, which also had the highest ratings. Therefore, it can be stated that these were undoubtedly the most crucial determinants of the product–service integration process in the opinion of researched companies.
The importance of relations, stakeholders and partners in service processes also received high assessment (with the average score equal to 6.31), but the options were rather dispersed, showing that for some manufacturers, this aspect seemed to be unimportant, or less important than others. The lowest and the most dispersed ratings were given to the following factors: costs of delivery and provision of services, technical organization of service processes, technical and organizational aspects of the integration of product and service processes, ecological aspects of production and service activities, and legal aspects of the provision of services. It was interesting to learn which companies assessed these factors as less important, and, even more so, why? The analysis of their main characteristics could bring some valuable conclusions about the reasons behind these decisions (lower assessments). Therefore, in the next step, a cluster analysis was conducted to group companies based on similarities in opinions about the factors.
Cluster analysis is a tool for exploratory data analysis which aims to arrange objects into groups in such a way that the degree of object linking in the same group is as large as possible, and with objects from other groups as small as possible [
45]. For a more detailed description of this statistical method, refer to references [
46,
47]. It is often used for the classification of studied objects into groups to distinguish the basic characteristics of each cluster element [
48,
49,
50]. Using Ward’s method and the analysis of the agglomeration process, three clusters of manufacturers were distinguished (
Figure 4).
Then, with the k-means procedure, three clusters were singled out. Cluster 1 had 62 elements, i.e., about 41% of the sample. Cluster 2 consisted of 33 companies, which amounted to 22% of the surveyed group. Cluster 3 included 55 researched manufacturers, which comprised 37% of the sample. Each cluster was characterized by different levels of the factor assessment (
Figure 5). Major differences were found between the average assessment of the importance of each factor in Cluster 2 (red line) and Cluster 3 (green line). Manufacturers in Cluster 2 gave much lower ratings to most of the factors. While the companies in Cluster 3 gave high scores to all studied factors (
Table 3). The most significant differences were observed in the means of importance assessment of Factor 5, the costs of delivery and provision of services (the difference equal to 3.01); Factor 7, technical and organizational aspects of the integration of production and service processes (the difference equal to 2.97); and Factor 4, relations, stakeholders and partners in service processes (the difference of 2.86). Considering the scope of the scale (seven-point), these differences are somewhat significant. Technical and organizational aspects of the integration of production and service processes (Factor 7) also had the lowest assessment in Cluster 1.
Consequently, every cluster was analyzed in detail in terms of other information and characteristics that were obtained during the survey. In the context of servitization, an aspect that could influence the assessments of the researched factors was the experience of a company in service provision. This aspect was included in the survey in the form of several questions. Manufacturers were asked about service offerings, namely, the kind of services that they offered and the frequency of each service delivered to their clients. Respondents were also asked about the share of income derived from services in the total income of their company. Clusters were compared based on this information.
The distribution of the companies between clusters in terms of a share of income derived from services in the total revenues of the company is presented in
Table 4. Most (74%) surveyed manufacturers who did not derive any income from service provision were grouped in Cluster 2. A vast majority (around 60–70%) of those manufacturers who reported the highest levels of share (31% and more) of service income in the company revenue were grouped in Cluster 3. Likewise, considering the structure of each cluster in terms of the same aspect (
Table 5), it occurred that Clusters 1 and 2 mostly (approximately 80%) consisted of companies that derived less than 20% of the total income from service provision. About 50% of companies that were grouped in Cluster 3 obtained 20% and more of their revenues from service provision.
Nonetheless, it is difficult to notice a clear and obvious relationship between the level of the share of service income and belonging to each cluster only by analysis of the above tables. Therefore, additional statistical analyses were carried out. Since the variables (
belonging to the cluster and
service income) are categorical, a chi-squared test and a correspondence analysis were conducted. The chi-squared independence test confirmed the existence of a statistically significant relationship between two analyzed variables, namely, belonging to a cluster and the revenue from service provision (
p-value lower than alpha level = 0.05). Cramér’s V statistics show that this relationship has moderate strength (
Table 6).
The co-occurrence of the categories of each variable was analyzed using the correspondence analysis. This is an exploratory technique for analyzing contingency tables which is used to detect relationships and present the structure of qualitative variables. The purpose of the analysis is to reconstruct the distance between points (representing rows and/or columns) in a space with fewer dimensions. This way, it enables to create a simplified mapping of information contained in a large contingency table [
51] or analogous tables containing measures of the relationship between variable categories. A detailed description of the method can be found in reference [
52]. The analysis results were visualized in a two-dimensional plot (
Figure 6). Projecting points on one-, two- or three-dimensional space allows, among other things, to check:
Distances between points illustrating categories of variables from the projection center, with the points furthest from the projection center bringing the most information about the independence of features;
The occurrence of categories of the same feature in a short distance or overlap, which means that the numbers of such categories can be combined into one new category of a given feature;
The location of points describing categories belonging to different characteristics, with particularly strongly related categories being situated closer together, and negatively—further away from each other [
53,
54].
While analyzing the perception map for service income and belonging to the cluster, the position of points representing each category in relation to point 0 indicates the similarity of categories; or, in other words, a frequency of co-occurrence of the categories in the input contingency table. Thus, it can be stated that for companies grouped in Cluster 3, one respondent mentioned categories “21–30%”, “41–50%”, “over 50%” and “31–40%” relatively more frequently as a share of service income in the total company revenue than the rest of the categories of the variable describing income from services. Similarly, if a company belonged to Cluster 1, it also more frequently reported a lower share of income derived from services in the total company income (from 0 to 20%). Finally, companies that were grouped in Cluster 2 most frequently (in relation to Cluster 1 and Cluster 3) indicated obtaining no income from services. In conclusion, Cluster 3 had companies that were more advanced service providers because they usually derived more income from service provision than manufacturers who were grouped in Clusters 1 and 2.
Subsequently, the service offering of companies included in each cluster was studied. The surveying involved a question about 16 types of services (recognized as most popular in machinery sector according to [
24]) and a frequency of provision of each kind of services on a seven-point scale, where 7 meant delivering the service very often (daily), and 1 meant that the service was not provided by the company at all. For the frequency of service provision, arithmetic means were calculated in each cluster (
Table 7).
Based on the highest values of means by taking a threshold at 4.0, it is possible to describe service offerings that were the most popular in each cluster. The only services that Cluster 2 companies offered to their clients frequently were warranty and post-warranty services, which were strongly product oriented. So, these manufacturers are focused primarily on the production of goods. Manufacturers who belonged to Cluster 1 proposed more extensive service offerings which included before-sale consultancy, assembly and/or implementation, warranty and post-warranty service, maintenance and technical support, modernization/renovation/regeneration, and industrial services (machining, milling, cutting, bending and other production services). Still, most of these services were product oriented. Manufacturers in Cluster 3 often extended this offering with transport services, training and technical consultancy. Hence, Cluster 3 manufacturers were more willing to offer a wider catalog of customer-oriented services. Also, every mean of service delivering frequency was higher than the same mean of Cluster 1. Therefore, they not only offered extensive packages of services, but also provided them more frequently.
An additional comparison of manufacturer offerings in terms of different kinds of services revealed that over 60% of companies in Cluster 3 had a broad catalog of services in their offers (
Table 8), whereas Cluster 2 consisted of 76% of manufacturers who provided less than ten types of services to their clients. Furthermore, Cluster 1 was dominated by manufacturers who offered fewer than ten service types.
The last comparison of cluster elements concerned the company size and was performed to complete the profile of the manufacturers from each group. The results are presented in
Table 9. Cluster 1 was dominated (42%) by small enterprises. Cluster 2 consisted of 67% medium enterprises. Cluster 3 had twice as many large companies (22%) compared to Cluster 2 (9%).
Thus, it may be concluded that Cluster 1 consisted of companies with somewhat vast service offers, but mostly product-oriented, which derived no more than 20% of their income from service provision and were mostly small or medium-sized enterprises. Cluster 2 included most manufacturers that did not provide any services to their clients and, consequently, gained no income from service provision. These companies were usually medium-sized. Finally, Cluster 3 was comprised of enterprises that achieved the highest financial benefits from services, offered the most extensive catalog of services to their clients, and were large or medium-sized. Major differences were found between the assessment of the importance of the studied factor on the servitization process by companies grouped in Clusters 2 and 3. The first group gave significantly lower assessments to some factors than the second. In light of the conducted analyses, an obvious link was found between the service provision experience of manufacturers and how they assessed the importance of studied factors. It would not be considered a mistake to assume that the level of servitization of Cluster 3 enterprises was higher, and they may have had more comprehensive knowledge about the factors determining this process.
To make profiles of each cluster more complete, the relationship between variables
belonging to the cluster and a
profile of production was examined. A variable
profile of production was described based on the declaration of the respondent about the main manufacturing activity, i.e., the manufacturing of general-purpose machinery, special-purpose machinery, agriculture and forestry machinery, mechanical equipment and machines, and other machines (unclassified anywhere else). The analyzed variables were categorical (qualitative), so a chi-squared test and a correspondence analysis were appropriate. However, the chi-squared independence test did not confirm any statistically significant relationship between two analyzed variables, namely,
belonging to the cluster and
profile of production (
p-value was equal to 0.223). Therefore, there were no premises for the correspondence analysis. Thus, only a two-way table was built to reveal the structure of the cluster in terms of the production profile of its elements (
Table 10).
Cluster 1 had the most manufacturers of general-purpose machines, whilst Cluster 3 hosted the largest number of manufacturers producing agriculture and forestry machinery and, also, other machines. But in general, the structures of all clusters were rather similar.
4.2. Findings from In-Depth Interviews
In-depth interviews were conducted to gain more information about factors considered crucial in the extension of service activity by machinery manufacturers and those that could significantly influence both a decision-making process and product-service integration in these companies.
One of the most important aspects pointed out by both business and scientific experts, were legal and political conditions in the field of service provision, standards and ordinances regulating the functioning of industry and the service sector, as well as the policy of the state, the European Union and other countries that could support or block servicing activities undertaken by entrepreneurs.
“Certainly, these external factors are political—I think this is an important factor. For example, the policies of the European Union and various types of regulations that affect individual sectors of the economy” (Expert No. 1).
“Legal factors, because for example, a person who is to deal with electrics and automation should have electrical qualifications” (Expert No. 10).
“Certainly, those political factors and any legal conditions that force various modernizations or actions” (Expert No. 9).
“Legal—because the manufacturer and the customer, having a given machine, are obliged to keep this machine, its operational condition, that it does not cause threats” (Expert No. 6).
Political factors also appeared in the opinions of experts as an internal aspect, i.e., in the context of the organization’s policy and the adopted strategy for operation and strategic goals. Additionally, economics was a relatively important element affecting servitization, with the financial condition of the economy as well as the financial situation of enterprises and their clients being important. Social factors were also relatively important, among which much attention was paid to the availability of employees, their qualifications or licenses, and the level of knowledge they possessed:
“It is easier to buy technology at the moment than to get good employees” (Expert No.8).
“Employees who come to us have completed relevant schools and faculties, but for example, they do not have appropriate training and qualifications” (Expert No. 10).
“This knowledge-based society drives this service sector, ... in services, the human factor is more important than material factors, so knowledge is more important than work” (Expert No. 1).
Also, in the context of external social and economic factors, requirements and behavior of buyers were mentioned as well as the level of wealth of the society, and certain trends or fashion:
“First, we need to know what customers’ needs are in terms of services, whether customers actually want these complementary services or not. ... It is often said that today’s consumers in Europe are postmodern consumers, and this postmodernism manifests in various consumer behaviors. These clients are trying completely new services, new experiences. ... I think that this trend may affect the fact that completely new services will be accepted by the market” (Expert No. 1).
“The customer is most important to us. And if there are no strictly technological or technical barriers to perform a given service, we are most open” (Expert No. 5).
“There is a fashion for ecology and ecological activities. So, apart from the fact that something is going on legally and there are legal conditions that, for example, it is forbidden to dispose of waste, the awareness itself in society is definitely incomparable today with what was about 10–20 years ago. It certainly matters. And it also positively affects our activities” (Expert No. 9).
Among internal conditions, special attention was also paid to the human factor, customer orientation and technical aspects, such as, for example, the technologies of manufactured products and the products themselves, as well as innovation, both in terms of technology and the innovativeness of enterprises in general:
“The type of our manufacturing activity just forces service activities. One can imagine, for example, that we would not provide the service on our own, but I do not think that it will succeed in the long term” (Expert No. 4).
“Technological factors unquestionably have a significant impact on the development of the servitization process, i.e., what the organization of production in a particular enterprise looks like, how automated it is, and to what extent it uses modern solutions. And this in effect will also require the entrepreneur to be involved in the services sector” (Expert No. 3);
“I think the level of innovation itself can be an important factor that will stimulate this process of servitization. Companies with a higher level of innovation will be able to offer higher quality services. If they have such combined, industrial, and service activities, they will be able to benefit from those innovations that they previously used in this industrial activity” (Expert No. 1).
One of the experts from the scientific community emphasized that internal factors were more important in the process of developing services in an enterprise and the organization should begin analyzes aimed at diagnosing the resources and capabilities of the enterprise for the needs of product and service integration:
“It seems that understanding the essence of the phenomenon of servitization or solutions primarily begins inside the company” (Expert No. 2).
In the opinion of some experts, many of these conditions intertwine, which is manifested in mutual dependencies and cause-and-effect relationships; therefore, it is sometimes difficult to analyze them separately or classify factors into a specific group. Asked about the hierarchy of factors by importance, experts mostly indicated long-lasting and stronger relationships, a strategy of the organization, legal regulations regarding the provision of long-term services, the economic benefits of service recipients, and the technical aspects connected with the manufacturing technology consumption of energy and materials throughout the product life-cycle.


