Article

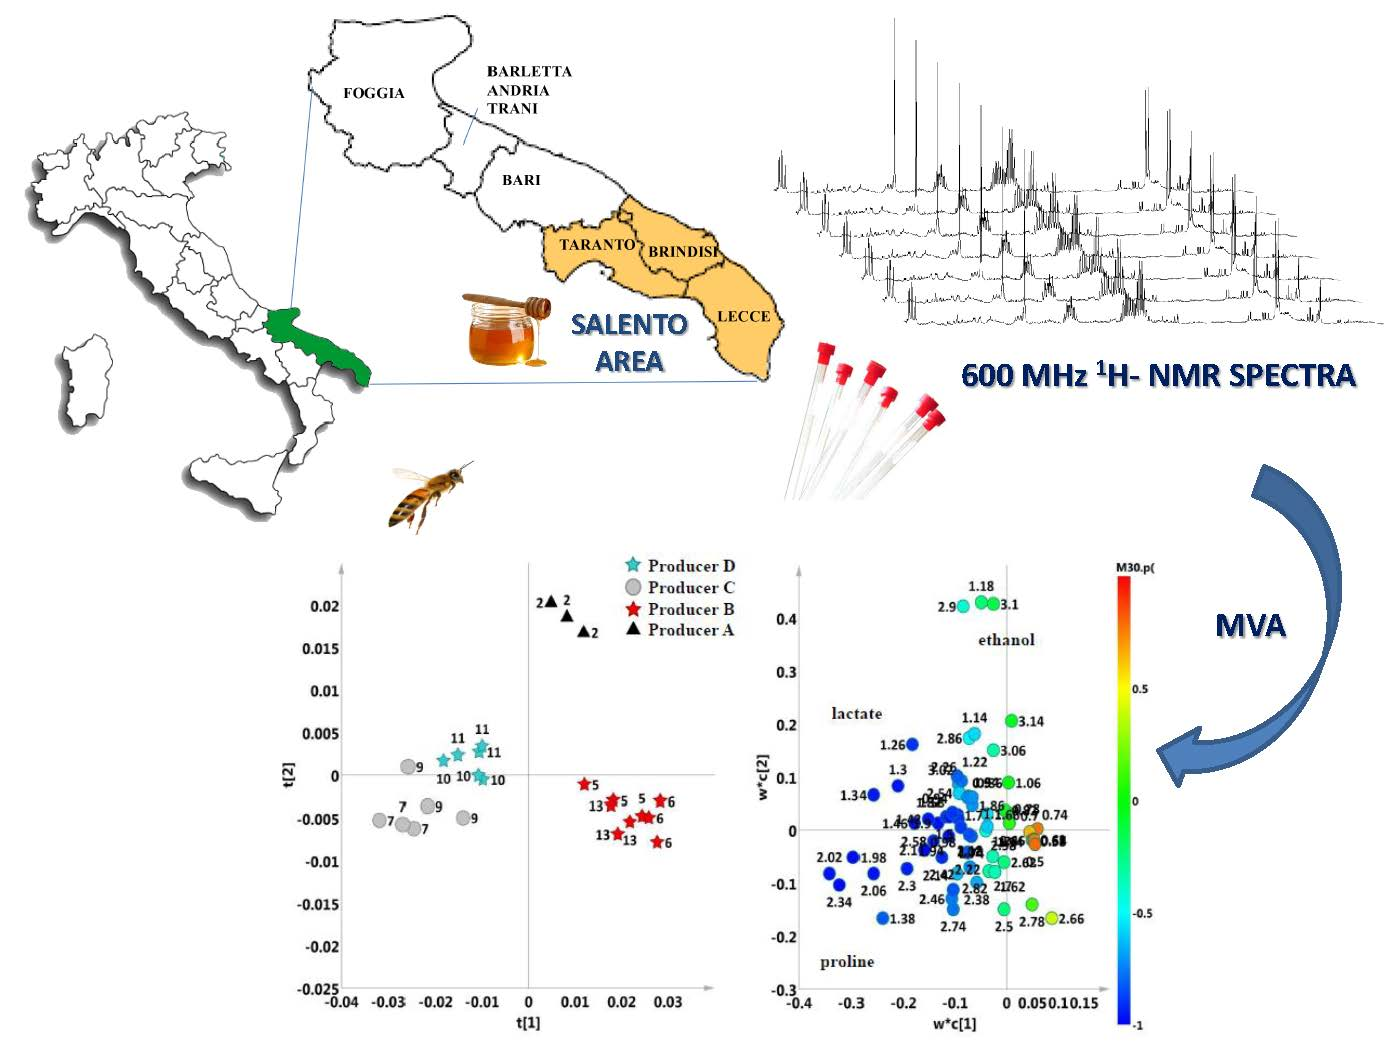
Salento Honey (Apulia, South-East Italy): A Preliminary Characterization by 1H-NMR Metabolomic Fingerprinting

by
Chiara Roberta Girelli
,
Roberta Schiavone
,
Sebastiano Vilella
and
Francesco Paolo Fanizzi
*
Department of Biological and Environmental Sciences and Technologies, University of Salento, Lecce-Monteroni, 73100 Lecce, Italy
*
Author to whom correspondence should be addressed.
Sustainability 2020, 12(12), 5009; https://doi.org/10.3390/su12125009
Submission received: 17 April 2020 / Revised: 15 June 2020 / Accepted: 16 June 2020 / Published: 18 June 2020
(This article belongs to the Special Issue Biodiversity 2020: Agriculture, Environment and Wellbeing)

Abstract

:
Honey is a natural sweet substance produced by honeybees from the nectar of flowers, plant secretions or plant-sucking insect excretions. Sugars and water constitute the major components, other minor components characterize the organoleptic and nutritional properties. To date, Salento (Apulia region, Italy) honey production is considerably threatened due to the suggested use of neonicotinoids in order to control the insect-vectored bacterium Xylella fastidiosa (subsp. pauca). Metabolomics based on Nuclear Magnetic Resonance (NMR) spectroscopy was used to describe, for the first time, the composition of honey samples from different Salento producers. Exploratory Principal Component Analysis (PCA) showed, among the observed clustering, a separation between light and dark honeys and a discrimination according to producers, both further analyzed by supervised multivariate analysis. According to the obtained data, although limited to small-scale emerging production, Salento honey shows at the molecular level, a range of specific characteristic features analogous to those exhibited by similar products originating elsewhere and appreciated by consumers. The impact on this production should therefore be carefully considered when suggesting extensive use of pesticides in the area.

Graphical Abstract

1. Introduction

Honey is a natural sweet substance produced by honeybees from the nectar of flowers, plant secretions or plant-sucking insect excretions (honeydew honey). Botanical and geographic origins determine both sensory properties (colour, flavor, and texture) and physicochemical parameters (viscosity and crystallinity) of this product [1]. Honey is one of the most complex natural foods and it is considered the only sweetening agent that can be used by humans without processing [2]. Sugars constitute the major component (95% of dry weight) responsible for the energy value of honey: two monosaccharides, fructose, and glucose are the dominant constituents [3]. Besides the two main sugar components, honey contains about 25 oligosaccharides (tri- and tetra-saccharides). Several studies reported the characterization of the carbohydrate profile of honey [3,4]. Water is the second most abundant honey constituent (12–23%). Other minor components such as organic acids, minerals, vitamins, enzymes, proteins, amino acid, and volatile and phenolic compounds characterize the organoleptic and nutritional properties of honey [5]. Besides the high nutritive value, minor components are also responsible for the healthy properties of honey such as antibacterial, anti-inflammatory, antioxidant, and immune system-stimulating activities, as reported in the literature [2,6]. Many factors such as geographical, botanical or floral origin, together with climatic and seasonal variations, influence honey chemical composition and quality [7]. Moreover, other external factors such as the environment, honey treatment methods, and storage conditions used by beekeepers as well as possible deliberate adulteration should also be taken into account [8]. According to the current standards of the Codex Alimentarius [9] and the European Union (EU) [10], several physical and chemical measurements are required for honey quality control, all very important for honey producers, the food industry, consumers, and regulatory authorities. To date, several different botanical varieties of honey are available on the market, namely, monofloral or polyfloral, with strong differences in composition and physical, chemical, and organoleptic characteristics [11,12]. Honey colour strongly depends on its age and the kind of flowers that supplied the nectar to the producing bees. Honey colour is also related to its flavor. Light-coloured honeys are mild-flavoured, while the dark ones have a stronger flavor [13,14]. Darker honeys such as honeydew honeys are reported to contain more phenolic acid derivatives but fewer flavonoids than light coloured ones [13,15,16]. Several studies have reported on the assessment of the quality, geographical, and botanical origins of honey, also with the aim to detect any possible adulteration [3,8,17]. Application of Nuclear Magnetic Resonance (NMR) spectroscopy for the analysis of honey offers some advantages compared to other conventional analytical methods (such as GC and GC–MS) [17,18]. These include the availability of a wealth of information in a single measurement, simultaneous detection of various components, high reproducible and comparable data with a high statistical confidence level, and minimal requirements for sample amount and pre-processing [19,20]. In particular, the metabolomic approach based on NMR spectroscopy, in combination with chemometrics, is a powerful fingerprinting technique that is successfully employed for biomarker detection, food quality control, and/or origin discrimination [11,21,22,23,24,25,26]. This approach is used to analyze metabolite profiles and identify the most important discriminating compounds that differentiate honeys. Indeed, several studies proved the NMR-based screening techniques are a suitable tool for the rapid authenticity analysis of honey [19].
In this paper, we present an investigation of combined NMR and a chemometric data analysis approach to describe the variability in the composition of honey samples from different local Salento (Lecce and Taranto Provinces, Apulia region, South-East Italy) producers. Although some papers describing NMR characterization of Italian honey have already been published [3,11,12,21,27,28], the present study appears to be the first work focused on honey from Salento. On the other hand, although it can be considered one of the most important Italian regions as a foodstuff source, nowadays, Apulia only represents an emerging honey producer with about 290 t, less than 2% of the total Italian production (23,344 tons) [29]. Moreover, the Salento contribution to the Apulia production only relies on a minor part of active beehives in the region [29,30]. Nevertheless it should be considered that Salento honey (part of the Apulia production) is considerably threatened due to the suggested use of neonicotinoids in order to control the insect-vectored bacterium Xylella fastidiosa (subsp. pauca) [31]. The suggested use of insecticides in order to control X. fastidiosa vector(s) in the Salento area has been recently reviewed in an EFSA (European Food Safety Authority) report [32]. Neonicotinodis, the insecticides that are most widely used worldwide, are substances known to be carcinogenic to people and considered responsible for the deaths of bees, representing a serious risk for biodiversity and ecosystems [33,34,35]. After monitoring by the EFSA in 2013 [36], the EU decided to prohibit the use of neonicotinoids in open fields [37]. Nevertheless, as a consequence of the “National emergency plan for X. fastidiosa management in Italy”, on the 13 of March 2018, the Italian Minister of Agriculture, issued a decree determining in the Apulia Region a specific area (Salento) where farmers may be forced to use these pesticides [31,38,39]. On the other hand, Salento honeys, under treat due to the possible deaths of bees related to pesticide use, do not appear to have been previously characterized. Thus, this could be one of the main reasons to focus, for the first time, on the characterization of honey produced in Salento (an Apulia sub-region where X. fastidiosa diseases first appeared). In particular, thirteen honey samples from different provinces of the Salento area were subjected to spectroscopic fingerprints in order to characterize them qualitatively and also to identify potential molecular components responsible for discrimination among sample clusters.

2. Results and Discussion

2.1. 1H-NMR Fingerprinting and Metabolite Identification

A total of 13 samples of mono- and multi-floral honeys and honeydew supplied in commercial jars by four trusted Salento honey producers were analyzed. Three technical replicates were obtained from a single specific commercial honey jar in order to minimize possible data inhomogeneity. The studied honeys included eight multi-floral, three mono-floral (one acacia, one orange, and one citrus sample), and two honeydew samples. The limited size of the reported sample set was chosen to provide preliminary indications of Salento honey characteristics. However, several studies used a very limited number of samples for much wider productions and geographic areas, such as the quality and bio-functional properties characterization of seven honey samples of different botanical and geographical origins collected from different regions of Portugal [40]; the 1H-NMR profiling and chemometric analysis of ten selected honeys from South Africa (five), Slovakia (three), and Zambia (two) [8]; the chemometric analysis of three stingless bee honey samples from different botanical origins collected in Malaysia [41]; the 1H NMR characterization of twenty Finnish honeys [42]. The screenings based on 1H-NMR spectroscopy allowed us to extract, in a single and quick analysis, all sample molecular information while maintaining the specific ratios between metabolites present in a complex matrix, without previous separation. The assignments of honey signals identified in the samples, prepared according to the procedures described in the experimental section, are reported in Table 1.
A typical 1H-NMR spectrum of honey sample dissolved in deuterated water as indicated in the Material and Methods section is reported in Figure 1.
From visual inspection of the expansions, three regions could be identified, corresponding to the region of amino acids (0–3 ppm) (Figure 1a), the region of sugars (3–6 ppm) (Figure 1b), and the aromatic region (6–10 ppm) (Figure 1c). The most intense and dominant signals in the spectrum are represented by sugars, typically α–and β−glucose and fructose. Moreover, as already reported in the literature, signals of other sugars, e.g., disaccharides such as sucrose, maltose, isomaltose, and turanose, and trisaccharides such as raffinose, could be identified [3]. These signals were identical in all the honey samples analyzed with minimal intensity variations, as already observed in the literature [19,22]. The resonances of the minor components, which play important roles in honey differentiation were less intense (for example, amino acids, organic acids, etc.). In particular, the minor signals were ascribable to organic carboxylic acids (such as citric acid, acetic acid, and succinic acid) and both aliphatic (alanine, valine, leucine, isoleucine, lysine, proline) and aromatic (phenylalanine and tyrosine) amino acids. Proline, which might originate from bees, is the prevalent honey amino acid and makes up to 50–85% of the amino acid fraction [44]. Organic acids are present in honey at low concentrations (< 0.5%) and they are related to colour, flavor, and other honey physical–chemical properties, such as pH, acidity, and electrical conductivity. Moreover, organic acids can synergistically enhance the antioxidant action of phenolic compounds by chelating metals [1,6]. Acetic acid and ethanol are known to be used as fermentation indicators whereas formic acid is used for the treatment of Varroa infestation [45]. Interestingly, specific resonance (1.38 ppm, s) of methyl groups from a monoterpenoid acid, cyclohexa-1,3-diene-1-carboxylic acid, and as very minor component its (1-O-gentiobiosyl) ester derivative were observed in both light and dark polyfloral honeys. The proton and carbon assignments, obtained by 2D hsqc and hmbc NMR experiments confirmed that the (1.38 ppm, s) signal was ascribable to the known linden honey monoterpenoid acid marker [20,21,27]. Furthermore, a significant number of other compounds (formic acid, ethanol, trigonelline) and other aromatic signals could be observed by NMR, with variations in intensity according to the honey samples. Trigonelline is a plant hormone typical of herbaceous species, identified for the first time in Corsican honeys [46]. Another important observed signal is related to hydroxymethylfurfural (HMF), a furan derivative produced by sugar degradation. HMF is considered an indicator of overheating and long storage conditions [1,22], being an intermediate in the Maillard reaction [47], which links the concentration of HMF to aging and heating processes [48]. HMF levels are used to evaluate honey freshness, although its presence could naturally occur in honey of warm climatic areas, such as tropical and subtropical countries [12]. Typical signals of kynurenic acid (KYNA) (8.22, 7.86, 7.55, 6.94 ppm), often associated with chestnut honeys [21], were also observed in the analyzed samples, although only in the dark honey from a specific producer. Kynurenic acid is known to have beneficial properties in various diseases of the gastrointestinal tract [49], although other authors suggested that an increase in the levels of kynurenic acid in the brain could be linked to some neuropathologies [50]. Further studies regarding the effects of kynurenic acid (KYNA) are needed in order to better understand its role in human health [12]. Honeydew 1H NMR spectra showed intense aliphatic resonances in the range 0.90–1.65 ppm and a diagnostic doublet at 5.70 ppm. These signals are according to the reported resonances characteristic of honeydew honeys [21]
Finally, a not intense but clear signal at 5.90 ppm was observed only in the orange and citrus honey 1H NMR spectra and it could be ascribable to a diagnostic resonance of 8-hydroxylinalool, a specific marker of citrus honey [20,27]. In all the studied samples, none of the representative signals indicating the presence of neonicotinoid pesticides [51] could be detected.

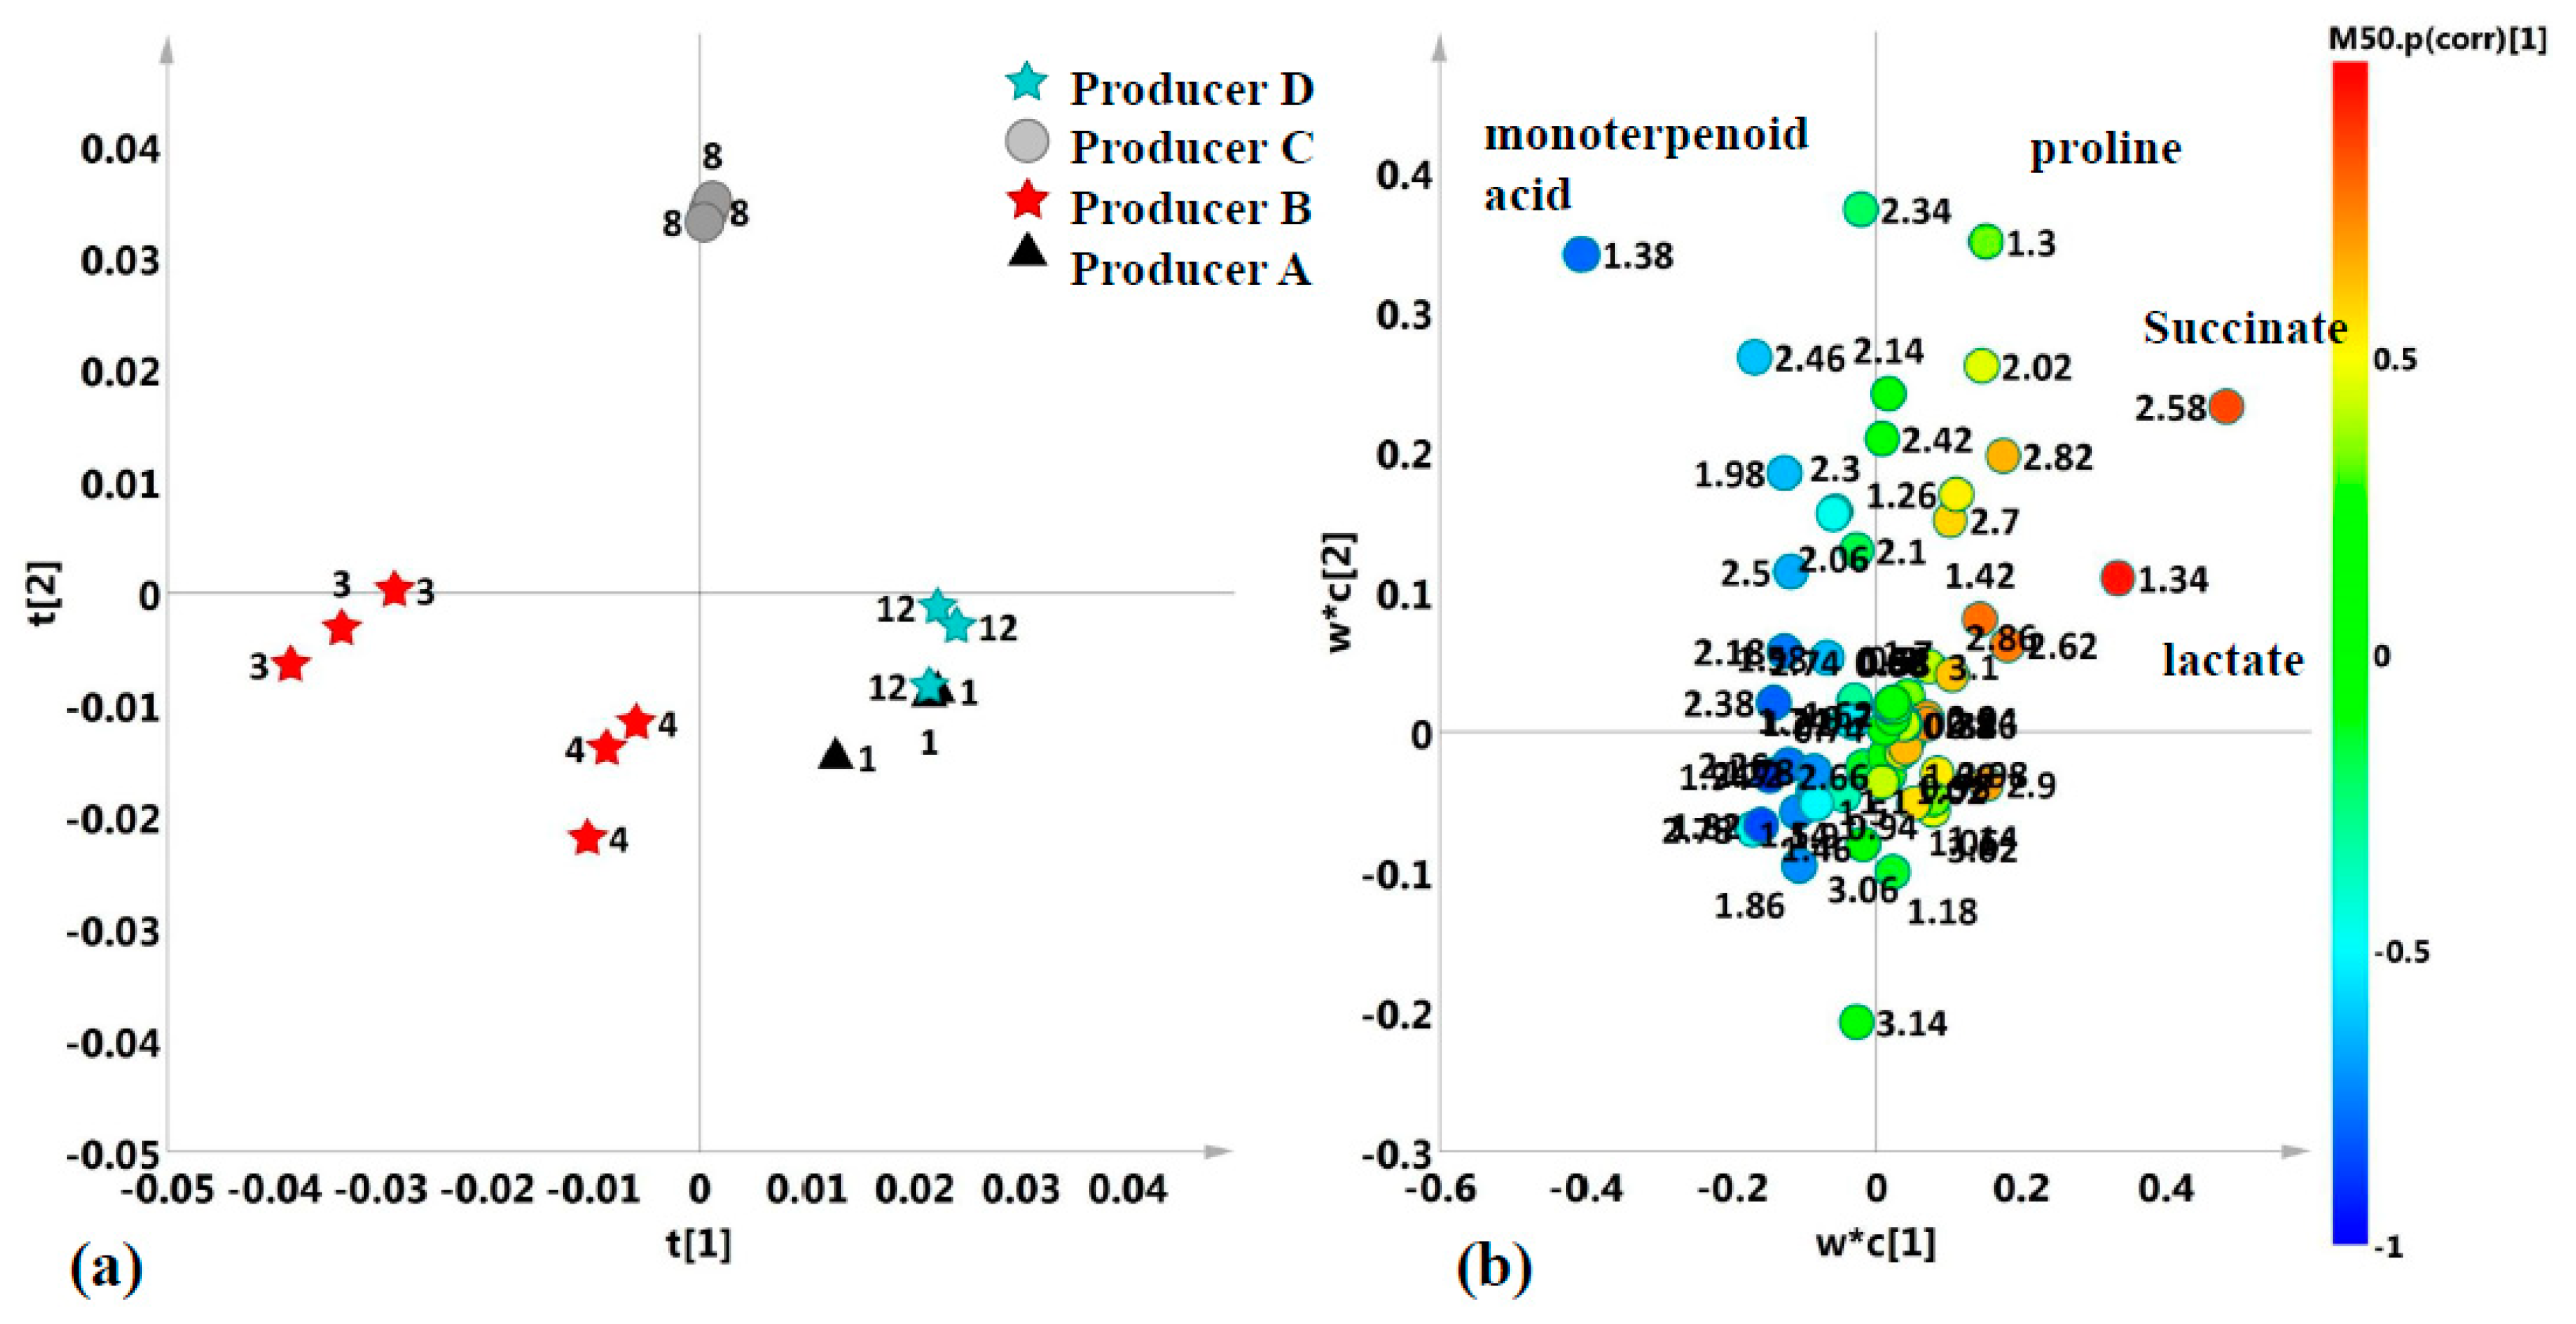
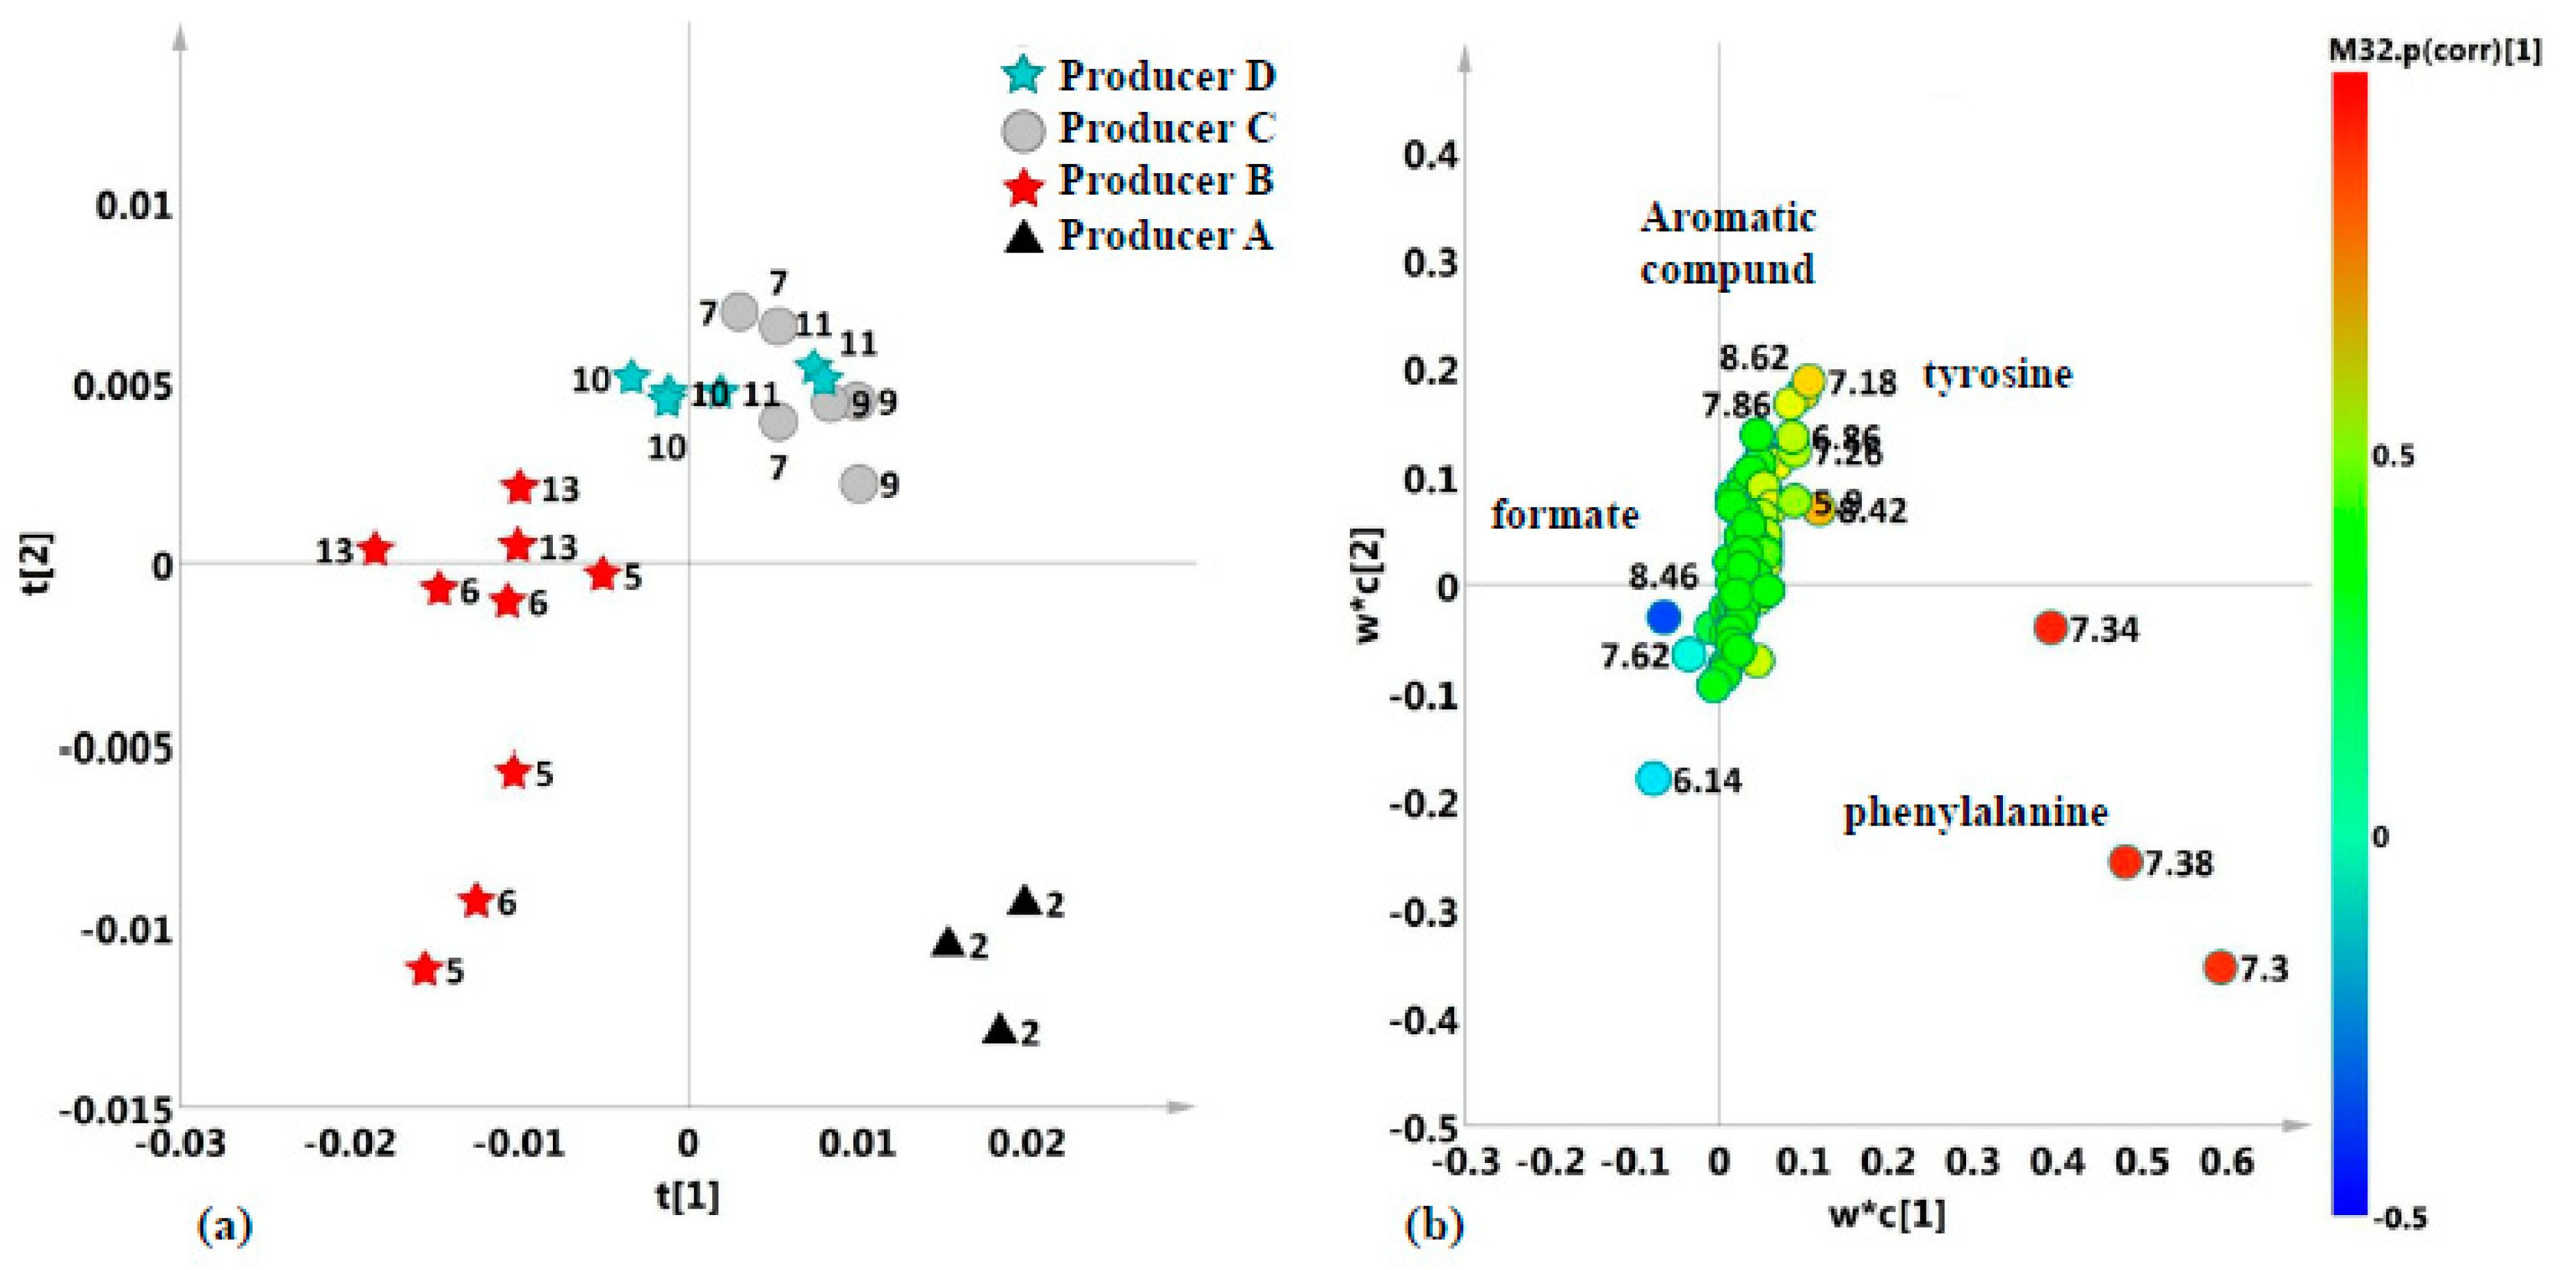
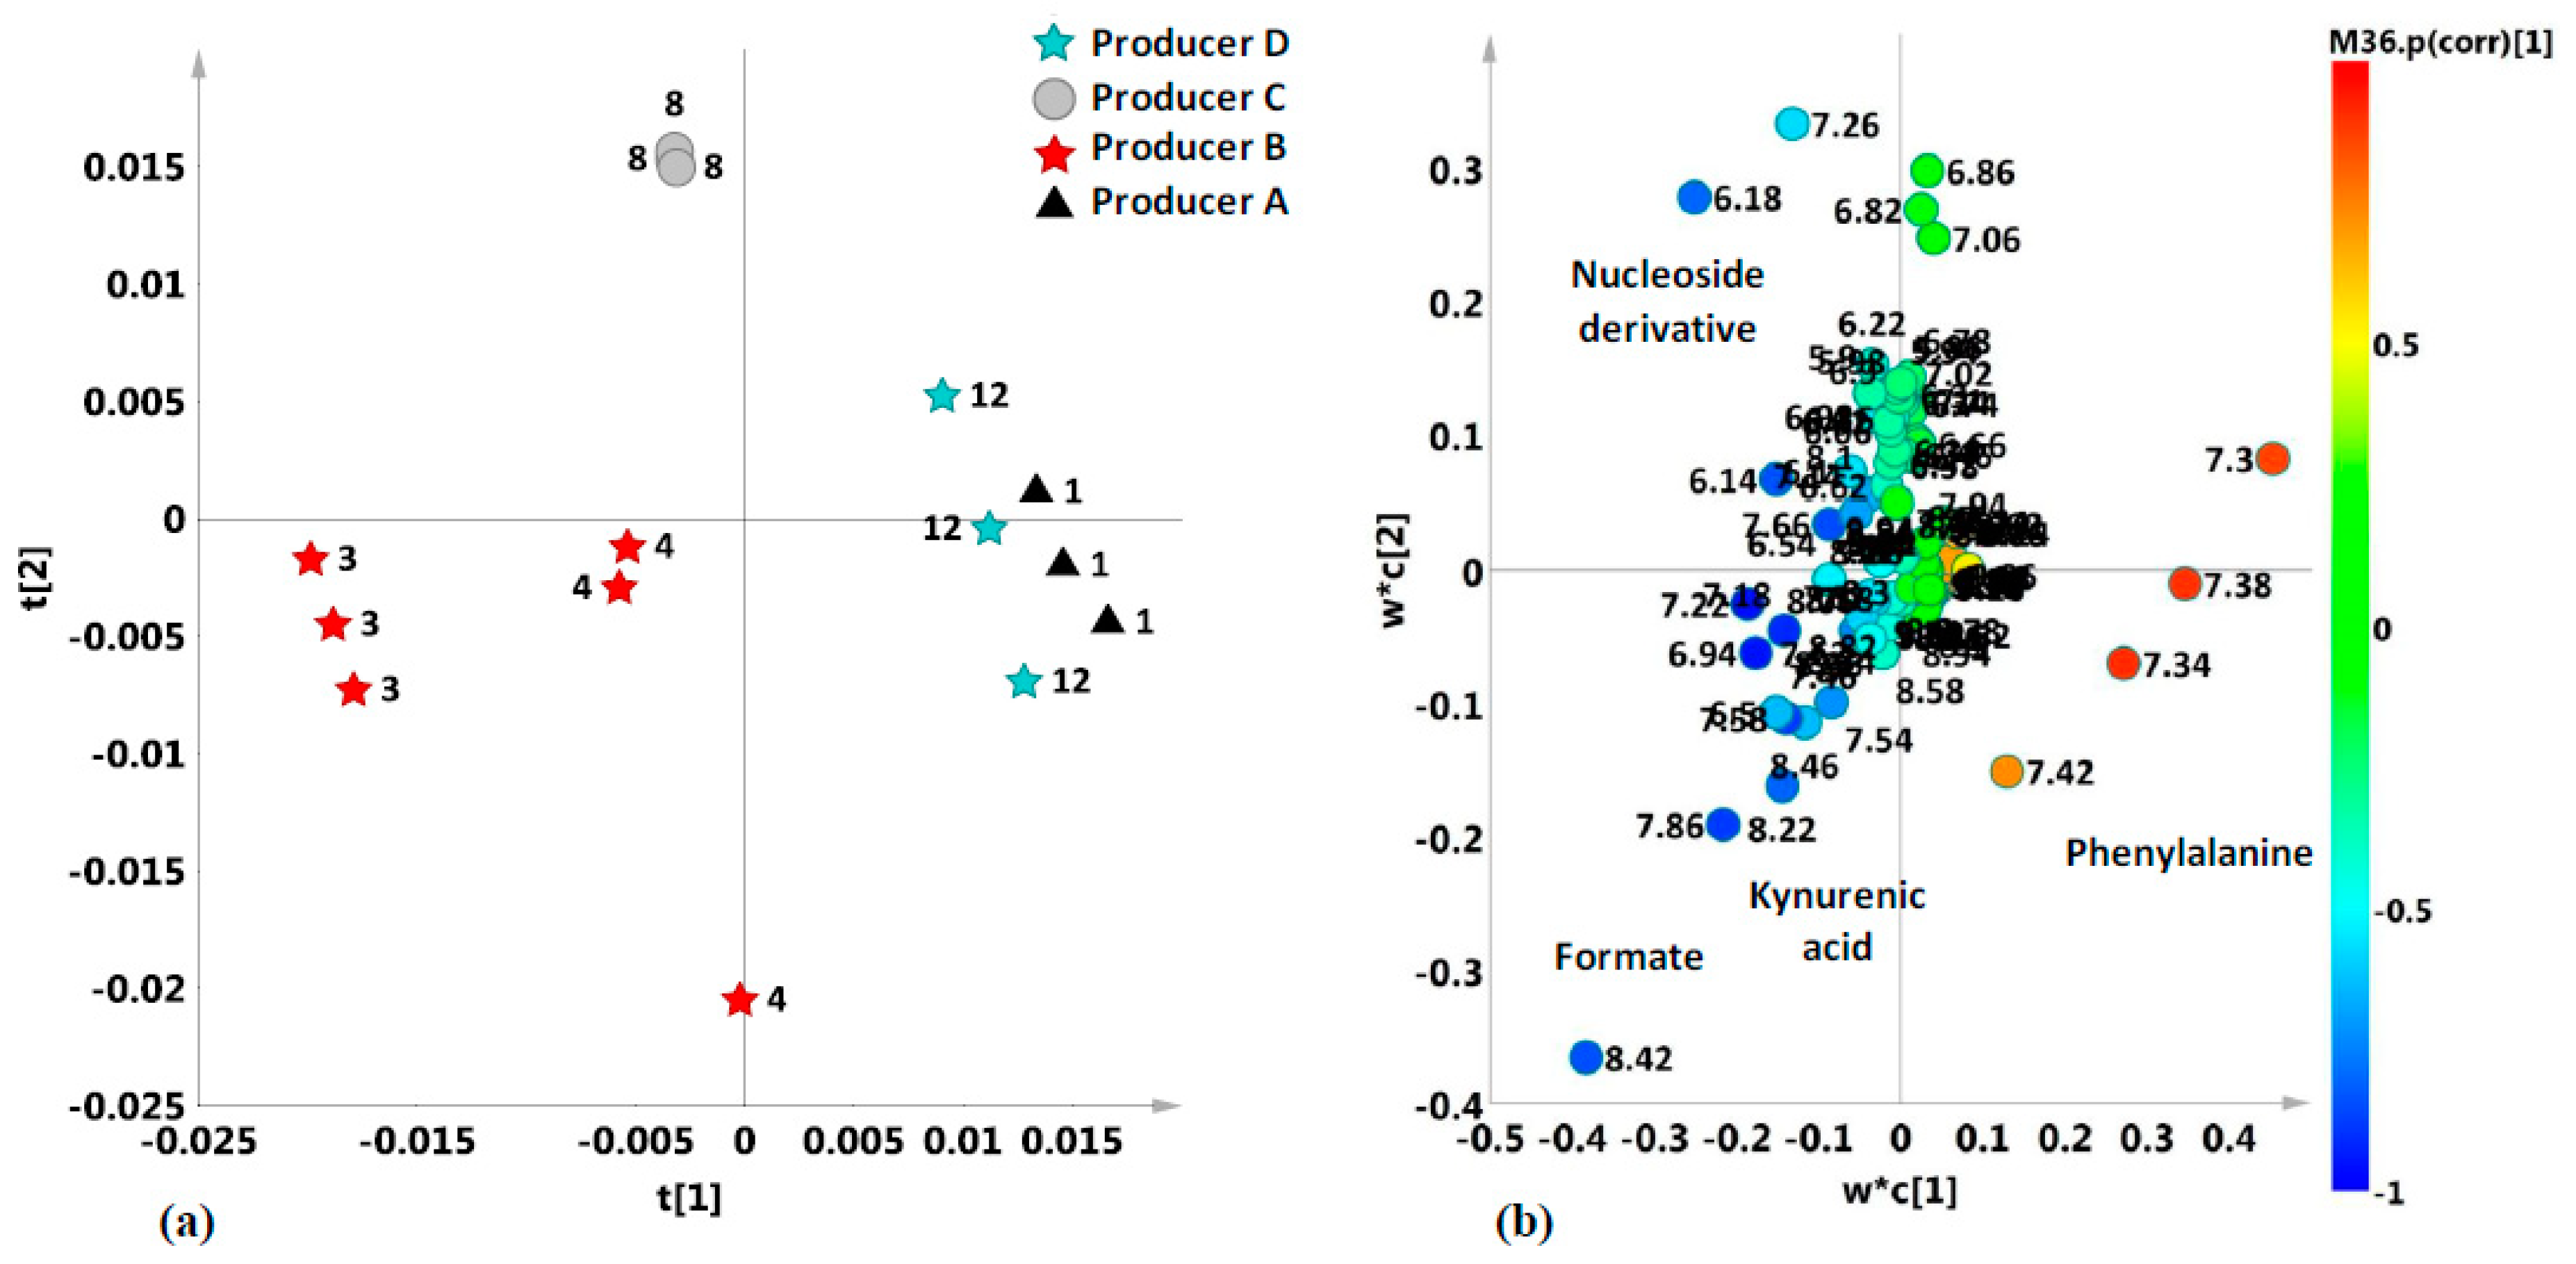
2.2. Unsupervised and Supervised Discriminant Analyses

A preliminary unsupervised multivariate analysis (PCA) (three components, R2X = 0.891; Q2 = 0.826) was performed on the bucket-reduced spectra for the studied samples to obtain an overview of the data and reveal a possible data grouping of observations without any a priori-defined class. No specific outliers were detected in the scores plot and a general natural tendency of the samples clustering according not only to technical replicates (Figure S1a) but also to specific honey features (dark, light, honeydew) and producers was observed. In particular, the same unsupervised PCA showed a “naturally” clear clustering [52] of the honey samples into two groups according to the declared colour (dark- and light-coloured honeys) (Figure S1b). A summer honeydew, a honeydew, a summer polyfloral honey, and two summer polyfloral honeys clustered into a group characterized by dark colour. On the other hand, citrus, acacia, orange, three spring polyfloral, and two polyfloral honey samples grouped together in the light-coloured class. The distinctive observed colour and clustering showed the occurrence of all the summer- and spring-collected samples in the dark- and light-coloured groups, respectively. This is probably ascribable to a specific relation between collection season and colour already reported in the literature [53]. We refined the separation analysis between the two observed macro-classes, dark and light samples, by pair-wise supervised OPLS–DA aimed to specify the discriminating molecular components responsible for the observed clear discrimination between the light- and dark-coloured honey groups—Figure 2a,b.
We obtained a model with good fit and prediction parameters (1 + 2 + 0 gave R2X 0.874; R2Y 0.956; Q2 = 0.939; p[cv]—ANOVA = 4.87 × e−18). As observed from the S-line for the model, the loadings ascribable to the sugar signals characterized both macro groups. Interestingly, the signals in the aliphatic region (proline, succinate, lactate, monoterpenoid acid) and those related to aromatic compounds (tyrosine, phenylalanine, KYNA, formate) characterized only dark-coloured honeys according to the literature data [10,18,26]. Thus, discriminating information between dark and light honeys could be found specifically in the signals of the minor components [19]. Moreover, in the OPLS–DA score plot (Figure 3) the light and dark honeys were also separated into different subgroups, according to the producers, along the first orthogonal component (intra-class variation).
This observed clustering clearly indicates that the honey intraclass variability was producer dependent and related to both dark and light products obtained from the same farm. Moreover, the OPLS-DA data of Figure 3 confirmed the hint of further grouping according to producers observed in the PCA scores plot (Figure S1). Therefore, the whole honey sample set was further studied with supervised analysis aimed at discrimination of the different producers. A supervised PLS–DA was performed, according to different producer classes, considering dark and light honeys separately. Furthermore, chemometric methods were applied to the different spectral regions of the aliphatic (from 0 to 3.14 ppm) and the aromatic (6 to 10 ppm) areas in order to identify and characterize the functional groups of the molecules (organic acids, amino acids, aromatic molecules) responsible for samples discrimination. The possible presence of low-intensity signals of potential discriminating markers for the analyzed honeys and their contribution to samples differentiation were evaluated by excluding the sugar signals region in the statistical analysis [19].

2.3. Aliphatic Region

In the case of light honeys, the supervised PLS–DA resulted in a model with very good descriptive and predictive parameters (four components gave R2X = 0.915; R2Y = 0.945, Q2 = 0.889; p[cv] - ANOVA= 1.015 × e−12) (Figure 4).
The scores plot for the model revealed a clear separation between the samples according to considered membership class (Producer) (Figure 4a). The light honey samples from Producer B (samples 5, 6, and 13, depicted as red stars) could be observed at positive values of the main component t1, clearly separated from the samples of Producer A, placed at values close to 0 of the main component. Moreover, samples of producers C and D could be observed, such as two closely related groups, placed at negative values of the main component t[1]. The loading scatter plot (Figure 4b) for the model revealed a higher relative content of lactate and proline characterizing light honey samples from Producers C and D, while the presence of ethanol characterized samples from Producer A.
The PLS–DA, carried out on dark honey samples also revealed in this case a clear separation among the Producer-defined sample classes. Thus, the resulting model was characterized by excellent parameters (four components gave R2X = 0.909; R2Y = 0.915, Q2 = 0.752; p[cv]—ANOVA = 8.91 × e−2) (Figure 5).
By visual inspection of t[1]/t[2] scores-plot (Figure 5a), the samples of producers A and D could be observed as two closely related groups at positive values of component t[1], separated from the Producer B samples along the t[1] component, at positive and negative values, respectively. Honeydew honey samples from Producer C were located at t[2] negative values and values close to 0 of the main component t[1]. The discriminating metabolites, identified from the loading scatter plot for the model were lactate (1.32 ppm) and succinate (2.56 ppm) for producer A and D and monoterpenoid acid derivatives (1.38 ppm) for Producer B. The observed higher relative content of organic acid in honeydew samples from Producer D was already reported in the literature [42]. Honeydew samples from producer C were characterized by a higher relative content of proline (2.34 ppm) (Figure 5b) as already observed for honeydews from different geographical origins [54,55]. Interestingly, the proline content was recently reported as a possible indicator of honey ripeness as it constantly decreases during storage [54].

2.4. Aromatic Region

The multivariate statistical analysis was then applied to all 39 honey samples considering the spectral region between 6 and 10 ppm, characteristic of aromatic protons. The supervised discriminant analysis (PLS–DA) was therefore carried out for the aromatic region, considering separately the light and dark honeys, according to the membership class (Producer). The PLS–DA applied to the light honey samples gave a four-component model with descriptive and predictive parameters equal to R2X= 0.936, R2Y = 0.708, Q2 = 0.514; p[cv] - ANOVA= 2.35 × e−6 (Figure 6).
Once again from the score plot (Figure 6a), a separation of the samples based on the class producer could be observed. The loading scatter plot for the model described the molecular components underlying this separation. Specifically, the samples of Producer B, placed at negative values of component t1, were characterized by the highest relative content of formate (8.42–8.46 ppm). Although this compound is normally present in honeys, a possible use of this organic acid in the treatment against an ectoparasitic mite (Varroa) could not be excluded [45]. Samples from Producer A were characterized by a higher phenylalanine content (7.42, 7.38, and 7.32 ppm) while the samples of Producers C and D were basically grouped in a single cluster, with positive values of the t[2] component, characterized by the presence of higher tyrosine (7.19 and 6.90 ppm) and other unidentified aromatic molecules (8.62 ppm). Interestingly, the latter (bucket at 8.62) was also observed but not identified in Finnish lingonberry honey as a specific signal at 8.60 ppm [42]. A possible attribution to niacin could be suggested according to the established presence of this metabolite in honey [56].
Finally, the PLS–DA was conducted on the aromatic region of dark honey samples, considering the different producers (Figure 7).
Separation among groups was also observed in this case. The model derived from the analysis was a good descriptive and predictive model (four components gave R2X = 0.896, R2Y = 0.935 and Q2 = 0.803. p[cv] - ANOVA = 8.5 × e−4) characterized by a good separation among the samples from the different producers (Figure 7a). The class of dark honey samples from Producer B were observed in the score plot at negative values of the t1 component The observed deviation for one of the Sample 4 technical replicates occurred only for the t[2] component and could be ascribed to the intrinsic sample inhomogeneity (the reason for preparing and analyzing technical replicates). Nevertheless, the residual variability was associated with decreases in the standard deviation as observed in the contribution plot (data not shown) and therefore the Sample 4 remained in the model. On the other hand, the three Sample 4 replicates appeared closely related to each other in the aliphatic region (Figure 5), and in the overall samples PCA (Figure S1), Producer B group was characterized by a higher content of formate (8.42–8.46 ppm) as already observed for light samples from the same Producer B and typical signals of kynurenic acid (KYNA) (8.22, 7.86, 7.55, 6.94 ppm) [21]. Signals of phenylalanine (7.42, 7.38, and 7.32 ppm), an aromatic amino acid, characterized the dark honeys of producers A and D. Honeydew honey from Producer C was characterized by variables (loadings) corresponding to the NMR signals at 7.28 and 6.18 ppm typical of nucleoside derivatives (Figure 7b).

2.5. Metabolites Comparison

The variation in discriminating metabolites content for light and dark honeys, among the observed groups (Producer classes) was calculated by the integration of selected distinctive unbiased NMR signals. In particular, signals corresponding to proline, monoterpenoid acid derivative, lactate, ethanol, phenylalanine and lysine were integrated for light honey samples, whereas formate, monoterpenoid acid derivatives, proline, lactate, phenylalanine, nucleoside derivatives, succinate, and KYNA were integrated for dark honeys. Metabolites that showed a significant variation among groups were validated by one-way ANOVA with the HSD post-hoc test and are reported as the mean and standard deviation of integrals for each group in Table 2 (Figures S2 and S3).
According to the obtained data, although limited to a relatively low sample number, but representing small-scale emerging production, the Salento honey shows at the molecular level, a range of specific characteristics features. These features are analogous to those exhibited by similar products originating elsewhere and well established in the literature [1,8,11,22,42,46]. Moreover, metabolic fingerprinting allowed us to clearly differentiate the studied production according not only to the macroscopic season-related character but also to the specific producer. High levels of proline, representing a quality criterion with respect to sugar adulteration, were also observed, although not equally distributed in the samples [54]. Therefore, the suggested use of neonicotinoids [32] to control the insect-vectored bacterium Xylella fastidiosa (subsp. pauca) should also take into account the need for preserving this emerging local foodstuff product.

3. Materials and Methods

3.1. Sampling

A total of 13 samples of monofloral and polyfloral honeys and honeydew characterized by different colours were analyzed. Samples were obtained from thirteen different commercial jars supplied by four trusted honey producers located in the Apulia Region (Lecce and Taranto provinces). The studied honeys included eight polyfloral, three monofloral (one acacia, one orange, and one citrus sample), and two honeydew samples. The botanical origins were assigned according to the trusted producers’ declarations. Since polyfloral honeys can be considered a miscellaneous pool of samples of various botanical origins [57], whenever possible, the reliability of the declarations for monofloral samples was confirmed by the identification of 1H NMR signals of specific markers of botanical origin [20,21,23,27]. Nevertheless further melissopalynological analysis was necessary in order to characterize the pollen types in the studied samples. The different honey colours were assigned according to the trusted producers’ declarations. The different colours were also checked by visual comparison supported by unsupervised PCA without any a priori-defined class (including colour differentiation) scores plot (Figure S1a,b,) and pair-wise supervised analysis (OPLS–DA) (Figure 3). All honeys were stored at room temperature and in the dark before spectral analysis. In order to minimize possible sample inhomogeneity, each honey sample consisted of three technical replicates obtained from a single specific commercial honey jar. Honey descriptions and pesticide-free area production according to the producers (A, Margarito; B, Selvaggi; C, Greco; D, Salento Miele) are reported in Table 3. In order to check any possible variability in the sugar content for the different honey productions, the caloric content (as Kcal/100 g) of different producers’ honey samples (Figure S4) was determined using an adiabatic calorimeter bomb (IKA C7000, Staufne, Germany).

3.2. Sample Preparation for NMR Analysis

Each of the 13 supplied honeys was used to prepare three technical replicates for a total of 39 samples. Each sample was obtained by dissolving 100 mg of honey in 600 μl of deuterated water (D2O) containing the standard 3-trimethylsil-2,2,3,3-d4 propionic acid (TSP), 0.5 mM. The pH of aqueous solution honey samples was not corrected for slight deviations as the buckets could be adjusted in the processing step in order to include possible chemical-shift deviations [12,58]. The final solution was placed in an NMR tube (0.5 mm diameter).

3.3. 1H-NMR Spectra Acquisition and Processing

All spectra were acquired at a constant temperature (300 K) on a Bruker Avance III 600 MHz Ascend NMR Spectrometer (Bruker Italia, Milano, Italy), operating at 600.13 MHz, equipped with a TCI cryoprobe (inverse Triple Resonance Cryoprobe Prodigy), incorporating a z axis gradient coil and automatic tuning-matching (ATM). Experiments were acquired in automation mode after loading individual samples on an integrated Bruker Automatic Sample Changer, interfaced with IconNMR software (Bruker). For each sample, a 1H NMR spectrum was acquired with water signal suppression (Bruker pulseprogram zgcppr), in a spectral window of 20.0276 ppm (12019.230 Hz), with 64 scans and a 90° pulse of 7.620 µsec. After the acquisition, the standard FID processing procedures were carried out, by using TopSpin 3.5 (Bruker, Biospin, Italy), such as Fourier transform (mathematical operation that converts signals into a frequency spectrum), phase and baseline correction, and 0.3 Hz line broadening. All NMR spectra were calibrated with respect to the internal standard TSP (δ = 0.00 ppm). The characterization of the metabolites was determined by the analysis of two-dimensional homo- and heteronuclear NMR spectra (2D 1H J-resolved, 1H COSY, 1H-13C HSQC, and HMBC) and by comparison with the literature data [1,3,11,18,21,22,24,46]. The NMR spectra were converted to a suitable form for multivariate analysis by Amix 3.9.15 (Analysis of Mixture, Bruker BioSpin GmbH, Rheinstetten, Germany) software. Specifically, each NMR spectrum was segmented into areas or histograms, with a fixed base width of 0.04 ppm normal rectangular bucketing”). The bucket tables thus obtained were subjected to a standardization procedure, in order to minimize the possible differences in the concentration of the various metabolites due to sample preparation and/or acquisition conditions. Subsequently, the data matrices (buckets) were subjected to centering and scaling operations: The Pareto scaling method, obtained by dividing each variable by the square root of the variable standard deviation centered around the mean value, was applied [59]. The total sum normalization was applied to minimize small differences due to metabolites concentration and/or experimental conditions among samples [59]. The data table, generated by all aligned buckets row-reduced spectra, was used for further multivariate data analysis. Each bucket row represents the entire NMR spectrum, with all the molecules in the sample. Moreover, each bucket, in a buckets row-reduced spectrum, is labeled with the value of the central chemical shift for its specific 0.04 ppm width. The variables used as descriptors for each sample in chemometric analyses are the buckets.

3.4. Multivariate Statistical Analysis

After the data processing step, an exploratory and discriminating analysis was performed, using a multivariate statistical approach, with the help of Simca-P version 14 (Sartorius Stedim Biotech, Umeå, Sweden) software. In particular, Principal Components Analysis (PCA), Partial Least Squares Discriminant Analysis (PLS–DA), and Orthogonal Partial Least Squares Discriminant Analysis (OPLS–DA) were performed. Unsupervised methods such as principal component analysis (PCA) represent the first step in data analysis. Principal component analysis is a chemometric technique aimed at extracting the maximum possible information from a multivariate data structure, summarizing it in a few linear combinations of the variables themselves [60]. PCA is frequently used in the first data processing step in order to obtain a general description of the samples distribution and possible grouping in homogeneous clusters [61]. The possible correlation between the clusters distribution of the analyzed samples and the considered classes is carried out with the subsequent analyses. By PCA, it is also possible to identify outliers (samples showing characteristics of variability of the data particularly different from the others). The assessment of the correlation between the clusters distribution of the analyzed samples (observed by PCA) and the considered classes (such as variety and/or geographical origin) is therefore carried out by using supervised multivariate statistical analyses such as PLS–DA(Projections to Latent Structures Discriminant Analysis, PLS - DA) and OPLS–DA (Orthogonal Partial Least Squares Discriminant Analysis). In the present case, discriminating analysis of the PLS–DA type was performed to classify the honey samples and find indications for maximizing the separation among the classes (inter-class variability) while minimizing the dispersion within each class (intra-class variability). The PLS–DA technique is currently the most widely used for the discrimination of samples with different characteristics (by treatment, species, origin). The PLS–DA is performed in order to refine the separation between groups of observations, rotating the main components, i.e., the axes that express the variance of the data, so as to obtain a maximum separation between the classes and information on the variables responsible for this separation [62]. OPLS–DA is a modification of the PLS–DA method which filters out variation not directly related to the focused discriminating response. This is accomplished by separating the portion of the variance useful for predictive purposes from the non-predictive variance (which is made orthogonal). The result is a model with improved interpretability [63]. Validation of statistical models was performed and further evaluated by using the internal cross-validation default method (7-fold) and with permutation test (20 permutations) available in SIMCA-P software [64]. R2, Q2, and p[CV - ANOVA] parameters was used to describe the quality of the model. The first (R2) is a cross validation parameter defined as the portion of data variance explained by the models and indicates the goodness of fit. The second (Q2) represents the portion of variance in the data predictable by the model. The minimal number of components required can be easily defined since R2(cum) and Q2(cum) parameters display completely diverging behavior as the model complexity increases [65]. Cross-validated analysis of variance (p[CV - ANOVA]) provides a p-value indicating the level of significance of group separation in PLS–DA and OPLS–DA [63,65]. The variables responsible for the observed discrimination were identified by using the statistical tool loading scatter plot. This tool creates a scatter plot of the loading vectors for the first two components. The change in discriminating metabolite content among the observed groups was determined by analyzing the integrals of selected distinctive unbiased NMR signals after spectra normalization (to the total spectrum excluding the residual water region) [24,25]. Results, as mean intensities and standard deviation of the selected NMR signals, were validated by analysis of variance (one-way ANOVA) with Tukey’s honestly significant difference (HSD) post-hoc test by using MetaboAnalyst software [66]. Statistical significance was set at least at an adjusted p-value < 0.05. The use of chemometric methods, both of an exploratory nature and of a discriminating or classifying nature, of the metabolic components present in the samples, to verify the ”clustering” of the samples. The metabolomics based on Nuclear Magnetic Resonance (NMR) spectroscopy, allows to simultaneously detect a wide range of structurally different metabolites, bringing useful information to the discrimination of the samples.

4. Conclusions

In this work, the application of chemometric methods to 1H NMR spectra allowed us to preliminary characterize and discriminate the honeys produced by four different producers in a sub region (Salento, Lecce and Taranto Provinces), of Apulia, in South-East Italy. To the best of our knowledge, this research, based on an 1H-NMR fingerprinting approach, represents the first study applied to honeys from the Salento area within the Apulia Region. The suggested use of harmful neonicotinoids in the Xylella fastidiosa-infected area represents a serious risk for biodiversity and the ecosystem; these chemicals are highly toxic to insects such as bees, species of vital importance to humans [33]. Thus, the present preliminary study of Salento honeys demonstrated the need to protect this local natural food which could be clearly and profitably characterized as similar products reported in the literature. The unsupervised PCA showed among the other feature-related natural clustering, a clear separation of the samples into two macro classes according to the light and dark colour of the samples. We refined the separation analysis between the two observed macro-classes, dark and light samples, by a pair-wise supervised OPLS–DA aimed to specify the molecular components responsible for the observed differences. Interestingly, in accordance with literature data, the signals in the aliphatic region and those related to the phenolic compounds characterized specifically only the dark samples. The two macroclasses were analyzed separately, by discriminant analysis (PLS–DA), considering aliphatic and aromatic regions, in order to observe the distribution of the samples according to the specific local producer. Signals of molecules responsible for the discrimination among the different local producers were clearly identified, and the differences among discriminant metabolites were quantified and statistically validated. Among these, high levels of proline, representing a quality criterion with respect to sugar adulteration, were also observed, although not equally distributed in the samples. This approach, based on the combination of NMR spectroscopy with unsupervised (PCA) and supervised analysis (PLS–DA) was confirmed as a high efficiency tool to characterize naturally complex honey samples. Thanks to the possibility of automation and the low cost per analysis required for screening, 1H-NMR profiling has already confirmed the potential for foodstuff traceability and authenticity assessment for commercial use. Although further investigations such as melissopalynological analysis are needed to better characterize this local product, the obtained data provide useful information to gain knowledge about Salento honeys. Composition features arising from this NMR–chemometric study as those exhibited by similar products originating elsewhere could be proficiently used as a starting point for a complete characterization of local honey production. Therefore, the impact on this production should be carefully considered when suggesting extensive use of pesticides for Xylella fastidiosa vectors fighting purposes.

Supplementary Materials

The following are available online at https://www.mdpi.com/2071-1050/12/12/5009/s1, Figure S1 (a) (b). PCA t[1]/t[2] scores plot for the studied samples on the bucket-reduced entire spectra. Figure S2. Discriminant metabolites multiple comparison graphical summary for light honey samples. Figure S3. Discriminant metabolites multiple comparison graphical summary for dark honey samples. Figure S4. Caloric content (mean ± S.D.; n = 3) of different producers’ honey samples.

Author Contributions

Conceptualization, S.V. and F.P.F.; Data curation, C.R.G.; Formal analysis, C.R.G.; Investigation, R.S.; Methodology, F.P.F.; Project administration, S.V. and F.P.F; Resources, R.S.; Supervision, S.V. and F.P.F; Validation, C.R.G. and F.P.F; Visualization, C.R.G.; Writing—original draft, C.R.G.; Writing—review & editing, C.R.G. and F.P.F. All authors have read and agreed to the published version of the manuscript.

Funding

This research received no external funding.

Acknowledgments

The authors thank the farms Miele Selvaggi srl, Apicoltura Margarito, Salento Miele, and Alessandra Greco for supplying commercial jars.

Conflicts of Interest

The authors declare no conflict of interest.

References

  1. del Campo, G.; Zuriarrain, J.; Zuriarrain, A.; Berregi, I. Quantitative determination of carboxylic acids, amino acids, carbohydrates, ethanol and hydroxymethylfurfural in honey by 1H NMR. Food Chem. 2016, 196, 1031–1039. [Google Scholar] [CrossRef] [PubMed]
  2. Kazalaki, A.; Misiak, M.; Spyros, A.; Dais, P. Identification and quantitative determination of carbohydrate molecules in Greek honey by employing 13C NMR spectroscopy. Anal. Methods 2015, 7, 5962–5972. [Google Scholar] [CrossRef]
  3. Consonni, R.; Cagliani, L.R.; Cogliati, C. NMR characterization of saccharides in Italian honeys of different floral sources. J. Agric. Food Chem. 2012, 60, 4526–4534. [Google Scholar] [CrossRef] [PubMed]
  4. Pascual-Maté, A.; Osés, S.M.; Marcazzan, G.L.; Gardini, S.; Muiño, M.A.F.; Sancho, M.T. Sugar composition and sugar-related parameters of honeys from the northern Iberian Plateau. J. Food Compos. Anal. 2018, 74, 34–43. [Google Scholar] [CrossRef]
  5. Bogdanov, S.; Jurendic, T.; Sieber, R.; Gallmann, P. Honey for nutrition and health: A review. J. Am. Coll. Nutr. 2008, 27, 677–689. [Google Scholar] [CrossRef]
  6. Gheldof, N.; Wang, X.-H.; Engeseth, N.J. Identification and quantification of antioxidant components of honeys from various floral sources. J. Agric. Food Chem. 2002, 50, 5870–5877. [Google Scholar] [CrossRef]
  7. Nicolson, S.W.; Nepi, M.; Pacini, E. Nectaries and Nectar; Springer: Dordrecht, The Netherlands, 2007. [Google Scholar]
  8. Olawode, E.O.; Tandlich, R.; Cambray, G. 1H-NMR Profiling and Chemometric Analysis of Selected Honeys from South Africa, Zambia, and Slovakia. Molecules 2018, 23, 578. [Google Scholar] [CrossRef] [Green Version]
  9. Commission FAO. Codex Standard for Honey Codex Stan 12-1981 12-1981. 1981, pp. 1–8. Available online: http://www.fao.org/3/w0076e/w0076e30.htm (accessed on 27 November 2019).
  10. Council Directive. 2001/110/EC of 20 December 2001 relating to honey. OJEC 2002, 10, 47–52. [Google Scholar]
  11. Consonni, R.; Cagliani, L.R. Geographical characterization of polyfloral and acacia honeys by nuclear magnetic resonance and chemometrics. J. Agric. Food Chem. 2008, 56, 6873–6880. [Google Scholar] [CrossRef]
  12. Consonni, R.; Bernareggi, F.; Cagliani, L.R. NMR-based metabolomic approach to differentiate organic and conventional Italian honey. Food Control 2019, 98, 133–140. [Google Scholar] [CrossRef]
  13. Pontis, J.A.; da Costa, L.A.M.A.; da Silva, S.J.R.; Flach, A. Color, phenolic and flavonoid content, and antioxidant activity of honey from Roraima, Brazil. J. Food Sci. Technol. 2014, 34, 69–73. [Google Scholar] [CrossRef] [Green Version]
  14. Abrol, D. Beekeeping: A Compressive Guide to Bees and Beekeeping; Scientific Publishers: Jodhpur, India, 2013. [Google Scholar]
  15. Bogdanov, S.; Ruoff, K.; Oddo, L.P. Physico-chemical methods for the characterisation of unifloral honeys: A review. Apidologie 2004, 35, S4–S17. [Google Scholar] [CrossRef] [Green Version]
  16. Pita-Calvo, C.; Vázquez, M. Differences between honeydew and blossom honeys: A review. Trends Food Sci. Technol. 2017, 59, 79–87. [Google Scholar] [CrossRef]
  17. Karabagias, I.K.; Vlasiou, M.; Kontakos, S.; Drouza, C.; Kontominas, M.G.; Keramidas, A.D. Geographical discrimination of pine and fir honeys using multivariate analyses of major and minor honey components identified by 1H NMR and HPLC along with physicochemical data. Eur. Food Res. Technol. 2018, 244, 1249–1259. [Google Scholar] [CrossRef]
  18. Spiteri, M.; Jamin, E.; Thomas, F.; Rebours, A.; Lees, M.; Rogers, K.M.; Rutledge, D.N. Fast and global authenticity screening of honey using 1H-NMR profiling. Food Chem. 2015, 189, 60–66. [Google Scholar] [CrossRef] [PubMed]
  19. Gerhardt, N.; Birkenmeier, M.; Kuballa, T.; Ohmenhaeuser, M.; Rohn, S.; Weller, P. Differentiation of the botanical origin of honeys by fast, non-targeted 1H-NMR profiling and chemometric tools as alternative authenticity screening tool. In Proceedings of the XIII International Conference on the Applications of Magnetic Resonance in Food Science, Karlsruhe, Germany, 7–10 June 2016; Guthausen, G., van Duynhoven, J.P.M., Eds.; IM Publications: Chichester, UK, 2018; pp. 33–37. [Google Scholar]
  20. Schievano, E.; Stocchero, M.; Morelato, E.; Facchin, C.; Mammi, S. An NMR-based metabolomic approach to identify the botanical origin of honey. Metabolomics 2012, 8, 679–690. [Google Scholar] [CrossRef]
  21. Beretta, G.; Caneva, E.; Regazzoni, L.; Bakhtyari, N.G.; Facino, R.M. A solid-phase extraction procedure coupled to 1H NMR, with chemometric analysis, to seek reliable markers of the botanical origin of honey. Anal. Chim. Acta 2008, 620, 176–182. [Google Scholar] [CrossRef]
  22. Boffo, E.F.; Tavares, L.A.; Tobias, A.C.; Ferreira, M.M.; Ferreira, A.G. Identification of components of Brazilian honey by 1H NMR and classification of its botanical origin by chemometric methods. LWT–J. Food Sci. Technol. 2012, 49, 55–63. [Google Scholar] [CrossRef] [Green Version]
  23. Schievano, E.; Peggion, E.; Mammi, S. 1H nuclear magnetic resonance spectra of chloroform extracts of honey for chemometric determination of its botanical origin. J. Agric. Food Chem. 2009, 58, 57–65. [Google Scholar] [CrossRef]
  24. Girelli, C.R.; Accogli, R.; Del Coco, L.; Angilè, F.; De Bellis, L.; Fanizzi, F.P. 1H-NMR-based metabolomic profiles of different sweet melon (Cucumis melo L.) Salento varieties: Analysis and comparison. Food Res. Int. 2018, 114, 81–89. [Google Scholar] [CrossRef] [PubMed]
  25. Girelli, C.R.; De Pascali, S.A.; Del Coco, L.; Fanizzi, F.P. Metabolic profile comparison of fruit juice from certified sweet cherry trees (Prunus avium L.) of Ferrovia and Giorgia cultivars: A preliminary study. Food Res. Int. 2016, 90, 281–287. [Google Scholar] [CrossRef]
  26. Girelli, C.R.; Del Coco, L.; Fanizzi, F.P. 1H NMR spectroscopy and multivariate analysis as possible tool to assess cultivars, from specific geographical areas, in EVOOs. Eur. J. Lipid Sci. Technol. 2016, 118, 1380–1388. [Google Scholar] [CrossRef]
  27. Schievano, E.; Morelato, E.; Facchin, C.; Mammi, S. Characterization of markers of botanical origin and other compounds extracted from unifloral honeys. J. Agric. Food Chem. 2013, 61, 1747–1755. [Google Scholar] [CrossRef] [PubMed]
  28. Barrasso, R.; Bonerba, E.; Savarino, A.; Ceci, E.; Bozzo, G.; Tantillo, G. Simultaneous Quantitative Detection of Six Families of Antibiotics in Honey Using A Biochip Multi-Array Technology. Vet. Sci. 2019, 6, 1. [Google Scholar] [CrossRef] [PubMed] [Green Version]
  29. Osservatorio Nazionale Miele. Available online: https://www.informamiele.it/doc-cat/produzione-miele (accessed on 27 November 2019).
  30. Anagrafe Nazionale Zootecnica–Statistiche. Available online: https://www.vetinfo.it/j6_statistiche/#/report-pbi/45 (accessed on 25 February 2020).
  31. Di Ciaula, A. Rischi derivanti dall’obbligo d’uso di pesticidi per il controllo della Xylella fastidiosa in Puglia. Available online: https://www.isde.it/rischi-derivanti-dallobbligo-duso-di-pesticidi-per-il-controllo-della-xylella-fastidiosa-in-puglia/ (accessed on 19 November 2019).
  32. Di Serio, F.; Bodino, N.; Cavalieri, V.; Demichelis, S.; Di Carolo, M.; Dongiovanni, C.; Fumarola, G.; Gilioli, G.; Guerrieri, E.; Picciotti, U. Collection of Data and Information on Biology and Control of Vectors of Xylella fastidiosa. EFSA Support Publ. 2019, 16, e0232363. [Google Scholar] [CrossRef]
  33. Goulson, D. Call to restrict neonicotinoids. Science 2018, 360, 973. [Google Scholar]
  34. Cimino, A.M.; Boyles, A.L.; Thayer, K.A.; Perry, M.J. Effects of neonicotinoid pesticide exposure on human health: a systematic review. Environ. Health Perspect. 2017, 125, 155–162. [Google Scholar] [CrossRef] [Green Version]
  35. Kurwadkar, S.; Evans, A. Neonicotinoids: Systemic Insecticides and Systematic Failure. Bull. Environ. Contam. Toxicol. 2016, 97, 745–748. [Google Scholar] [CrossRef] [Green Version]
  36. Authority, E.F.S. Conclusion on the peer review of the pesticide risk assessment for bees for the active substance imidacloprid considering all uses other than seed treatments and granules. EFSA J. 2015, 13, 4211. [Google Scholar] [CrossRef]
  37. European Commission. Commission Implementing Regulation (EU) 2018/783 of 29 May 2018 Amending Implementing Regulation (EU) No 540/2011 as Regards the Conditions of Approval of the Active Substance Imidacloprid. OJEU 2018, 61, 31–34. [Google Scholar]
  38. Dongiovanni, C.; Altamura, G.; Di Carolo, M.; Fumarola, G.; Saponari, M.; Cavalieri, V. Evaluation of efficacy of different insecticides against Philaenus spumarius L., vector of Xylella fastidiosa in olive orchards in Southern Italy, 2015–2017. Arthropod. Manag. Tests 2018, 43, tsy034. [Google Scholar] [CrossRef] [Green Version]
  39. MIPAAF. Decreto n. 4999 del 13/02/2018 Misure di Emergenza per la Prevenzione, il Controllo e L’eradicazione di Xylella Fastidiosa (Well et al.) nel Territorio della Repubblica Italiana; GU Serie Generale n.80 del 06-04-2018; Gazzetta Ufficiale della Repubblica Italiana: Roma, Italy, 2018. [Google Scholar]
  40. Karabagias, I.K.; Maia, M.; Karabagias, V.K.; Gatzias, I.; Badeka, A.V. Characterization of eucalyptus, chestnut and heather honeys from Portugal using multi-parameter analysis and chemo-calculus. Foods 2018, 7, 194. [Google Scholar] [CrossRef] [PubMed] [Green Version]
  41. Shamsudin, S.; Selamat, J.; Sanny, M.; AR, S.B.; Jambari, N.N.; Khatib, A. A Comparative Characterization of Physicochemical and Antioxidants Properties of Processed Heterotrigona itama Honey from Different Origins and Classification by Chemometrics Analysis. Molecules 2019, 24, 3898. [Google Scholar] [CrossRef] [Green Version]
  42. Kortesniemi, M.; Slupsky, C.M.; Ollikka, T.; Kauko, L.; Spevacek, A.R.; Sjövall, O.; Yang, B.; Kallio, H. NMR profiling clarifies the characterization of Finnish honeys of different botanical origins. Food Res. Int. 2016, 86, 83–92. [Google Scholar] [CrossRef] [Green Version]
  43. Berregi, I.; del Campo, G.; Caracena, R.; Miranda, J.I. Quantitative determination of formic acid in apple juices by 1H NMR spectrometry. Talanta 2007, 72, 1049–1053. [Google Scholar] [CrossRef] [PubMed]
  44. White, J.W. Composition of honey. Honey: A Comprehensive Survey, 1st ed.; Heinemann [for] the Bee Research Association: London, UK, 1975; pp. 157–206. [Google Scholar]
  45. Satta, A.; Floris, I.; Eguaras, M.; Cabras, P.; Garau, V.L.; Melis, M. Formic acid-based treatments for control of Varroa destructor in a Mediterranean area. J. Econ. Entomol. 2005, 98, 267–273. [Google Scholar] [CrossRef] [PubMed]
  46. Donarski, J.A.; Jones, S.A.; Charlton, A.J. Application of cryoprobe 1H nuclear magnetic resonance spectroscopy and multivariate analysis for the verification of Corsican honey. J. Agric. Food Chem. 2008, 56, 5451–5456. [Google Scholar] [CrossRef]
  47. Ribeiro, R.d.O.R.; Carneiro, C.d.S.; Mársico, E.T.; Cunha, F.L.; Conte Junior, C.A.; Mano, S.B. Influence of the time/temperature binomial on the hydroxymethylfurfural content of floral honeys subjected to heat treatment. Ciên. Agrotec. 2012, 36, 204–209. [Google Scholar] [CrossRef] [Green Version]
  48. Sodré, G.d.S.; Marchini, L.C.; Moreti, A.C.d.C.C.; Otsuk, I.P.; da Carvalho, C.A.L. Physico-chemical characteristics of honey produced by Apis mellifera in the Picos region, state of Piauí, Brazil. R. Bras. Zootec. 2011, 40, 1837–1843. [Google Scholar] [CrossRef] [Green Version]
  49. Turski, M.P.; Turska, M.; Paluszkiewicz, P.; Parada-Turska, J.; Oxenkrug, G.F. Kynurenic Acid in the Digestive System–-New Facts, New Challenges. IJTR 2013, 6, S12536. [Google Scholar] [CrossRef] [Green Version]
  50. Bohár, Z.; Toldi, J.; Fülöp, F.; Vécsei, L. Changing the face of kynurenines and neurotoxicity: Therapeutic considerations. Int. J. Mol. Sci. 2015, 16, 9772–9793. [Google Scholar] [CrossRef] [PubMed] [Green Version]
  51. He, Y.; Hu, D.; Lv, M.; Jin, L.; Wu, J.; Zeng, S.; Yang, S.; Song, B. Synthesis, insecticidal, and antibacterial activities of novel neonicotinoid analogs with dihydropyridine. Chem. Cent. J. 2013, 7, 76. [Google Scholar] [CrossRef] [PubMed] [Green Version]
  52. Issaq, H.J.; Veenstra, T.D. Proteomic and Metabolomic Approaches to Biomarker Discovery, 1st ed.; Academic Press: San Diego, CA, USA, 2019. [Google Scholar]
  53. Dominguez, R.Q.; Reyes-Carrillo, J.L.; de la Cruz-Larios, L.; González-Eguiarte, D.R. Bee honey color variation throughout the year in Hejotitán, Jalisco, México. SAFER 2018, 6. [Google Scholar]
  54. Czipa, N.; Borbély, M.; Győri, Z. Proline content of different honey types. Acta Aliment. 2012, 41, 26–32. [Google Scholar] [CrossRef]
  55. Manzanares, A.B.; García, Z.H.; Galdón, B.R.; Rodríguez, E.R.; Romero, C.D. Differentiation of blossom and honeydew honeys using multivariate analysis on the physicochemical parameters and sugar composition. Food Chem. 2011, 126, 664–672. [Google Scholar] [CrossRef]
  56. Bogdanov, S. Honey as nutrient and functional food. J. Am. Coll. Nutr. 2010, 27, 677–689. [Google Scholar] [CrossRef]
  57. Ruoff, K.; Luginbühl, W.; Kilchenmann, V.; Bosset, J.O.; von der Ohe, K.; Von Der Ohe, W.; Amadò, R. Authentication of the botanical origin of honey using profiles of classical measurands and discriminant analysis. Apidologie 2007, 38, 438–452. [Google Scholar] [CrossRef]
  58. Mannina, L.; Sobolev, A.P.; Viel, S. Liquid state 1H high field NMR in food analysis. Prog. Nucl. Magn. Reason. Spectrosc. 2012, 66, 1. [Google Scholar] [CrossRef]
  59. van den Berg, R.A.; Hoefsloot, H.C.; Westerhuis, J.A.; Smilde, A.K.; van der Werf, M.J. Centering, scaling, and transformations: improving the biological information content of metabolomics data. BMC Genom. 2006, 7, 142. [Google Scholar] [CrossRef] [Green Version]
  60. Jackson, J.E. A User’s Guide to Principal Components; John Wiley & Sons: Hoboken, NJ, USA, 2005; Volume 587. [Google Scholar]
  61. Kettaneh, N.; Berglund, A.; Wold, S. PCA and PLS with very large data sets. CSDA 2005, 48, 69–85. [Google Scholar] [CrossRef]
  62. Wold, S.; Eriksson, L.; Trygg, J.; Kettaneh, N. The PLS method–Partial Least Squares Projections to Latent Structures–and Its Applications in Industrial RDP (Research, Development, and Production); Unea University: Umeå, Sweden, 2004. [Google Scholar]
  63. Trygg, J.; Wold, S. Orthogonal projections to latent structures (O-PLS). J. Chemom. 2002, 16, 119–128. [Google Scholar] [CrossRef]
  64. Eriksson, L.; Byrne, T.; Johansson, E.; Trygg, J.; Vikström, C. Multi-and Megavariate Data Analysis Basic Principles and Applications, 3rd ed.; Umetrics Academy: Malmö, Sweden, 2013; Volume 1. [Google Scholar]
  65. Wheelock, Å.M.; Wheelock, C.E. Trials and tribulations of ‘omics data analysis: assessing quality of SIMCA-based multivariate models using examples from pulmonary medicine. Mol. Biosyst. 2013, 9, 2589–2596. [Google Scholar] [CrossRef] [PubMed] [Green Version]
  66. Chong, J.; Soufan, O.; Li, C.; Caraus, I.; Li, S.; Bourque, G.; Wishart, D.S.; Xia, J. MetaboAnalyst 4.0: Towards more transparent and integrative metabolomics analysis. Nucleic. Acids. Res. 2018, 46, W486–CW494. [Google Scholar] [CrossRef] [PubMed] [Green Version]
Figure 1. Representative 1H NMR (600 MHz) spectra of Salento honey samples in aqueous solution. Expanded areas in the range of (a) (0.9–3 ppm), aliphatic region; (b) (3–6 ppm) sugars region; (c) (6–10 ppm) aromatic region. Assignment of the main metabolites is indicated.
Sustainability 12 05009 g001
Figure 2. (a) Orthogonal Partial Least Square-Disciminant Analysis (OPLS–DA) t[1]/t[2] scores plot (t[1]/t[2] contribute: R2X = 0.793; R2Y = 0.98; Q2 = 0.97) for light and dark honey samples. (b). Loading scatter plot for the model coloured according to the correlation-scaled coefficient (* p(corr) ≥ |0.5|). The colour bar associated with the plot indicates the correlation of the metabolites discriminating among classes.
Sustainability 12 05009 g002
Figure 3. OPLS–DA t[1]/t[2] scores plot (t[1]/t[2] contribute: R2X = 0.793; R2Y = 0.98; Q2 = 0.97) for light and dark honey samples. Sample symbols are coloured according to different Producers.
Sustainability 12 05009 g003
Figure 4. (a) PLS–DA t[1]/t[2] scores plot (t[1]/t[2] contribute: R2X = 0.726; R2Y = 0.631; Q2 = 0.543) for light honey samples from different producers (black triangles, Producer A; red five-point stars, Producer B; grey circles, Producer C; blue five-point stars, Producer D. (b). Loading scatter plot for the model coloured according to the correlation-scaled coefficient (*p(corr) ≥ |0.5|). The colour bar associated with the plot indicates the correlation of the metabolites that discriminated different classes. w*c[1] and w*c[2] axes represented the weighted correlation vectors.
Sustainability 12 05009 g004
Figure 5. (a) PLS–DA t[1]/t[2] scores plot (t[1]/t[2] contribute: R2X= 0.705; R2Y= 0.603; Q2= 0.459) for dark honey samples from different producers (black triangles, Producer A; red five-point stars, Producer B; grey circles, Producer C; blue five-point stars, Producer D. (b) Loading scatter plot for the model coloured according to the correlation-scaled coefficient (*p(corr) ≥ |0.5|). The colour bar associated with the plot indicates the correlation of the metabolites that discriminated the classes. w*c[1] and w*c[2] axes represented the weighted correlation vectors.
Sustainability 12 05009 g005
Figure 6. (a) PLS–DA t[1]/t[2] scores plot (t[1]/t[2] contribute: R2X= 0.572; R2Y= 0.6; Q2= 0.461) for light honey samples from different producers (black triangles, Producer A; red five-point stars, Producer B; grey circles, Producer C, blue five-point stars, Producer D). (b) Loading scatter plot for the model coloured according to the correlation-scaled coefficient (* p(corr)≥|0.5|). The colour bar associated with the plot indicates the correlation of the metabolites that discriminated the classes. w*c[1] and w*c[2] axes represented the weighted correlation vectors.
Sustainability 12 05009 g006
Figure 7. (a) PLS–DA t[1]/t[2] scores plot (t[1]/t[2] contribute: R2X= 0.715; R2Y= 0.543; Q2= 0.384) for dark honey samples from different producers (black triangles, Producer A; red five-point stars, Producer B; grey circles, Producer C, blue five-point stars, Producer D. (b) Loading scatter plot for the model coloured according to the correlation-scaled coefficient (*p(corr) ≥ |0.5|). The colour bar associated with the plot indicates the correlation of the metabolites that discriminated the classes. w*c[1] and w*c[2] axes represented the weighted correlation vectors.
Sustainability 12 05009 g007
Table 1. Chemical Shifts (δ) and assignment of metabolite resonances in the 1H NMR (600 MHz) of honey samples.
δ (ppm) Metabolite Assignment Multiplicity
9.45HMFH1s
9.13; 8.84trigonellineN−CH; CH−3.5s; t
8.42−8.46 *formateHCOOHs
7.90; 5.90 uridine
8.22, 7.86, 7.55, 6.94 kynurenic acid (only in dark honey samples) d, d, d, s
7.42; 7.38; 7.32phenylalanineCH–3,5 ring; CH4 ring; CH–2,6 ring; m; m; m;
7.28, 6.18nucleoside derivatives
7.19; 6.90tyrosineCH–2,6 ring; CH–3,5 ring;m; m;
5.41; 3.56sucroseCH1; CH2d; dd;
5.40 maltose
5.30; 3.58turanoseCH1
5.23; 3.52α-glucose CH1; CH2d; dd;
4.99raffinose
4.94isomaltose
4.64; 3.24β-glucoseCH1; CH2d; dd;
4.10α/β- fructofuranoseCH3d;
4.01β- fructopyranoseCH5d;
3.12lysineγ−CH2 t
2.70; 2.90 citrate Half−CH2; half−CH2d; d
2.55; 2.80 aspartatehalf β−CH2; half β−CH2; γ −dd; dd
2.56succinateα−β - CH2 s
2.34; 2.07; 2.01prolinehalf β −CH2; half β-CH2; γ−CH2m; m; m;
1.95acetateα−CH3 s
1.47alanineβ−CH3 d
1.38monoterpenoid acid
(only in polyfloral honeys)
-C(CH3)2OH;s
1.32lactateβ−CH3 d
1.17ethanolCH3 t
1.03; 2.28valineγ−CH3; β−CHd; m;
1.00isoleucineγ-CH3; d
0.97; 1.7leucineδ-CH3; γ-CHd; m;
* [12,43].
Table 2. Quantitative comparison of light and dark honey discriminant metabolites.
MetaboliteChemical Shift (ppm)F Value 1P-Value 2FDR 3Tukey’s HSD 4
Light honeys
Proline2.34100.383.1531 × e−121.4709 × e−11C–A; D–A;C–B; D–B; D–C;
monoterpenoid acid1.3797.3444.2025 × e−121.4709 × e−11C–A; C–B; D–C;
Lactate1.3437.0962.3111 × e−85.3937 × e−8C–A;D–A; C–B;D–B;
Ethanol1.1716.1661.4282 × e−52.4993 × e−4B–A; C–A; D–B; D–C;
Phenylalanine7.426.85382.3633 × e−33.3087 × e−3C–B; D–B;
Lysine2.903.58993.1792 × e−23.7091 × e−2B–A
Dark honeys
Formate8.453239.51.2559 × e−127.937 × e−12B-A; C–A; D–A; B–C; B–D;
monoterpenoid acid 1.372811.21.9843 × e−127.937 × e−12B–A; C–A; C–B; B–D; C–D;
Proline2.34172.711.3075 × e−73.4866 × e−7C–A; C–B; C–D;
Lactate1.3496.2241.2871 × e−62.5742 × e−6A–B; A–C; D–A; C–B; D–B; D–C;
Phenylalanine7.4264.3396.0743 × e−69.7188 × e−6A–C; A–D; B–C; B–D; D–C;
Nucleoside Derivatives6.1857.13895529 2 × e−61.2737 × e−5B–A; C–A; C–B; C–D;
Succinate2.544.31874.3517 × e24.4375 × e−2D–B; D–C;
KYNA6.944.28274.4375 × e24.4375 × e−2B–A; C–A; B–D;
1 F value = Variance of the group means (Mean Square Between)/mean of the within group variances (Mean Squared Error);2 Statistical significance was set at p-value < 0.05 with the 95% confidence level;3 False Discovery Rate (FDR); 4 Tukey’s Honestly Significant Difference (HSD) post hoc test. Adjusted p-value (FDR) cutoff: 0.05.
Table 3. Origin declaration and detailed description of honey samples.
SampleProducersDescription ColourArea Production
1Asummer polyfloraldarkUgento (Lecce Province)
2Aspring polyflorallightUgento (Lecce Province)
3 1BpolyfloraldarkTaranto Province
4 1BpolyfloraldarkTaranto Province
5BpolyflorallightTrepuzzi (Lecce Province)
6Bmonofloral (orange)lightTaranto Province
7Cspring polyflorallightCopertino (Lecce Province)
8Csummer honeydewdarkCopertino (Lecce Province)
9Cspring polyflorallightNardò Copertino (Lecce Province)
10Dmonofloral (acacia)lightSurbo (Lecce Province)
11DpolyflorallightSurbo (Lecce Province)
12DhoneydewdarkSurbo (Lecce Province)
13Bmonofloral (citrus)lightTrepuzzi (Lecce Province)
1. Although with a similar description supplied by the producer, these samples refer to different production batches.

