1. Introduction
Sustainability is important for many reasons, including the quality of transport and the environment. To have a healthy community, we need clean air, sustainable transportation, and a non-toxic environment. Sustainable transport is a major transport facility that is sustainable in terms of social, environmental, and climate impacts. Sustainability of transport is measured by the efficiency and effectiveness of the transport system, as well as the impact of the system on the environment and climate. Sustainability is crucial for the transport of dangerous goods as it seeks to protect our natural environment, as well as human and ecological health without compromising our way of life.
Every day, thousands of tons of dangerous goods travel on the roads of all countries. In order for the cargo to reach its stated destination safely, the relevant rules for such specific cargo must be followed. The transport of dangerous goods causes accidents, since dangerous goods are a much higher risk than ordinary goods.
Dangerous goods are substances or products which by their chemical or physical properties are liable to endanger human health, the environment or property and are included in the list established by the United Nations Committee of Experts and approved by the European Economic Commission and listed in the international agreements governing the transport of dangerous goods [
1,
2]. The classes of dangerous goods according to ADR [
3] are the following:
Class 1: explosive substances and articles
Class 2: gases
Class 3: flammable liquids
Class 4.1: flammable solids, self-reactive substances, polymerizing substances, and solid desensitized explosives
Class 4.2: substances liable to spontaneous combustion
Class 4.3: substances which, in contact with water, emit flammable gases
Class 5.1: oxidizing substances
Class 5.2: organic peroxides
Class 6.1: toxic substances
Class 6.2: infectious substances
Class 7: radioactive material
Class 8: corrosive substances
Class 9: miscellaneous dangerous substances and articles [
3].
Ghazinoory and Kheirkhah claim that dangerous goods are constantly being transported among all countries. Such transportation is very dangerous as it can cause irreparable damage to the environment and people in the event of an accident [
4].
Many authors have analyzed the transport of dangerous goods [
5,
6,
7,
8,
9], but there are insufficient accounts of the factors affecting the safe transport of dangerous goods by road.
The consequences of accidents involving the transport of dangerous goods are much greater and cause significant damage not only to nature but also to the surrounding infrastructure. In most cases, accidents occur in the field of road freight transport, as it is the most popular and convenient mode of freight transport. According to some scientists [
10,
11,
12,
13], the danger of the consequences of an accident in the transport of dangerous goods is many times greater than that of accidents involving the transport of non-dangerous goods.
According to Odincov and other authors [
14], hazardous materials include any substance, industrial or other waste, which due to its intrinsic properties may endanger human life and health as well as harm the environment. According to the nature of the cargo, dangerous goods are divided into packaged, bulk, and liquid.
Scientists from Lithuania [
15] state that the number of road accidents is still very high, although the number of deaths in European countries is decreasing. Road accidents associated with injury, the destruction of economic resources, reduce the productivity of the economy accordingly. Costs resulting from accidents are the largest proportion of total traffic costs. The economic evaluation of road safety measures using cost–benefit analysis shall be based on the costs of road accidents. Avoiding or at least reducing such costs is economically beneficial to the state.
Other scientists [
16] argue that when road transport of dangerous goods is dangerous, road accidents are risk-based. The Chakrabarti and Parikh [
16] base their calculations on the likelihood of a traffic accident and a thorough analysis of its consequences. They state that risk assessment of hazardous substances depends on three factors—the number of accidents, day-to-day traffic volume, and population density—along route lengths.
According to Diernhofer and colleauges [
17] and Ellis [
18], the majority of accidents involving the transport of dangerous goods are not due to the properties of the dangerous substances, but to mistakes made by people in the production and transport processes.
The causes of an accident can be many, but most often are caused by human fault [
19]. Therefore, in order for dangerous goods to be completely safe throughout their transport, the human factor, which is the most common cause of an accident, must be taken into account before the transport. This is the level of qualification of the shipper and the carrier.
According to Lisenkov [
19], human factor errors usually occur for the following reasons:
errors in the selection of staff;
poor quality training of staff;
lack of competence of staff.
Šolc [
6] states in his article that millions of goods transported have an impact on the quality and safety of our environment, which is why the responsibility for the care and preservation of the environment rests with people and various organizations working for the environment.
Scientific articles can be found on the factors that usually determine the likelihood of accidents [
20,
21,
22,
23,
24]. The safety of the transported cargo depends not only on the people who prepare it for transportation, but also on the actions of the driver in the event of an accident and his/her own skills. Engaging in secondary matters, choosing the wrong speed during poor visibility or slippery surfaces, and maintaining the technical condition of the vehicle also determine the cause of the accident. Lundin states that in order to balance the safety aspects of the transport of dangerous goods, special routes adapted to the transport of such specific goods are selected and planned [
25].
Zhao et al. [
26] studied the safety of the transport of dangerous goods by air. They argued that safety is directly linked to human health and environmental pollution.
Road safety is a major concern throughout Europe due to the human and socio-economic costs of work-related accidents. Spanish researchers Gamero, Silla, Sainz-González, and Sora [
27] have taken a socio-technical approach and examined the relationship between many organizational factors (organizational learning and training) and road accidents.
Meanwhile, Sun, Jia, Qin, Yang, and Zhang [
28] proposed a weight optimization approach to improve rail safety assessment. They used a branch-constrained algorithm, which is an algorithm for solving a quadratic programming model. The efficiency and safety of international rail freight has also been examined by Loprencipe et al. [
29], who proposed a definition of an innovative methodology for inspecting tunnel structures, checking free space conditions, and designing modernization works.
Ren and colleagues [
30] examined the causes of deaths due to accidents involving the transport of dangerous goods by land (rail and road) and found a relationship between cumulative frequency and deaths in a different vehicle, in a different country, and at different times. This study provided insights into the evolution of the severity of accidents with the development of the social economy and safety requirements.
An important factor in planning the safe transport of dangerous goods by road is the selection of the optimal route. Chai et al. [
31] proposed a risk capital assessment scheme that attempts to measure differences in risk between populated areas. This risk-sharing ownership model aims to reduce the risk gap between populated areas by adjusting the frequency of portions of the transport route of hazardous materials. Assael et al. [
32] attempted to model the transport of hazardous materials by tankers carrying liquefied natural gas or liquefied petroleum gas to the pipeline, as they may ignite and explode during the carriage of such materials.
The aim of the article is to determine the accident risk factors in the transport of dangerous goods by road, and to calculate and present the most important factors influencing the accident during the transport of dangerous goods using the Kendall ratings correlation method and the medium-range transformation weights (ARTIW) method.
2. Problem Analysis
According to statistics [
33], most accidents involving dangerous goods occur during the transport of petroleum products, as oil is one of the most frequently transported hazardous substances as well as the most common environmental pollutant, and its loading and transportation processes must be given close attention.
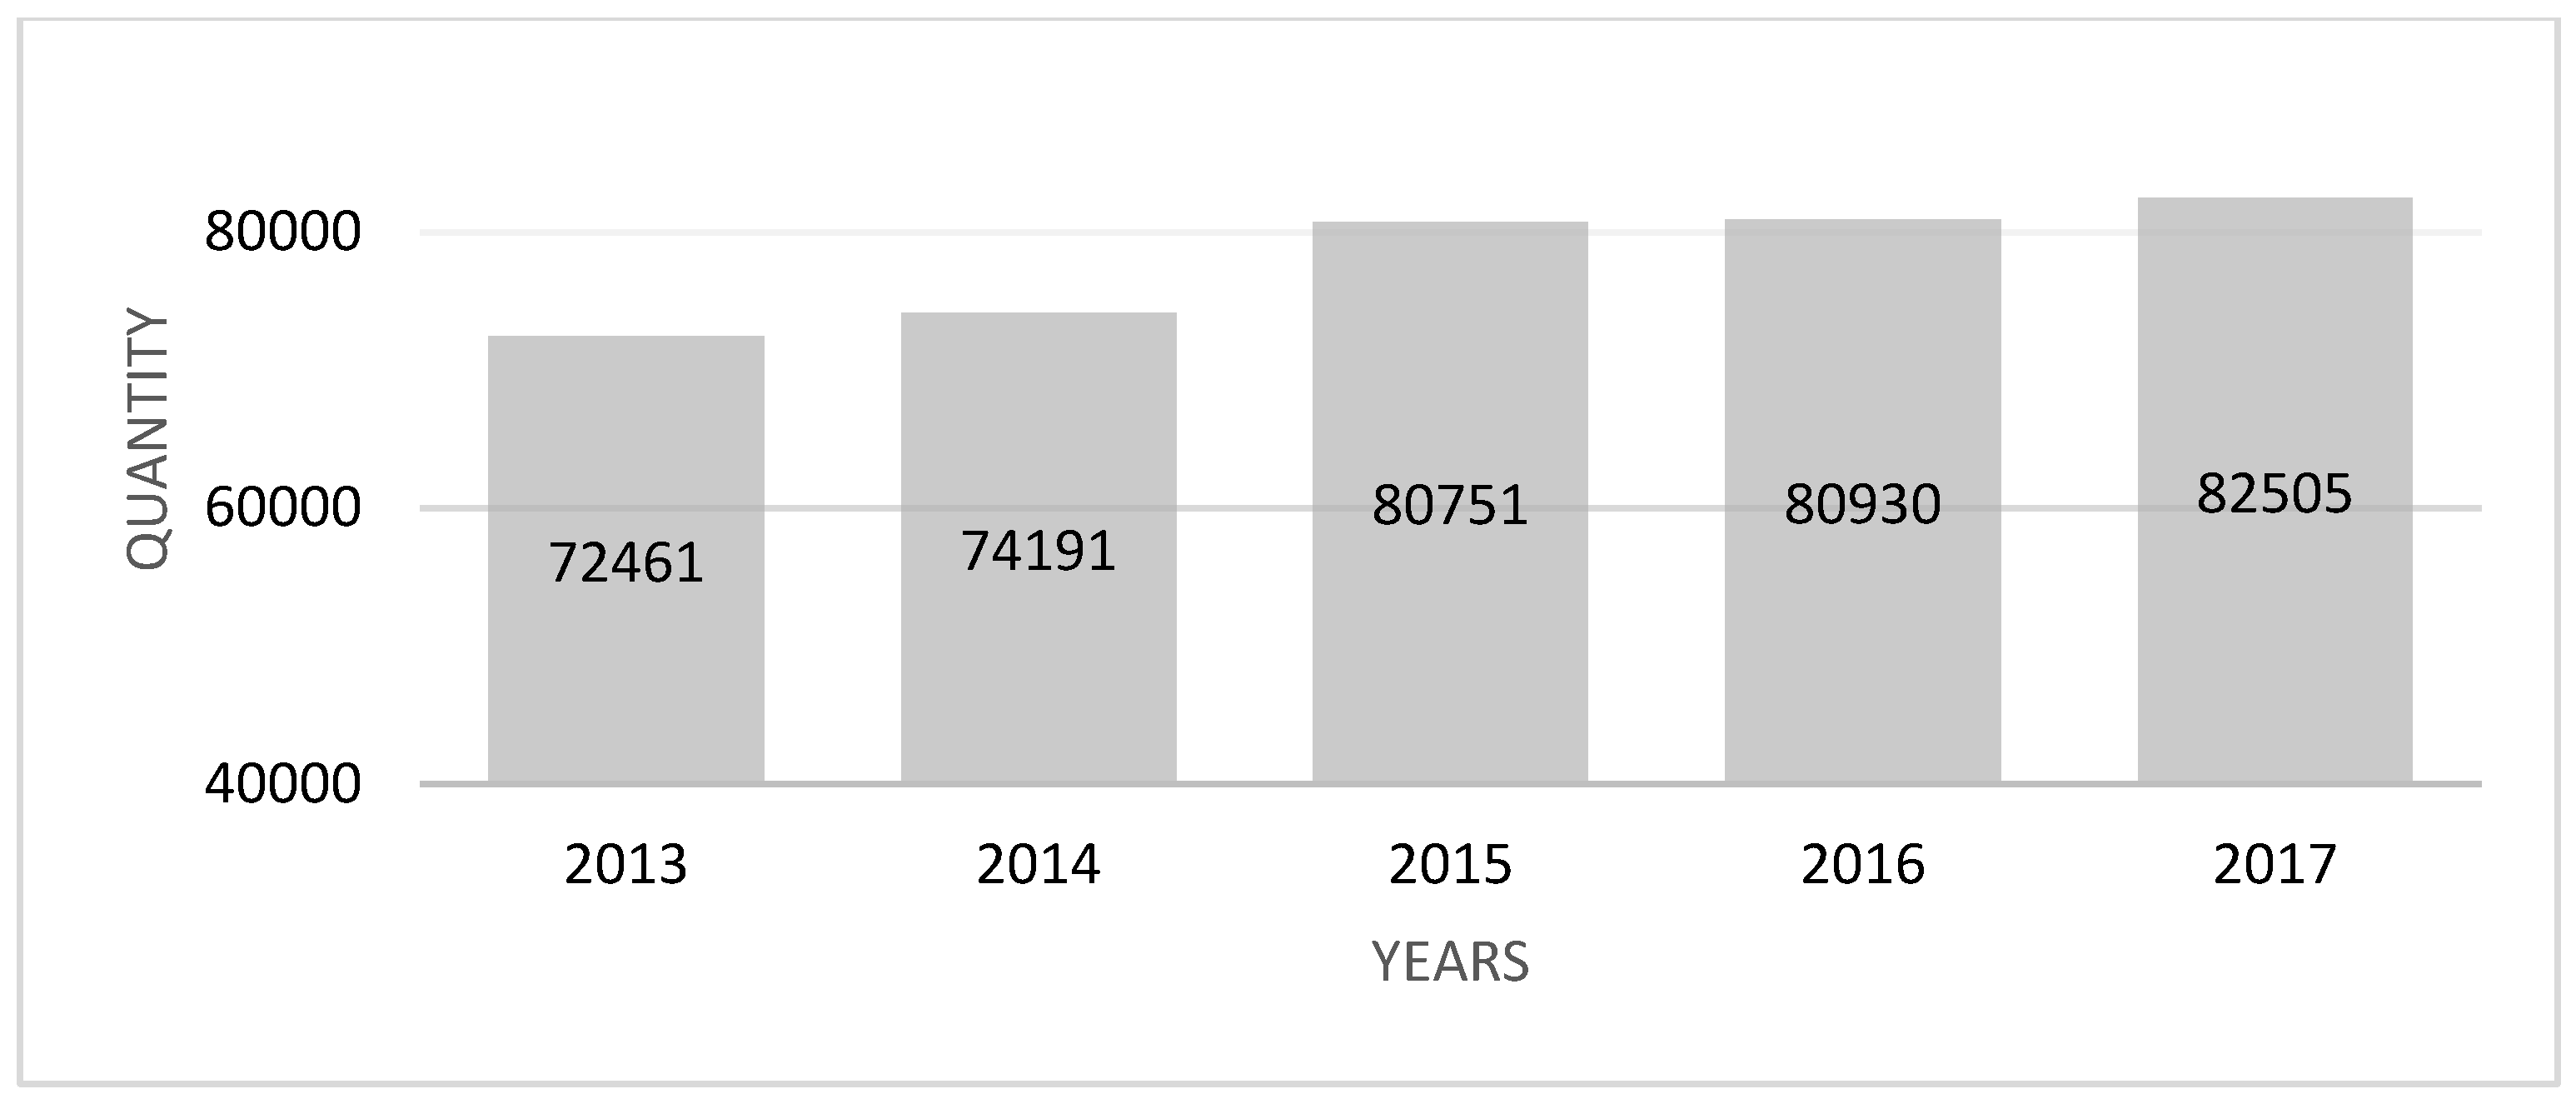
Figure 1 shows the quantities of dangerous goods transported by road in the European Union from 2013–2017. Data are presented in thousands of tons.
Based on Eurostat’s 2013–2017 data on the volume of dangerous goods transported by road in the European Union, it can be stated that between 2013 and 2017 the volume of dangerous goods increased annually. Most of the dangerous goods transported are Classes 2 and 3. The volume of dangerous goods transported by road is high, with an average of around 10,000 million ton-kilometers transported by road over these five years.
Figure 2 shows the types of dangerous goods in EU-28 road freight transport in 2017. The largest specific product group was flammable liquids, taking over more than half of the total (53.4%). Two other groups, gases (compressed, liquefied or dissolved under pressure) and corrosives, accounted for 12.9% and 11.8% respectively. There were very small changes compared to previous years; the distribution between product groups remained quite similar over time.
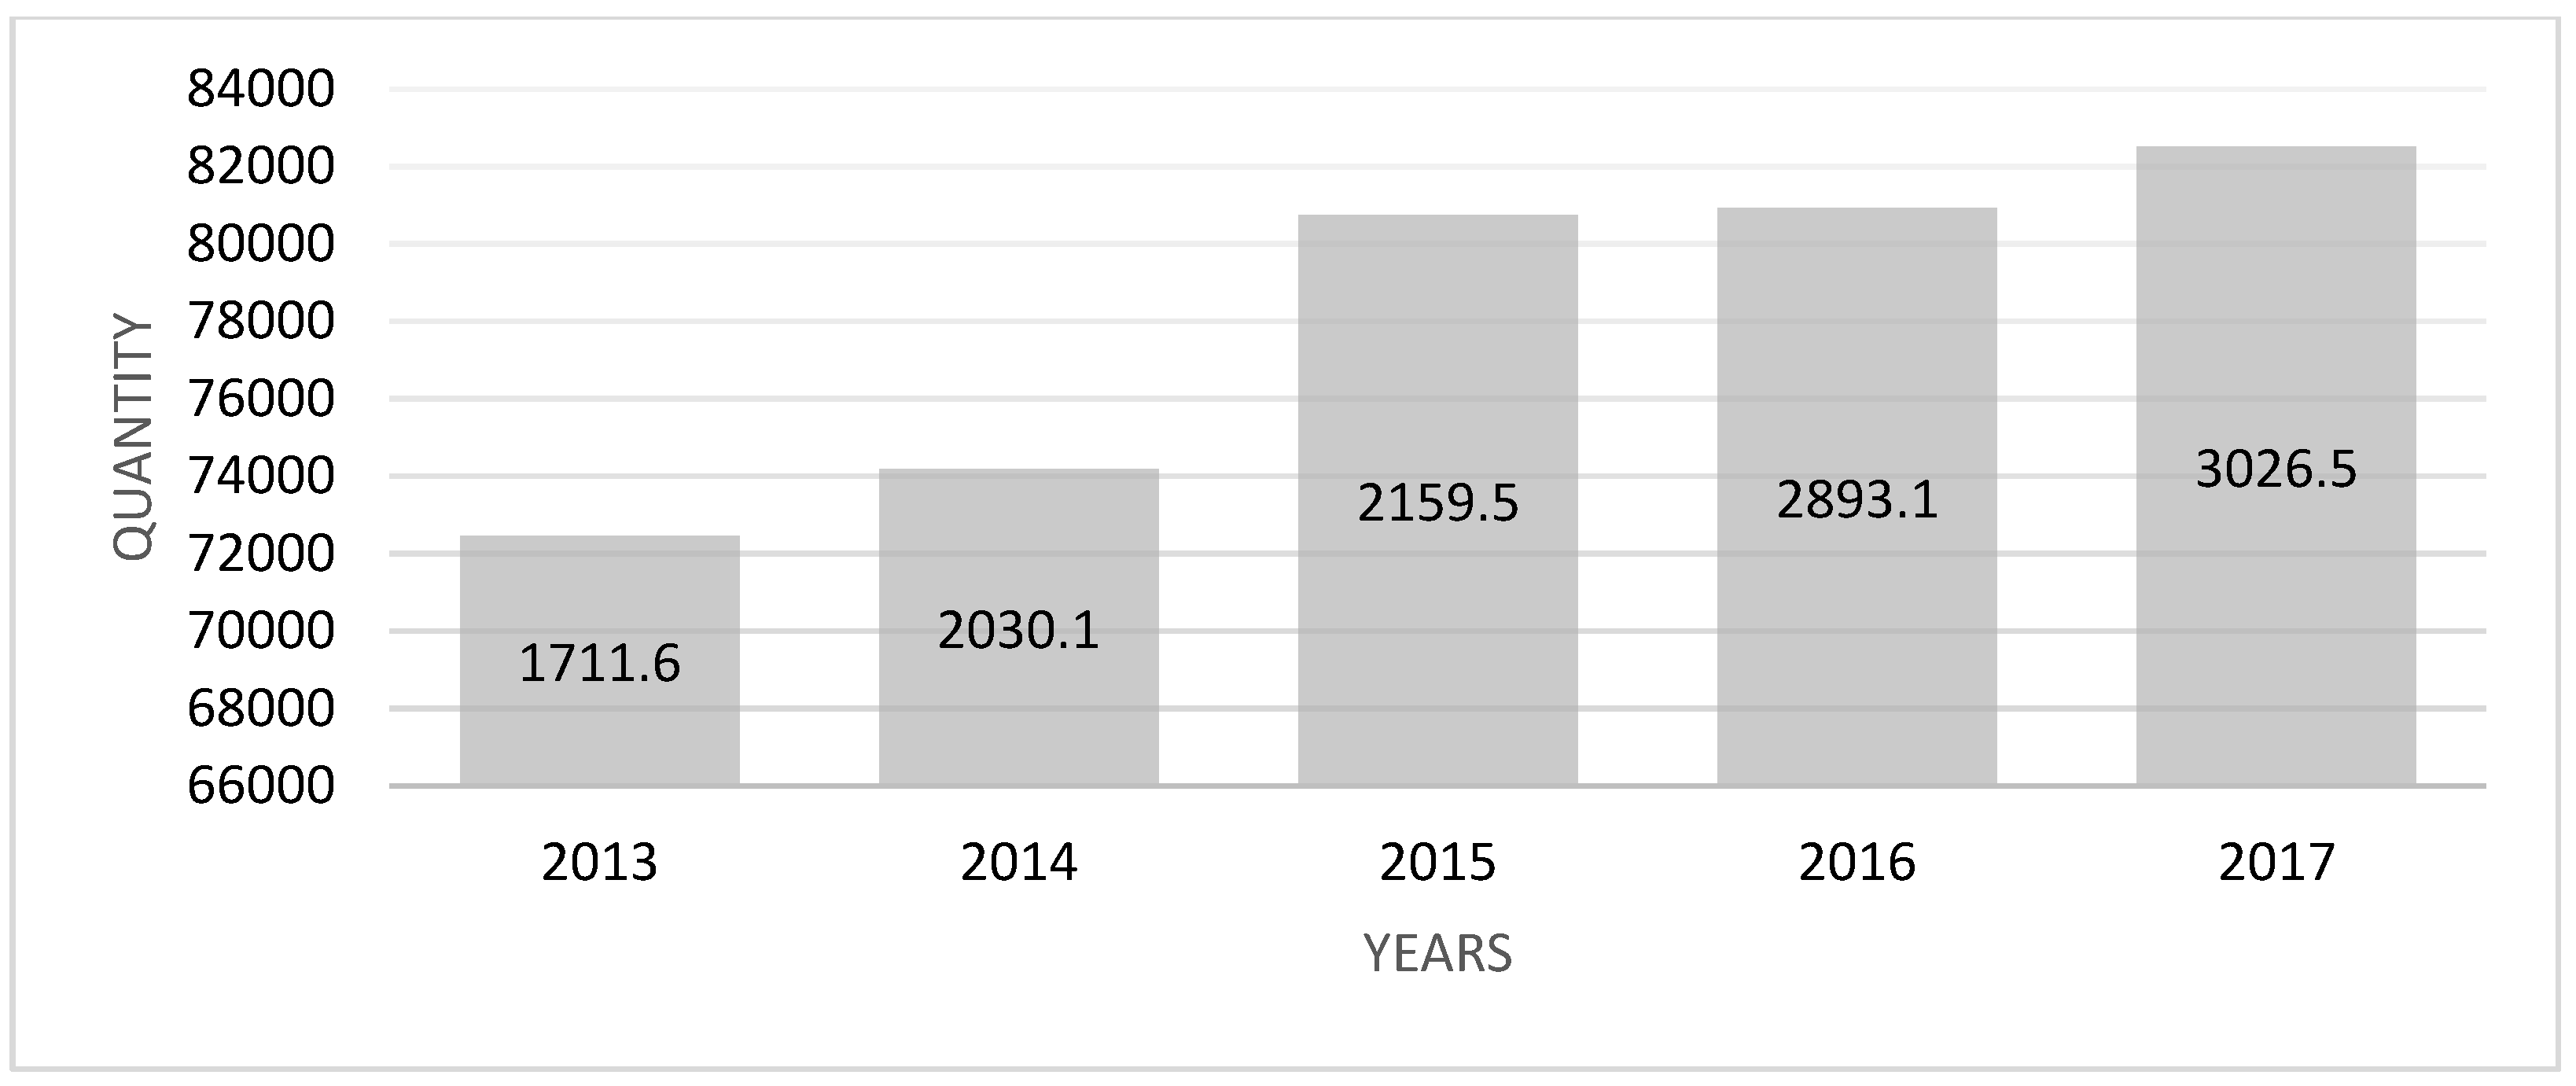
According to the data of the Lithuanian Department of Statistics on the volumes of transport of dangerous goods by road in Lithuania [
34], it can be stated that from 2013 to 2017, the volumes of transport of dangerous goods by road increased every year (
Figure 3). During the five years analyzed, the volumes of dangerous goods almost doubled, from 1711.6 thousand tons to 3026.5 thousand tons.
The types of dangerous goods transported in Lithuania are very similar to those in the European Union.
Figure 4 shows the visible number of dangerous goods accidents in the European Union, obtained from the Eurostat Statistics website. The graph below shows that the number of accidents involving dangerous goods is quite high. Between 2010 and 2015, the number of accidents ranged from 30 to 61, during which cargo was spilled or had some negative impact on the environment. In conclusion, it should be noted that these figures do not include accidents with no consequences; thus, if we analyzed all the incidents, the final figure would be quite large.
Every day, the flow of dangerous goods is enormous in every country. Examination of statistical databases shows that cargo volumes are increasing every year, as well as the probability of accident risk. The number of accidents is not high, perhaps because not all figures are officially published, but only those whose consequences were sadder.
Safe transport of dangerous goods is an important challenge for both domestic and international freight. This article deals with the most important factors that influence the occurrence of accidents in the transport of dangerous goods by road in the territory of the Republic of Lithuania. Qualitative research has identified the factors that most often influence accidents.
Dangerous goods must be transported in accordance with precautionary and safety regulations to ensure maximum cargo safety and to minimize the risk of accident.
3. Materials and Methods
In the summer of 2019, a qualitative study was conducted in Lithuania. The expert survey was conducted according to the following principles:
The experts were selected to be sufficiently competent to answer the questions;
The experts consented to participate in the survey;
The researcher had no influence over the experts.
The problem of expert selection is highlighted in the scientific literature [
35]. Statistically, the more experts interviewed, the more accurate the results. Depending on the purpose and circumstances of the study, in extreme cases there may even be one or two experts observing the same phenomenon, and their decisions are then statistically compared, and results obtained.
In this study, 10 expert opinions were selected. It was very important to find suitable experts for the research in all the analyzed companies. The determination of the acceptable number of experts was based on the methodological assumptions formulated in the theory of classical tests, which state that the reliability of generalized decisions and the number of decision makers (in this case, experts) are related by a rapidly fading nonlinear relationship.
The questionnaires were distributed by e-mail to 96 transport companies and, where possible, we met with the employees of the companies. The expert opinions of the 10 companies that carry most of the dangerous goods and which have had accidents involving dangerous goods were selected. A questionnaire survey was selected for the study by experts working in the companies who organize the transport of dangerous goods.
A total of 96 companies was selected from almost 1000 companies that transport dangerous goods on international and domestic routes. It was initially clarified how many times a year road-haulers transport dangerous goods. From the 96 analyzed companies, companies that transport dangerous goods 81 times or more per year were selected. Other companies that transport dangerous goods less than 80 times a year were rejected. The selected companies use the services of a safety specialist who helps to organize the transportation of these cargoes properly and takes care of loading, transportation, and provision of vehicle safety equipment.
Employees with at least 3 to 12 years of experience in transport companies, which are mainly engaged in the transport of dangerous goods, were selected for the study.
The aim of the study was to identify the factors that have the greatest impact on the occurrence of an accident, to identify the difficulties faced by road haulers transporting dangerous goods by road, and to select key factors to stop the potential risk of an accident.
Three groups of factors were distinguished:
Group I: factors affecting the occurrence of an accident involving the transport of dangerous goods by road.
Group II: technical/technological factors to be considered before the transport of dangerous goods by road.
Group III: organizational factors to be considered before the transport of dangerous goods by road.
The factors of these three groups were selected and presented in
Table 1.
During the qualitative survey, the experts were provided with a questionnaire and asked to assess the factors influencing the accident during the transport of dangerous goods by road. Two methods were used to calculate the results: Kendall ratings correlation method and the medium-range transformation weights (ARTIW) method.
The Kendall ratings correlation method is superior to other multifunctional decision-making methods because it is flexible and convenient. Decision makers can check the consistency of opinions.
The ARTIW method makes it possible to identify the weight (importance) of indicators at one level of the hierarchy with a higher level or hierarchically unstructured indicator weights. This method is quite convenient because it is easy to calculate and compare indicators all at once. Comparing indicators is not a complicated process as it simply shows the extent to which one indicator has more weight than another. In addition, the method under consideration allows the expert to turn a qualitative assessment of indicators into a quantitative one.
These methods are used for the first time in the calculation of the most important factors for dangerous goods.
According to the answers provided, the distribution and agreement of opinions can be estimated. The Kendall ratings correlation method was estimated to serve this purpose [
36]. The values in the concordance coefficient (W) are in the range of 0 to 1. The higher the value obtained (W), the less the opinions differ regarding the question under analysis. The higher the W, the stronger the correlation of the variables. When all of the ranks coincide, thus W = 1.
Kendall’s concordance coefficient is based on the sum of the ranks assigned by
n experts to each
j-th criterion
Rj:
More exactly, it is based on sum
S of the squared deviations
Rj (the variance analogue) from the mean rank
:
The average criterion rank
is obtained by dividing the sum of ranks, assigned to the criterion by the experts, by the number of the criteria,
m:
where
Rij is the rank assigned by
i-th expert to
j-th criterion;
n is the number of experts (
i = 1, 2, …,
n);
m is the number of the criteria (
j = 1, 2, …,
m).
If
S is a real sum of the square value calculated by Equation (2), the concordance coefficient
W is described (when there are no related ranks) by the ratio of the calculated
S value:
When the estimates of the experts are in agreement, the value of the concordance coefficient W is about one, but if these estimates differ to a great extent, the value of W is about zero.
The sum of the squared deviations of ranks
Rij of each criterion from the mean rank can be calculated as follows:
where
m is the number of criteria (
j = 1, 2, …,
m);
n is the number of the experts (
i = 1, 2, …,
n).
The value of the random number S is calculated by adding together the squared values given to all the criteria, which are enclosed in square brackets (Equation (5)).
The concordance coefficient W can be used in practice if its limiting value, showing the condition when expert estimates may be considered consistent, is determined.
Kendall and Gibbons [
37] proved that when the number of the criteria is
m > 7 the significance of the concordance coefficient
W can be determined by using Pearson’s criteria (Chi-squared test).
The random value is distributed according to
:
with the degree of freedom
ν =
m − 1. Based on the selected confidence level
α (which is assumed to be 0.05 or 0.01), the critical value
is found from the table of
distribution with the degree of freedom
ν =
m − 1. If the value of
calculated by Equation (6) is larger than
, it shows that the experts’ estimates are consistent.
The smallest value of the concordance coefficient
Wmin can be estimated by applying Equation (7):
where
n is expert opinions;
m is the number of comparative criteria that indicates the quality of an object under analysis with the selected levels of significance α and degree of freedom
ν =
m − 1.
Having calculated this value, it is thus not possible to assert that expert opinions are in agreement;
is the critical Pearson‘s statistics when the degree of freedom and significance level are taken [
38].
When the quality of an object is assessed and can be described by a single value and compared with the quality of other similar objects, the normalized criterion weight
should be used. The significances (weight) of the criteria can be defined by ARTIW method [
39] by which the relative importance of all 10 factors is defined. For that, Equation (8) is applied:
where
m is the number of criteria showing importance of synchronization;
is the average rank of
j-th criterion calculated according to Equation (9):
where
Rij is the rank of the criteria granted by the experts;
n is the number of experts.
The ARTIW method was first presented in 2011 by Sivilevičius [
40]. The significances (weights) of the criteria describing the quality of an object are determined by experts, who normalize them (i.e., equate their sum to one) and use the method of overage rank transformation into weight.
4. Results and Discussion
4.1. Calculation of Expert Survey Results of Group I Factors
In order to select the factors that have the greatest impact on the safe transport of dangerous goods, experts were asked to evaluate the criteria in a ten-point system. The answers received from ten experts are tabulated and the ten factor ratings given by each expert are summed up.
Research data were processed by Kendall ratings correlation method and the ARTIW method.
Expert assessments are translated into
Rij grades according to Equation (1). For the first respondent
E1, the first factor A is given a rating of 9, which is converted into a grade of 2. All expert ratings are converted into grades and listed in
Table 2.
The data of the calculated results of each criterion of Group I is indicated in
Table 2.
The ranks of the importance of each factor of Group I—factors that have the greatest impact on accident occurrence—which were assigned by the experts, were used calculating the average ranks, the concordance coefficient W, Pearson’s criteria (Chi-squared test) χ2, and the normalized criterion weight ωj. All calculations were made according to the equations given above.
In order to ensure that the opinions of the experts were not contradictory, the compliance factor
W was calculated according to Equation (4):
The resulting figure is greater than the 0.5 value, suggesting that respondents’ views are in agreement.
Since the number of Group I factors is greater (
m > 7), the significance of the concordance coefficient is determined by using the
criterion, to which the random variable is estimated according Equation (6):
As the value calculated for χ2 is 72.56 higher than the critical value (equals 20.092), the expert opinion is considered to be in agreement, while the average grades are consensus.
The lowest value of the concordance coefficient
is obtained according to Equation (7):
The value is substantially lower than 0.539. Thus, it is possible to claim that judgements of all 10 experts are in agreement.
The size of the indicator
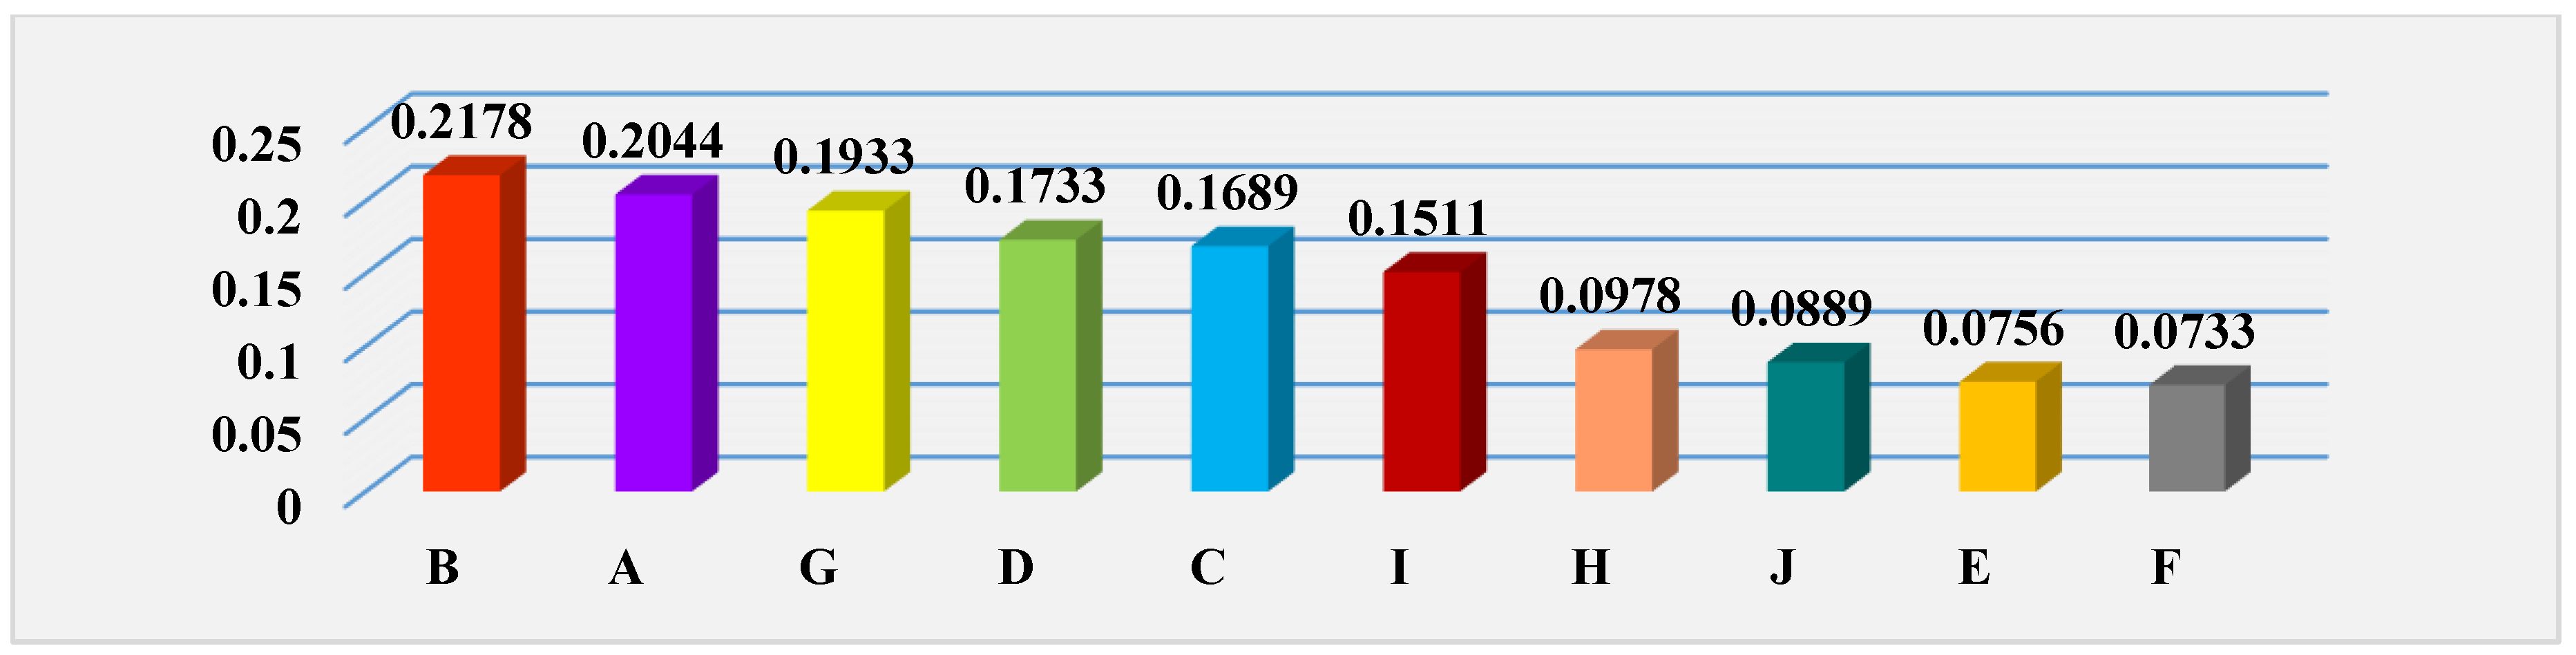
calculated by Equation (8) can be used to determine which factor is more important than the other. The weights of importance of Group I for all 10 factors (A, B, C, …, J) are presented in
Table 3, and rankings of the importance of coefficients by criteria weights are shown in
Figure 5.
The distribution of each factor over another is presented in
Figure 5.
The most important factors of Group I which have the greatest influence on the occurrence of accidents in the transport of dangerous goods by road are: B-incorrect loading of cargo, A-driver fatigue, G-vehicle condition, and D-weather and road surface conditions. Those that are less important include: C-lack of driver knowledge and I-secondary occupation of driver. The factors with the least impact are: H-driver confidence in vehicle security systems, J-time of day, E-route planning, and F-delivery speed.
4.2. Calculation of Expert Survey Results of Group II Factors
Technical/technological factors (Group II) need to be assessed before transporting dangerous goods by road, based on the results of an expert survey.
The experts were asked to assess the technical/technological factors to be considered before the transport of dangerous goods by road. The answers received from the 10 experts were tabulated and the ten factor ratings given by each expert were summed up. The following Group II factors were selected:
A-ensuring security controls during cargo transportation;
B-marking of the transport vehicle;
C-tightness of vehicle semi-trailer/container/tank;
D-vehicle technical condition;
E-provision of additional safety equipment for the vehicle;
F-infrastructure of the place of loading and unloading of the cargo;
G-chemical properties of the cargo;
H-preparation of dangerous goods packaging;
I-correct loading or filling of the cargo;
J-possible transshipment/transshipment of dangerous goods.
The calculation formulas were all used in the same way as for the Group I factors.
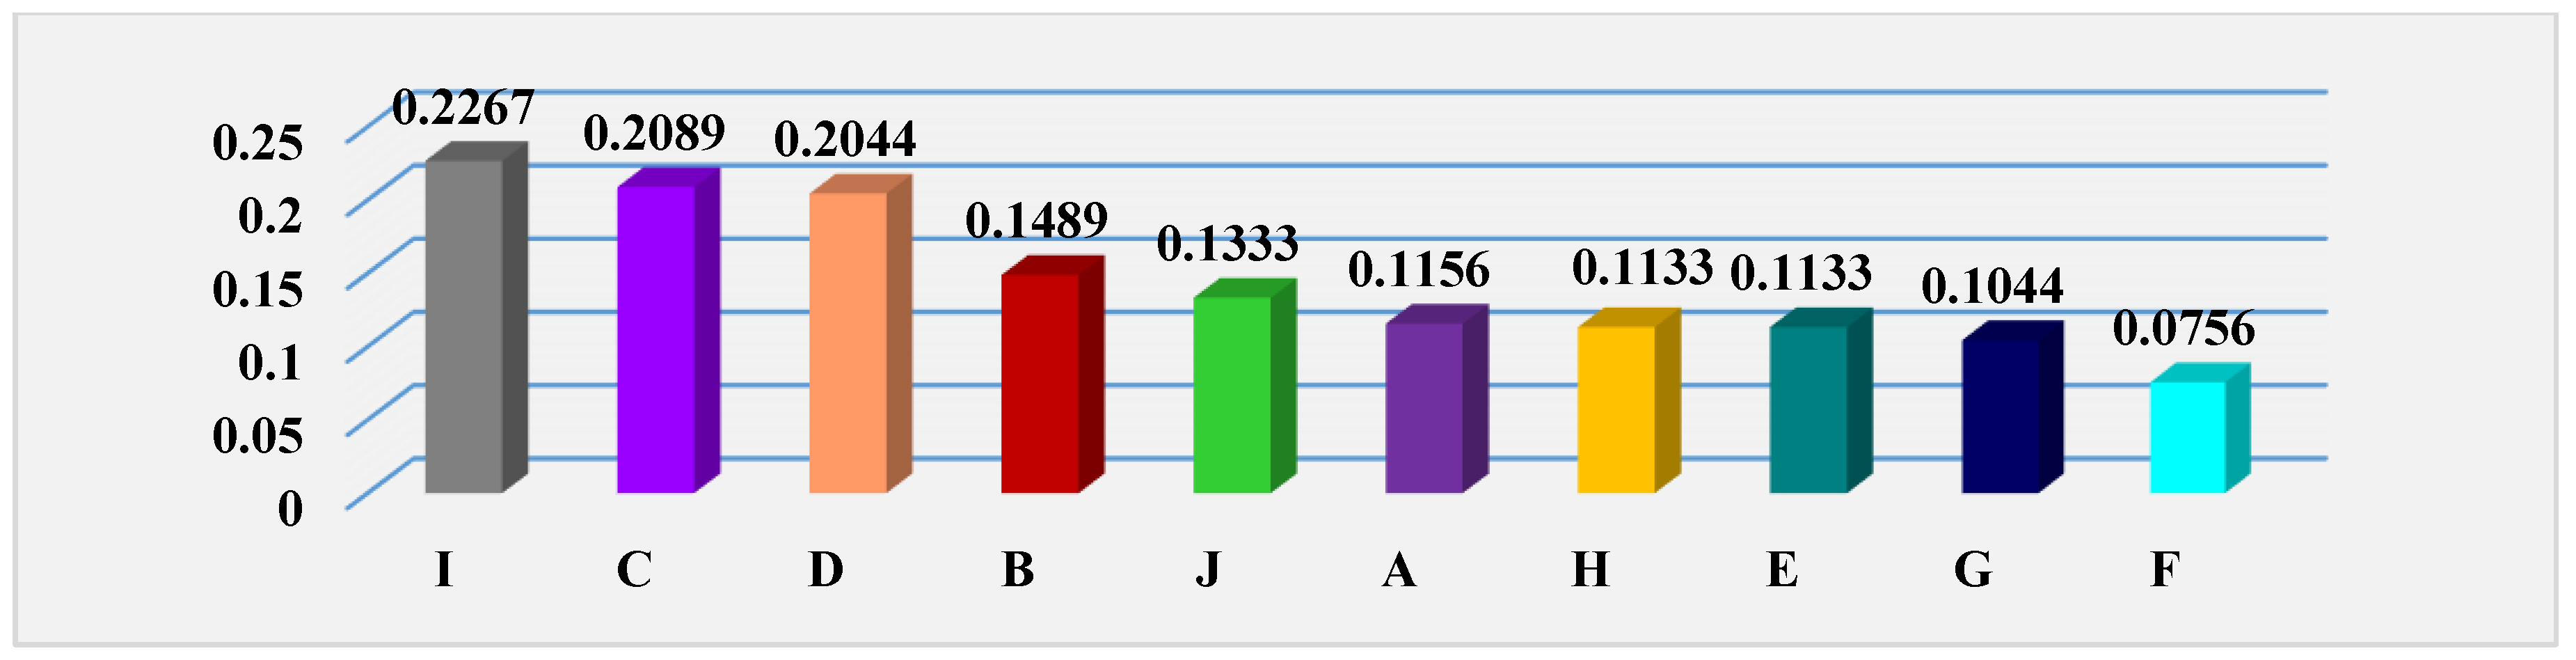
The weights of importance of all 10 factors (A, B, C, …, J) for Group II are presented in
Table 4, and rankings of the importance of coefficients by criteria weights are shown in
Figure 6.
Indicator
can be used to determine which factor is more important than the other. The distribution of each factor over another is presented in
Figure 6.
The main factors of the Group II technical/technological factors to be considered before the transport of dangerous goods by road are: I-correct loading or unloading of the load, C-tightness of the semi-trailer/container/tank vehicle, and D-technical condition of the vehicle. Those that are less important include: B-marking of the transporting vehicle, J-possible transshipment/transshipment of dangerous goods, and A-ensuring security controls during the transport of the goods. The factors with the least impact are: H-preparation of dangerous goods packaging, E-provision of additional safety equipment for the vehicle, G-chemical properties of the cargo, and F-infrastructure of the loading and unloading site.
4.3. Calculation of Expert Survey Results of Group III Factors
The following is a calculation of the results of the expert survey on Group III organizational factors to be assessed before transporting dangerous goods by road.
The following Group III factors were selected:
A-the necessity of escorting the cargo being carried;
B-time of day for the transport of dangerous goods;
C-qualification of drivers;
D-risks associated with the carriage of goods;
E-liaison with emergency services;
F-route selection;
G-freight delivery distance;
H-information identifying the chemical properties of the cargo being carried;
I-exact arrival at the place of loading/unloading at the specified time;
J-speed limit.
The answers received from the experts were tabulated and the ten factor ratings given by each expert were summed up. The calculation formulas were all used in the same way as for the Group I factors.
The weights of importance for all 10 factors (A, B, C, …, J) of Group III are presented in
Table 5.
The importance weights of the Group III factors are presented in
Figure 7.
The most important factors from Group III (organizational factors) that should be considered before the transport of dangerous goods by road are: D-freight risk, F-route selection, and E-communication with emergency services. Those that are less important include: H-identification of the chemical properties of the cargo being transported, C-qualification of drivers, and I-accurate arrival at loading/unloading point at the specified time. The factors with the least influence are: J-speed limit, A-necessity of escort of cargo being transported, B-time of day when transporting dangerous goods, and G-distance of delivery of cargo.
The results of the selection of the most important factors and their analysis are used to make appropriate security decisions when choosing safer transportation of these cargoes. Risk analysis in the transport system is used because a potential emergency situation can occur at any point on the route. Although accidents may be of a similar nature, the consequences may be different. When transporting dangerous goods, it must be understood that there is a high risk of danger, possible loss of or damage to property, probable personal injury or death, and damage to the ecosystem.
5. Conclusions
After analyzing the authors’ scientific literature on the transportation of dangerous goods, it can be stated that due to the constantly increasing number of vehicles, the probability of accidents is growing every year. Scientific articles can be found on the factors that usually determine the likelihood of accidents [
27]. Companies spend too little time preparing cargoes to deliver more and more of them. For this reason, accidents cannot be avoided.
Accidents involving the transport of dangerous goods occur not only through the fault of the driver but also for technical reasons or through the fault of other road users. The most important factors were identified in a qualitative expert survey, which examined 30 factors that have the greatest significance for the occurrence of an accident. The most important factors of three groups were identified.
After conducting a qualitative survey of Lithuanian road transport companies and calculating according to the Kendall coefficient, it can be stated that the most important factors of Group I, that have the greatest impact on the transport of dangerous goods by road, are: B-irregular loading, A-driver fatigue, G-the technical condition of the vehicle, and D-the weather conditions and the condition of the road surface. Factors that are less important include: C-lack of driver knowledge and I-driver occupation in secondary matters. The least influential factors are: H-driver confidence in vehicle safety systems, J-time of day, E-route planning, and F-delivery speed.
The most important technical/technological factors of Group II, which should be assessed before transporting dangerous goods by road, were calculated and identified. The most important factors are: I-correct loading or unloading, C-tightness of the vehicle semi-trailer/container/tank, and D-technical condition of the vehicle. Factors that are less important include: B-marking of the transporting vehicle, J-possible transshipment/transshipment of the transported dangerous goods, and A-ensuring security control during the transport of the goods. The least influential factors are: H-preparation of dangerous goods packaging, E-provision of the vehicle with additional safety equipment, G-chemical properties of the cargo, and F-infrastructure of the place of loading and unloading of the cargo.
The most important organizational factors in Group III that should be assessed before transporting dangerous goods by road are: D-risks associated with the transport of goods, F-the choice of route, and E-the communication with the emergency services. Factors that are less important include: H-information identifying the chemical properties of the cargo being transported, C-qualifications of the drivers, and I-punctual arrival at the place of loading/unloading at the specified time. The least influential factors are: J-speed limit, A-the need to accompany the transported cargo, B-the time of day for transporting dangerous goods, and G-the delivery distance of the cargo.
In assessing the Group I factors that have the greatest impact on the occurrence of an accident in the transport of dangerous goods by road, the most important factor (B-irregular loading) was identified according to the Kendall ratings correlation method. The performed calculations showed that the opinions of the experts coincide and are generalized, as well as harmonized, because the calculated value of χ2 (equal to 72.56) was obtained higher than the critical value (equal to 20.092). The most important factor (I-correct loading or unloading) was identified in the assessment of Group II technical/technological factors that should be assessed before transporting dangerous goods by road. In the performed calculations, the opinion of the experts is considered to be harmonized, as the calculated value of χ2 (equal to 63.42) was obtained higher than the critical value (equal to 20.092). The assessment of Group III organizational factors that should be assessed for the transport of dangerous goods by road identified a key factor (D-risk related to the transport of goods). The calculations showed that the expert opinions are similar, as the calculated value of χ2 (equal to 67.09) was higher than the critical value (equal to 20.092).
After assessing the importance of all three groups of factors influencing the reduction of risk in the transport of dangerous goods by road, the significance weights indicator was calculated according to the ARTIW method, which allows to determine how much one factor is more important than another. Group I factors estimated to have the greatest impact on the occurrence of an accident in the transport of dangerous goods were irregular loading, driver fatigue, vehicle technical condition, and weather and road surface conditions. The most important technical/technological factors of Group II were correct loading or unloading of the cargo, tightness of the vehicle semi-trailer/container/tank, and the technical condition of the vehicle. The most important organizational factors in Group III were the risks associated with the carriage of goods, the choice of route, and communication with the emergency services.
In the following stages of research, the main factors of the three groups identified should be used to develop models to make the transport of dangerous goods safer.


