Contribution of Climate Extremes to Variation in Potato Tuber Yield in Prince Edward Island

 ,
, 
 , ,
, , 
Abstract
:1. Introduction
2. Materials and Methods
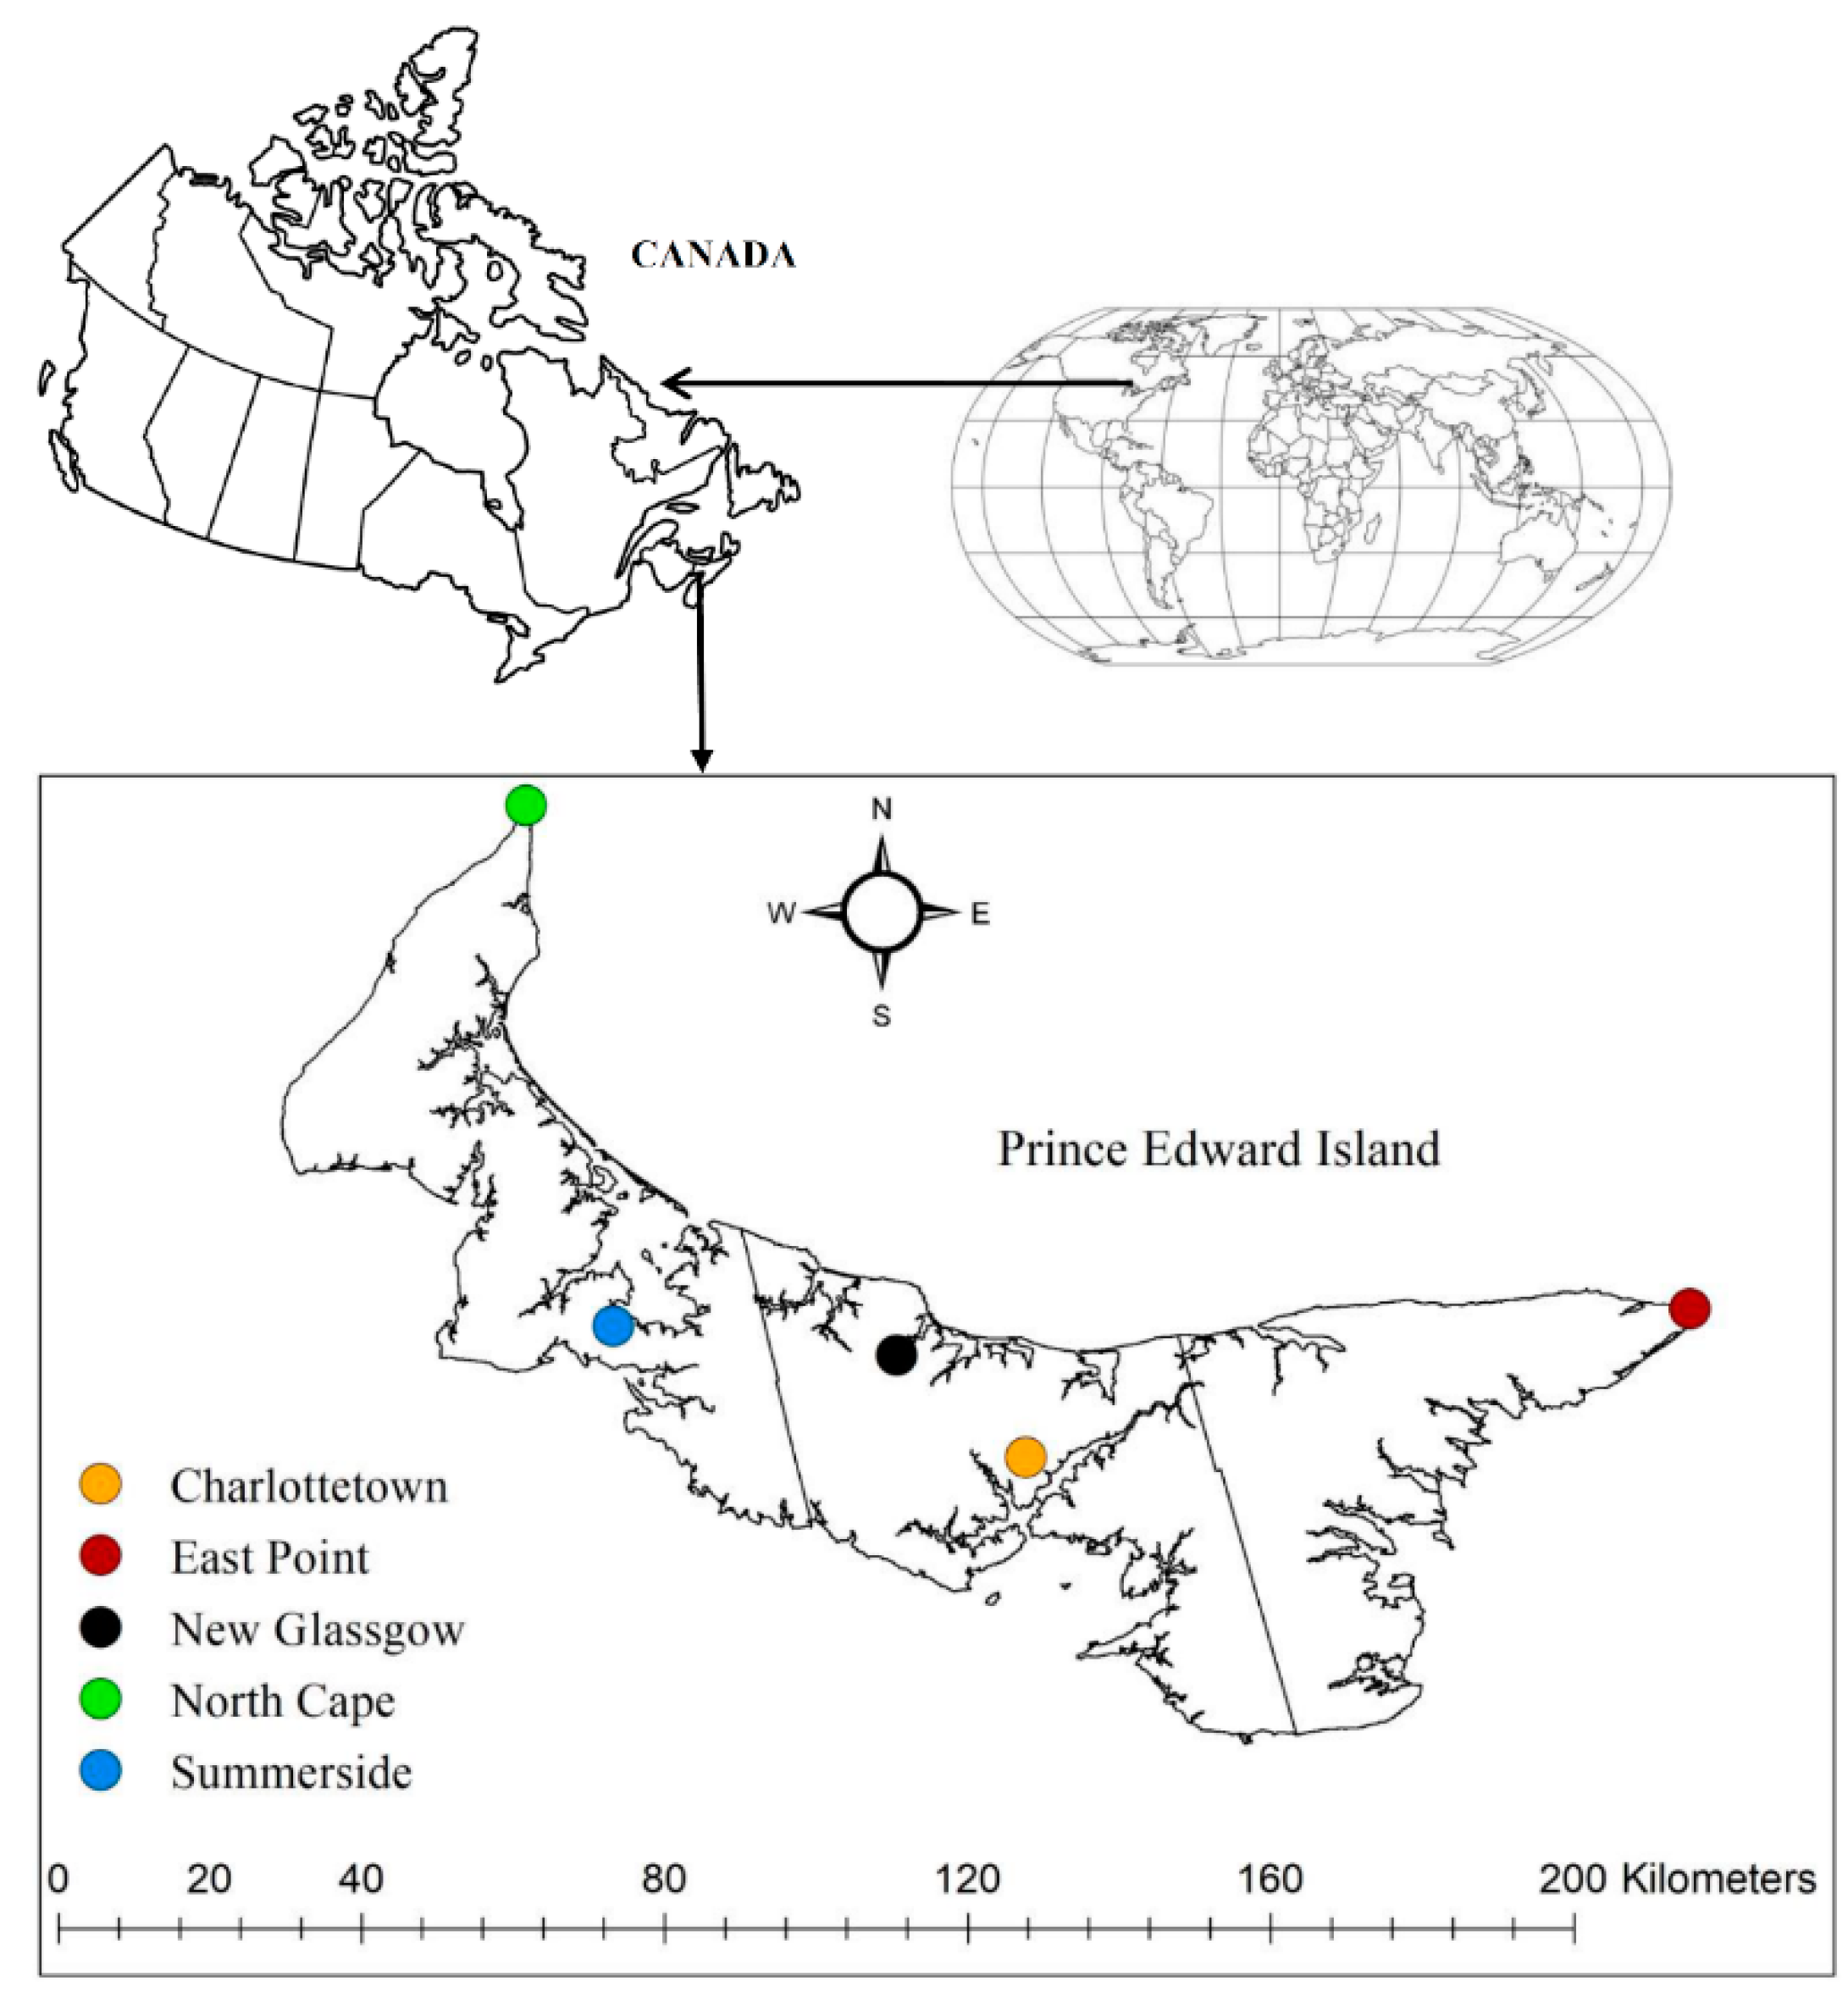
2.1. Study Area
2.2. Data Sources and Missing Values
2.3. ClimPACT2
2.4. Calculation of Climate Indices and Trend Analysis
2.5. Statistical Analysis
3. Results
3.1. Estimation of Missing Values
3.2. Climate Extreme Indices and Their Trend
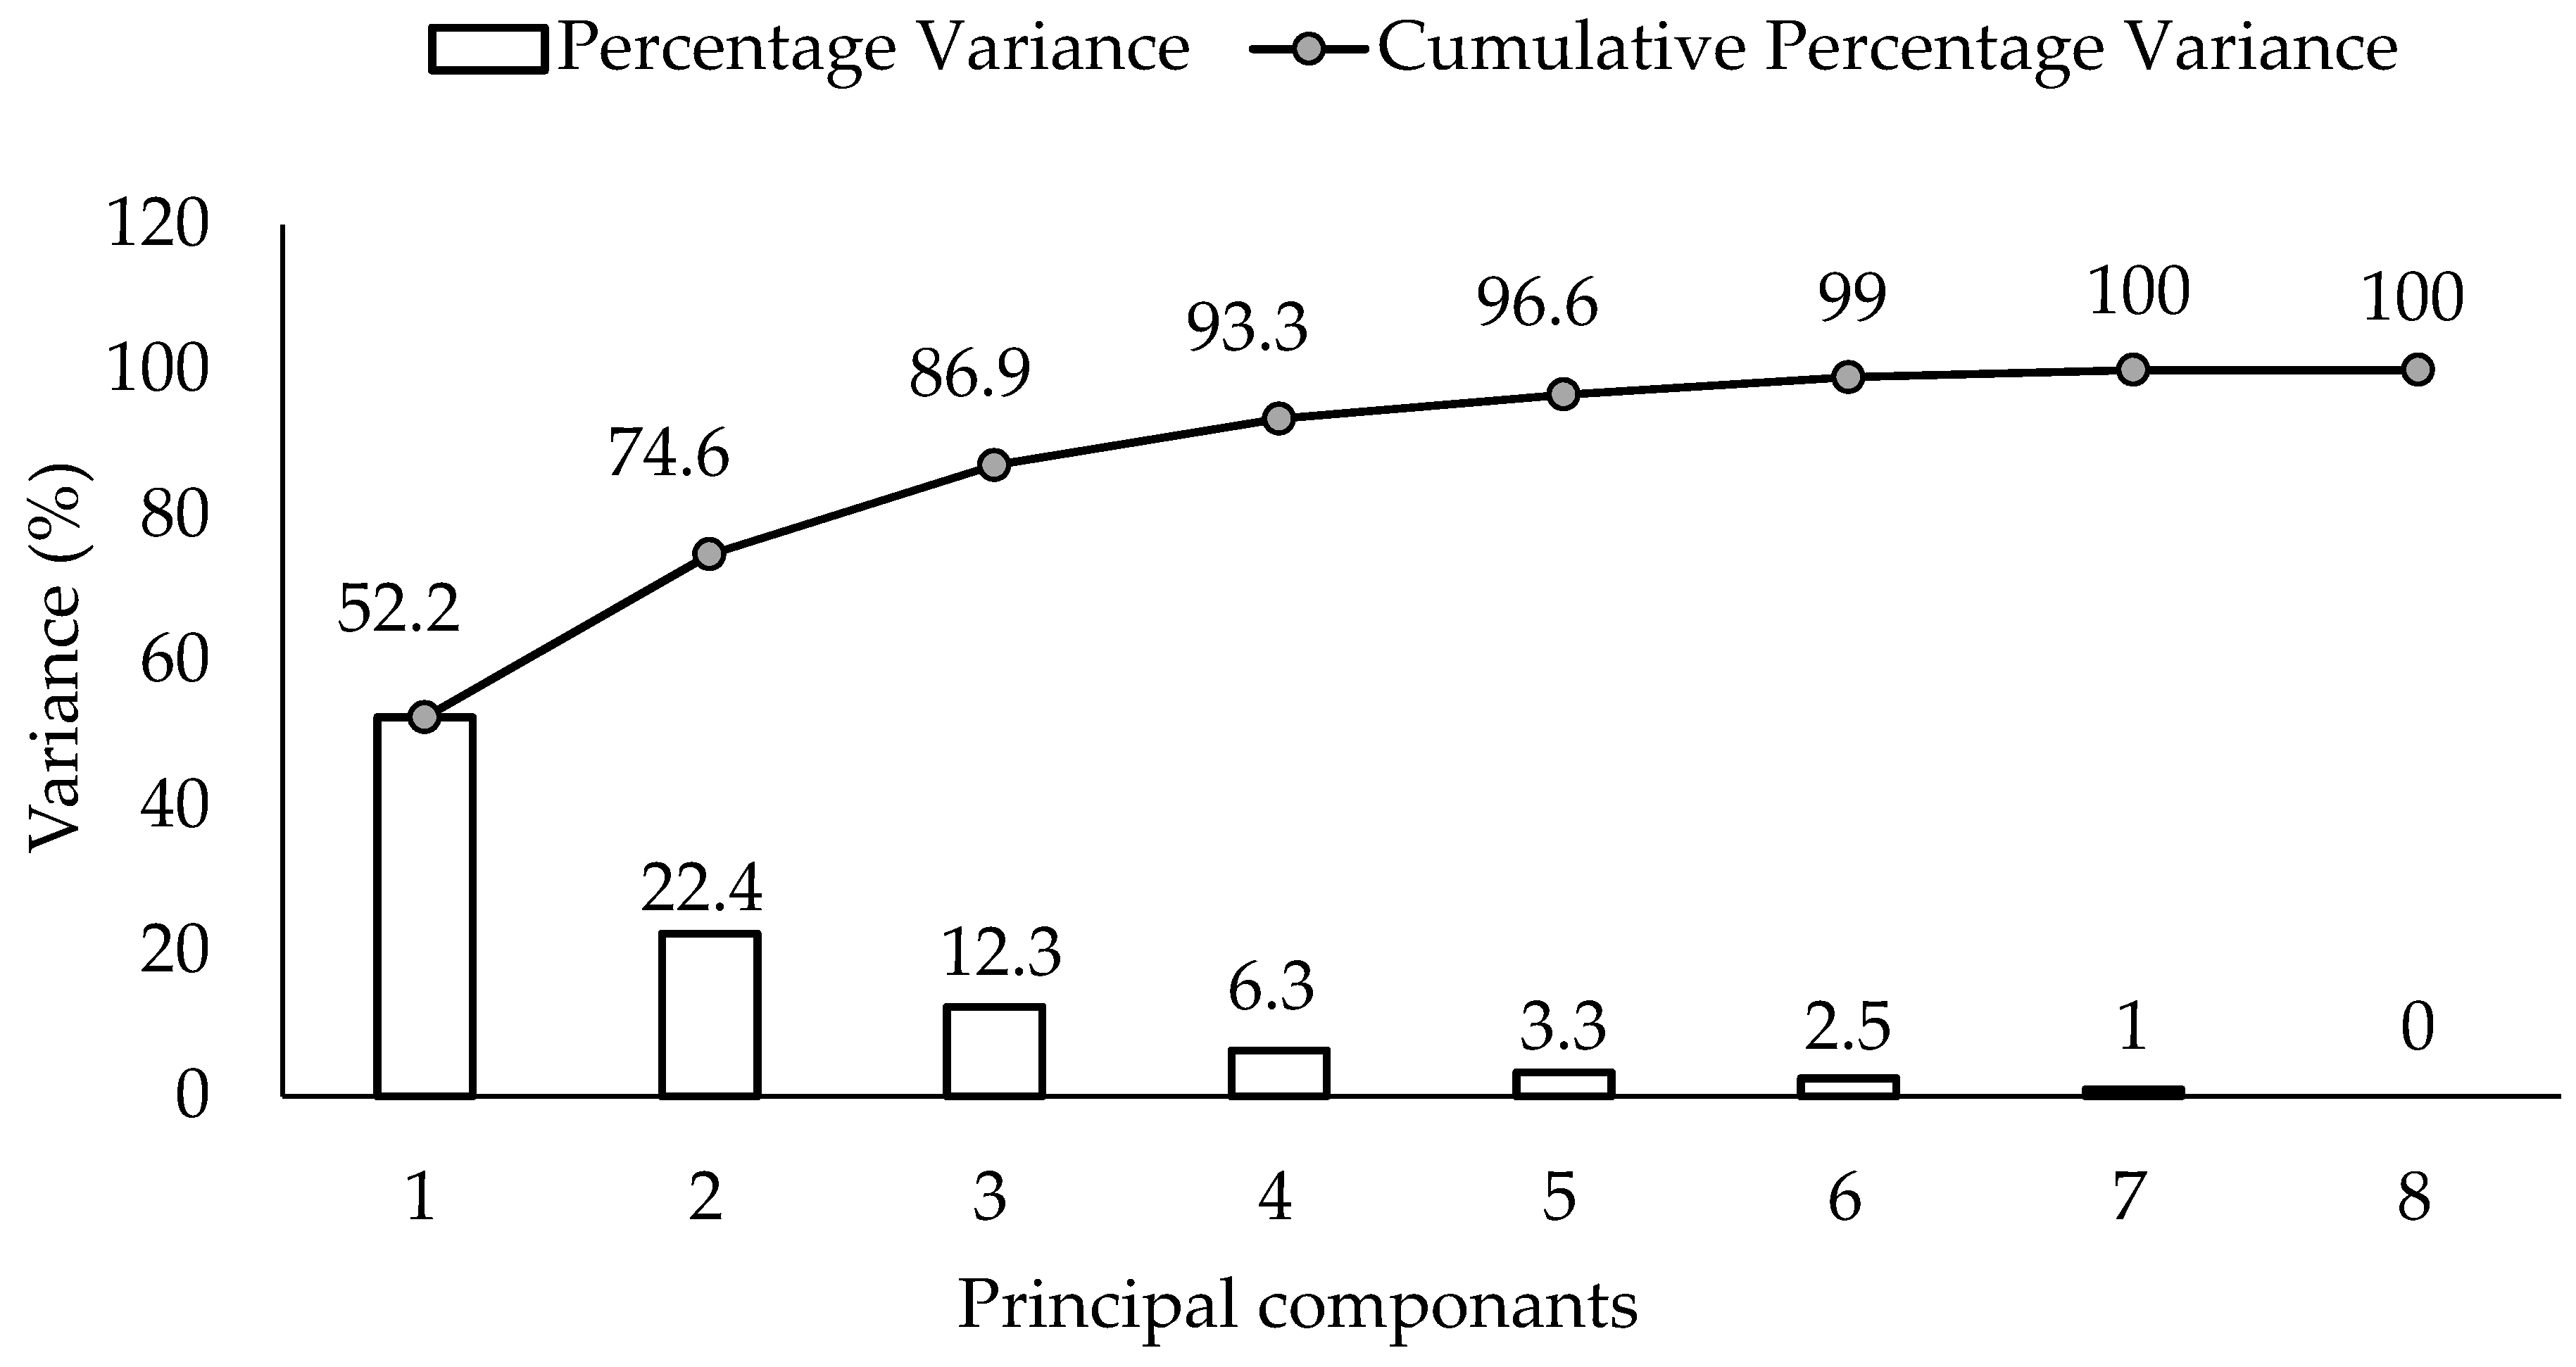
3.3. Principal Components of Climate Indices
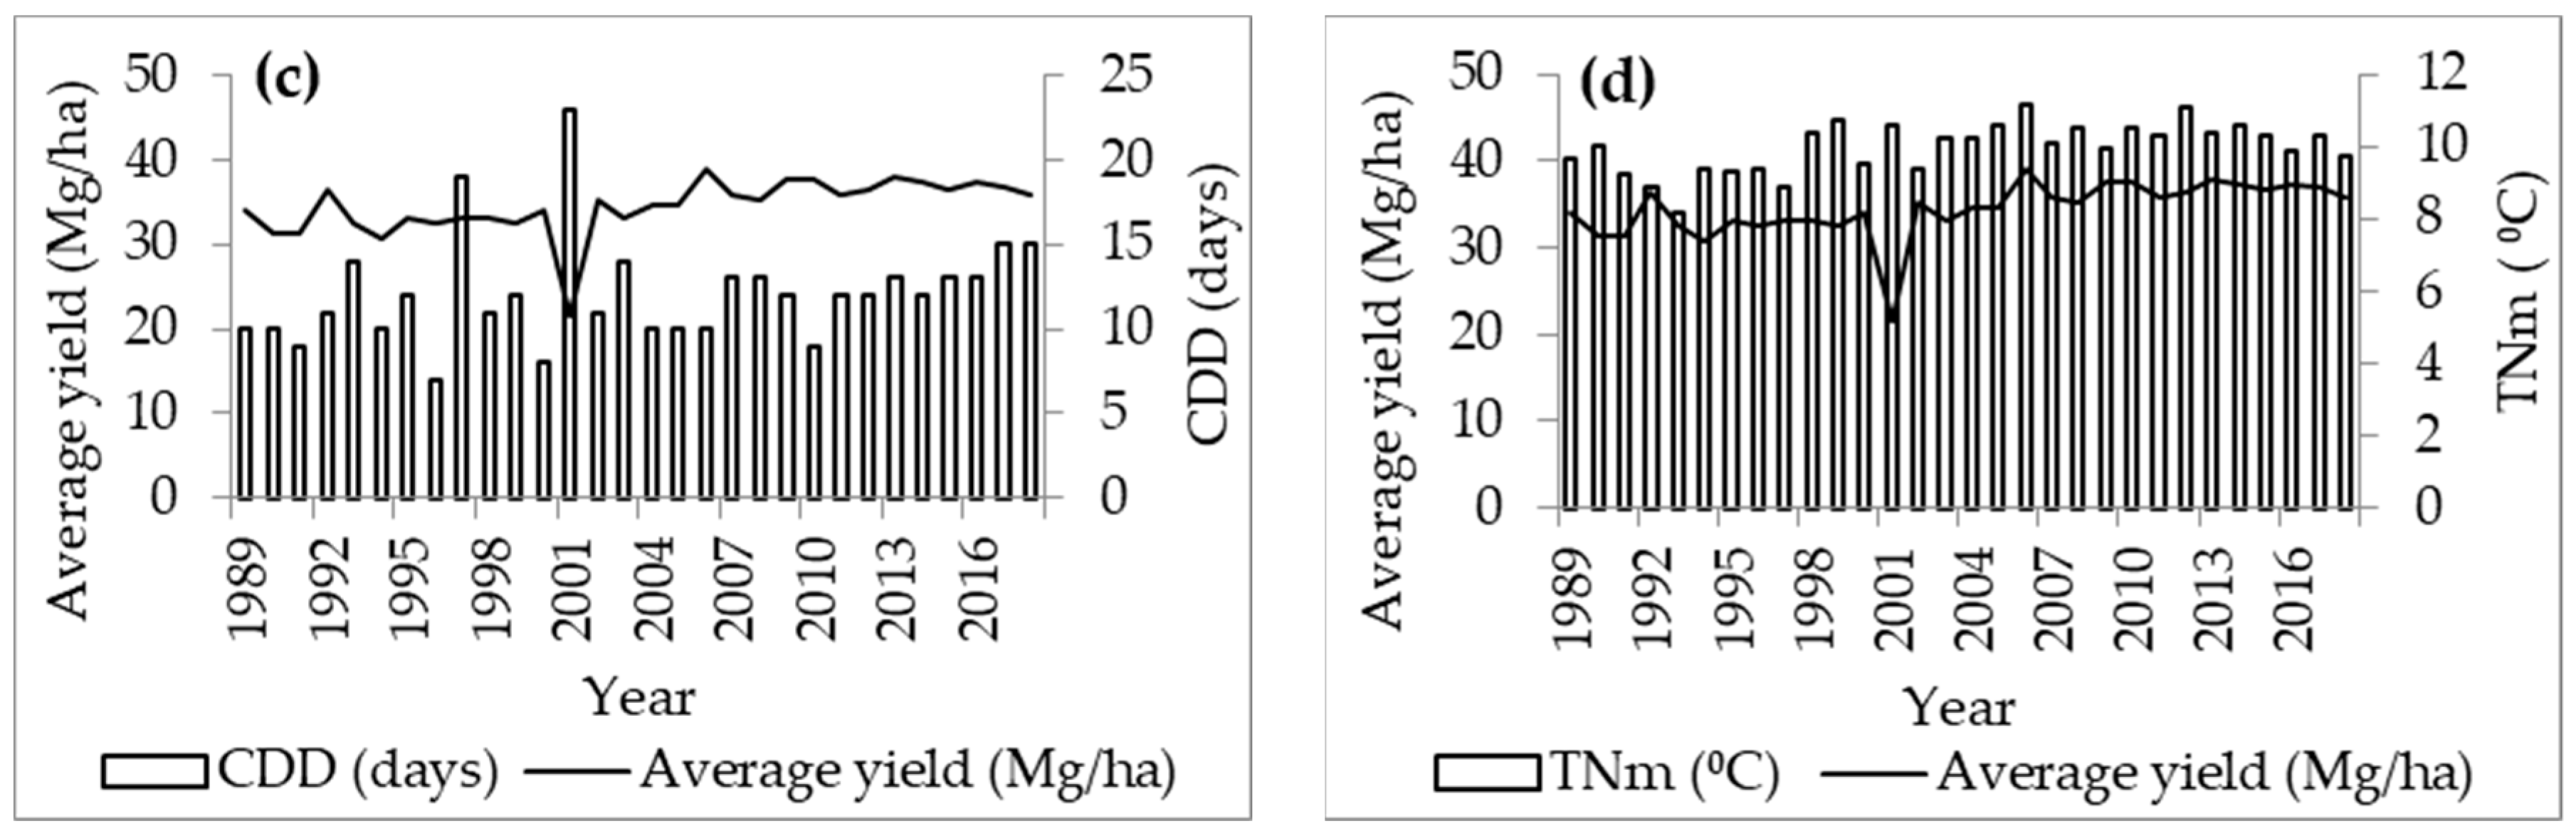
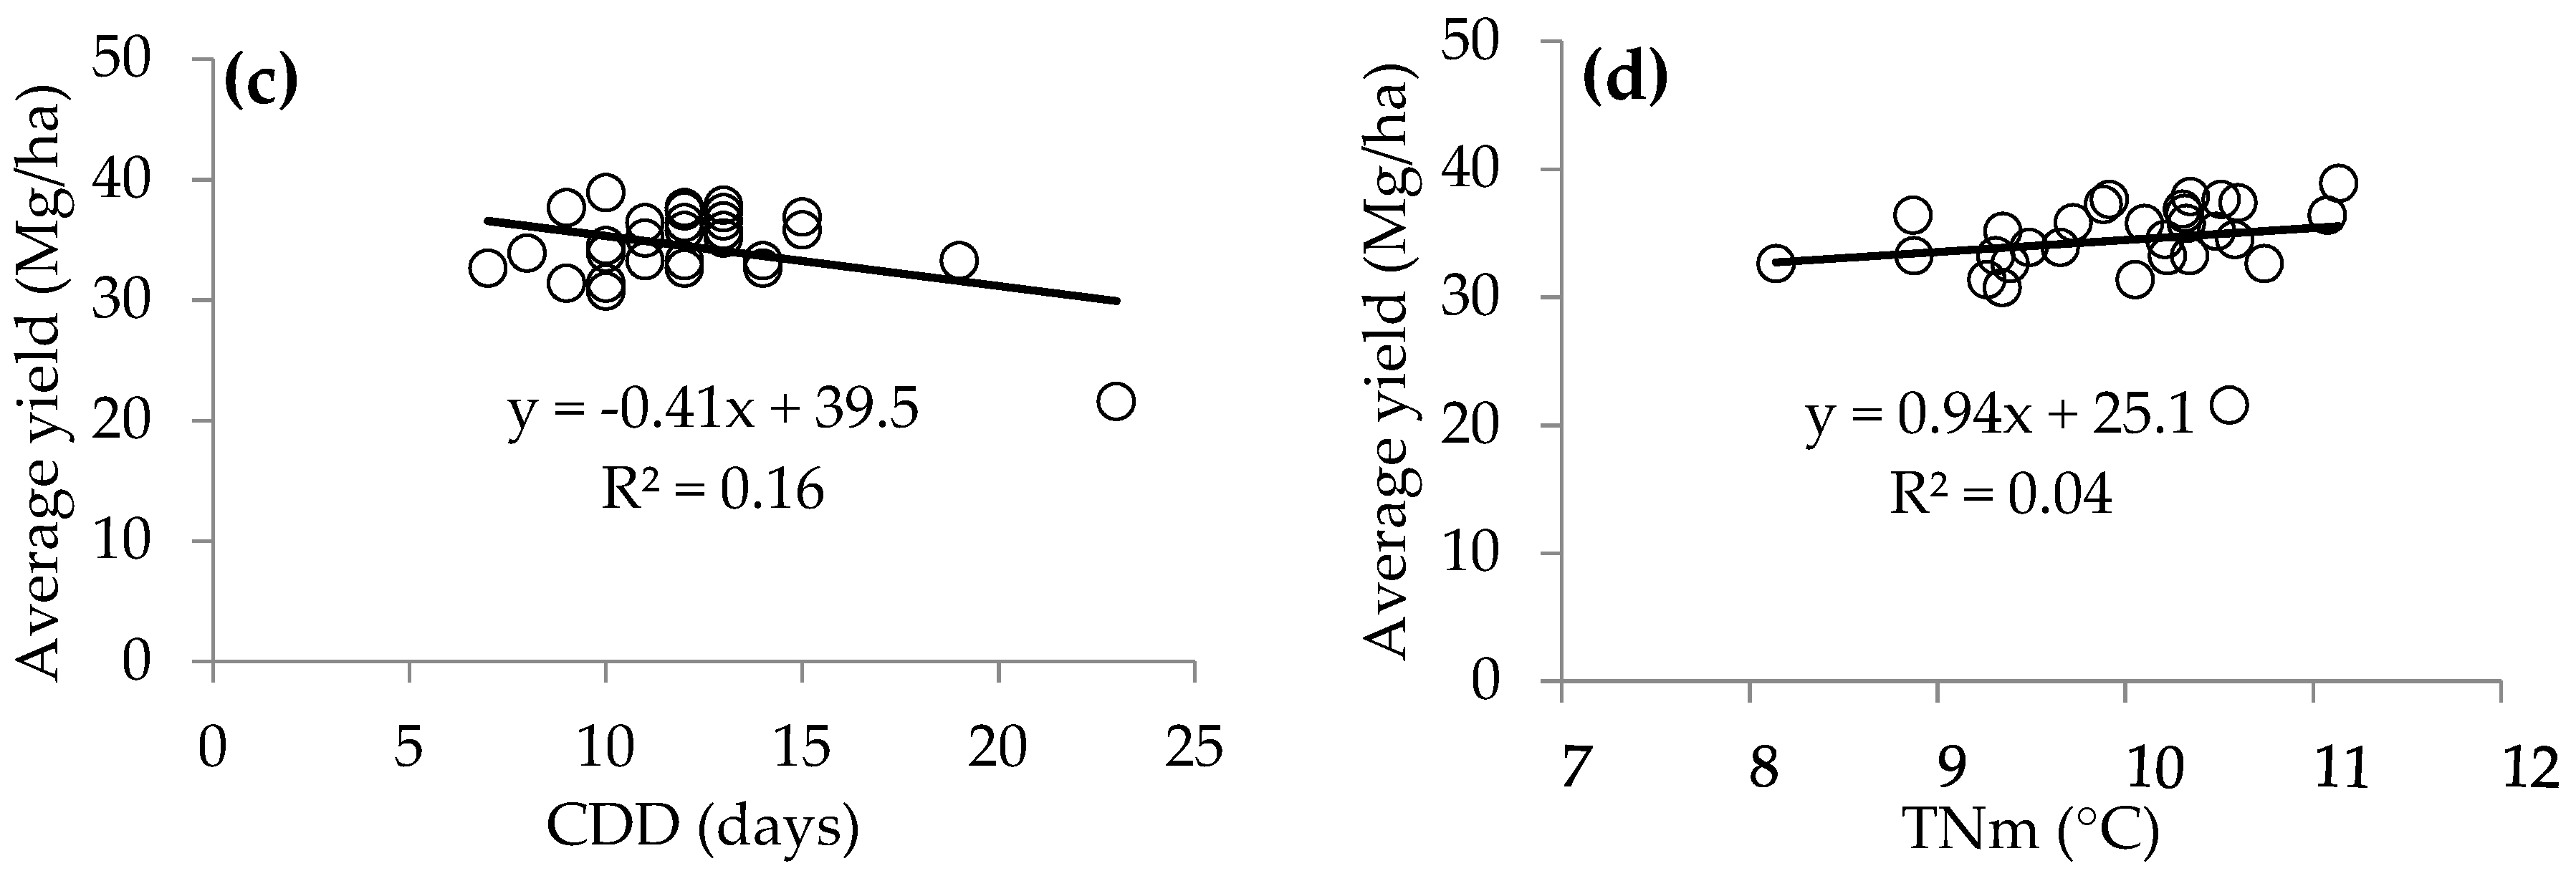
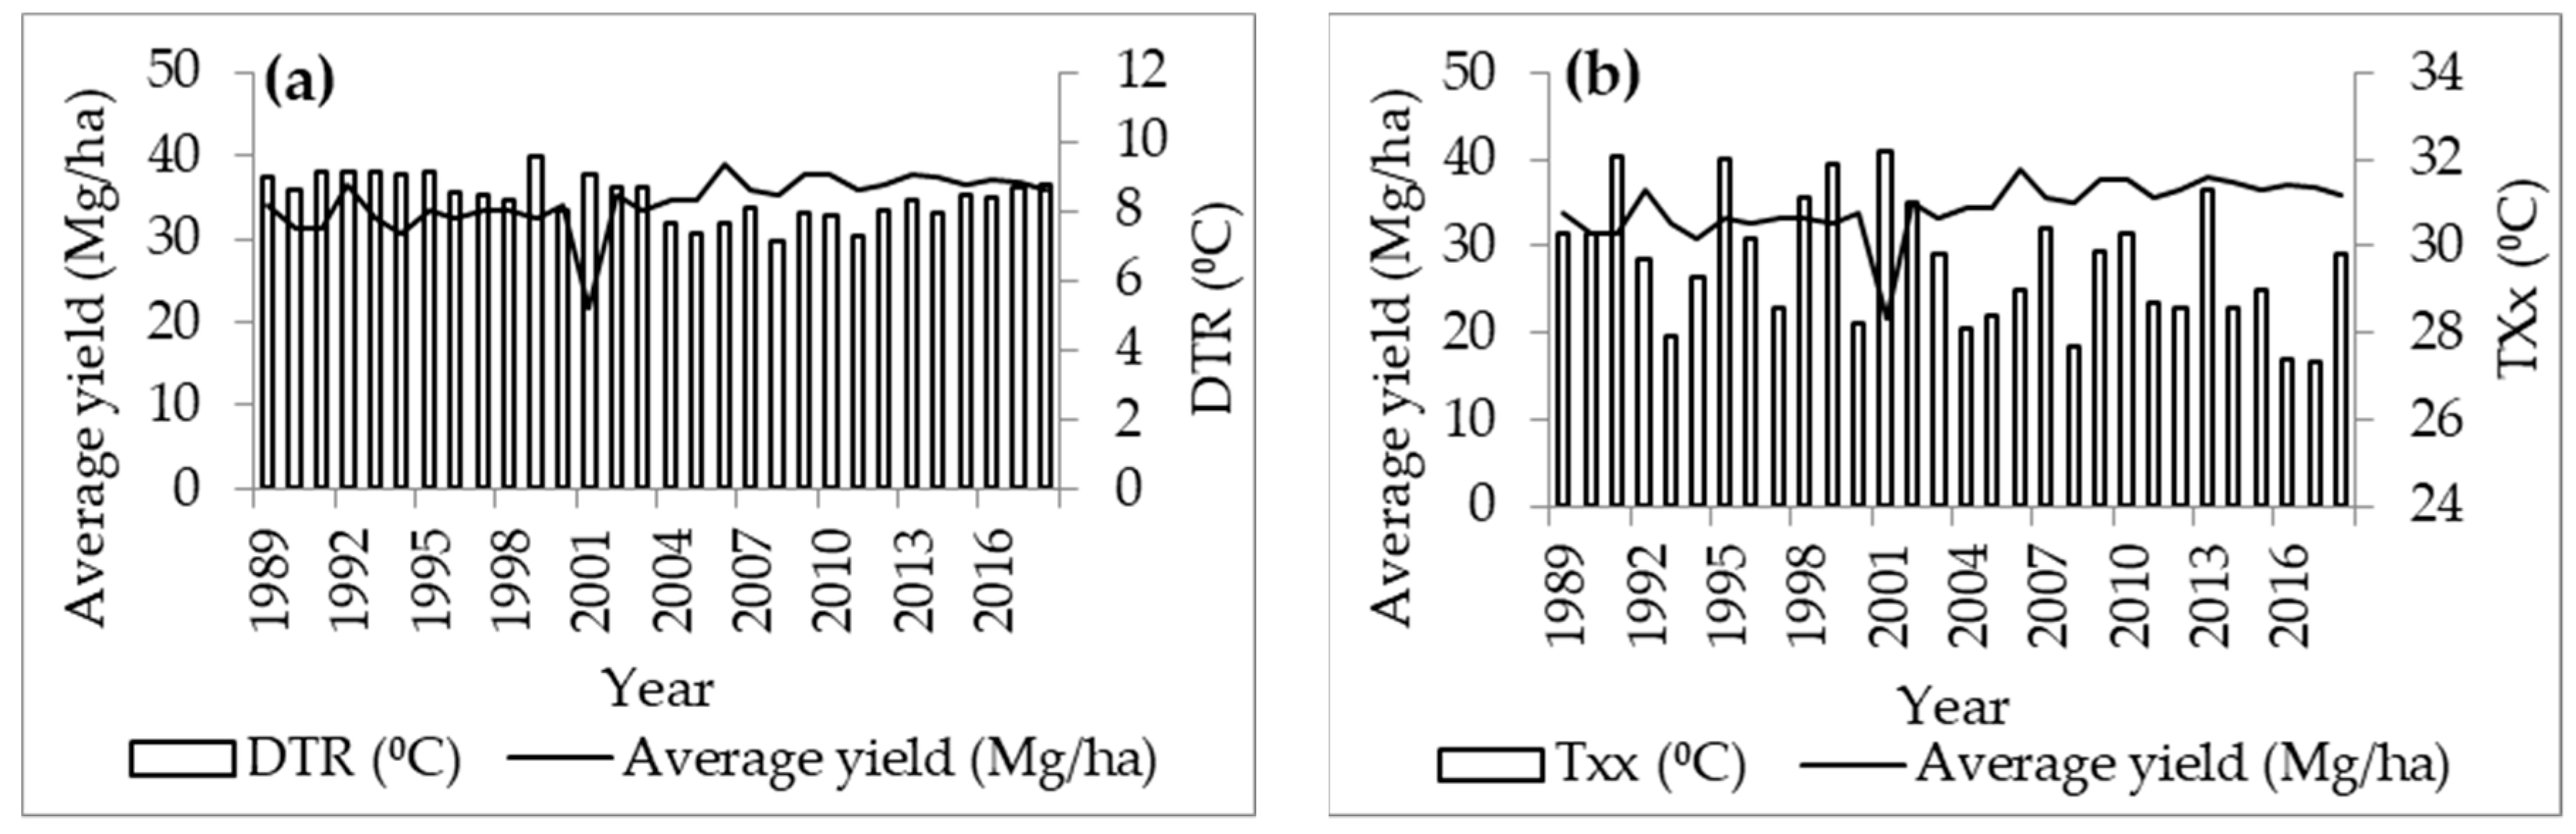
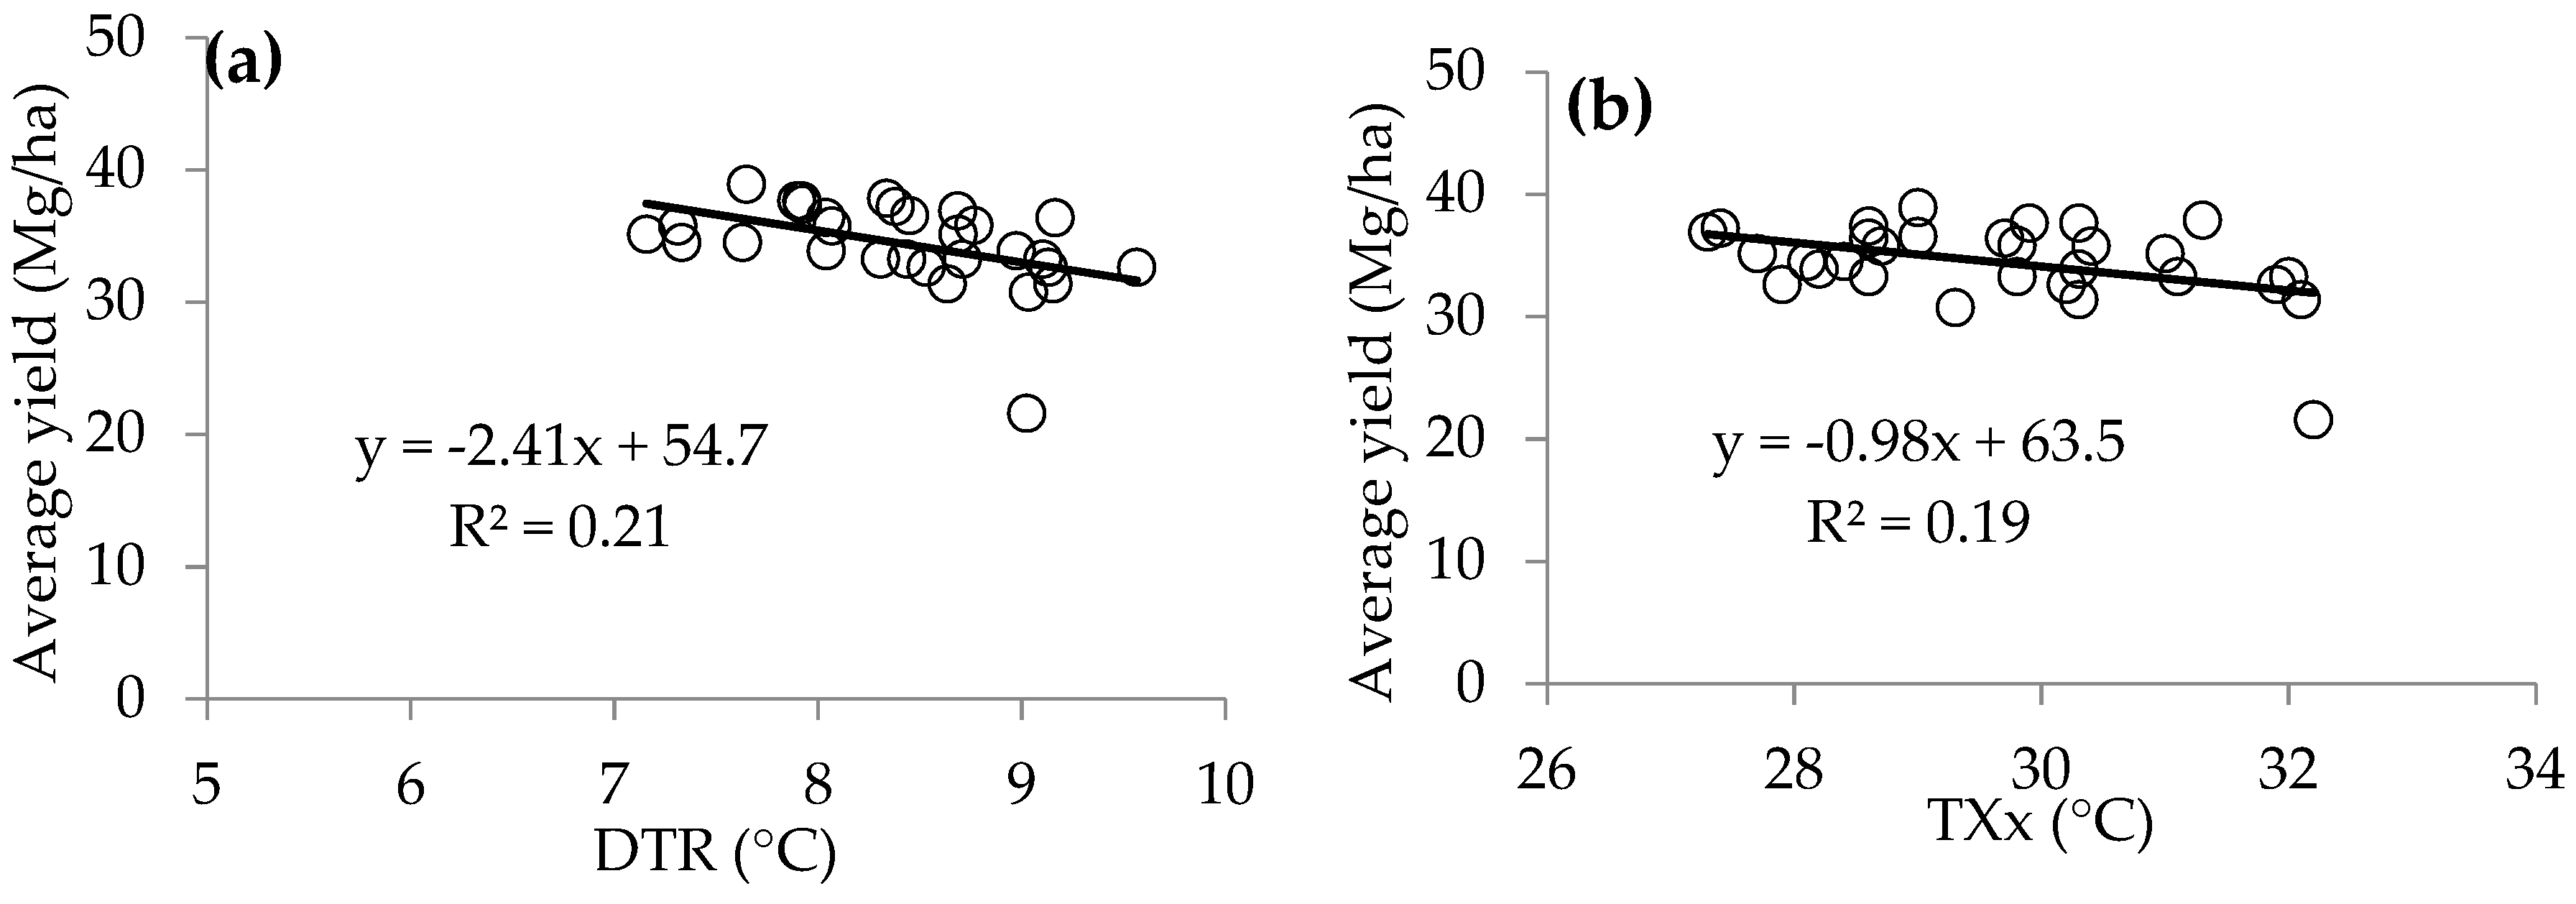
3.4. The Dominant Extreme Indices and Tuber Yield
4. Discussion
Author Contributions
Funding
Acknowledgments
Conflicts of Interest
References
- Tian, D.; Dong, W.; Zhang, H.; Guo, Y.; Yang, S.; Dai, T. Future changes in coverage of 1.5 °C and 2 °C warming thresholds. Sci. Bull. 2017, 62, 1455–1463. [Google Scholar] [CrossRef] [Green Version]
- Alexander, L.V.; Zhang, X.; Peterson, T.C.; Caesar, J.; Gleason, B.; Klein Tank, A.M.G.; Haylock, M.; Collins, D.; Trewin, B.; Rahimzadeh, F.; et al. Global observed changes in daily climate extremes of temperature and precipitation. J. Geophys. Res. Atmos. 2006, 111. [Google Scholar] [CrossRef] [Green Version]
- Donat, M.G.; Alexander, L.V.; Yang, H.; Durre, I.; Vose, R.; Dunn, R.J.H.; Willett, K.M.; Aguilar, E.; Brunet, M.; Caesar, J.; et al. Updated analyses of temperature and precipitation extreme indices since the beginning of the twentieth century: The HadEX2 dataset. J. Geophys. Res. Atmos. 2013, 118, 2098–2118. [Google Scholar] [CrossRef]
- Halimatou, A.T.; Traore, K.; Kyei-Baffour, N. Assessment of changing trends of daily precipitation and temperature extremes in Bamako and Ségou in Mali from 1961—2014. Weather Clim. Extrem. 2017, 18, 8–16. [Google Scholar] [CrossRef]
- Chisanga, C.; Phiri, E.; Chinene, V. Trends of extreme events in precipitation and temperature during the 1963—2012 period at Mt Makulu, Zambia. J. Sci. Res. Rep. 2017, 15, 1–19. [Google Scholar] [CrossRef]
- Ciupertea, A.F.; Piticar, A.; Djurdjevic, V.; Croitoru, A.-E.; Bartok, B. Future changes in extreme temperature indices in Cluj-Napoca, Romania. Aerul Si Apa Compon. Ale Mediu. 2017, 235–242. [Google Scholar] [CrossRef]
- Gamal, G. Future analysis of extreme temperature indices for sinai peninsula-egypt. Imp. J. Interdiscip. Res. 2017, 3, 1960–1966. [Google Scholar]
- Montero-Martínez, M.J.; Santana-Sepúlveda, J.S.; Pérez-Ortiz, N.I.; Pita-Díaz, Ó.; Castillo-Liñan, S. Comparing climate change indices between a northern (arid) and a southern (humid) basin in Mexico during the last decades. Adv. Sci. Res. 2018, 15, 231–237. [Google Scholar] [CrossRef]
- Shiferaw, A.; Tadesse, T.; Rowe, C.; Oglesby, R. Precipitation extremes in dynamically downscaled climate scenarios over the greater horn of Africa. Atmosphere 2018, 9, 112. [Google Scholar] [CrossRef] [Green Version]
- Mostafa, A.N.; Wheida, A.; El Nazer, M.; Adel, M.; El Leithy, L.; Siour, G.; Coman, A.; Borbon, A.; Magdy, A.W.; Omar, M.; et al. Past (1950–2017) and future (–2100) temperature and precipitation trends in Egypt. Weather Clim. Extrem. 2019, 26, 100225. [Google Scholar] [CrossRef]
- Vincent, L.A.; Wang, X.L.; Milewska, E.J.; Wan, H.; Yang, F.; Swail, V. A second generation of homogenized Canadian monthly surface air temperature for climate trend analysis. J. Geophys. Res. Atmos. 2012, 117. [Google Scholar] [CrossRef]
- Wang, X.L.; Feng, Y.; Vincent, L.A. Observed changes in one-in-20 year extremes of canadian surface air temperatures. Atmos. Ocean 2014, 52, 222–231. [Google Scholar] [CrossRef]
- Bonsal, B.R.; Zhang, X.; Vincent, L.A.; Hogg, W.D. Characteristics of daily and extreme temperatures over Canada. J. Clim. 2001, 14, 1959–1976. [Google Scholar] [CrossRef]
- Vincent, L.A.; Zhang, X.; Mekis, É.; Wan, H.; Bush, E.J. Changes in Canada’s climate: Trends in indices based on daily temperature and precipitation data. Atmos. Ocean 2018, 56, 332–349. [Google Scholar] [CrossRef] [Green Version]
- Vincent, L.A.; Mekis, É. Changes in daily and extreme temperature and precipitation indices for Canada over the twentieth century. Atmos. Ocean 2006, 44, 177–193. [Google Scholar] [CrossRef] [Green Version]
- Casati, B.; Yagouti, A.; Chaumont, D. Regional climate projections of extreme heat events in nine pilot Canadian communities for public health planning. J. Appl. Meteorol. Clim. 2013, 52, 2669–2698. [Google Scholar] [CrossRef]
- Mekis, É.; Vincent, L.A. An Overview of the Second Generation Adjusted Daily Precipitation Dataset for Trend Analysis in Canada. Atmos. Ocean 2011, 49, 163–177. [Google Scholar] [CrossRef] [Green Version]
- Brown, R.; Derksen, C.; Wang, L. A multi-data set analysis of variability and change in Arctic spring snow cover extent, 1967–2008. J. Geophys. Res. Atmos. 2010, 115. [Google Scholar] [CrossRef]
- Richards, W.; Daigle, R. Scenarios and Guidance for Adaptation to Climate Change and Sea Level Rise—NS and PEI Municipalities. Atlantic Climate Adaptation Solutions Association. 2011. Available online: https://www.princeedwardisland.ca/sites/default/files/publications/scenarios_and_guidance_for_adaptation_to_climate_change_and_sea_level_rise_-_ns_and_pei_municipalities.pdf (accessed on 22 March 2020).
- Climate Change and Island Agriculture. Government of Prince Edward Island. Available online: https://www.princeedwardisland.ca/en/information/communities-land-and-environment/climate-change-and-island-agriculture (accessed on 22 March 2020).
- Agriculture on PEI. Government of Prince Edward Island. Available online: https://www.princeedwardisland.ca/en/information/agriculture-and-land/agriculture-on-pei (accessed on 22 March 2020).
- Government of Prince Edward Island. PEI 2018 Agriculture and Agri-Food International Exports. 2018. Available online: https://www.princeedwardisland.ca/en/publication/pei-2018-agriculture-and-agri-food-international-exports (accessed on 22 March 2020).
- Macdonald, M. Potatoes: A Billion Dollar Industry for P.E.I. The Guardian. Available online: https://www.theguardian.pe.ca/news/local/potatoes-a-billion-dollar-industry-for-pei-95098/ (accessed on 29 April 2020).
- Prince Edward Island has the Largest Potato Crop in Canada. Available online: https://www150.statcan.gc.ca/n1/pub/95-640-x/2016001/article/14801-eng.htm (accessed on 26 April 2020).
- Lobell, D.B.; Burke, M.B. Why are agricultural impacts of climate change so uncertain? the importance of temperature relative to precipitation. Environ. Res. Lett. 2008, 3, 034007. [Google Scholar] [CrossRef]
- Hatfield, J.L.; Prueger, J.H. Temperature extremes: Effect on plant growth and development. Weather Clim. Extrem. 2015, 10, 4–10. [Google Scholar] [CrossRef] [Green Version]
- Qian, B.; Zhang, X.; Smith, W.; Grant, B.; Jing, Q.; Cannon, A.J.; Neilsen, D.; McConkey, B.; Li, G.; Bonsal, B.; et al. Climate change impacts on Canadian yields of spring wheat, canola and maize for global warming levels of 1.5 °C, 2.0 °C, 2.5 °C and 3.0 °C. Environ. Res. Lett. 2019, 14, 074005. [Google Scholar] [CrossRef]
- Raymundo, R.; Asseng, S.; Robertson, R.; Petsakos, A.; Hoogenboom, G.; Quiroz, R.; Hareau, G.; Wolf, J. Climate change impact on global potato production. Eur. J. Agron. 2018, 100, 87–98. [Google Scholar] [CrossRef]
- Dell, M.; Jones, B.F.; Olken, B.A. Temperature shocks and economic growth: Evidence from the last half century. Am. Econ. J. Macroecon. 2012, 4, 66–95. [Google Scholar] [CrossRef] [Green Version]
- Lobell, D.B.; Gourdji, S.M. The influence of climate change on global crop productivity. Plant Physiol. 2012, 160, 1686–1697. [Google Scholar] [CrossRef] [PubMed] [Green Version]
- Poudel, S.; Shaw, R. The relationships between climate variability and crop yield in a mountainous environment: A case study in Lamjung District, Nepal. Climate 2016, 4, 13. [Google Scholar] [CrossRef] [Green Version]
- Mumo, L.; Yu, J.; Fang, K. Assessing impacts of seasonal climate variability on maize yield in Kenya. Int. J. Plant Prod. 2018, 12, 297–307. [Google Scholar] [CrossRef]
- Hijmans, R.J. The effect of climate change on global potato production. Am. J. Potato Res. 2003, 80, 271–279. [Google Scholar] [CrossRef]
- Levy, D.; Veilleux, R.E. Adaptation of potato to high temperatures and salinity—A review. Am. J. Potato Res. 2007, 84, 487–506. [Google Scholar] [CrossRef]
- Singh, B.P.; Dua, V.K.; Govindakrishnan, P.M.; Sharma, S. Impact of climate change on potato. In Climate-Resilient Horticulture: Adaptation and Mitigation Strategies; Springer: Delhi, India, 2013; pp. 125–135. ISBN 9788132209744. [Google Scholar]
- Government of Canada. Climate Change in Prince Edward Island. 2017. Available online: http://www.gov.pe.ca/photos/original/eef_climatechan.pdf (accessed on 2 May 2020).
- Farooque, A.A.; Zare, M.; Abbas, F.; Bos, M.; Esau, T.; Zaman, Q. Forecasting potato tuber yield using a soil electromagnetic induction method. Eur. J. Soil Sci. 2019, 1–18. [Google Scholar] [CrossRef]
- Afzaal, H.; Farooque, A.A.; Abbas, F.; Acharya, B.; Esau, T. Precision irrigation strategies for sustainable water budgeting of potato crop in Prince Edward Island. Sustainability 2020, 12, 2419. [Google Scholar] [CrossRef] [Green Version]
- Guluma, A.D. Factors affecting potato (Solanum tuberosum L.) tuber seed quality in mid and highlands: A review. Int. J. Zambrut 2020, 7, 24–40. [Google Scholar]
- Nurmanov, Y.T.; Chernenok, V.G.; Kuzdanova, R.S. Potato in response to nitrogen nutrition regime and nitrogen fertilization. Field Crop. Res. 2019, 231, 115–121. [Google Scholar] [CrossRef]
- Wang, X.; Guo, T.; Wang, Y.; Xing, Y.; Wang, Y.; He, X. Exploring the optimization of water and fertilizer management practices for potato production in the sandy loam soils of Northwest China based on PCA. Agric. Water Manag. 2020, 237, 106180. [Google Scholar] [CrossRef]
- Kumar, N.; Prasad, V.; Pal Yadav, N. Effect of chemical fertilizers and bio fertilizers on flower yield, tuberous root yield and quality parameter on dahlia (Dahlia variabilis L.) cv. Kenya orange. J. Pharmacol. Phytochem. 2019, 8, 2265–2267. [Google Scholar]
- Zare, M.; Farooque, A.A.; Abbas, F.; Zaman, Q.; Bos, M. Trends in the variability of potato tuber yield under selected land and soil characteristics. Plant Soil Environ. 2019, 65, 111–117. [Google Scholar] [CrossRef] [Green Version]
- Quarterly Demographic Estimates, January to March 2019. Available online: https://www150.statcan.gc.ca/n1/pub/91-002-x/91-002-x2019001-eng.htm (accessed on 2 May 2020).
- Our Changing Climate. Government of Prince Edward Island. Available online: https://www.princeedwardisland.ca/en/information/communities-land-and-environment/our-changing-climate (accessed on 23 March 2020).
- Island Climate and Weather. Government of Prince Edward Island. Available online: https://www.princeedwardisland.ca/en/information/communities-land-and-environment/island-climate-and-weather (accessed on 23 March 2020).
- Mann, H.B. Nonparametric tests against trend. Econ. Soc. 1945, 245–259. [Google Scholar] [CrossRef]
- Kendall, M.G. Rank Correlation Methods; Charles Griffin & Co. Ltd.: London, UK, 1955; p. 196. [Google Scholar]
- Salmi, T.; Määttä, A.; Anttila, P.; Ruoho-Airola, T.; Amnell, T.; Maatta, A. Detecting Trends of Annual Values of Atmospheric Pollutants by the Mann-Kendall Test and Sen’s Slope Estimates: The Excel Template Application MAKESENS; Finnish Meteor. Institute: Helsinki, Finland, 2002; ISBN 9516975631. [Google Scholar]
- Armenise, E.; Redmile-Gordon, M.A.; Stellacci, A.M.; Ciccarese, A.; Rubino, P. Developing a soil quality index to compare soil fitness for agricultural use under different managements in the mediterranean environment. Soil Tillage Res. 2013, 130, 91–98. [Google Scholar] [CrossRef]
- Andrews, S.S.; Karlen, D.L.; Mitchell, J.P. A comparison of soil quality indexing methods for vegetable production systems in Northern California. Agric. Ecosyst. Environ. 2002, 90, 25–45. [Google Scholar] [CrossRef]
- Xian, X.; Pang, M.; Zhang, J.; Zhu, M.; Kong, F.; Xi, M. Assessing the effect of potential water and salt intrusion on coastal wetland soil quality: Simulation study. J. Soils Sediments 2019, 19, 2251–2264. [Google Scholar] [CrossRef]
- Mandal, U.K.; Warrington, D.N.; Bhardwaj, A.K.; Bar-Tal, A.; Kautsky, L.; Minz, D.; Levy, G.J. Evaluating impact of irrigation water quality on a calcareous clay soil using principal component analysis. Geoderma 2008, 144, 189–197. [Google Scholar] [CrossRef]
- Andrews, S.S.; Carroll, C.R. Designing a soil quality assessment tool for sustainable. Ecol. Soc. Am. 2001, 11, 1573–1585. [Google Scholar]
- Sánchez-Navarro, A.; Gil-Vázquez, J.M.; Delgado-Iniesta, M.J.; Marín-Sanleandro, P.; Blanco-Bernardeau, A.; Ortiz-Silla, R. Establishing an index and identification of limiting parameters for characterizing soil quality in Mediterranean ecosystems. Catena 2015, 131, 35–45. [Google Scholar] [CrossRef]
- Peña-Gallardo, M.; Vicente-Serrano, S.M.; Domínguez-Castro, F.; Beguería, S. The impact of drought on the productivity of two rainfed crops in Spain. Nat. Hazards Earth Syst. Sci. 2019, 19, 1215–1234. [Google Scholar] [CrossRef] [Green Version]


| Stations | Lat. (°) | Long. (°) | Elev. (m) | Average P (mm) | Upper Threshold of TX (°C) | Lower Threshold of TN (°C) | Missing Data (%) |
|---|---|---|---|---|---|---|---|
| East point | 46.46 | −61.99 | 7.70 | 3.00 | 33.5 | −31.0 | 2.05 |
| Charlottetown | 46.23 | −63.17 | 13.7 | 3.19 | 33.0 | −29.8 | 0.78 |
| New Glasgow | 46.41 | −63.35 | 6.10 | 3.49 | 34.0 | −34.5 | 2.67 |
| Summerside | 46.44 | −63.84 | 12.2 | 2.69 | 33.7 | −28.0 | 12.3 |
| North cap | 47.06 | −64.00 | 7.60 | 2.97 | 33.2 | −33.0 | 2.16 |
| Indices | ID | Indicator Name | Definition | Units |
|---|---|---|---|---|
| Temperature indices | TN10p | Cold nights | Percentage of days when TN < 10th percentile | % |
| TN90p | Warm nights | Percentage of days when TN > 90th percentile | % | |
| TX10p | Cold days | Percentage of days when TN < 10th percentile | % | |
| TX90p | Hot days | Percentage of days when TN > 90th percentile | % | |
| TXx | Warmest days | Maximum value of daily TX | °C | |
| TXn | Coldest days | Minimum value of daily TX | °C | |
| TNx | Warmest nights | Maximum value of daily TN | °C | |
| TNn | Coldest nights | Minimum value of daily TN | °C | |
| TMm | Mean TM | Mean daily mean temperature | °C | |
| TNm | Mean TN | Mean daily minimum temperature | °C | |
| DTR | Daily temperature range | Daily TX - Daily TN | °C | |
| FD | Frost days | Number of days when TN < 0 °C | Days | |
| SU | Summer days | Number of days when TX > 25 °C | Days | |
| Precipitation indices | CDD | Continuous dry days | Number of consecutive days, when P < 1.0 mm | Days |
| CWD | Continuous wet days | Number of consecutive days, when P ≥ 1.0 mm | Days | |
| Rx1day | Max 1-day P | Amount of P that fell in 1 day | mm | |
| Rx5day | Max 5-day P | Amount of total P that fell in 5 consecutive days | mm | |
| R10mm | No. of heavy P days | Count of days when P ≥ 10.0 mm | Days | |
| R20mm | Number of very heavy P days | Number of days when P ≥ 20.0 mm | Days | |
| P_TOT | Annual total wet-day precipitation | Sum of daily P when P ≥ 1.0 mm | mm |
| Indices | Indices-ID | Definition | Trends | Units |
|---|---|---|---|---|
| Temperature Indices | TN10p | Cold nights | −11.40 *** | % |
| TN90p | Warm nights | 3.98 | ||
| TX10p | Cold days | −5.67 * | ||
| TX90p | Hot days | −2.38 | ||
| TXx | Warmest days | −2.00 * | °C | |
| TXn | Coldest days | 1.36 | ||
| TNx | Warmest nights | 1.07 | ||
| TNn | Coldest nights | 1.44 | ||
| TMm | Mean TM | 0.77 * | ||
| TNm | Mean TN | 1.17 ** | ||
| DTR | Daily temperature range | −1.01 * | ||
| FD | Frost days | −3.75 * | days | |
| SU | Summer days | −1.30 | ||
| Precipitation Indices | CDD | Continuous dry days | 3.33 * | days |
| CWD | Continuous wet days | 0.00 | ||
| R10mm | Number of heavy P days | 0.00 | ||
| R20mm | Number of very heavy P days | 0.00 | ||
| P_TOT | Annual total wet-day P | −27.0 | mm | |
| Rx1day | Max 1-day P | 5.18 | ||
| Rx5day | Max 5-day P | 9.52 |
| Variance and Factor Loadings | PC1 | PC2 | PC3 |
|---|---|---|---|
| Variance (%) | 52.2 | 22.4 | 12.3 |
| Cumulative variance | 52.2 | 74.6 | 86.9 |
| Eigenvector or factor loading | |||
| CDD (days) | 0.03 | −0.30 | −0.89 |
| TXx (°C) | 0.01 | −0.59 | 0.44 |
| DTR (°C) | −0.25 | −0.59 | 0.06 |
| FD (days) | −0.41 | −0.10 | −0.10 |
| TN10p (%) | −0.46 | −0.14 | −0.01 |
| TX10p (%) | −0.39 | 0.30 | 0.08 |
| TNm (°C) | 0.48 | 0.01 | 0.01 |
| TMm (°C) | 0.42 | −0.30 | 0.04 |
| Indices | TN10p (%) | TX10p (%) | TXx (°C) | TMm (°C) | TNm (°C) | DTR (°C) | FD (days) |
|---|---|---|---|---|---|---|---|
| TX10p (%) | 0.63 *** | 1.00 | |||||
| TXx (°C) | 0.07 | −0.22 | 1.00 | ||||
| TMm (°C) | −0.71 *** | −0.83 *** | 0.25 | 1.00 | |||
| TNm (°C) | −0.91 *** | −0.76 *** | −0.02 | 0.89 *** | 1.00 | ||
| DTR (°C) | 0.64 *** | 0.08 | 0.52 ** | −0.06 | −0.50 * | 1.00 | |
| FD (days) | 0.79 *** | 0.51 * | −0.03 | −0.60 *** | −0.74 *** | 0.50 * | 1.00 |
| CDD (days | 0.09 | −0.21 | 0.03 | 0.13 | 0.02 | 0.19 | 0.03 |
© 2020 by the authors. Licensee MDPI, Basel, Switzerland. This article is an open access article distributed under the terms and conditions of the Creative Commons Attribution (CC BY) license (http://creativecommons.org/licenses/by/4.0/).
Share and Cite
Maqsood, J.; Farooque, A.A.; Wang, X.; Abbas, F.; Acharya, B.; Afzaal, H. Contribution of Climate Extremes to Variation in Potato Tuber Yield in Prince Edward Island. Sustainability 2020, 12, 4937. https://doi.org/10.3390/su12124937
Maqsood J, Farooque AA, Wang X, Abbas F, Acharya B, Afzaal H. Contribution of Climate Extremes to Variation in Potato Tuber Yield in Prince Edward Island. Sustainability. 2020; 12(12):4937. https://doi.org/10.3390/su12124937
Chicago/Turabian StyleMaqsood, Junaid, Aitazaz A. Farooque, Xander Wang, Farhat Abbas, Bishnu Acharya, and Hassan Afzaal. 2020. "Contribution of Climate Extremes to Variation in Potato Tuber Yield in Prince Edward Island" Sustainability 12, no. 12: 4937. https://doi.org/10.3390/su12124937
APA StyleMaqsood, J., Farooque, A. A., Wang, X., Abbas, F., Acharya, B., & Afzaal, H. (2020). Contribution of Climate Extremes to Variation in Potato Tuber Yield in Prince Edward Island. Sustainability, 12(12), 4937. https://doi.org/10.3390/su12124937