1. Introduction
Quality education is one of the foremost goals of sustainable development, as approved by the United Nations Forum (2015) [
1]. It is believed that quality education will lead to a more sustainable world [
2]. Providing an environment that helps students complete their academics with better opportunities for resolving difficulties is the primary parameter for Education for Sustainable Development (ESD) [
3]. The performance prediction of students is one of the most challenging domains. Significant feedback is associated with the early prediction of student performance, such as modeling the learning behavior of students, adjusting and improving the academic environment, catering to students’ issues, and engaging in decision-making practices based on data analysis [
4]. The predictive analysis based on AI is a significant trait for the development of the sustainable conceptual framework for engineering projects. It requires data that model future behavior by analyzing the trends [
5]. E-learning practices provide a helpful environment for data collection for learning analytics [
6], allowing one to conveniently predict the performance of students in the e-learning environment by identifying their interactions with the learning management system and by observing their browsing patterns [
7]. Similarly, in the classroom-based academic system, multiple practices can detect the performance and learning potential of students when they have direct interactions with the tutor [
8]. However, it is challenging and more difficult to predict the performance of students in the project-based learning of engineering fields. In these fields, students work as teams in projects located locally or globally. These credentials increase the difficulties in assessing teams, eventually making early predictions more thought-provoking [
9].
The learning environment in engineering education entails evolution. Increased interdisciplinary alliance in disciplines is required. The characteristics of data analytics, robotics, automation, and management are required to be the composite of each engineering domain [
10]. Software engineering is an educational domain that requires hands-on practice to master its concepts [
11]. Software projects carry prime importance in such courses. A software project is an amalgam of process and product. The process focuses on the efficient implementation of the software engineering methodology. The product is the actual product developed by following the software process. Success in a software project is one of the goals of a software engineering course. Students work hard to achieve good grades in their projects. However, there are various misunderstandings and problems associated with the development of such products. Handling these issues at earlier stages and properly guiding students can greatly facilitate a successful software engineering project and provide a sustainable environment for software engineering.
Advanced data analysis and machine learning (ML) have been used in several studies to achieve the goals of ESD [
12,
13]. ML has its roots in multiple domains of educational practices and is a major dimension in educational data mining (EDM), as well [
14,
15]. Methods from EDM are used to better understand students. ML algorithms have become popular in the educational domain. Thus, integrating EDM and ESD with ML is a leading concept to achieve quality education. Predictions of performance, early dropout detection, student engagement in academics, performance in massive open online courses (MOOCs) and the learning management system (LMS) help to determine difficulties in educational practices to succesfully improve the educational domain with artificial intelligence. The prediction and personalization of academic practices are urgently needed [
16]. Education plays an important role in society, being a driver for sustainable development [
17].
The major goal associated with EDM and ESD collectively is to improve the learning process. Models that predict student performance and behaviors are an aid in this regard. It is important to predict students who are at-risk of low performance or dropping out. Traditional database queries cannot help decision-making, but ML can solve the concerns of EDM [
18]. EDM helps to improve learning performance and teaching performance. These approaches can be used to evaluate learning efficiency. Personalized recommendations are also a great way to achieve educational goals [
19]. EDM is utilized for making required predictions from the data set, and decisions based upon predictions eventually lead towards sustainable development. Therefore, assimilating EDM and ESD is a foundation for progressive ESD practices.
This study focuses on the development of a successful J48 decision tree-based technique for predicting student grades for software product development in software engineering courses. The software engineering teamwork assessment and prediction (SETAP) dataset is used for model training and assessment [
20,
21,
22]. SETAP is available from the UCI machine learning library [
23] and consists of evaluations of software product data and software process data collected during student team project development. Team activity measures (TAMs) are defined for each team by measuring and monitoring the student teams during project practice. The data comprise 74 teams with a total of 380 students. Teams are evaluated at 11 different intervals during the software project work. In each evaluation, teams are given a grade of A or F depending on the performance during that phase and after the 11th evaluation. However, the prediction of the final grade at an earlier phase may result in supporting low performing teams by detecting their problems and resolving any misunderstandings or confusion. Sustainable software engineering education is associated with the visualization of future scenarios about students and making a decision accordingly. To provide an environment for sustainable software engineering education, this study evaluates each assessment phase to predict the teams at-risk for software product development. To apply ML, we used WEKA 3.8. The following are the research questions of this study:
Can we predict the final grade of the software product development part of a software project during the initial phases of assessment to achieve sustainable software engineering education?
How efficient is the proposed technique in the context of ESD for the identification of at-risk teams in the development of software products?
The structure of the paper is as follows:
Section 2 presents an overview of related works and research on the specific subject.
Section 3 defines and describes the proposed predictive method.
Section 4 provides the results and presents the prediction performance of the proposed model.
Section 5 presents a thorough discussion, and
Section 6 leaves the reader with concluding opinions and future recommendations.
2. Related Work
Predictions are a vital context of EDM and ESD. Different studies present methodologies for making predictions and recommendations about students and educational contexts. The work in [
24] presented three types of approaches for making predictions about students, including similarity-based approaches, model-based approaches, and probabilistic approaches. Similarity-based approaches work by identifying similar patterns in the analyzed dataset. Model-based approaches work by computing the correlation between data samples. Probabilistic approaches work by calculating the probability distribution between data samples. All of these approaches have associated pros and cons and all were used in multiple studies in the past to make predictions and present convincing results.
The work in [
25] presented the efficacy of deep learning models for predicting student academic performance. This study predicted at-risk students to provide early interventions. A set of features was then extracted from the e-learning system. The deep artificial neural network, logistic regression, and support vector machine algorithms were next deployed to predict student performance. The deep artificial neural network provided an accuracy of 84–93%. The feature evaluation showed that students who have access to previous lectures perform better.
The authors in [
26] proposed a two-layered architecture for predicting the final cumulative grade point average (CGPA) of students. In the first layer, courses were clustered to identify the related courses. This clustering helps identify the courses relevant to the target course for the evaluation of performance. In the second layer, predictors were used in the form of an ensemble to accumulate new student data over time. This helps in the continuous improvement of the model over time. This approach outperformed others compared with the classic machine learning models of logistic regression, linear regression, random forest, and k-nearest neighbor (KNN).
The research in [
27] predicted the performance of students using the submission behavior of students’ assignments. This study predicted student learning difficulties using procrastination behavior called prediction of students’ performance through procrastination behavior (PPP). PPP produced a feature vector for the submission behavior of assignments. Clustering was applied to the feature vectors to cluster students into procrastination-related clusters. This support vector machine outperformed others with 96% accuracy.
The work in [
28] utilized the e-book reading data of students for the development of an early warning system for student performance. Thirteen different prediction algorithms were used to determine the optimum algorithm. All the models were compared by their accuracy and kappa values. The weekly aptitude of the algorithms was observed, showing that after the 15th week, the models yielded the highest performance. Random forest proved to be the best performing algorithm. Data transformation was also applied to determine the differences between the results. J48 offered the best accuracy for the transformed data.
The authors in [
29] raised an important issue about the dropout rate from MOOCs. This problem was discussed as a key issue in past research. In this study, self-regulated learning (SRL) strategies were an important element of the predictive model. The impact of SRL strategies was studied based on the dropout fraction of MOOCs. Two types of SRL strategies, self-reported and event-based SRL, were evaluated for dropout predictions, and event-based SRL strategies were found to be effective for making predictions. Thus, this study used many elements to produce early dropout prediction for students from MOOCs.
The work in [
30] also identified the factors that contribute to the dropout rates of students at different levels of education—primary, secondary, or post-secondary. This study is useful to help school management take the necessary action for improvements.
The study in [
31] predicted student performance during the final examination. The authors developed software that integrates the classification of students. The software identifies low performing students, declaring them as students at-risk. It also predicts student grades and classifies them accordingly. In this way, this software helps improve the performance of at-risk students through early identification. The software can be customized according to the user’s requirements.
The authors in [
32] used multiple ML algorithms with SETAP data. The study applied and compared decision tree (DT), random forest, naïve Bayes, neural network, k-nearest neighbor (kNN), logistic regression, support vector machine, and AdaBoost. Two data sets were used for the evaluation. The neural network worked best for the firts data group, and random forest worked well for the second data group. The study concluded that the performance of ML algorithms is related to dataset and learning circumstances.
The authors in [
33] revealed that there are multiple factors (such as academic, demographic, social, and behavioral factors) associated with the early prediction of student performance. This study presented the role of these factors in the early prediction of students by applying several ML algorithms. DT, Iterative Dichotomiser 3 (ID3), chi-squared automatic interaction detector (CHAID), NB classifier (NBC), rule induction, random forest, and ensemble (EN) learning models were applied to identify at-risk students. The authors concluded that student performance depends on current and previous academic performance. Demographic factors also proved to be key contributors to predicting performance.
The authors in [
34] compared the classification performance of naïve Bayes and the ID3 algorithm in analyzing the academic excellence of college professionals. The predictions demonstrated that a student can be promoted (or not) to the next academic year.
The authors in [
35] determined student performance using multiple ML algorithms. The multi-layer perceptron (MLP) performed best compared with other methods for a dataset of high school students. The authors in [
36] proposed using automated methods for whole information mining.
The authors in [
37] used data encompassing marks of courses in academic years and pre-admission marks to predict the graduation performance of a student. Naïve Bayes attained the greatest accuracy for the prediction among the multiple ML algorithms used in this study.
Thus, predicting student performance, dropout ratios, grades, and other related aspects are the main goals of EDM. Accomplishing these goals provides opportunities to achieve sustainable education. ML is thus helping researchers achieve their goals. However, the complexity of the relevant data, learning algorithms, and learning circumstances plays an important role in the performance of ML algorithms for different types of situations. Thus, selecting a proper algorithm is a challenging task for different educational settings [
38].
3. Materials and Methods
This section describes the materials and methods used to attain the desired objectives of this study.
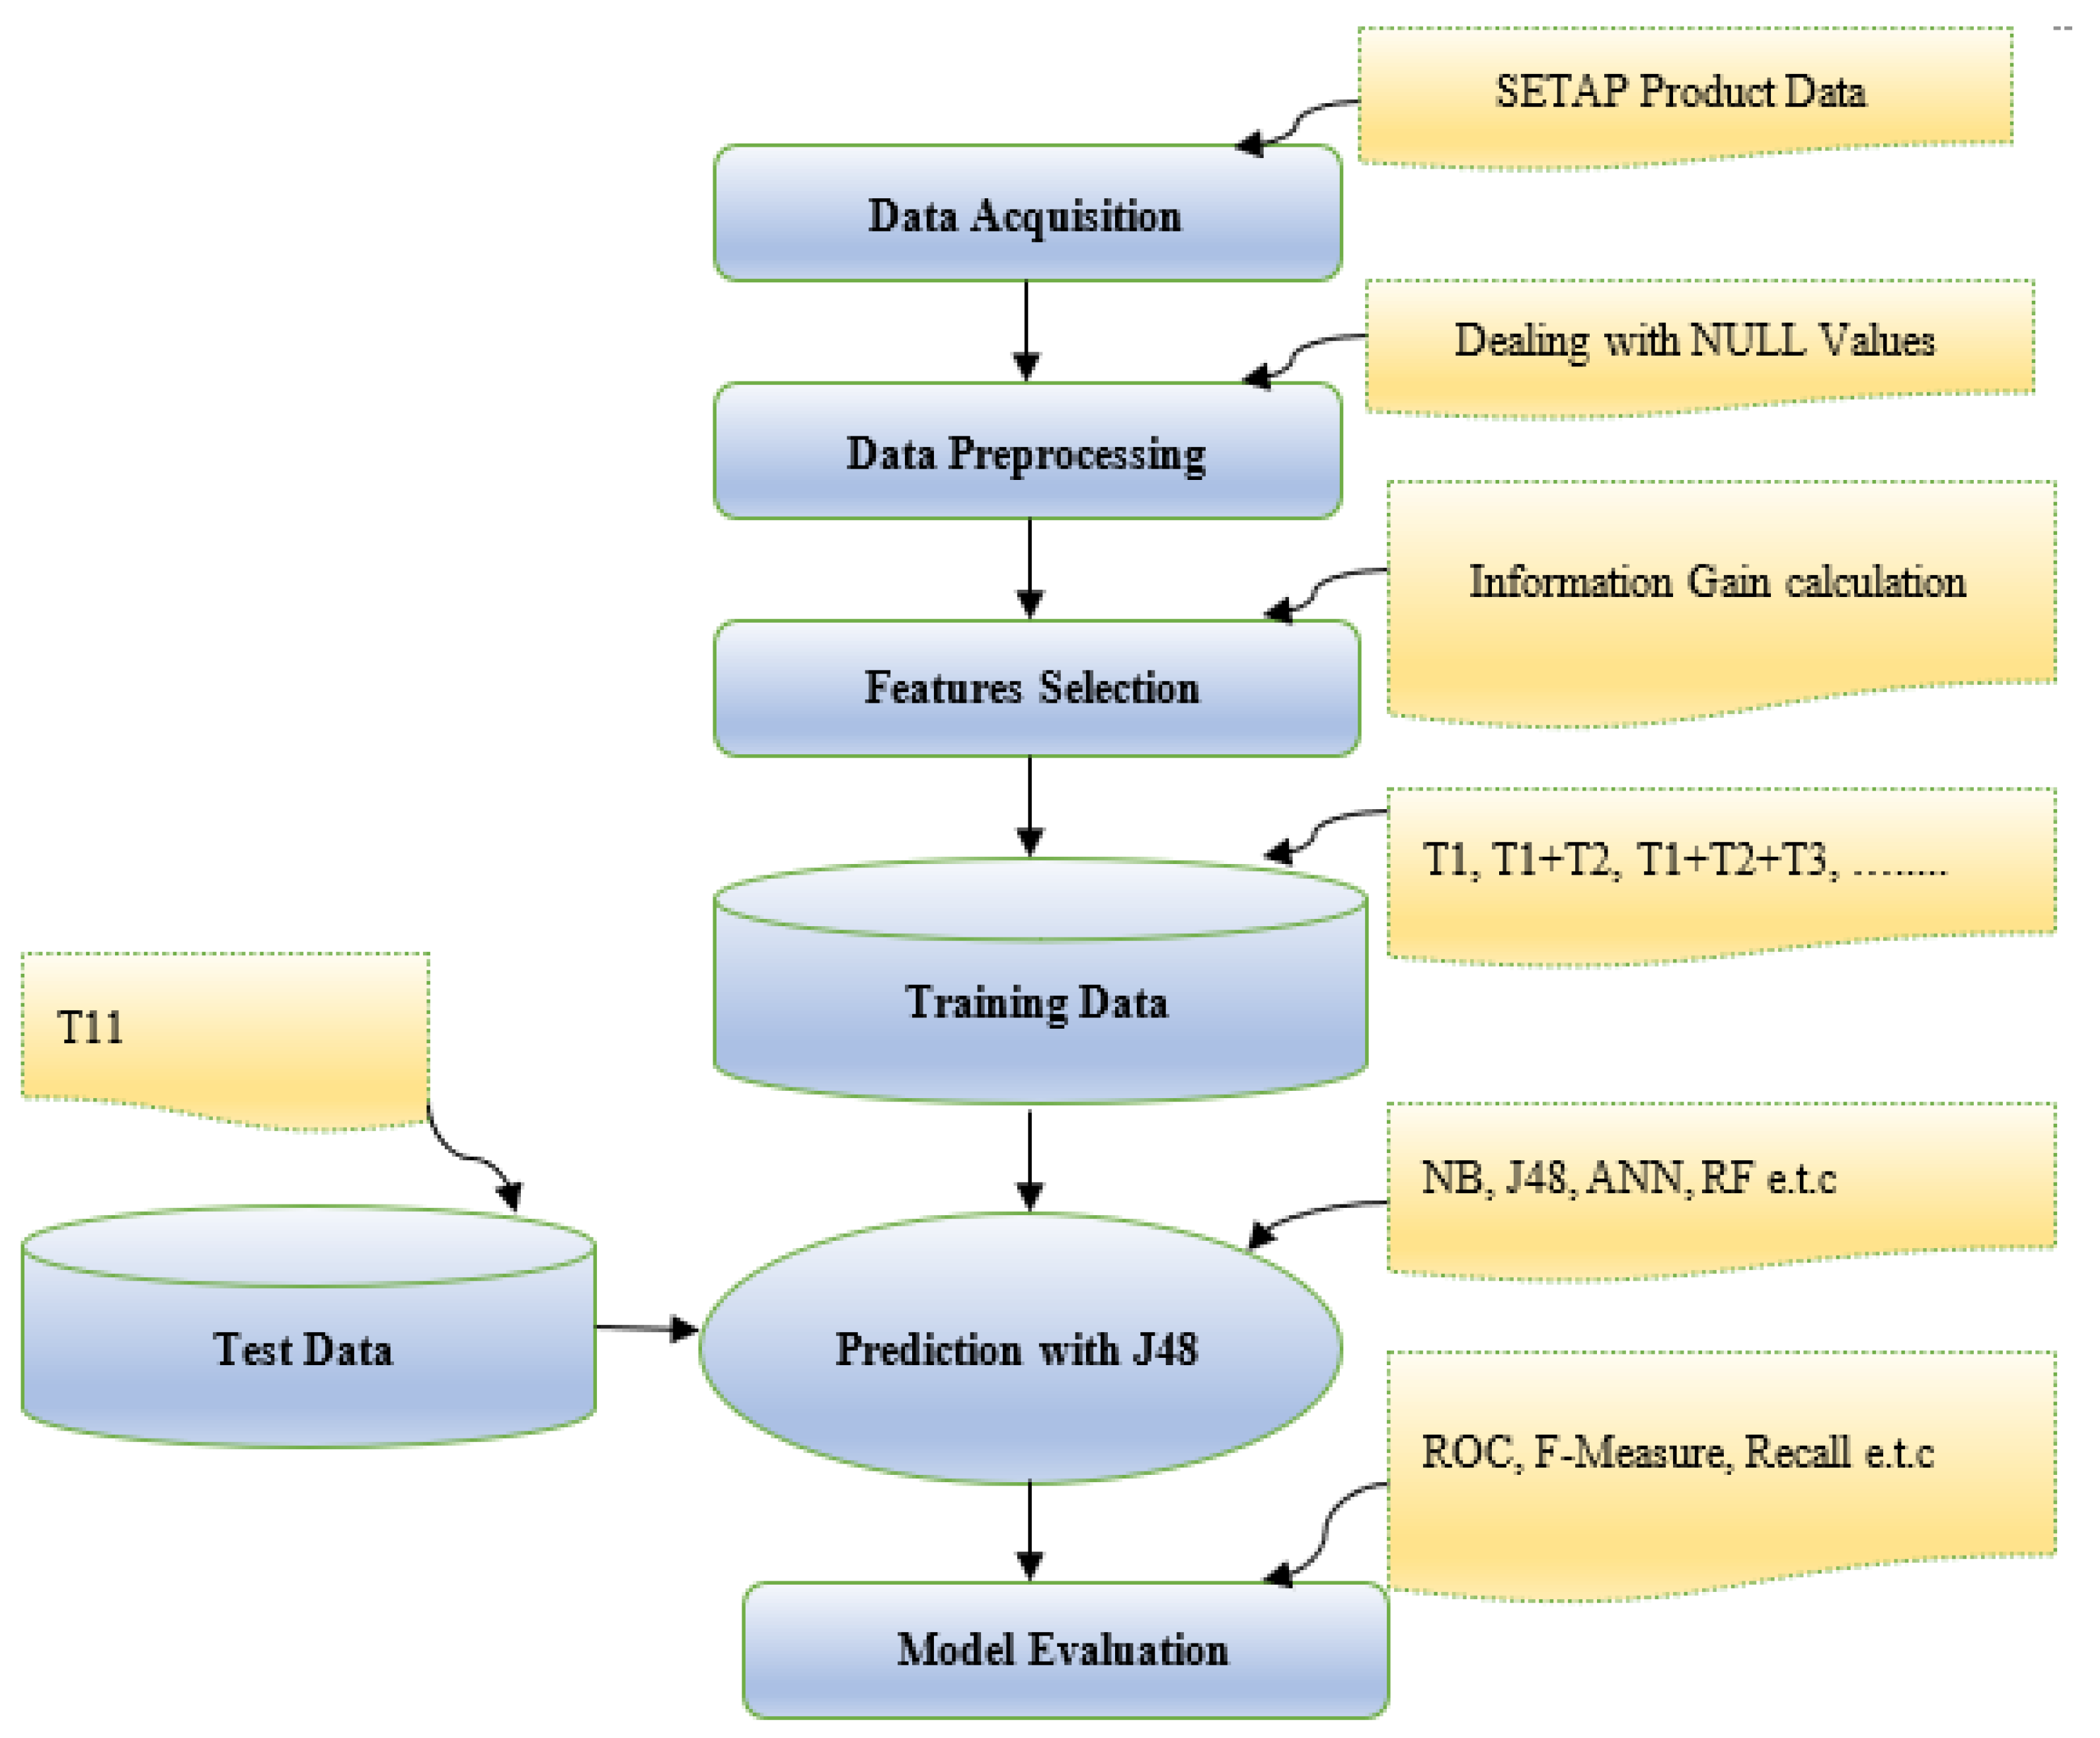
Figure 1 depicts the flow of events utilized for the prediction of team performance during the initial assessment phase of the software engineering project.
3.1. Data Acquisition
The data set utilized in the study includes SETAP product data. SETAP is available from the UCI library. These data consist of two types of data related to a software project: one is product data, and the other is process data. Both of these types of data are considered individual elements of software project evaluation. Software development teams are assessed at eleven different levels of project development based on TAMs. Product and process parts are individually assigned final grades of A or F, with A being above average and F being below average. In this study, software product data are used to predict performance in product development.
3.2. Data Preprocessing
Raw data are transformed into useful data using data preprocessing approaches. Incomplete, inconsistent, and ambiguous information is removed in the data preprocessing phase. The outcome of data preprocessing is clean data. NULL values are observed in the different fields of the raw data set. An important aspect of data preprocessing involves dealing with missing/null values. Null values in SETAP data are catered by filling the average values of the attributes. However, if the values of local teams are declared as NULL for their global variables, they are replaced by 0.
3.3. Feature Selection
Feature selection is imperative when there are a large number of features in the training data. This faciltiates the fast learning of the ML model and decreases the intricacy of the model. The information gain assists in determining the dependence between the feature variable and the target variable [
39]. The information gain calculates the significance of attribute A in class C. The higher the value of the shared information between class C and attribute A is, the higher the relevance between class C and attribute A.
Equation (1) shows the computational method for information gain for feature selection.
where the gain of the class can be computed using Equation (2):
The conditional information gain for a class’s given attribute is computed using Equation (3):
Thus, the features with higher dependence are used for model training. Attributes with greater information gain are more important for the training of models and impact the overall predictions. The target variables are the grades, and the rest of the TAM attributes are features. Attributes that have information gain values equal to or less than zero are not considered for making predictions. The information gain computed for the attributes used for training models is shown in
Table 1.
3.4. Training and Test Data
Each team is assigned the same task in development. All the teams are assessed after a fixed time interval. There are 11 phases of assessments. Teams are assessed according to the TAMs defined as features. TAMs incorporate the records of teams according to their working behavior and co-operation. In each assessment phase (T1–T11), a grade is assigned to each team according to its performance. Performance is assessed according to the values of the TAMs. T1 to T5 are sequentially used as training data, and T11 is utilized as test data. J48 is trained to estimate the earliest possible phase for the prediction of the final grades for software development. Predictions are focused on an accurate assessment of the teams that are expected to achieve below-average grades.
3.5. Predictions Using ML
J48 is a decision tree-based algorithm [
40]. In binary class predictions, J48 has been used efficiently in the past to make predictions in related problems. This study utilized a hybrid approach of J48 with information gain in sequential phases of assessments from T1 to T5. The major goal of the study is to predict the low performing teams. During each phase, the predicted results are monitored to find the earliest possible phase from all 11 phases to predict the final grade.
3.6. Model Evaluation
The best algorithms from the literature to predict a student’s grades were selected for comparison with the proposed approach. Multi-layer perceptron (MLP) [
41] is illustrative of the artificial neural networks that are commonly used as learning algorithms for neural networks [
42]. Simple logistic regression and logistic regression are used based on the probabilistic classifier’s category [
43]. From the support vector machines, the sequential minimal optimization (SMO) algorithm is used, since SMO is one of the fastest training methods [
44]. The NB algorithm is illustrative of Bayesian networks [
45], and the repeated incremental pruning to produce error reduction (RIPPER) [
46] algorithm is selected as a rule-based learning technique. The selected ML classifiers are trained in the initial phases of the software product evaluation. The test data were assessed to predict the final grades in the software product. The performance of each algorithm was comparable in identifying at-risk teams at an earlier stage.
The proposed technique’s results were compared with the selected classifiers using numerous constraints, such as receiver operating characteristic (ROC), accuracy, precision, recall, F-measure, sensitivity, and specificity. The accuracy of each ML algorithm determines the correctly made predictions. However, this study is focused on the early prediction of low performing teams. At-risk teams are the teams that are expected to perform below average in the product development section of the software project. Therefore, this prediction is specifically taken into account to achieve the desired goals of the study.
3.7. Statistical Analysis
The kappa values are next determined to calculate the reliability of the model [
47]. The kappa values are computed for the proposed approach and the comparison algorithms in the initial assessment phases of evaluation to determine their performance. The kappa values can be interpreted as follows:
values ≤ 0, indicating no agreement;
0.01–0.20, no to slight agreement;
0.21–0.40, fair agreement;
0.41–0.60, moderate agreement;
0.61–0.80, substantial agreement;
0.81–1.00, almost perfect agreement.
The kappa statistic indicates how closely the instances classified by the ML model are harmonized with the actual data labels.
4. Results
The ROC curve depicts the relationship between the true-positive and false-positive rates. Sensitivity and specificity are also demonstrated by the ROC and are contrary to each other. The proximity of the ROC curve to the top left corner of the graph determines the best accuracy. If the curve leans more towards a diagonal, the results are less accurate. Relating to the ROC curve, the area under the curve (AUC) represents the area under the ROC curve [
48]. The value of the AUC indicates the model performance as represented below:
The J48-based information gain hybrid approach is used for making predictions, and evaluation measures are used to observe the results at each phase. There are 11 phases of assessment in which the students are assessed after a specific time interval based on the ongoing progress of their project. We aimed to determine the earliest possible phase for prediction. The prediction outcomes of the initial phases, starting from the first phase of the assessment of the teams, are described below.
4.1. First Assessment Phase
To predict the grades as early as possible, the classifiers are trained by using the first phase of assessment as the training data. To determine the at-risk teams, the performance of the models is focused on predicting a grade of F (a below-average grade). This depicts how accurately the models can predict performance that is expected to be below average.
Table 2 provides a comparison of the performance of each model with the proposed approach during the first assessment phase, where the TP rate represents the true positive rate and FP rate represents the false positive rate for predicting class F.
The graphical representation of the results can be observed in
Figure 2 for each evaluation category. The accuracy determines the overall accuracy of the classifiers for all instances.
There are no clear predictions at this stage of assessment. Thus, the second phase of the assessment was evaluated to obtain greater prediction clarity.
4.2. Second Assessment Phase
Collectively training the models with T1 and T2 results in varying performance among the models. This step trains the models by taking into account the team performance in phase 1 and phase 2 of the software product development.
Table 3 depicts the results.
A graphical representation for visual interpretation is depicted in
Figure 3. The accuracy illustrates the model’s overall accuracy of correct predictions.
The results provide better predictions than those of the first phase but still, they are not satisfactory at this stage. Thus, the third phase of the assessment was observed to mark further differences.
4.3. Third Assessment Phase
The results obtained after the second phase of assessment were not satisfactory. Thus, the models were trained during the third phase of assessment to predict the final grades.
Table 4 illustrates the performance of the models and the proposed approach after the third assessment to predict the teams at risk.
Figure 4 provides a better interpretation of performance for each model through a visual illustration, depicting the accuracy of the classifiers for all instances, as well as the recall, precision, and F-measure for the prediction of at-risk teams.
The predictions of low performing teams improved with each subsequent phase. At this stage, logistic regression offers a 76.6% F-measure to predict low performing teams, while the proposed approach provides a 64.20% F-measure. The accuracy of the proposed approach is 74.32%. The fourth phase is then assessed to determine the impact.
4.4. Fourth Assessment Phase
We next tested the fourth assessment level to obtain better predictions for low performing teams. Comparing the algorithms with the proposed approach resulted in the performance prediction results shown in
Table 5.
A graphical depiction of the obtained results is shown in
Figure 5. The accuracy of the classifiers is depicted in the accuracy section.
The results after this phase were convincing. The proposed approach achieved an 87.7% F-measure and a 90.54% overall accuracy. Thus, the fourth phase is the earliest phase that can predict low performing teams, which would otherwise be observed after the 11th assessment. To check any further improvement, a fifth assessment phase was also employed.
4.5. Fifth Assessment Phase
The results obtained by the performance of models in the fifth level of the assessment revealed better predictions, as depicted in
Table 6.
The graphical representation offers a better interpretation for each classifier, as shown in
Figure 6.
The proposed approach consistently performs efficiently in this phase, as well. The 85.7% F-measure and 89.18% accuracy show that the proposed approach offers better performance than other state-of-the-art methodologies.
5. Discussion
Performance prediction carries prime importance in ESD and will pave the way towards better academic facilitation services for students and teachers. ESD demands an educational system should be such that even the low performing students be educated in a way that their activities, or life, carries no threat to humanity or even to themselves [
49]. Therefore, understanding students’ problems and motives for misinterpretations and low performance carries significant importance. Studies collecting online data from e-learning systems demonstrated the effectiveness of early predictions in previous studies. Many studies generate outcomes using ML for better academic practices in technology-based learning environments. However, this task becomes difficult when data are not automatically generated. The same occurs in a project-oriented educational environment. Software engineering is a project-based learning field. Students must work in teams and produce projects with above-average scores to eventually pass the course. Earlier predictions focused primarily on the working behaviors of teams. Therefore, multiple phases of assessments help keep track of the performance of each team. However, the early prediction of at-risk teams and low performers involves the application of ML practices. The SETAP dataset is itself comprehensive, allowing one to track the performance of software teams through 11 phases of assessments. A hybrid approach of information gain and a J48 decision tree was applied in the assessment phases to assess if performance can be predicted. The results revealed that it is possible to predict the performance of teams at earlier stages of evaluation to achieve sustainable software engineering education with the help of the proposed approach by keeping the prediction of low performing classes significant with an overall accuracy of the approach. The regular registration of TAMs is important to achieve efficient results. TAMs are measures that outline the level of performance of each team in different areas. Predicting final performance with the proposed approach resulted in determing the low performers. The identification of low performing teams will result in recognizing their problems, misunderstandings, and confusion.
Thus, to appraise the optimum prediction, the proposed approach was applied at the first level of assessment and sequentially onwards until achieving satisfactory results. The first three assessment levels did not produce suitable predictions. The results revealed acceptable predictions at the fourth assessment level and much better predictions at the fifth assessment level. At level five of the assessment, the on-risks teams could be identified. The ROC curves depict the performance of the proposed model and the comparative models at the fourth and fifth levels, as shown in
Figure 7 and
Figure 8.
In both cases, the ROC curve of the proposed approach extends along the vertical axis, producing the best performance with the highest AUC. The kappa values of the proposed approach are the highest, thereby highlighting the efficiency of the model.
Table 7 provides the performance of each algorithm at assessment levels four and five.
The contributions of this study can be summarized by answering the research questions raised in
Section 1 (Introduction).
- 1.
Can we predict the final grade of the software product development part of a software project in the initial phases of assessment to achieve sustainable software engineering education?
Yes, we can predict the final grades for software products at earlier stages of evaluation using the proposed hybrid approach of information gain with the J48 decision tree. Assessment level five makes predictions by showing the practical values of the precision, recall, and F-measure. Early predictions are associated with achieving sustainable software engineering education. Decision-making can thus be performed to provide quality education based on predictions.
- 2.
How efficient is the proposed technique in the context of ESD for the identification of at-risk teams in the development of software products?
Multiple classifiers are used to compare the proposed approach to check its efficiency for the prediction of team performance, specifically considering the prediction of low performing teams. The proposed approach outperformed other methods at assessment levels four and five. At level five, the proposed approach achieved a convincing true positive rate of 0.75 in predicting the below-average grades of teams. An efficient technique for making predictions leads to the development of a competent method for ESD. ESD is associated with looking into the future and making decisions and strategies accordingly. Hence, in this scenario, the identification of at-risk teams proved to be an important concern for ESD. This resulted in the development of a more synchronized approach to follow for a successful software engineering project. The approach helps to accomplish sustainable education goals by providing maximum opportunities for success for all teams.
Earlier predictions for software product development can help instructors identify low performing teams. This approach can bridge the gaps associated with providing sustainable software engineering education. Looking into the future and making policies accordingly are major aspects of ESD. Early predictions can help instructors and students understand the final grades they should expect. These data can help elucidate the weaknesses associated with the students’ current performance and help them improve their performance. Helping the maximum number of students be successful in their projects and reducing their frustration and stress related to poor performance can be achieved if proper practices are followed. Extra sessions can be conducted to resolve any problems and help students overcome the hurdles of their work. Teams can also resolve any co-ordination issues related to low performance.
The objective of sustainable development is to alleviate our ecological, financial, and social requirements [
50]. Industries across the world are changing due to amplified digitization. Industrial expansions are arising the need for improvements in the education sector as well [
51]. Coaching and learning practices are also obligatory to encourage learners to progress and educationally move toward sustainable development. Critical thinking, envisioning the future, and engaging in decision-making are the skills that ESD promotes [
52]. Hence, this approach has great prospects for improving software project evaluations and improving the success rate of software engineering courses to provide sustainable software engineering education.
6. Conclusions and Future Work
Sustainable development has been recognized as the integration of ecological, fiscal, communal, and educational structures. Therefore, it realizes the definition from the multidisciplinary perspective. ESD becomes further promising in this regard by incorporating technological innovations, ML, and AI. This paper proposed a hybrid approach of information gain and J48 decision-tree for early predictions of low performing teams in the software engineering product development portion of a software project. TAMs play an important role in the development of a comprehensive data set for performance prediction. For software product development, the teams were assessed using 11 different phases with the SETAP data. The proposed approach, when compared with other state-of-the-art classifiers, provided superior results when predicting the final performance at the fifth level of assessment. The performance predictions were proven to be an important aspect of ESD. This study technically proved that, like technology-oriented learning, a project-oriented educational environment can also benefit from ML classifiers for the early prediction of low performers. This will eventually help develop a successful academic system that fulfills the goals of sustainable education by providing quality education. This will lead to better team–instructor synchronization. However, the proper tracking of teamwork is compulsory for the execution of this whole scenario. In the future, we aim to rank the TAMs to determine which one contributes most to the low performance of teams. Deep learning can be applied to this system if more teams are required to be assessed. Hence, artificial intelligence should be further explored to resolve academic issues that hinder ESD.


