Article

Deforestation and Subsequent Cultivation of Nutrient Poor Soils of Miombo Woodlands of Tanzania: Long Term Effect on Maize Yield and Soil Nutrients

by
Meley Mekonen Rannestad
1 and
Tigist Araya Gessesse
2,*
1
Faculty of Environmental Sciences and Natural Resource Management (MINA), Norwegian University of Life Sciences (NMBU), P. O. Box 5003, No-1432 Ås, Norway
2
Department of Land Resources Management and Environmental protection, Mekelle University, Mekelle P. O. Box 231, Ethiopia
*
Author to whom correspondence should be addressed.
Sustainability 2020, 12(10), 4113; https://doi.org/10.3390/su12104113
Submission received: 7 April 2020 / Revised: 7 May 2020 / Accepted: 14 May 2020 / Published: 18 May 2020
(This article belongs to the Special Issue Sustainable Soil Health Management)

Abstract

:
The miombo woodlands of Tanzania have continued to be subjected to deforestation due to mainly agricultural expansion. Knowledge of long-term productivity of the subsequent land use can help to evaluate the sustainability of the existing land management systems. We used both socioeconomic and soil survey data to assess maize yield and selected soil properties, respectively, with an increasing cultivation period since conversion from miombo woodland. Data on maize production was collected from 121 households in three villages, while soil sampling was undertaken on 15 plots in one of the study villages. Soil samples were taken from miombo woodland and from croplands with cultivation periods varying from two to 52 years. Samples were taken at 0–10 cm and 10–20 cm depths and analyzed for the major plant nutrients. According to the results of the socioeconomic data analysis, continued cultivation of former miombo woodlands does not have a significant effect on maize yield. The results of the soil analysis also showed that the major plant nutrients on farmlands in both soil layers did not show a significant change from the adjacent miombo woodland and did not decline with increasing cultivation period. This indicates that the current farming system can maintain the levels of the major plant nutrients and thus soil productivity.

1. Introduction

Deforestation and subsequent land degradation are common challenges worldwide [1,2]. The global annual loss caused by land degradation is estimated to be USD 40 billion [3]. Expansion of agricultural lands have been reported as one of the main causes of land degradation [4]. This in turn has been resulting in soil quality deterioration and loss of productivity [1].
The miombo woodlands of sub-Saharan Africa have been one of the areas subjected to deforestation and forest degradation [5]. The Tanzanian miombo woodlands, which cover a significant part of the country [6,7,8], have also been declining at an average rate of about 1% (400,000 ha) per year since the 1980s [7]. Agricultural expansion has been considered as one of the main proximate causes of deforestation in the country [9,10,11,12,13]. On the other hand, there has been a growing demand for environmental services such as carbon sequestration provided by tropical forests and woodlands owing to the recognition of payments for ecosystem services [14]. Sustainable agricultural production has been suggested as one way of limiting the expansion of agricultural land, and thus deforestation [15].
The financial justification for deforestation in developing countries in general is because agriculture provides higher economic return than standing forests and woodlands. Alternatively, scientists argue that the profitability of deforested land is short-term, as the soil loses its fertility, and consequently its productivity, over time. Several studies e.g., [16,17,18,19,20] showed that deforestation and subsequent land use for crop production in general leads to deterioration in soil chemical, physical, and biological properties. This is mainly due to changes in the amount and quality of organic carbon input to the soil [21]. The rates of change, however, differ greatly both between and within farms [21,22] depending on several factors such as inherent variation in soils, particle size distribution, type of cultural practices, and soil conditions prior to conversion [21]. On the other hand, little effects of clearing and continuous cultivation on soil properties have been reported. For example, Hati et al. [23] observed that the soil organic carbon (SOC) content in unfertilized plots did not change after 31 years of continuous cultivation. Improvements in plant available nutrients after conversion are also reported. For example, Lemenih et al. [24] observed an increase in concentrations of exchangeable K and P in croplands cultivated for up to 53 years. Therefore, understanding the relationship between deforestation and the dynamics of productivity of the subsequent land use is important for the sustainable management of land.
The aim of this study was to assess the long-term responses of permanent conversion of miombo woodland into small-scale farming systems to maize yield and selected soil properties. This can help to predict the dynamics of agricultural production for better valuation of actual and potential returns to land use change. Besides, this can provide information in designing compensation-based climate change mitigation measures such as REDD+ (Reducing Emissions from Deforestation and Degradation), which requires information on returns to alternative uses of forest land.

2. Materials and Methods
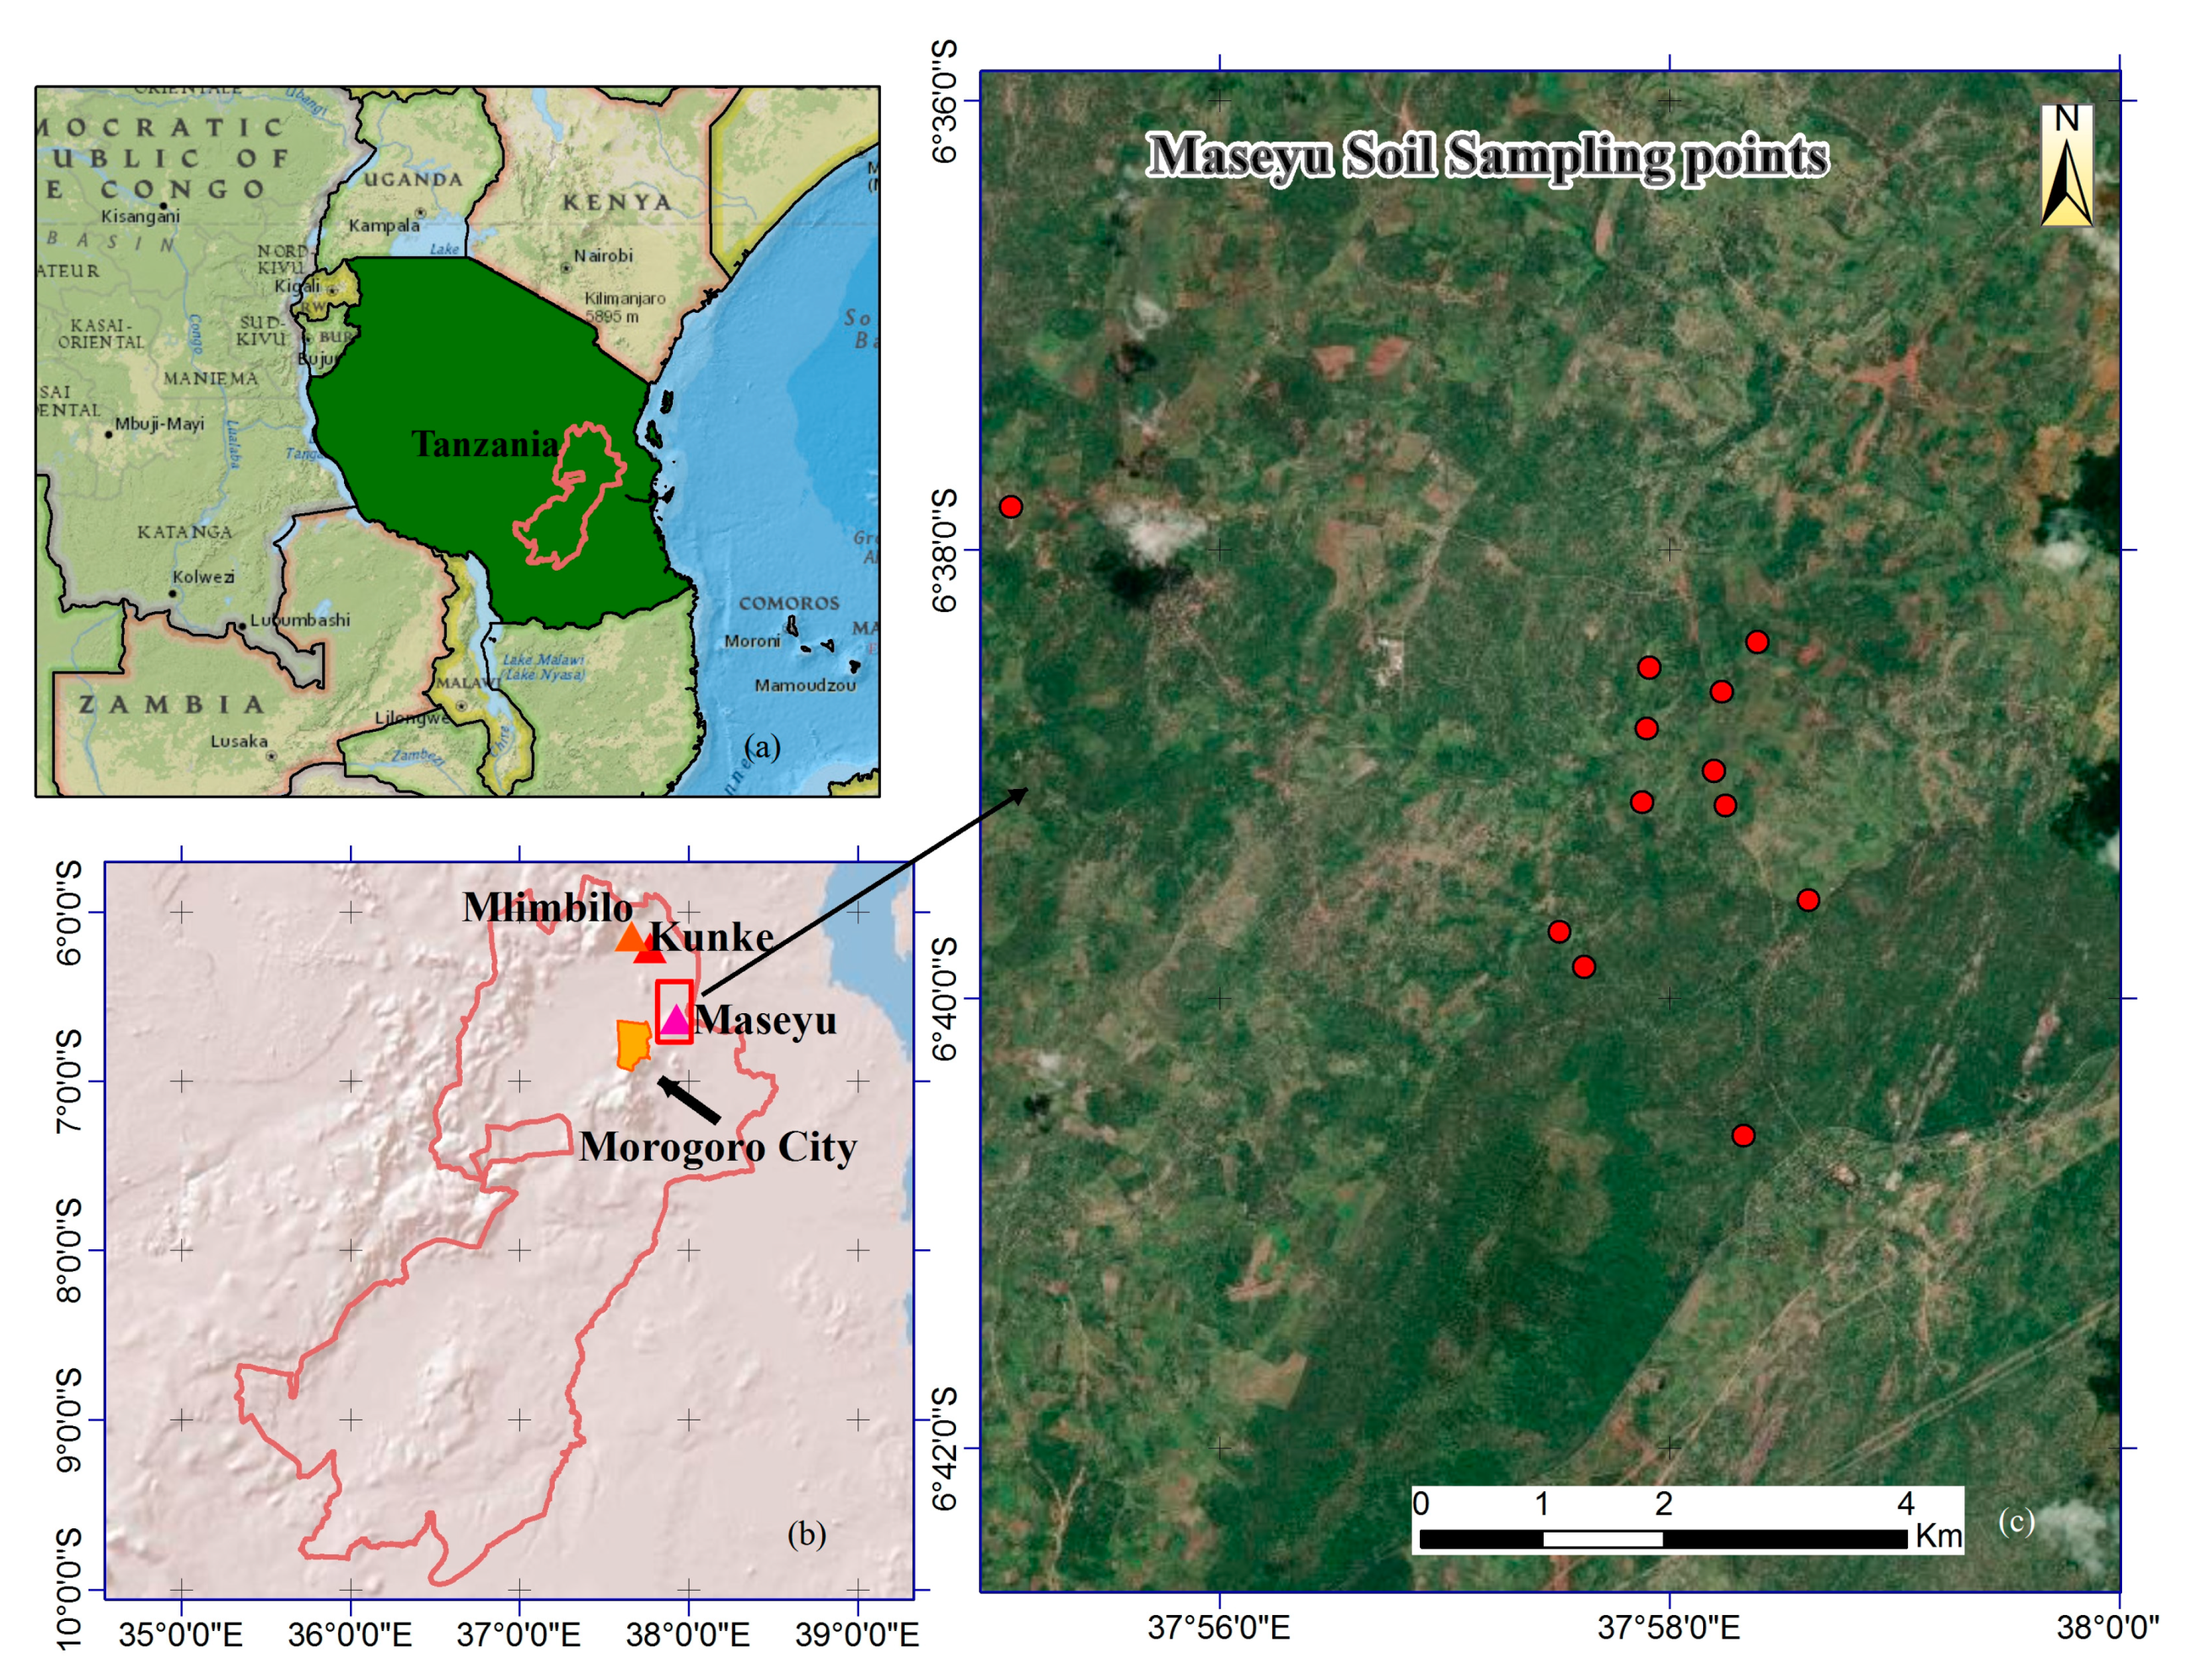
2.1. Study Sites

We selected three villages namely, Kunke, Maseyu and Mlimbilo, from the Morogoro region in eastern Tanzania (Figure 1). Kunke and Mlimbilo are located 120 km north of Morogoro town, the capital of the region, while Maseyu is located 50 km east of Morogoro town along the road to the country’s largest city, Dar es Salaam. The climate in the region is generally characterized as sub-humid tropical, with a mean annual rainfall ranging from 800 to 1200 mm [25]. The rainfall has a bimodal distribution with the short rains falling from October to December and the long rains falling from March to June. The mean annual temperature ranges from 28 to 31 °C [25]. The soils in the area vary according to topography and parent material but in general they are well drained red sand clay loam with a pH ranging from 5 to 5.5. In valley bottoms, Mollisols and Inceptisols are dominant [26]. The parent material of the soils is neogene colluvium, derived from metasedimentary rocks rich in garnet-biotite gneisses with microcline and muscovite [27]. The mean annual soil temperature is categorized under iso-hyperthermic (>22 °C) [27]. The vegetation type is generally characterized as open dry miombo woodland [25], with an average above ground biomass density of 40 Mg ha−1 [7].

2.2. Farming Systems

The livelihoods of the people in the three study villages depend mainly on small scale subsistence farming. About 80% of the inhabitants cultivate maize (Zea mays L.) while millet (EleusinecoracanaL.) and sesame (SesamumindicumL.) are also common crops [28]. The size of farmlands ranges from 0.4 to 6.0 ha [28]. The mixed farming system in the area integrates crops and scattered trees. This system can be considered as a parkland agroforestry system, which refers to farmlands or recently fallowed fields with scattered multipurpose trees selected and protected by the farmers [29]. The most common tree species found in the croplands include Albizzia harveyi, Anacardium occidentale, Combretum collinum, Dalbergia melanoxylon, Mangifera indica and Sclerocarya birrea ssp. Caffra. Site preparation usually involves the burning of herbaceous plants and crop residues. Soil fertility management in the study villages generally does not involve the application of commercial fertilizers, but animal manure is widely used. Livestock rearing is also a source of livelihood for some inhabitants, and free grazing is the common system practiced in the area.

2.3. Data Collection

The effect of continuous cultivation on land quality and productivity can be assessed by quantifying yields across farmlands with different cultivation periods, or by evaluating the condition of key indicators of soil quality such as available plant nutrient reserves under farmlands of different cultivation periods [16]. In our study, data on both crop yield (maize) and selected soil quality indicators were collected to evaluate agricultural productivity in relation to the number of years the plots have been under cultivation since conversion from miombo woodlands.

2.3.1. Socioeconomic Survey

The socioeconomic data from the three villages were collected in January 2012. A total of 30 households were randomly selected from Kunke, 54 from Maseyu, and 37 from Mlimbilo. The selected households represent 15% of the total households in the corresponding villages. Basic demographic information, data on maize yield per hectare and characteristics of each farm plot were obtained using structured questionnaires.

2.3.2. Soil Sample Collection and Analysis

The soil samples were collected from Maseyu village only due to practical reasons, including its proximity to the University where the soil analysis was conducted. Moreover, as this village has been subjected to continuous deforestation for more than 50 years due to its proximity to the road and settlement area, the probability of getting farmlands cultivated for more than 50 years is very high in this village compared to the other two villages. For this study, 12 farmlands with similar topographic, climatic and edaphic conditions, as well as management history, were selected (Figure S1). Most of the plots are located near the household’s residence. The slope of the farmlands can be described as level to mid hill with low to no risk of soil erosion. The average altitude of the farmlands is 708 m a.s.l. Management of all farmlands does not involve the use of chemical fertilizers, pesticides, and irrigation. The farmlands had been cultivated from 2 to 55 years since conversion from miombo woodlands. The year when each farm was cleared for crop production was determined by interviewing the landowners and village administrators. An additional three sample plots were selected from miombo woodlands in the adjacent Kitulangalo forest reserve (Figure S1). This was done to detect possible changes due to the conversion and subsequent continuous cultivation of miombo woodlands.
Soil sampling was done in November 2011, during the non-cropping season. In each of the 12 plots on croplands and 3 plots on the miombo woodland, a 20 m × 20 m sampling plot was established. In each sampling plot, five mini-pits, four at the corners and one at the center of the plot, were dug to a depth of up to 25 cm using a shovel. Soil samples were collected from each pit at two depths (0–10 cm and 11–20 cm). The five soil samples from each sampling plot at each depth were mixed to get a composite sample. Each composite sample was placed in a labeled plastic bag and was taken to the soil laboratory at Sokoine University of Agriculture in Morogoro, Tanzania. The soil samples were air dried and sieved through a 2 mm sieve for chemical analysis. Another set of undisturbed soil samples, for bulk density determination, were collected using a core sampler from the two above mentioned depths. The samples were oven dried to a constant weight at 105 °C and the bulk density was determined with the core using a gravimetric method [30].
Total nitrogen (Total N) was determined with Kjeldahl method [31]. Available phosphorus was extracted by the Bray and Kurtz-1 method [32] and it was determined using a spectrophotometer [33,34]. Exchangeable potassium was extracted by saturating soil with neutral 1M NH4OAc [35] at a pH of 7, and the extracted potassium was measured with an atomic absorption spectrophotometer. Soil pH (H2O 1:2.5) was analyzed using a pH meter. Texture was determined in soil suspension by hydrometer method [36]. Soil organic carbon concentration was determined by the wet oxidation method of Walkley and Black [37]. The Soil organic C stock (SOC) (g m−2) was then calculated using the formula,
SOC = SOC * BD * D * 100
where: SOC is the carbon stock in g m−2 of a sample depth, D, the depth of a sample layer (cm), BD, the bulk density in g m−3 of a sample depth D, and SOC, the carbon content in g 100 g−1 soil of a sample depth. The same equation was applied to estimate the stock of Total N (g m−2) for each soil layer.
We further calculated Carbon to Nitrogen ration (C: N ratio) using the following formula.
C:N ratio = SOC stock/Total N stock

2.4. Data Analysis

2.4.1. Socioeconomic Data

Agricultural yield was assessed along farmlands with different ages since conversion from miombo woodland. In addition to the important variable, cultivation period (age of a given plot), other factors (explanatory variables) thought to have both fixed and random effect on maize yield, were also considered in the analysis. Descriptions of the explanatory variables used in the analysis are summarized in Table 1. Farmlands used only for maize production were considered in the analysis. Consequently, the total number of farm plots used for this analysis was 94. Before analysis, explanatory variables were tested for correlation between each other. When two variables were strongly correlated, only one was considered in the analysis. A linear mixed-model was applied to examine the effect of the different explanatory variables on the response variable (maize yield). A reason for choosing a mixed-model was to be able to incorporate a random variable; in this case the administrative unit (village) into the model.

2.4.2. Soil Data

To compare the mean value of each soil parameter among cultivation periods, the cultivation period of the plots was categorized into 4 groups: 1–10 years, 11–20 years, 21–30 years and >30 years. The miombo woodland was considered as control (0 years). One-way analysis of variance (ANOVA) was used to detect statistically significant differences in mean values of each soil parameter per depth among the different categories of cultivation periods. Pair-wise comparisons of the means of each soil parameter per depth between the different cultivation period groups were made using Tukey’s studentized test. A significance level of α = 0.05 was used. The statistical software, R version 3.6.1. [38] was used for all statistical analysis.

3. Results

This section is divided by subheadings; it provides a concise and precise description of the experimental results, their interpretation as well as the experimental conclusions that can be drawn.

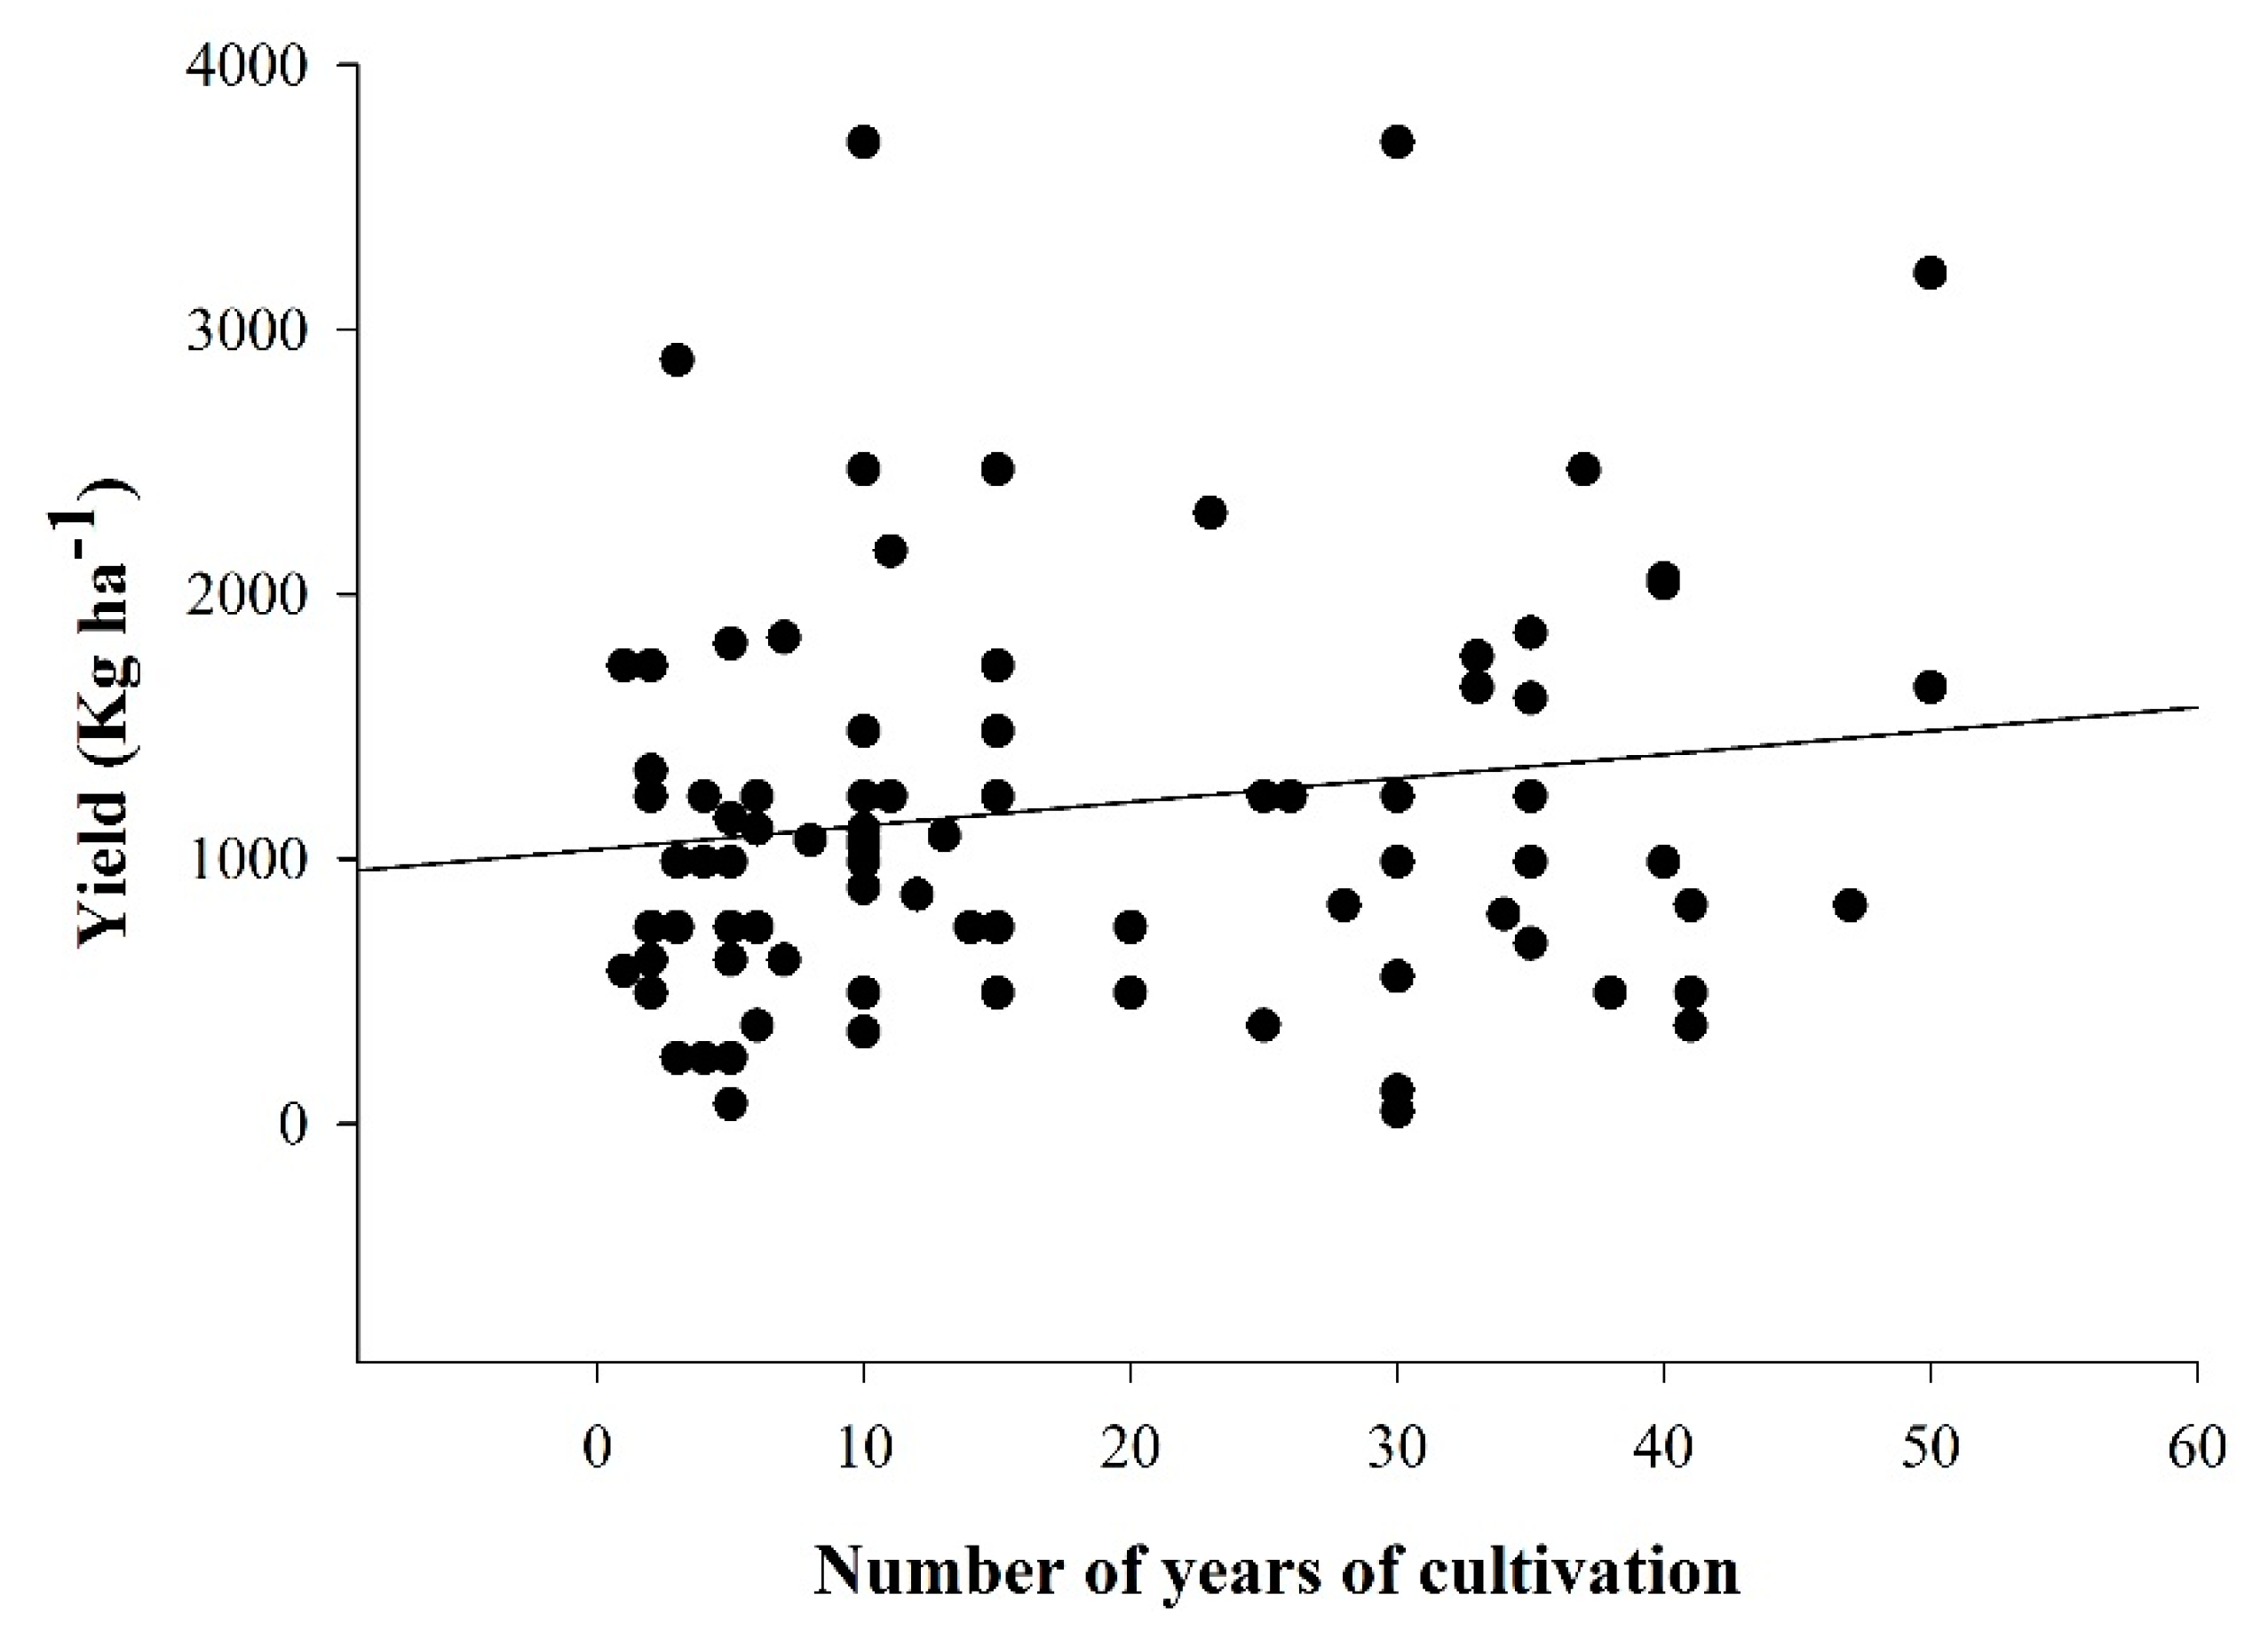
3.1. Maize Yield and Cultivation Period

The average yield per hectare was 1.19 ton (Figure 2). The results of the linear mixed model analysis showed that the number of years of continued cultivation of the former miombo woodlands did not have a significant effect on maize yield. Of all the other explanatory variables included in the model, distance from household (DHH) and land quality (LQ) showed significant effects on maize yield at 1% and 5% levels of significance, respectively (Table 2). However, the yield in the three different villages showed insignificant variation.

3.2. Soil Properties Responses to Land-Use Conversion and Continuous Cultivation

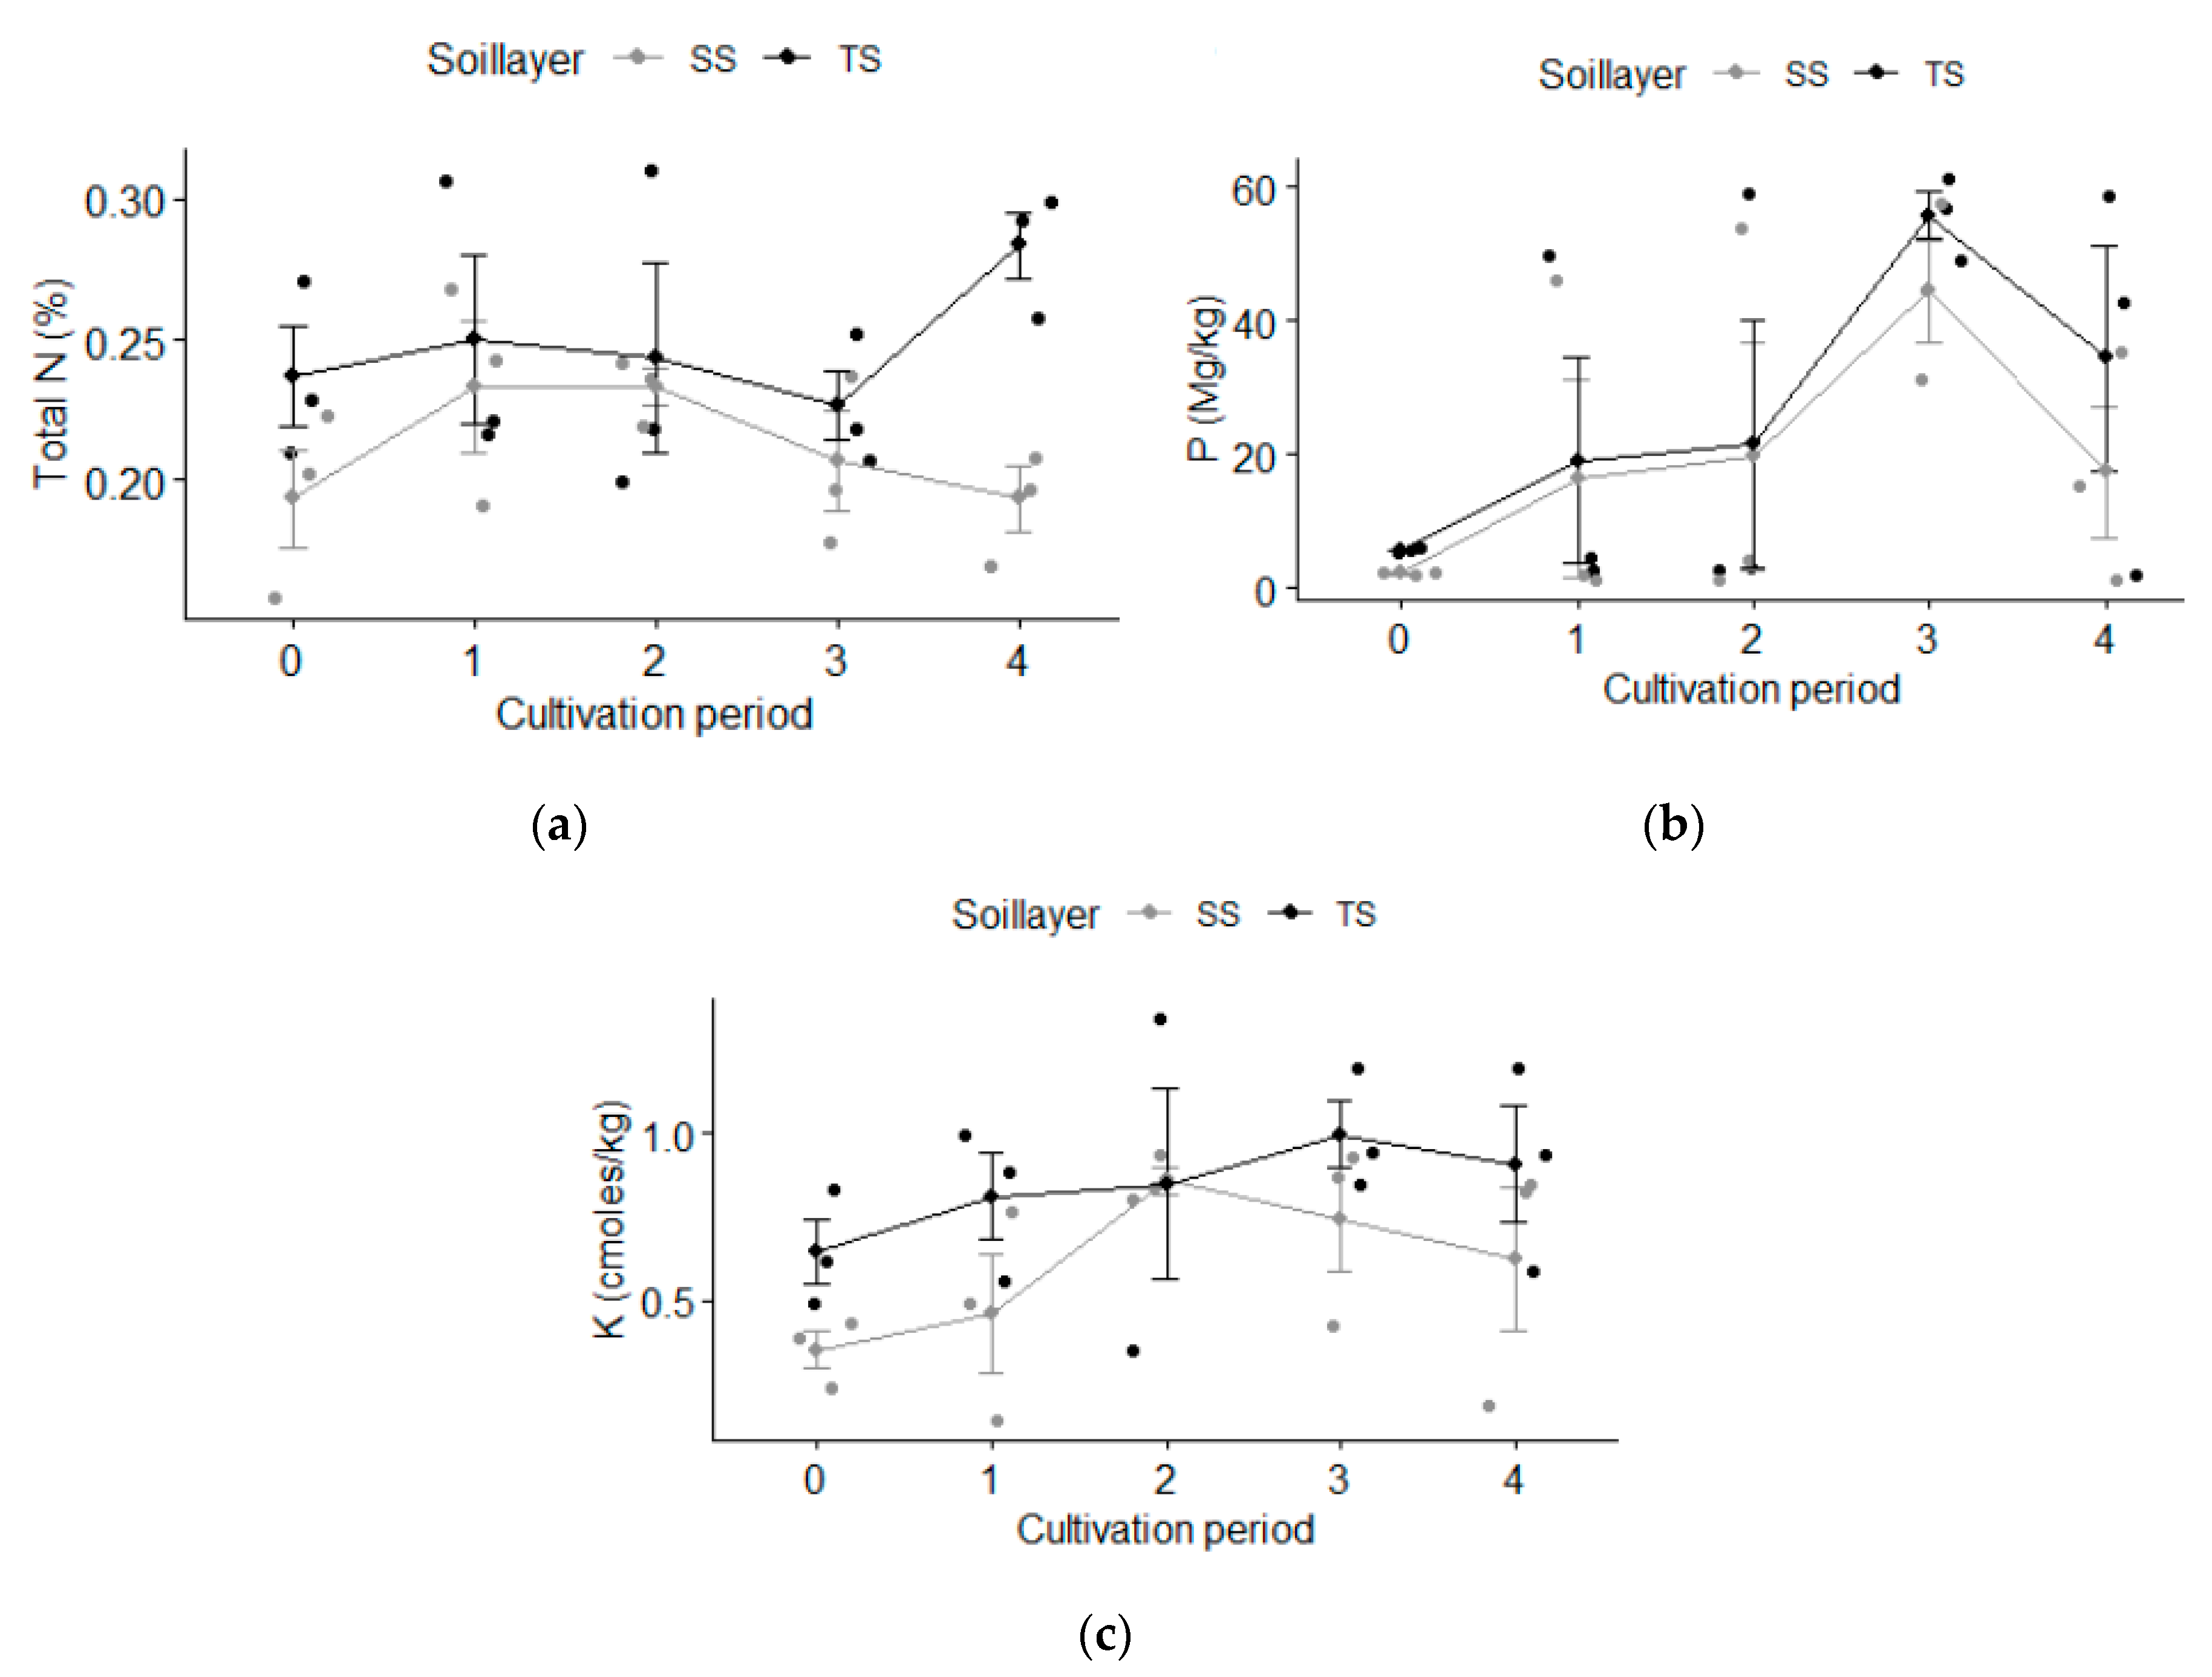
3.2.1. Major Plant Nutrients (N, P and K)

The mean N concentration in the miombo woodland was 0.24 ± 0.02% and 0.19 ± 0.02% in the upper and lower soil layers, respectively (Table 3). In the croplands, it ranged between 0.23 ± 0.01 and 0.28 ± 0.01% in the upper and between 0.19 ± 0.01 and 0.23 ± 0.02% in the lower soil layer (Table 3). The variation in average N between the miombo woodland and the croplands was not significant. In the croplands, average N (%) in the lower soil layer declined with increasing cultivation period, but not significantly. In the upper soil layer however, a consistent trend was not observed (Figure 3).
Available P was generally higher in the croplands compared to in the miombo woodland (Figure 3). Average P in the woodland was 5.64 ± 0.16 mg kg−1 and 2.20 ± 0.12 mg kg−1 in the upper and lower soil layers, respectively, while in the croplands it ranged from 19.15 ± 15.98 to 55.71 ± 3.50 and from 16.38 ± 14.83 to 44.38 ±7.63 in the upper and lower layers, respectively (Table 3). The variability in P within the cultivation period category was very high and there was no clear relationship between cultivation period and P concentration.
The average concentration of K on the miombo woodland was 0.65 ± 0.10 (cmoles kg−1) and 0.35 ± 0.06 (cmoles kg−1) in the upper and lower soil layers, respectively (Table 3). In the croplands, it ranged between 0.81 ± 0.13 and 1.00 ± 0.10 (cmoles kg−1) in the upper soil layer and between 0.46 ± 0.18 and 0.86 ± 0.04 (cmoles kg−1) in the lower soil layer (Table 3). The average concentration of K in the lower soil layer was significantly higher (p < 0.01) on the croplands compared to the same soil layer in the miombo woodland. In the upper soil layer however, the difference was not significant. The variation in average K between the different age categories of croplands was also insignificant for both soil layers.

3.2.2. Soil Bulk Density (BD)

The results of the bulk density analysis showed that it significantly declined in the first 2–7 years of cultivation but remained unaffected following deforestation and continuous cultivation in both soil layers. In general, BD on the lower layer was higher than in the upper layer except for the third cultivation period category in which the BD in the upper and lower layer was the same.

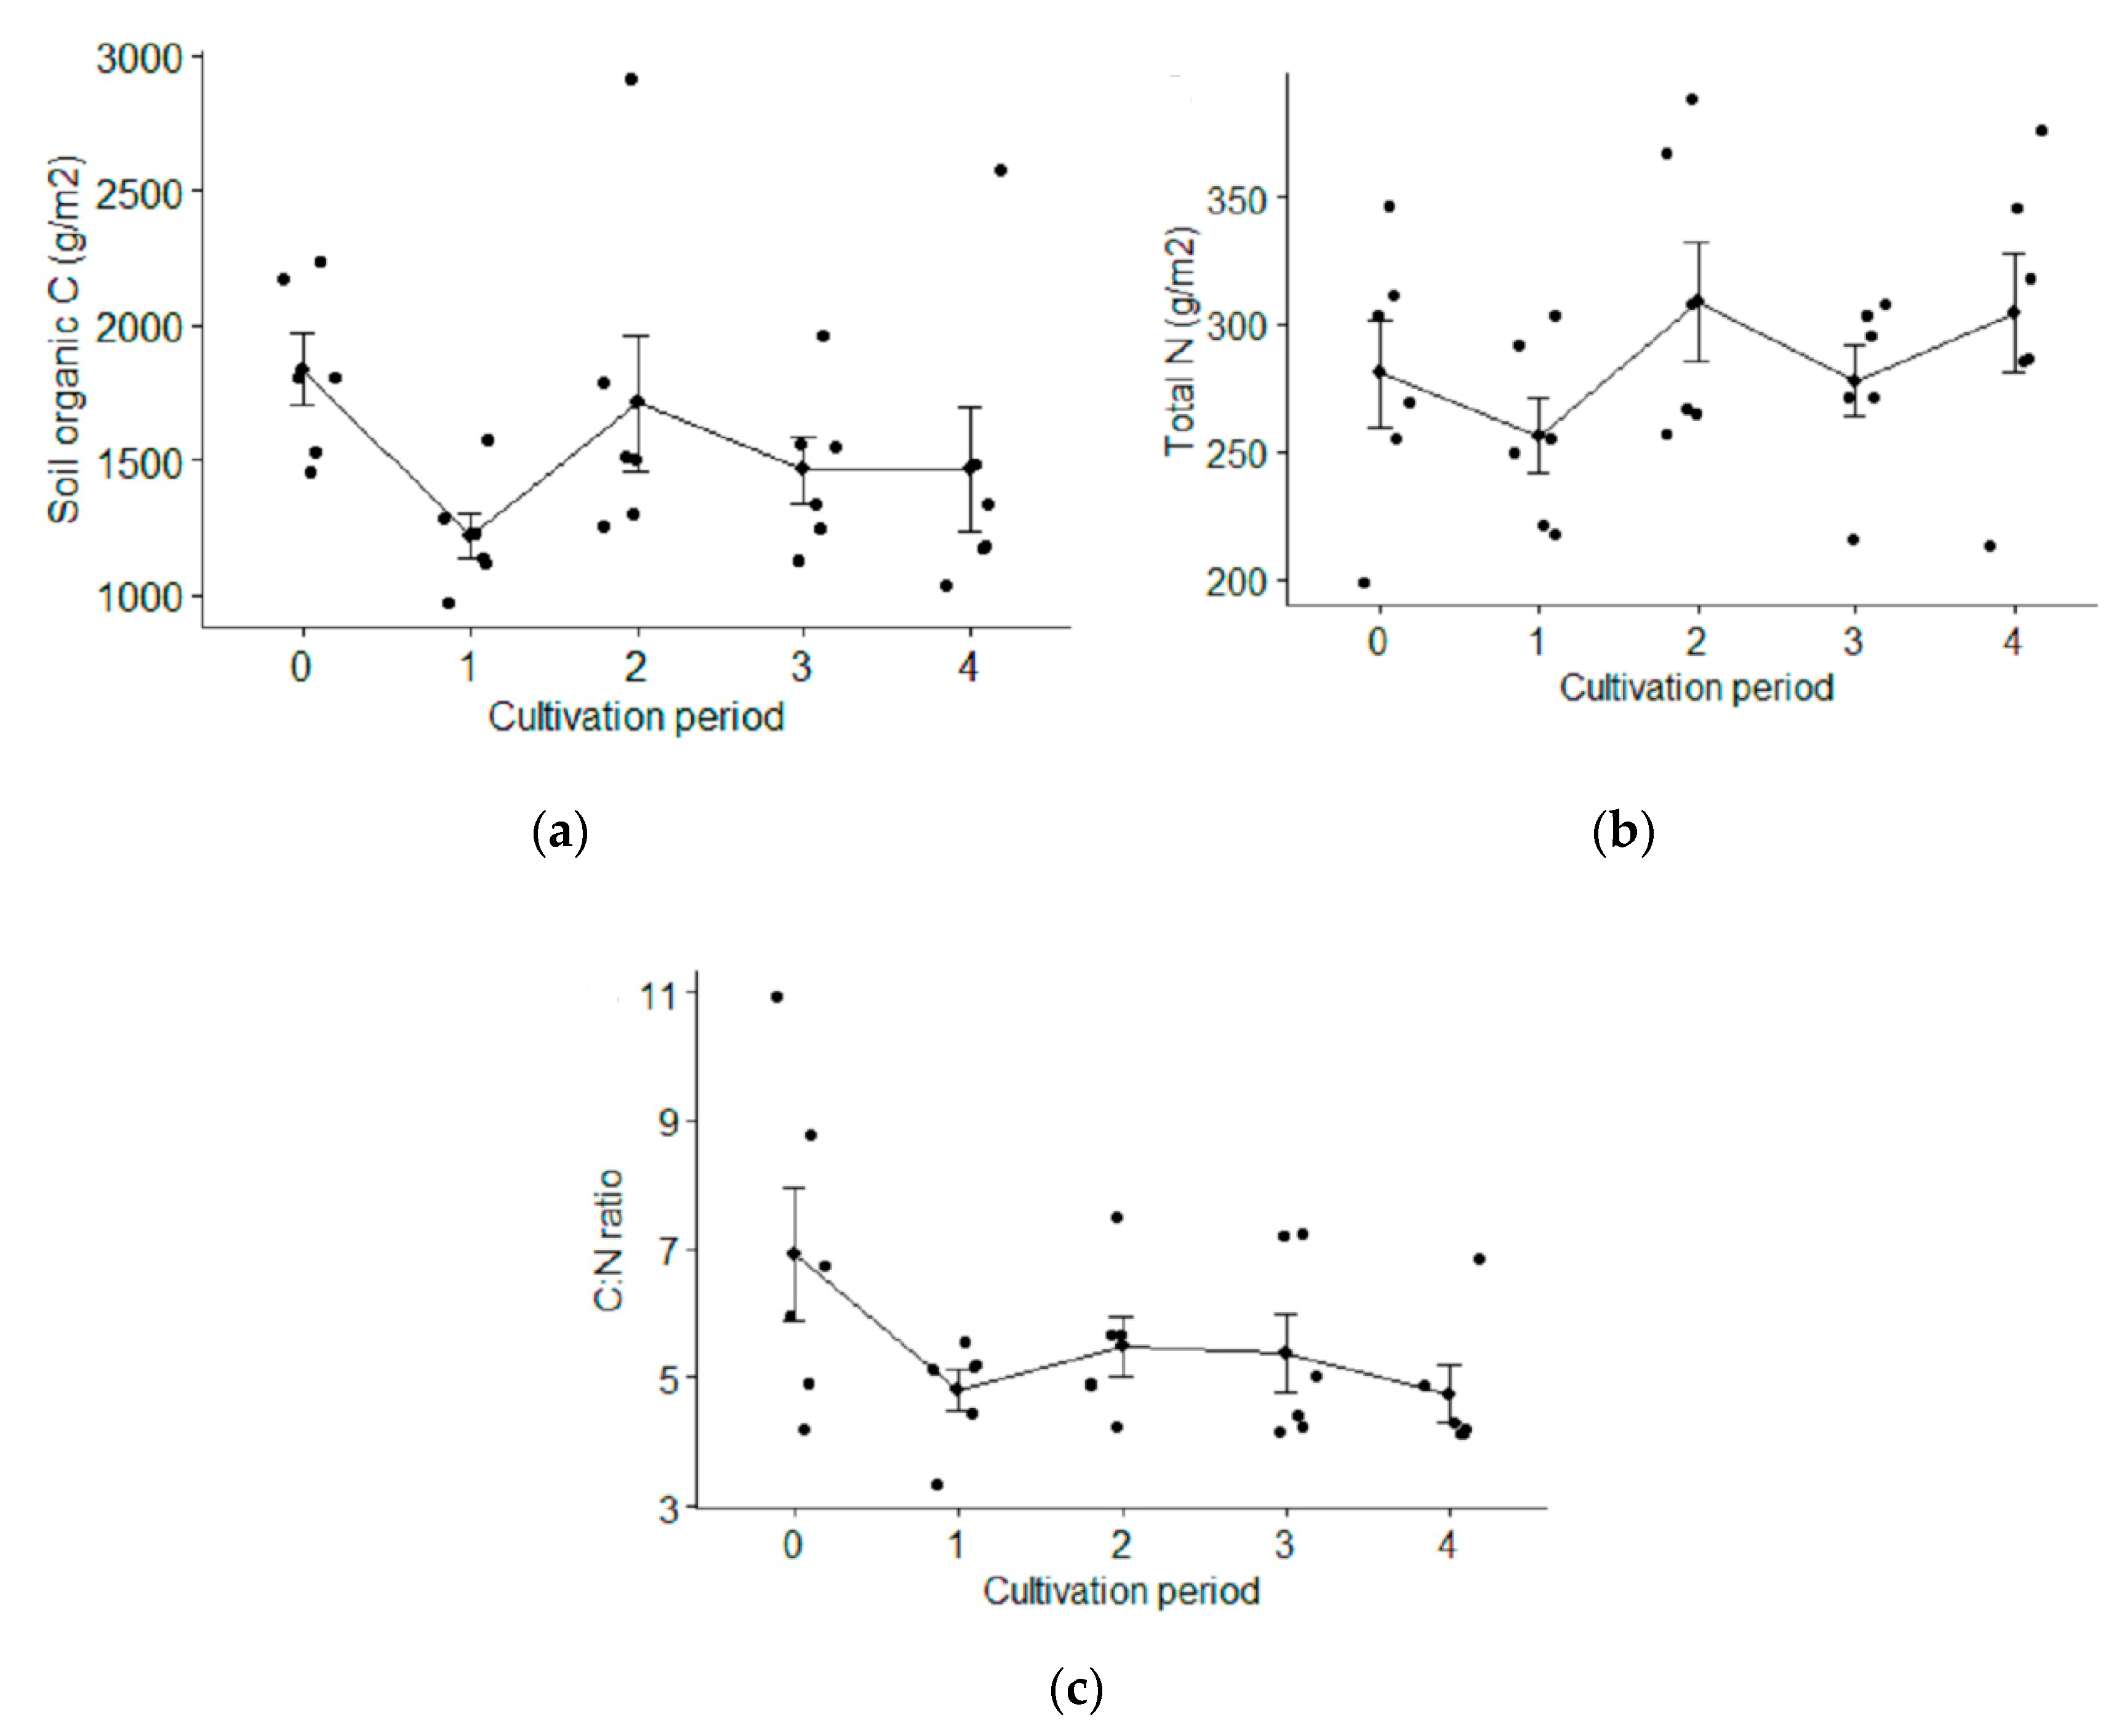
3.2.3. Soil Organic Carbon (SOC) Concentration

In all age categories of the croplands, SOC in the upper layer was slightly higher than in the lower layer (Table 3). In the miombo woodland however, SOC was similar in both layers. In the upper soil layer, there was no significant variation in SOC between the miombo woodland and any of the four cultivation period categories. Similarly, the variation in SOC content among the cultivation period categories was not significant in both upper and lower soil layers. In the lower layer, however, the highest SOC content (1.40%) was measured in the miombo woodland, while the lowest (0.83%) was observed in cultivation period >30 years. The reduction in average SOC in the lower layer after >30 years of cultivation was about 41%.

3.2.4. Soil Organic Carbon (SOC) and Total Nitrogen (Total N) Stocks

Mean Total N and SOC stocks (g m−2) in the 0–20 cm soil surface layer showed a similar trend except for in cultivation period category 4. Figure 4 shows that the highest mean SOC density (1836 g m−2) was observed in the miombo woodland, while the lowest (1221 g m−2) was found in cultivation period category 1. The mean Total N content also declined by about 9% within 10 years of cultivation. The highest mean Total N was however, observed in cultivation period category 2 (309 ± 57 g m−2) and 4 (304 ± 57 g m−2). After reaching an equilibrium after about 20 years of continuous cultivation, SOC content continued to decline, although at low rates.

3.2.5. Carbon to Nitrogen Ration (C:N Ratio)

In all age categories of the croplands, mean C:N ratio in the upper layer was slightly higher than in the lower layer (Table 4). In the miombo woodland however, average C:N ratio was higher in the lower layer than in the upper layer. The mean C:N ratio in both layers was higher in the miombo woodland compared to in the croplands of all age categories, but not significantly. The highest mean C:N ratio (7.52) was observed in the lower layer of the miombo woodland, while the lowest mean C:N ratio (4.37) was observed in the lower layer of cultivation period category 4.

4. Discussion

4.1. Maize Yield and Number of Years of Cultivation

The development of agricultural yields after deforestation is a crucial factor in the long-term analysis of whether the conversion of forestland into cropland has been economically beneficial. This is independent of whether the loss of biodiversity and/or the emission of greenhouse gases during deforestation is included in the analysis or not. If agricultural yields are high in the first years immediately after deforestation, but then fall because of nutrient depletion, the decision to clear the forest may seem rational in the short run, but not in the long run. In such cases, deforestation may be profitable at high interest rates, but not if the interest rate is sufficiently low. In this study, no such trend of decreasing yields was found, since the studied woodlands are usually degraded prior to their conversion into cropland. This might explain why continuous cultivation did not show a significant negative effect on the yield. It can also be explained by the common farming practices in the area. By applying animal manure, burning herbaceous plants prior to cultivation, leaving crop residues in the plot after harvest, and keeping trees in the cropland, farmers evidently manage to keep maize yields stable long after the woodland was cleared.
Regarding the other explanatory variables included in the analysis, as expected, plots described as being of good quality, resulted in relatively high yields. Moreover, the further the plot was from the farm manager’s house, the higher the yield was. This can be explained by the frequency of human and animal disturbance in nearby plots, which might result in reduced yield. The reason why the other explanatory variables also did not show a significant effect on yield may be that, as the main aim of the study was to see the impact of cultivation period on yield, other factors such as the explanatory variables were controlled as much as possible. Hence, it is not surprising that most of the variables did not show a significant effect on yield.

4.2. Soil Chemical and Physical Properties Responses to Continuous Cultivation

4.2.1. Major Plant Nutrients (N, P and K)

Generally, a depletion of soil nutrients due to permanent conversion and subsequent continuous cultivation of miombo woodlands was not observed in this study. This is contrary to other studies, which have reported soil nutrient declines following deforestation and subsequent continuous cultivation e.g., [16,20,22,39]. However, the results regarding K and P from this study are comparable to those of [20] where higher concentrations of exchangeable K (cmoles kg−1) and P (mg kg−1) were observed in croplands cultivated for up to 53 years in comparison with soils in tropical dry Afro-montane forest, at both 0–10 cm and 10–20 cm soil depths. Clearing of miombo woodland and subsequent continuous cropping did not show a significant negative change in the major plant nutrients. This can be explained by the fact that the woodlands are generally located on soils naturally poor in nutrients, particularly in N and extractable P. Significant nutrient depletion usually occurs in soils with an initial high nutrient content [18,20]. On the other hand, the relatively higher concentrations of the major plant nutrients in the croplands compared to the miombo wood land, could be attributed to the current farming system. Animal manure and other organic wastes are important sources of N. Moreover, substantial amounts of organic matter and plant nutrients can be added from the burning of plant material on the farmlands. Litter addition from on-farm trees can also be significant.

4.2.2. Bulk Density (BD)

The BD in the miombo woodland and the croplands of all age categories did not differ. Reference [40] also reported insignificant variations in bulk density between agricultural land and miombo sites in the upper 20 cm of soil. In general, BD on the lower layer was higher than in the upper layer except for cultivation period of 20–30 years, in which the BD in the upper and lower layer was the same. This may be due to the relatively higher SOC in the upper layer compared to in the lower, and higher compaction in the lower layer due to the absence of cultivation and mass of the soil above. The relatively low BD in croplands cultivated for up to 10 years, in which SOC was low, is probably due to tillage effects. BD of soil depends greatly on the degree of compaction. Forests and woodlands are expected to have relatively low BD compared to croplands. However, this was not the case in this study. This can be explained by the high level of compaction caused by cattle in the woodland. Even though the studied miombo woodland is a forest reserve, illegal harvesting and grazing are common activities.

4.2.3. Soil Organic Carbon (SOC)

SOC decreased with depth as expected, however, insignificantly. This is consistent with other studies e.g., [41,42,43]. Mean SOC in the upper soil layer of the miombo woodland was similar to that of the croplands of all age categories. It was also similar across the cultivation period categories. This can be related to the slow decomposition rate of litters in the miombo woodlands, due to low initial available N contents [44]. Mean SOC in the lower soil layer of the miombo woodland was higher compared to the croplands of all age categories, although insignificantly. The result also showed signs of decline in SOC in the lower soil layer of the croplands due to clearing and continued cultivation. The rate of change was, however, low probably due to their lower initial content.

4.2.4. Soil Organic Carbon (SOC) and Total Nitrogen Stocks (Total N)

Our results showed a significant decline in mean SOC and Total N in the croplands cultivated for up to 7 years. This result supports earlier generalizations that most of the SOC and Total N lost following cultivation occurs during the first few years [21,45,46]. On average, 24% of SOC and 15% of Total N stocks could be lost upon conversion of forest to cultivated land [21]. The decrease in the contents of SOC and Total N in the early cultivation years can be explained by the high intake of available nutrients by crops. It is shown that average SOC stock dropped by 33.5% after 2–7 years of cultivation. This could be related to the results of the bulk density, which showed a significant decline in the first 2–7 years of cultivation (Table 3). On the other hand, relatively higher mean stocks of SOC and N were observed in cultivation period category 3 (10–20 years). This could be related to the clay content, which was particularly high in that category (Table 3). The SOC and Total N stocks after 20 years of cultivation showed a declining trend, except for category 4, where the Total N content was similar to that of category 3. Reduction in SOC and Total N contents due to continued cultivation is well documented. For example, Tiessen et al. [47] showed 34% and 29% net loss in SOC and N, respectively, after 60 years of cultivation. Similarly, [20] reported a 41% reduction in SOC after 50 years of cultivation in smallholder agriculture in the highlands of northern Ethiopia.

4.2.5. Carbon to Nitrogen Ration (C:N Ratio)

Cultivated soils are in general known to have lower C:N ratios than forest soils due to the relatively lower C:N ratio requirement by crops than by trees [21]. The results of this study also confirmed that the mean C:N ratio in both layers was higher in the miombo woodland compared to in the croplands of all age category, although statistically insignificant. The mean C:N ratio was similar across the cultivation period category. This can be explained by the similarity in the type of crops cultivated in the croplands.

4.3. Implications of the Soil Analysis Results for Maize Yield

There are many factors affecting crop yield in general, and maize in particular. The amount of necessary available plant nutrients is one of the most important factors determining crop yield. Maize growth demands about 360–600 mg kg−1 of available K, over 6 mg kg−1 of available P, and a pH range of 5.8–8. Moreover, an N level and SOC content of above 0.2% and 2.0%, respectively, are considered as good indices for N availability [24]. The results of the soil analysis showed that the current available P is sufficient to support maize yield across all plots. Similarly, the N level, SOC contents and pH values in all the croplands are within the required level. The current available K in all the croplands except those cultivated for up to 20 years is also satisfactory to support maize. This implies that the decline in some soil nutrients and soil quality indicators such as SOC due to continued cultivation does not necessarily mean that the farmlands will not be able to maintain maize production.

5. Conclusions

Overall, the current farming system, which incorporates a few trees in the croplands, fertilizing using manure, burning herbaceous plants prior to cultivation and leaving crop residues in the plot after harvest, can maintain and even increase some of the major plant nutrients. Besides, given the initial soil nutrients status of the miombo woodlands, which is low, nutrient depletion, is also low. This shows that deforestation of miombo woodlands in the study areas has been, and still may be, a transition from one sustainable (unless woodlands are degraded) situation to another (agroforestry system). This further implies that, in areas like the study sites, returns to agriculture do not fall over time due to continuous cultivation. The fact that the woodlands are generally located on naturally nutrient-poor soils, and that they were degraded prior to conversion into cropland, might explain why there was no significant negative effect on the soil quality, and thus on crop yield. However, there is a need for further study on the possible effects of changes in demography, technology and input on soil quality and crop yield.

Supplementary Materials

The following are available online at https://www.mdpi.com/2071-1050/12/10/4113/s1, Figure S1: a. Agricultural land and b, The forest reserve of miombo woodland.

Author Contributions

Conceptualization, M.M.R.; Data curation, M.M.R.; Formal analysis, M.M.R. and T.A.G.; Investigation, M.M.R.; Methodology, M.M.R.; Visualization, M.M.R. and T.A.G.; Writing—original draft, M.M.R.; Writing—review and editing, M.M.R. and T.A.G. All authors have read and agreed to the published version of the manuscript.

Funding

The data used in this study was collected as part of a PhD project titled “Economic analysis of carbon sequestration and storage in Tanzanian forests”. The project was financed by the Norwegian University of Life Sciences (NMBU), and the Climate Change Impacts, Adaptation and Mitigation (CCIAM) program. Manuscript development was partially financed by the project “Steps toward sustainable forest management with the local communities in Tigray, Northern Ethiopia”. The project is financed by NORAD through the Norwegian Programme for Capacity Development in Higher Education and Research for Development (NORHED) and is a partnership between Mekelle University (MU), Ethiopia and NMBU, Norway.

Acknowledgments

We would like to thank Eva Mtengeti for organizing the soil sampling and analysis. We owe a lot to the people of the study villages, who were willing to share their valuable experiences. We would like to thank our field assistants; especially, we are grateful to Abbu and Celina. We are grateful to Mulugeta Sibhatleab for the unreserved help with improving the map of the study area. We are also thankful to the three anonymous reviewers who provided us with their constructive comments to improve the quality of the paper.

Conflicts of Interest

The authors declare no conflict of interest.

References

  1. Arunrat, N.; Pumijumnong, N.; Sereenonchai, S.; Chareonwong, U. Factors Controlling Soil Organic Carbon Sequestration of Highland Agricultural Areas in the Mae Chaem Basin, Northern Thailand. Agronomy 2020, 10, 305. [Google Scholar] [CrossRef] [Green Version]
  2. Sonneveld, B.G.J.S.; Keyzer, M.A.; Ndiaye, D. Quantifying the impact of land degradation on crop production: The case of Senega. Solid Earth 2016, 7, 93–103. [Google Scholar] [CrossRef] [Green Version]
  3. ELD Initiative. The Rewards of Investing in Sustainable Land Management. Interim Report for the Economics of Land Degradation Initiative: A Global Strategy for Sustainable Land Management, The Economics of Land Degradation (ELD) Initiative. Available online: https://www.eld-initiative.org/fileadmin/pdf/ELD-Interim_Report_web.pdf (accessed on 18 May 2020).
  4. Yin, H.; Pflugmacher, D.; Kennedy, R.E.; Sulla-Menashe, D.; Hostert, P. Mapping annual land use and land cover changes using MODIS time series. IEEE J. Sel. Top. Appl. 2014, 7, 3421–3427. [Google Scholar] [CrossRef]
  5. Jew, E.K.K.; Dougill, A.J.; Sallu, S.M.; O’Connell, J.; Benton, T.G. Miombo woodland under threat: Consequences for tree diversity and carbon storage. Ecol. Manag. 2016, 361, 144–153. [Google Scholar] [CrossRef] [Green Version]
  6. Abdallah, J.M.; Monela, G.G. Overview of Miombo Woodlands in Tanzania. Work. Pap. Finn. For. Res. Inst. 2007, 50, 9–23. [Google Scholar]
  7. NAFORMA. Forest Resources in Tanzania; Ministry of Natural Resources and Tourism, Forestry and Beekeeping Division: Dar es Salaam, Tanzania, 2014. [Google Scholar]
  8. Lupala, Z.J.; Lusambo, L.P.; Ngaga, Y.M.; Makatta, A.A. The Land Use and Cover Change in Miombo Woodlands under Community Based Forest Management and Its Implication to Climate Change Mitigation: A Case of Southern Highlands of Tanzania. Int. J. Res. 2015. [Google Scholar] [CrossRef] [Green Version]
  9. Angelsen, A.; Shitindi, E.F.K.; Aarrestad, J. Why do farmers expand their land into forests? Theories and evidence from Tanzania. Environ. Dev. Econ. 1999, 4, 313–331. [Google Scholar] [CrossRef]
  10. Luoga, E.J.; Witkowski, E.T.F.; Balkwill, K. Land Cover and Use Changes in Relation to the Institutional Framework and Tenure of Land and Resources in Eastern Tanzania Miombo Woodlands. Environ. Dev. Sustain. 2005, 7, 71–93. [Google Scholar] [CrossRef]
  11. Lusambo, L.; Monela, G.; Katani, J. Socio-economic Analysis of Land Use Factors Causing Degradation and Deforestation of miombo woodlands in Kilosa district, Tanzania. Tanzan. J. For. Nat. Conserv. 2008, 76, 28–39. [Google Scholar]
  12. Nduwamungu, J.; Bloesch, U.; Munishi, P.T.K.; Hagedorn, F.; Lulu, K. Recent land cover and use changes in miombo woodlands of eastern Tanzania. Tanzan. J. For. Nat. Conserv. 2008, 78, 50–59. [Google Scholar]
  13. Kissinger, G.; Herold, M.; Sy, V.D. Drivers of Deforestation and Forest Degradation: A Synthesis Report for REDD+ Policymakers; Lexeme Consulting: Vancouver, BC, Canada, 2012. [Google Scholar]
  14. Koellner, T.; Sell, J.; Gähwiler, M.; Scholz, R.W. Assessment of the management of organizations supplying ecosystem services from tropical forests. Glob. Environ. Chang. 2008, 18, 746–757. [Google Scholar] [CrossRef]
  15. Garnett, T.; Appleby, M.C.; Balmford, A.; Bateman, I.J.; Benton, T.G.; Bloomer, P.; Burlingame, B.; Dawkins, M.; Dolan, L.; Fraser, D.; et al. Sustainable intensification in agriculture: Premises and policies. Science 2013, 341, 33–34. [Google Scholar] [CrossRef] [PubMed]
  16. Lal, R. Soil quality changes under continuous cropping for seventeen seasons of an Alfisol in western Nigeria. Land Degrad. Dev. 1998, 9, 259–274. [Google Scholar] [CrossRef]
  17. Islam, K.R.; Weil, R.R. Land use effects on soil quality in a tropical forest ecosystem of Bangladesh. Agric. Ecosyst. Environ. 2000, 79, 9–16. [Google Scholar] [CrossRef]
  18. Zingore, S.; Manyame, C.; Nyamugafata, P.; Giller, K. Long-term changes in organic matter of woodland soils cleared for arable cropping in Zimbabwe. Eur. J. Soil Sci. 2005, 56, 727–736. [Google Scholar] [CrossRef]
  19. Yimer, F.; Ledin, S.; Abdelkadir, A. Changes in soil organic carbon and total nitrogen contents inthree adjacent land use types in the Bale Mountains, south-eastern highlands of Ethiopia. For. Ecol. Manag. 2007, 242, 337–342. [Google Scholar] [CrossRef]
  20. Abegaz, A.; van Keulen, H. Modeling soil nutrient dynamics under alternative farm management practices in the Northern Highlands of Ethiopia. Soil Tillage Res. 2009, 103, 203–215. [Google Scholar] [CrossRef]
  21. Murty, D.; Kirschbaum, M.U.; Mcmurtrie, R.E.; Mcgilvray, H. Does conversion of forest to agricultural land change soil carbon and nitrogen? A review of the literature. Glob. Chang. Biol. 2002, 8, 105–123. [Google Scholar] [CrossRef]
  22. Haileslassie, A.; Priess, J.; Veldkamp, E.; Teketay, D.; Lesschen, J.P. Assessment of soil nutrient depletion and its spatial variability on smallholders’ mixed farming systems in Ethiopia using partial versus full nutrient balances. Agric. Ecosyst. Environ. 2005, 108, 1–16. [Google Scholar] [CrossRef]
  23. Hati, K.M.; Swarup, A.; Singh, D.; Misra, A.K.; Ghosh, P.K. Long-term continuous cropping, fertilisation, and manuring effects on physical properties and organic carbon content of a sandy loam soil. Soil Res. 2006, 44, 487–495. [Google Scholar] [CrossRef]
  24. Lemenih, M.; Karltun, E.; Olsson, M. Assessing soil chemical and physical property responses to deforestation and subsequent cultivation in smallholders farming system in Ethiopia. Agric. Ecosyst. Environ. 2005, 105, 373–386. [Google Scholar] [CrossRef]
  25. MRDO. Land Use Plan for Kunke, Maseyu, and Mlimbilo Villages; Morogoro Rural District Office: Morogoro, Tanzania, 2006. [Google Scholar]
  26. Msanya, B.M.; Kimaro, D.N.; Shayo-ngowi, A.J. Soils of Kitulanghalo Forest Reserve Area, Morogoro District, Tanzania; Department of Soil Science, Faculty of Agriculture, Sokoine University of Agriculture: Morogoro, Tanzania, 1995. [Google Scholar]
  27. Msanya, B.M.; Kaaya, A.K.; Araki, S.; Otsuka, H.; Nyadzi, G.I. Pedological characterstics, general fertility and classification of some benchmark soils of Morogoro district, Tanzania. Afr. J. Sci. Technol. 2003, 4, 11. [Google Scholar]
  28. Araya, M.M.; Hofstad, O. Monetary incentives to avoid deforestation under the Reducing emissions from deforestation and degradation (REDD+) climate change mitigation scheme in Tanzania. Mitig. Adapt. Strateg. Glob. Chang. 2016, 21, 421–443. [Google Scholar] [CrossRef] [PubMed] [Green Version]
  29. Nair, P.K.R. An Introduction to Agroforestry; Kluwer Academic Publisher: Dordrecht, The Netherlands, 1993. [Google Scholar]
  30. Blake, G.R. Bulk Density 1. In Methods of Soil Analysis. Part 1. Physical and Mineralogical Properties, Including Statistics of Measurement and Sampling; Black, C.A., Ed.; American Society of Agronomy, Soil Science Society of America: Madison, WI, USA, 1965; pp. 374–390. [Google Scholar]
  31. Bremner, J.M.; Mulvaney, C.S. Nitrogen-total. In Methods of Soil Analysis: Part 2. Chemical and Microbiological Properties; Page, A.L., et al., Eds.; ASA Monograph Number 9; ASA: Madison, WI, USA, 1982; pp. 595–624. [Google Scholar]
  32. Bray, R.H.; Kurtz, L.T. Determination of Total, Organic, and Available Forms of Phosphorus in Soils. Soil Sci. 1945, 59, 39–46. [Google Scholar] [CrossRef]
  33. Murphy, J.; Riley, J.P. A modified single solution method for the determination of phosphate in natural waters. Anal. Chim. Acta 1962, 27, 31–36. [Google Scholar] [CrossRef]
  34. Watanabe, F.S.; Olsen, S.R. Test of an Ascorbic Acid Method for Determining Phosphorus in Water and NaHCO3 Extracts from Soil. Soil Sci. Soc. Am. J. 1965, 29, 677–678. [Google Scholar] [CrossRef]
  35. Thomas, G.W. Exchangeable Cations. In Methods of Soil Analysis. Part 2. Chemical and Microbiological Properties; Page, A.L., Ed.; American Society of Agronomy, Soil Science Society of America: Madison, WI, USA, 1982; pp. 159–165. [Google Scholar]
  36. Day, P.R. Particle Fractionation and Particle-Size Analysis. In Methods of Soil Analysis. Part 1. Physical and Mineralogical Properties, Including Statistics of Measurement and Sampling; Black, C.A., Ed.; American Society of Agronomy, Soil Science Society of America: Madison, WI, USA, 1965; pp. 545–567. [Google Scholar]
  37. Walkley, A.; Black, I.A. An examination of the Degtjareffff method for determining soil organic matter, and a proposed modification of the chromic acid titration method. Soil Sci. 1934, 37, 29–38. [Google Scholar] [CrossRef]
  38. R Core Team. R: A Language and Environment for Statistical Computing; R Foundation for Statistical Computing: Vienna, Austria, 2019. [Google Scholar]
  39. Kimaro, A.; Timmer, V.; Mugasha, A.; Chamshama, S.O.; Kimaro, D. Nutrient use efficiency and biomass production of tree species for rotational woodlot systems in semi-arid Morogoro, Tanzania. Agrofor. Syst. 2007, 71, 175–184. [Google Scholar] [CrossRef]
  40. Walker, S.M.; Desanker, P.V. The impact of land use on soil carbon in Miombo Woodlands of Malawi. For. Ecol. Manag. 2004, 203, 345–360. [Google Scholar] [CrossRef]
  41. Haile, S.G.; Nair, P.; Nair, V.D. Carbon storage of different soil-size fractions in Florida silvopastoral systems. J. Environ. Qual. 2008, 37, 1789–1797. [Google Scholar] [CrossRef]
  42. Don, A.; Schumacher, J.; Freibauer, A. Impact of tropical land-use change on soil organic carbon stocks—A meta-analysis. Glob. Chang. Biol. 2011, 17, 1658–1670. [Google Scholar] [CrossRef] [Green Version]
  43. Gelaw, A.M.; Singh, B.R.; Lal, R. Soil organic carbon and total nitrogen stocks under different land uses in a semi-arid watershed in Tigray, Northern Ethiopia. Agric. Ecosyst. Environ. 2014, 188, 256–263. [Google Scholar] [CrossRef]
  44. Mtambanengwe, F.; Kirchmann, H. Litter from a tropical savanna woodland (Miombo): Chemical composition and C and N mineralization. Soil Biol. Biochem. 1995, 27, 1639–1651. [Google Scholar] [CrossRef]
  45. Detwiler, R.P. Land use change and the global carbon cycle: The role of tropical soils. Biogeochemistry 1986, 2, 67–93. [Google Scholar] [CrossRef]
  46. Davidson, E.A.; Ackerman, I.L. Changes in soil carbon inventories following cultivation of previously untilled soils. Biogeochemistry 1986, 20, 161. [Google Scholar] [CrossRef]
  47. Tiessen, H.; Stewart, J.W.B. Particle-size Fractions and their Use in Studies of Soil Organic Matter: II. Cultivation Effects on Organic Matter Composition in Size Fractions1. Soil Sci. Soc. Am. J. 1983, 47, 509–514. [Google Scholar] [CrossRef]
Figure 1. Map of (a) Tanzania; (b) Morogoro region; (c) the study villages.
Sustainability 12 04113 g001
Figure 2. Observations of maize yield across farmlands of different cultivation age.
Sustainability 12 04113 g002
Figure 3. Observations of (a) total nitrogen; (b) available phosphorus; (c) average concentration of K in the upper (0–10 cm) (Top soil) and the lower (10–20 cm) (Sub soil) soil layers across cultivation period. 0: woodland, 1: cropland cultivated for 1–10 years, 2: cropland cultivated for 11–20 years, 3: cropland cultivated for 21–30 years, and 4: cropland cultivated for more than 30 years. The error bars represent one standard error.
Sustainability 12 04113 g003
Figure 4. (a) Organic Carbon stock; (b) Total Nitrogen stock; (c) Carbon to Nitrogen ration (C:N ratio) in soil in different categories of cultivation periods after deforestation. 0: woodland, 1: cropland cultivated for 1–10 years, 2: cropland cultivated for 11–20 years, 3: cropland cultivated for 21–30 years, and 4: cropland cultivated for more than 30 years. The error bars represent one standard deviation.
Sustainability 12 04113 g004
Table 1. Description of the response and explanatory variables used in the model.
VariablesDescriptionVariable TypeNumber of Factors (Levels)Effect
Response variable
Yield (Yie)Total yield harvested (kg ha−1)Continuous
Explanatory variables
Village (Vil)An administrative unitFactor3 factorsRandom
SexSex of the household headFactor2 factorsFixed
AgeAge of the household headContinuous Fixed
Family size (FL)Family member above 10 years old are considered in the analysisContinuous Fixed
Education (Ed)Number of schooling years completed by the household headFactor3 factorsFixed
Number of plots (NP)Number of plots managed by the householdContinuous Fixed
Ownership (OS)If the farm manager has user right to the plot or rents from othersFactor2 factorsFixed
Plot size (PS)Total area of a given plotContinuous Fixed
Distance from household (DHH)Time required to reach to the plot from the user’s houseContinuous Fixed
Cultivation period (CY)The time period since the land was being used for crop cultivationFactor4 factorsFixed
Distance from the nearest forest (DF)Distance in minutes walking to the particular plot from the nearest forestContinuous Fixed
Soli type (ST)Soil texture based on the farm managers descriptionFactor4 factorsFixed
Land quality (LQ)Land quality in terms of fertility according to the farm managersFactor3 factorsFixed
Slop (Slo)The degree to which the plot is exposed to erosion (slop of the farmland)Factor3 factorsFixed
Degree of weed infestation (DW)The degree to which the plot is affected by weedFactor4 factorsFixed
Seed input (SI)Amount of seed used per hectareContinuous Fixed
Labor input (LI)Man-days employed per hectare of landContinuous Fixed
Table 2. ANOVA table of variables explaining variation in maize.
Source of VariationdfSSMSFPr (>F)
Sex11,254,9481,254,9482.2090.141
Age118,74518,7450.0330.856
FL1221,637221,6370.3900.534
Ed2610,983305,4920.5380.586
NP1362,213362,2130.6370.427
DHH17,641,8177,641,81713.448<0.000 ***
CY1287,360287,3600.5060.479
OS1585,152585,1521.0300.313
DF1875087500.0150.901
ST32,201,571733,8571.2910.284
LQ24,492,6792,246,3403.953<0.05 *
Slo3554,817184,9390.3250.807
DW3251,35783,7860.1470.931
PS1221,993221,9930.3910.534
SI130,95630,9560.0540.816
LI18891398891391.5650.215
Note: * p < 0.1, ** p < 0.05 & *** p < 0.01.
Table 3. Mean (±SE) for selected soil properties in the 0–10 cm and 10–20 cm soil layers on miombo woodland and across croplands of different cultivation period categories since conversion from miombo woodland (the values in parentheses are one standard error and * p < 0.1).
Soil ParameterDepth (cm)Cultivation PeriodANOVA
01–1011–2021–30>30
Total N (%)0–100.24 (±0.02)0.25 (±0.03)0.24 (±0.03)0.23 (±0.01)0.28 (±0.01)
10–200.19 (±0.02)0.23 (±0.02)0.23 (±0.01)0.21 (±0.02)0.19 (±0.01)
P (mg kg−1)0–105.64 (±0.16)19.15 (±15.98)21.61 (±18.65)55.71 (±3.50)34.36 (±16.81)
10–202.20 (±0.12)16.38 (±14.83)19.68 (±17.16)44.38 (±7.63)17.31 (±9.86)
K exchangeable (cmoles kg−1)0–100.65 (±0.10)0.81 (±0.13)0.85 (±0.28)1.00 (±0.10)0.91 (±0.17)
10–200.35 (±0.06)0.46 (±0.18)0.86 (±0.04)0.74 (±0.16)0.62(±0.22)
pH0–105.79 (±0.28)5.62 (±0.28)5.58 (±0.44)5.72 (±0.12)5.73 (±0.36)
10–205.56 (±0.26)5.38 (±0.24)5.14 (±0.06)5.67 (±0.17)5.64 (±0.07)
SOC (%)0–101.47 (±0.28)1.24 (±0.18)1.52 (±0.41)1.24 (±0.18)1.47 (±0.29)
10–201.40 (±0.23)1.06 (±0.10)1.14 (±0.07)1.08 (±0.20)0.83 (±0.01)
BD (g cm−3)0–101.28 (±0.10)0.99 (±0.10)1.25 (±0.02)1.29 (±0.09)1.22 (±0.02)*
10–201.34 (±0.11)1.17 (±0.05)1.34 (±0.10)1.28 (±0.12)1.35 (±0.05)
Clay (%)0–1014.10 (±1.32)15.93 (±2.03)23.43 (±2.80)15.77 (±3.09)15.07 (±1.35)*
10–2018.27 (±1.48)15.93 (±2.85)22.27 (±2.90)15.60 (±0.58)19.77 (±4.05)
Table 4. Soil Organic Carbon (SOC) and Total Nitrogen (Total N) stocks and Carbon to Total Nitrogen ratio (C:N ratio) (the values in parentheses are one standard error).
Cultivation PeriodDepth (cm)SOC (gm−2)Total N (gm−2)C:N Ratio
00–101835 (±227)302 (±27)6.31 (±1.33)
10–201837 (±187)260 (±33)7.52 (±1.79)
1–100–101181 (±52)241 (±12)4.92 (±0.23)
10–201260 (±175)272 (±26)4.70 (±0.69)
11–200–101892 (±517)303 (±43)6.03 (±0.77)
10–201538 (±140)314 (±29)4.93 (±0.41)
21–300–101589 (±208)292 (±11)5.50 (±0.90)
10–201340 (±124)264 (±25)5.26 (±0.98)
>300–101802 (±390)347 (±17)5.12 (±0.87)
10–201131 (±48)262 (±24)4.37 (±0.25)

