Article

Short-Term Effects of Eco-Friendly Fertilizers on a Soil Bacterial Community in the Topsoil and Rhizosphere of an Irrigated Agroecosystem

1
Shapotou Desert Research & Experiment Station, Northwest Institute of Eco-Environment and Resources, Chinese Academy of Sciences, Lanzhou 730000, China
2
Key Laboratory of Stress Physiology and Ecology in Cold and Arid Regions of Gansu Province, Northwest Institute of Eco-Environment and Resources, Chinese Academy of Sciences, Lanzhou 730000, China
3
College of Resources and Environment, University of Chinese Academy of Sciences, Beijing 100049, China
4
State Key Laboratory of Plant Genomics, Institute of Microbiology, Chinese Academy of Sciences, Beijing 100101, China
*
Author to whom correspondence should be addressed.
Sustainability 2020, 12(12), 4803; https://doi.org/10.3390/su12124803
Submission received: 2 May 2020 / Revised: 28 May 2020 / Accepted: 10 June 2020 / Published: 12 June 2020
(This article belongs to the Special Issue Sustainable Soil Health Management)

Abstract

:
Fertilizer application to arable soils could be effective for soil nutrients. However, there are many negative effects in croplands with long-term chemical fertilizer application. Whether eco-friendly fertilizer addition could enhance soil quality and soil microbial activity has been investigated before; however, how top- and rhizosphere soil bacterial communities respond to their short-term effects is not well known. Here, we used Illumina MiSeq sequencing to determine the changes of bacterial community structure in both topsoil and rhizoshpere after one month of the addition of three different eco-friendly fertilizers—biochar (B), microbial fertilizer (MF), fertilizer synergist (FS) and selected soil base fertilizer (CK) as a control, in an irrigated agroecosystem of cabbage crop (Brassica oleracea L. var. capitata L.). The results show that three different eco-friendly fertilizers significantly enhanced cabbage growth. The Shannon and Ace indexes of the bacterial community significantly decreased under the FS treatment in both soils, but the total abundance of bacteria was maximal under the FS treatment in the topsoil and the MF treatment in the rhizosphere. The addition of the three fertilizers led to significant differences in the relative abundance of bacteria community at the phylum level, such as Proteobacteria, Acidobacteria, Rokubacteria and Planctomycetes in the topsoil, and Chloroflexi, Actinobacteria, Firmicutes and Rokubacteria in the rhizosphere. The same phylum showed the inconsistent changes under different fertilizer treatments in both topsoil and rhizosphere. The dominant genera, i.e., Nitrosospira and Massilia in the topsoil, and Flavobacterium, Nitrosospira and Pseudomonas in the rhizosphere, were much higher under the FS treatment than others. Redundancy analysis showed that total nitrogen and available phosphorus were the key factors that shaped the bacterial community in this ecosystem. These results highlighted that the short-term addition of eco-friendly fertilizer had an improvement effect on the quality of both topsoil and rhizosphere in croplands with long-term chemical fertilizer application.

1. Introduction

In arid agroecosystems, the addition of nutrients, mainly composed of nitrogen (N), phosphorus (P), and potassium (K), has been often shown to improve soil nutrient availability and crop yield [1,2,3], and strongly influences soil physicochemical properties [4,5]. Moreover, the added nutrients lead to shifts in the composition and diversity of microbial communities [6,7]. However, there are many negative effects in croplands induced by long-term chemical fertilizer application, such as soil compaction, soil nutrient imbalance, biodiversity decline, and environmental pollution [8,9]. These changes consequently result in substantial reductions in soil microbial biomass and diversity [10]. In addition, N fixation and the relative abundance of specific N fixers are drastically reduced [5]. In order to alleviate these problems resulting from chemical fertilizer application, the eco-friendly fertilizers have drawn increasing attention from researchers [11,12].
Biochar is a solid substance, mainly composed of alkyl and aromatic compounds, which are made by cracking organic matter at a high temperature under low oxygen or oxygen-free conditions [13]. It is relatively stable and can be stored in soil for hundreds of years. The application of biochar may lead to changes in soil physical, chemical and biological properties and processes such as reduction in nutrients leaching and volatilization, and enhanced soil enzyme activity and mineral nutrition for microbial development and reproduction [14,15]. Microbial fertilizer, also known as bio-organic fertilizer, bio-fertilizer or "microbial inoculant", is a kind of pollution-free fertilizer that contains a variety of living functional microbial agents and soil-friendly organic materials and could thus lead to enhancements in the number of microorganism, acceleration in the metabolism of certain microorganism, restoration in the natural nutrient cycling ability of soil, and increases in the content of nutrient elements in absorbable forms to supply plant growth [16,17,18]. Fertilizer synergist (FS) is fabricated by a network-structured nanocomposite (sodium humate-at-tapulgite-polyacrylamide) that could effectively inhibit the hydrolysis, reduce the loss, and enhance the utilization efficiency of nitrogen [19]. Importantly, these technologies display a high biosafety and have a great potential in reducing nonpoint agricultural pollution.
Previous studies have investigated the impacts of eco-friendly fertilizer on soil quality and soil microbial activities at various time scales. For example, Bamminger et al. [20] found that biochar addition could significantly improve PLFA content of the bacteria and fungi through 37 d incubation experiments. Moreover, Dangi et al. [21] showed that two-year soil amendment with biochar or the incorporation of organic fertilizer significantly affected microbial community biomass, composition and crop yield. Likewise, the application of biofertilizer containing beneficial microbes promoted the growth of Z. mays and enhanced soil properties in an 87-day field study [22]. Biofertilizer allowed a decrease of up to 50% in the use of nitrogen synthetic fertilizer (50 kg N ha−1), resulting in the same grain yield (7.4 t ha−1) and quality in relation to the fertilized control [23]. The input of eco-friendly fertilizer could significantly increase soil organic matter, porosity, water-holding capacity, and microbial activity, diversity and richness [16,21,24].
Bacteria contribute to a high proportion of the microbial biomass in croplands. They play crucial roles in soil chemical and physical properties, including nutrient cycling, the decomposition of organic matter, and system stability [1,25,26]. The chemical properties, population composition and community structure of bacteria change greatly under nutrients addition [10,26]. The short-term addition of N fertilizers can result in an increase of fast-growing diazotrophs abundance [5], and some bacteria are involved in the utilization and degradation of added fertilizers [27]. The eco-friendly fertilizer addition could enhance soil quality and soil microbial activities, but how a bacterial community in topsoil and rhizosphere responds to eco-friendly fertilizer addition in the short term is not well known. The sensitivity of soil bacterial community is likely to differ between topsoil and rhizosphere [28]. The quantity and species of rhizosphere bacteria are important factors affecting the growth, development, and health status of plants [29,30]. An understanding of the short-term consequences of soil fertilization (e.g., eco-friendly fertilizer) on the topsoil and rhizospheric soil properties and their associated bacterial community will enable us to better manage cropland soils in terms of sustainable agriculture.
In this study, we selected an irrigated agroecosystem of cabbage (Brassica oleracea L. var. capitata L.) crop in arid northwestern China, and applied Illumina MiSeq sequencing to determine the effects of short-term eco-friendly fertilizers addition (B, MF and FS) on bacterial community composition and diversity in both topsoil (0–20 cm) and rhizosphere. The main purposes of this study were to 1) reveal the hypothesis that bacterial communities do respond to the short term eco-friendly fertilizer addition; and 2) analyze the impacts of short-term eco-friendly fertilizers on the topsoil and rhizospheric soil properties and bacterial communities.

2. Materials and Methods

2.1. Study Site, Experimental Design and Soil Sampling

The study site (38°21′N, 106°21′E; elevation: 1,075 m) is located in Yongning County, the Ningxia Hui Autonomous Region, northwestern China. It is characterized by a temperate continental arid climate with mean annual temperature, precipitation, and sunshine hours around 8.9 °C, 201.9 mm, and 2866.7 h, respectively. The main soil type of the study site is sierozem with organic matter content, total nitrogen and phosphorus, and pH around 10.92, 0.64 and 0.65 g kg−1, and 7.80, respectively. To improve the quality and economic benefits of agricultural products under such harsh climate conditions, many plastic greenhouses were built to grow cabbages, tomatoes, pepper, and other cash vegetables in Yongning County over the past ten years. The total area of plastic greenhouses cropped to cash vegetables in Yongning County reached to 2100 hm2 in the first quarter of 2019.
In May 2018, three 77.70 × 6.00 m2 plastic greenhouses were selected, and four 8.75 × 6.00 m2 plots were set in each of the three greenhouses. Three experimental groups, i.e., different eco-friendly fertilizers including biochar (B), microbial fertilizer (MF) and fertilizer synergist (FS), and one control group, i.e., soil base fertilizer (CK) were separately and randomly added in the four plots for each plastic greenhouse. The raw material of biochar was corn straw produced by Liaoning Jinhefu Agricultural Development Co., Ltd. The biochar contained 67.9%, 1.07%, 0.79%, 0.78% and 1.68% of carbon, nitrogen, sulfur, phosphorus and potassium, respectively, with a pH value of 9.2. The microbial fertilizer was the Bacillus amyloliquefaciens EZ99 produced by the Gansu Shangnong Biotechnology Co., Ltd., and the number of viable bacteria reached to 5 ×10⁹ cfu g−1. The fertilizer synergist was provided by the Institute of Microbiology, Chinese Academy of Sciences and described by Zhou et al. [19]. The base fertilizer was comprised of urea (114.3 kg ha−1), ammonium phosphate (169.8 kg ha−1), and potassium sulfate (143 kg ha−1). All these fertilizers were applied at one time as base fertilizer, and all treatments were consistent. Biochar, microbial fertilizer, and fertilizer synergist were added equivalent to a 20 t ha−1, 45 kg ha−1, and 180 kg ha−1, respectively. The basal chemical fertilizer and eco-friendly fertilizers were broadcast on the surface and tilled into the soil before planting. The planting time started in May 2018, and plant spacing and row spacing was 40 and 60 cm, respectively. The management of irrigation and weeding were similar for all treatments during the whole planting period.
Soil samples were collected after one month according to the “S” shape [31]. For the topsoil (0–20 cm) in each plot, five replicated samples (20 cm in depth and 5 cm in diameter) were collected by a sterile sampler, and then pooled together to provide a composite sample. Overall, three composite samples were obtained for each treatment. For the rhizosphere, the whole root of cabbage was completely excavated with a sampling shovel. We firstly tapped the soil and then collected soil closely adhered to the root for further analysis after discarding the naturally dropped soil that was loosely adhered to the root. The samples used for microbial analysis were passed through a 2-mm sieve and then stored at −80 °C, and other samples used for analyzing soil physiochemical properties and soil enzyme activity were air dried, and later, passed through a 2-mm sieve.

2.2. Determination of Cabbage Growth Characteristics and Soil Properties

The plant height and crown width were measured during the heading stage. Fruit diameter and yield were measured during the maturity stage. Plant height, crown width and fruit diameter were measured using a ruler, and yield was analyzed by the weighing method. Soil pH was determined in a soil–water mixture with a ratio of 1:5 and the organic matter (OM) content was determined using the dichromate oxidation method described by Walkley–Black [32]. Total nitrogen (TN) content was measured with an element analyzer (Vario MACRO cube, Elementar INC., Germany), and total phosphorus (TP) was determined by the Sommers–Nelson method [33]. Available phosphorus (AP) was determined using a rapid perchloric acid digestion procedure [34]. Soil alkaline phosphatase (AKP), soil dehydrogenase (DHA), soil sucrase (SC), soil catalase (CAT), and soil urease (UE) were determined using a soil enzyme kit (Comin Biotechnology Co., Ltd., Suzhou, China) according to the manufacturer’s instructions.

2.3. Extraction of DNA, PCR and Sequencing

The total DNA was extracted from soil samples with an E.Z.N.A Soil DNA Kit (Omega, Bio-tek, Norcross, GA, USA) according to the manufacturer’s instructions. The purity and concentration of the obtained DNA were assessed using NanoDrop 2000c (Thermo Fisher Scientific, Waltham, MA, USA). The bacteria 16S ribosomal RNA (rRNA) gene was amplified by PCR (95 °C for 3 min, followed by 25 cycles of 95 °C for 30 s, 55 °C for 30 s and 72 °C for 45 s, and a final extension at 72 °C for 10 min) using primers 338F (5′-ACTCCTACGGGAGGCAGCAG-3′) and 806R (5′-GGACTACHVGGGTWTCTAAT-3′). PCR was performed using a 20-μL reaction mixture containing 5 μL of 2 × Taq PCR Master Mix (Sangon Biotech Shanghai Co., Ltd., Shanghai, China), 1 μL of each primer (10 μM), 1 μL of total DNA (10 ng), and sterilized ultrapure water. The amplicons were separated by 1% agarose gel electrophoresis, purified using a SanPrep Column DNA Gel Extraction Kit (Sangon Biotech Shanghai Co. Ltd.) and quantified with QuantiFluor™-ST (Promega Corporation, Madison, WI, USA). The purified amplicons were pooled in equimolar and paired-end sequenced (2 × 300) on an Illumina MiSeq platform according to the standard protocols at Majorbio Bio-Pharm Technology Co. Ltd., Shanghai, China. All sequence data were submitted to the NCBI Sequence Read Archive (SRA) under accession number SRP231204.
The raw fastq files were demultiplexed, quality-filtered using QIIME (version 1.17) with the following criteria [35]: (i) the 300 bp reads were truncated at any site receiving an average quality score <20 over a 50 bp sliding window, discarding the truncated reads that were shorter than 50 bp, (ii) exact barcode matching, 2 nucleotide mismatch in primer matching, reads containing ambiguous characters were removed, and (iii) only sequences with >10 bp of overlap were assembled. Reads that could not be assembled were discarded. Operational Units (OTUs) were clustered with 97% similarity cut-off using UPARSE (version 7.1) and chimeric sequences were identified and removed using UCHIME. The taxonomy of each 16S rRNA gene sequence was analyzed with an RDP classifier and compared with the SILVA (SSU115) 16S rRNA database using a confidence threshold of 70%.

2.4. Quantitative Real-Time PCR (qPCR) Analysis

qPCR was conducted to determine the absolute 16S gene abundance using the primer set 27F (5′-AGAGTTTGATCCTGGCTCAG-3′) and 338R (5′-TGCTGCCTCCCGTAGGAGT-3′) for bacteria, and to further quantify the total microbial abundance. The standard templates were made from 10-fold dilutions of linearized plasmids containing the gene fragment of interest that was cloned from amplified pure culture DNA.
The 20-μL qPCR reaction mix contained 10 μL of 2 × SYBR Green PCR Master Mix (Takara Bio, Shiga, Japan), 0.4 μL of each primer (10 μM), 1 μL of total DNA template (diluted to 1 ng μL−1 ), and 8.2 µL of RNase-free ddH2O. The reaction was conducted as follows: 50 °C for 2 minutes and 94 °C for 10 minutes, followed by 45 cycles of 94 °C for 1 minute, 55 °C for 1 minute and 72 °C for 1 minute, and then 72 °C for 2 minutes. The detection signal was obtained at 72 °C for 30 s and analyzed. All the experiments were performed on the Stratagene Mx3000 P system (Stratagene, Agilent Technologies Inc.). PCR products were gel-purified and cloned into pUCm-T vector (Sangon Biotech Shanghai Co. Ltd.), and the resulting ligation products were transformed into Escherichia coli DH5α competent cells (Sangon Biotech Shanghai Co. Ltd.). DNA standards were then made from the plasmid DNA with concentrations ranged from 6.13 × 10⁸ to 6.13 × 10⁴ copies of DNA per reaction. The gene copy numbers of the target samples for each reaction were calculated from the standard curves. The melting curve was obtained to confirm that the amplified products were of the appropriate size. qPCR analysis of each sample was replicated at least six times.

2.5. Statistical Analysis

A one-way analysis of variance (ANOVA) and Duncan test were conducted in SPSS 20.0 (IBM Corp., Armonk, NY, USA) to detect significant differences in the soil chemical properties and cabbage growth characteristics. Moreover, the alpha diversity indies, the OTUs’ relative abundance and the absolute bacterial abundance among fertilization treatments were also calculated in SPSS 20.0. Alpha diversity analysis was used to assess the richness and diversity of soil microbial diversity. Principal coordinate analysis (PCoA) was conducted to determine the overall differences in community compositions. Redundancy analysis (RDA) was used to assess the relationships between compositions of the bacterial community and soil chemical properties by a permutation test (p < 0.05). Soil properties, cabbage growth characteristics, alpha diversity and the absolute bacterial abundance were analyzed and plotted in Origin 9.0 (Origin Lab Corporation, Northampton, MA, USA).

3. Results

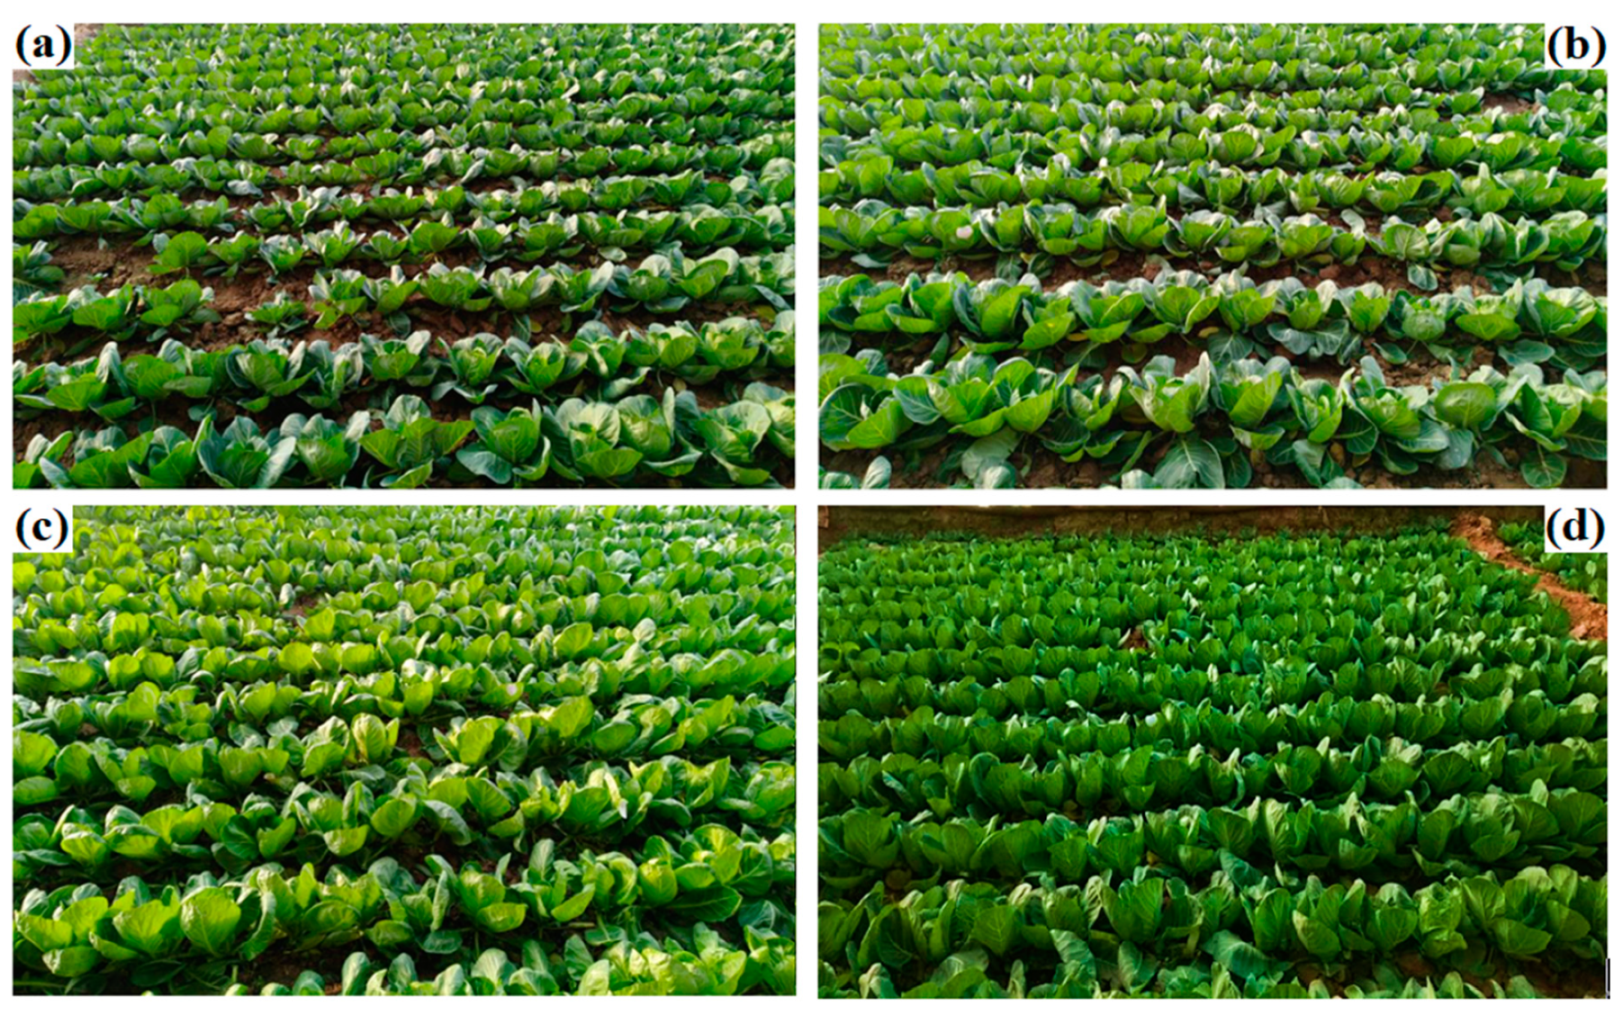
3.1. Cabbage Growth Characteristics and Soil Properties

The cabbage growth and yield were strongly influenced by the eco-friendly fertilizer addition (Table 1 and Figure A1). The MF and FS treatments significantly increased cabbage yield by 20.89%and 16.98%, respectively, compared to the CK (p < 0.05). Three eco-friendly fertilizers also significantly stimulated an increase in plant height, crow width and fruit diameter, especially under the FS treatment (p < 0.05). The soil properties varied significantly among different eco-friendly fertilizers (Table 2). Specifically, soil pH was significantly higher under the B treatment than the CK for the topsoil and rhizosphere (p < 0.05), while no significant difference was found between the CK and MF. The FS treatment significantly enhanced soil electrical conductivity (EC), OM, TP, TN, and AP in comparison with other treatments on both soil types (p < 0.05), but decreased soil pH. The soil enzyme activities i.e., the UE, SC, AKP, and CAT also responded significantly to different fertilizer additions for both soils (Table 3). The AKP and SC were significantly up-regulated by the FS, and the CAT was stimulated by the MF in both soils. In addition, the UE was significantly higher under the B and FS treatments than other treatments for the topsoil and rhizophere, respectively.

3.2. Bacterial Community Diversity and Richness

Illumina MiSeq sequencing was used to assess the bacterial community composition and diversity in the topsoil and rhizosphere of cabbage. After the optimization and screening of all the original sequences, a total of 759,135 and 740,652 sequences were obtained in both soils, with an average sequence length of 417 bp (Table A1 and Table A2). The number of OTUs ranged from 5024 to 6228 and 5202 to 5950 in the topsoil and rhizospheric soil, respectively (Table A3). The number of phyla identified in the samples ranged from 37 to 39, with the lowest value for FS samples in both soils. In addition, the FS samples had the smallest number of bacterial communities at both genus and species levels (Table A3). The PCoA revealed that the three replicated samples for each treatment tended to cluster together, indicating that the sequencing results were reliable and the samples were reproducible (Figure A2). The Shannon index of bacterial community under B and MF treatments was significantly higher than that under FS treatment in both topsoil and rhizosphere (Figure 1a,c, p < 0.05). However, no significant differences were found between the CK and B, and MF (p > 0.05). Similar patterns were observed for the Ace index (Figure 1b,d).

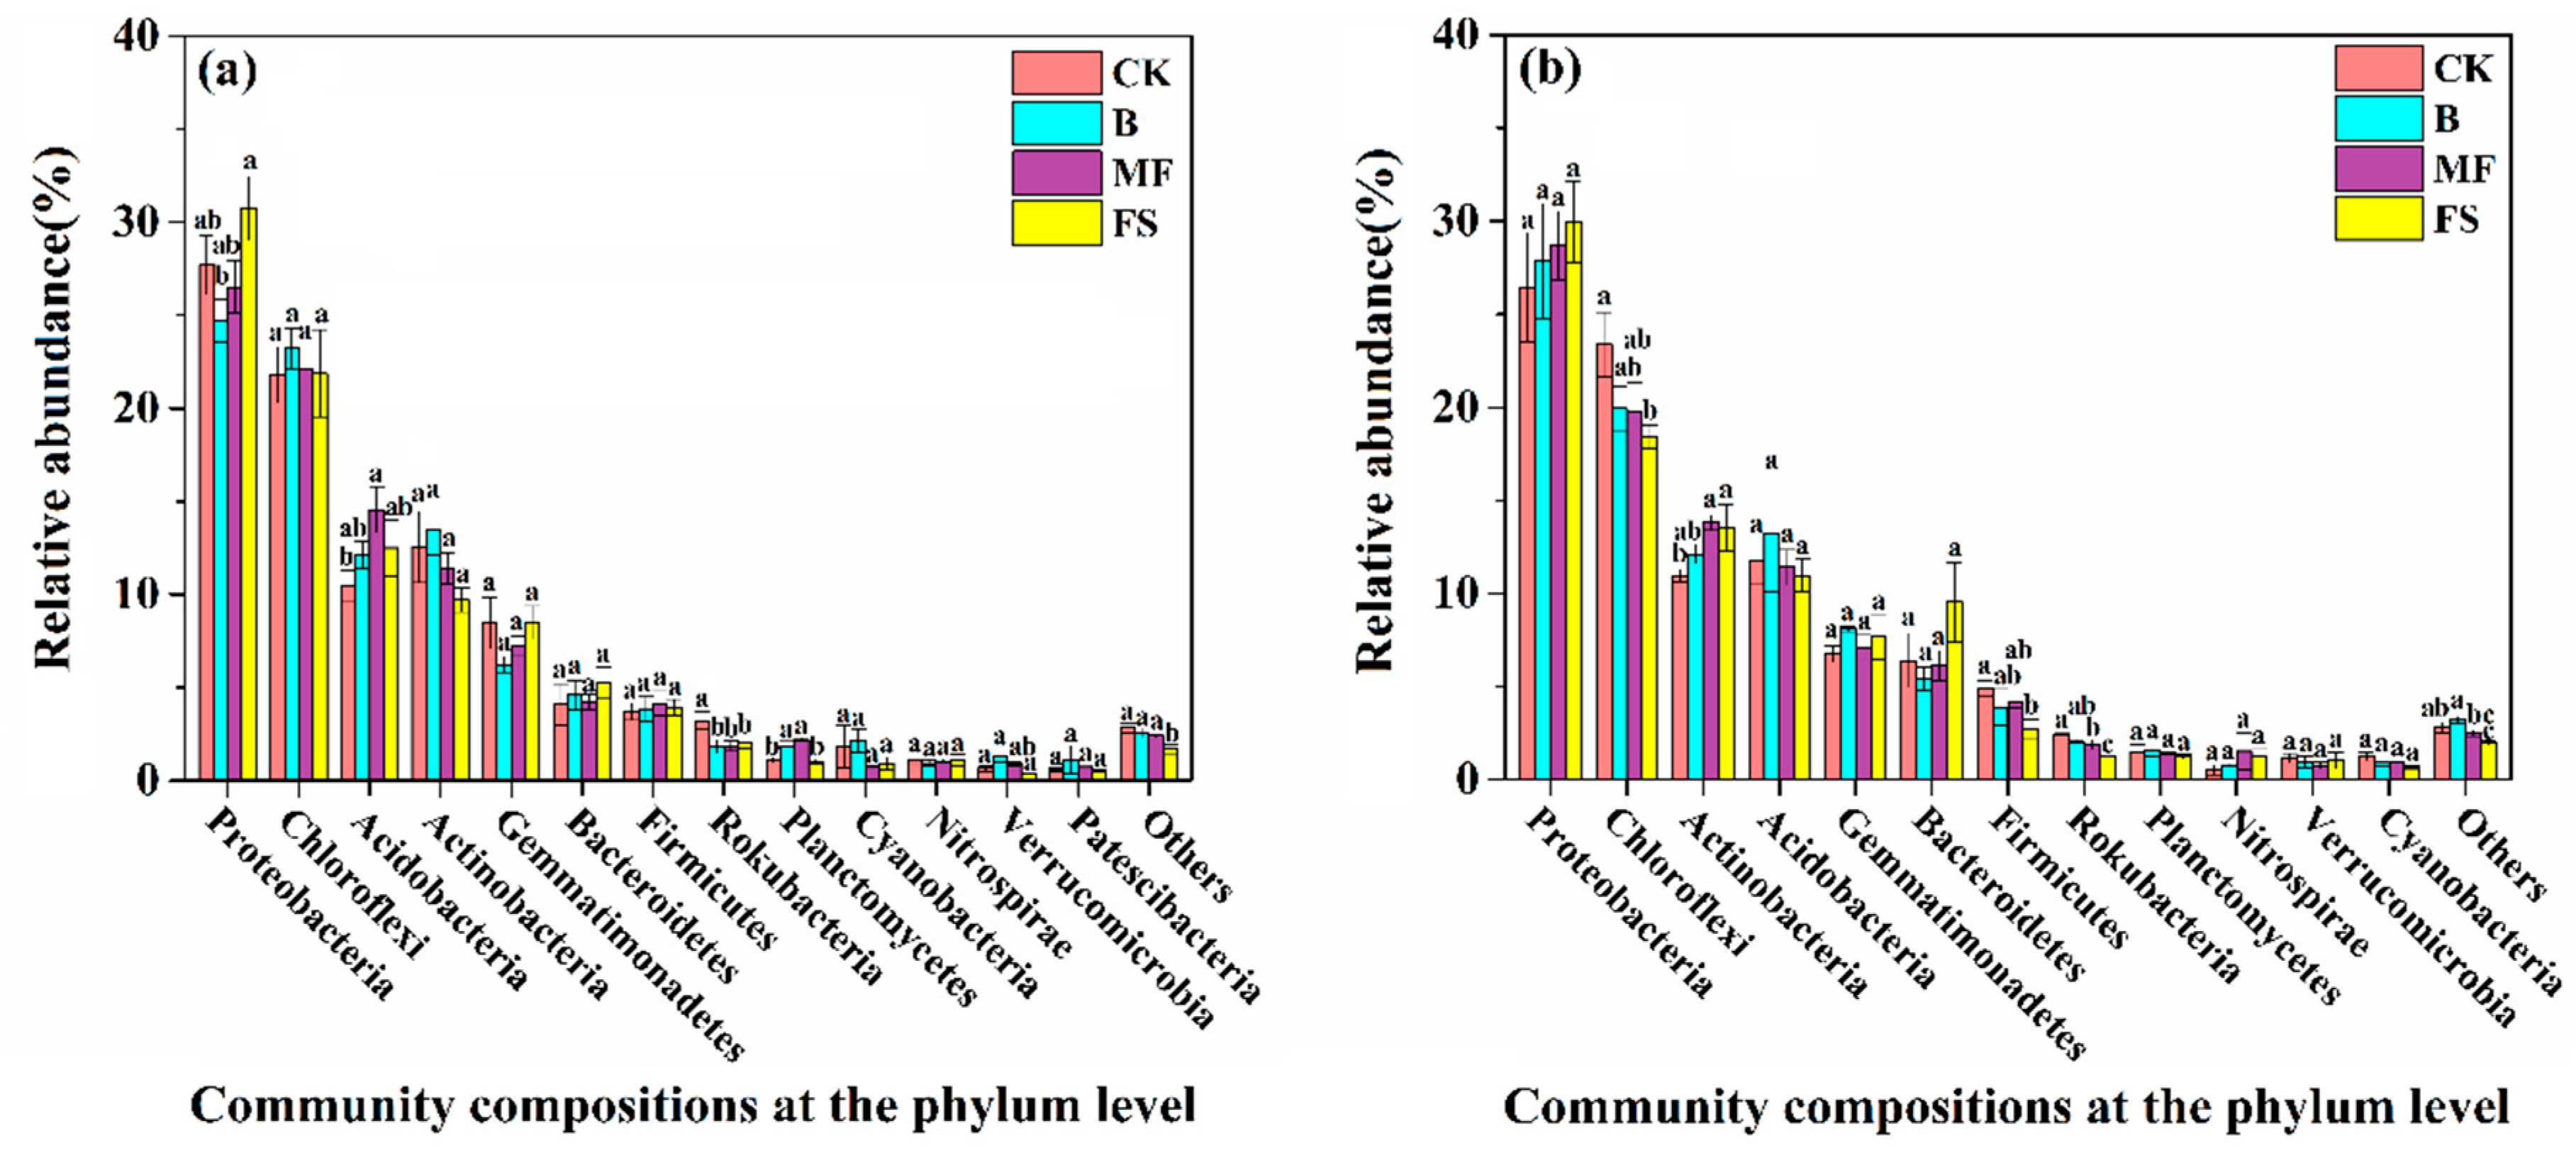
3.3. Bacterial Community Composition

The composition of the bacterial community was analyzed at the phylum level (Figure 2). A total of 13 and 12 phyla were detected in topsoil (Figure 2a) and rhizosphere (Figure 2b), respectively, and the dominant phyla (>10% of the total OTUs) were Proteobacteria, Chloroflexi, Acidobacteria, and Actinobacteria, which totally accounted for more than 70% of the whole soil bacterial community. The low-abundance phyla (1% to 10% of the total OTUs) were Gemmatimonadetes, Bacteroidetes, Firmicutes, Rokubacteria, and Planctomycetes. The four phyla (Proteobacteria, Acidobacteria, Rokubacteria, and Planctomycetes) were significantly different under four treatments in the topsoil (p < 0.05). Chloroflexi, Actinobacteria, Firmicutes, and Rokubacteria also responded significantly to different fertilizer additions to the rhizosphere (p < 0.05). Proteobacteria was higher under the FS than the CK in both soils. Acidobacteria was higher under the three fertilizer treatments than the CK in the topsoil, while no significant difference among treatments in the rhizosphere where observed. Chloroflexi and Firmicutes were less relative abundant among the treatments in the topsoil but were lower under other treatments in comparison with the CK in the rhizosphere. The percentage of Actinobacteria showed a decrease in the topsoil, while it was increased under all fertilizer treatments in the rhizosphere. Rokubacteria was decreased under all the fertilizer treatments in both soils.
At the genus level, there were 11 and 10 dominant genera which are unclassified in majority for the topsoil and rhizosphere, respectively (Figure 3a,b). Two unclassified genera in Subgroup_6 and Gemmatimonadaceae were the most abundant bacteria in both soils. The percentage of Norank_f_anaerolineaceae was decreased under all treatments in the rhizosphere. Norank_f_Actinobacteria and Norank_c_KD4-96 had no significant differences under all treatments in both soils. In addition, Nitrosospira and Massilia were in higher relative abundance under the FS treatment when compared to the other treatments for topsoil (p < 0.05). However, no significant differences were found under the rest fertilization treatments. Similar results were also found for Flavobacterium, Nitrosospira, and Pseudomonas in the rhizospheric soil.

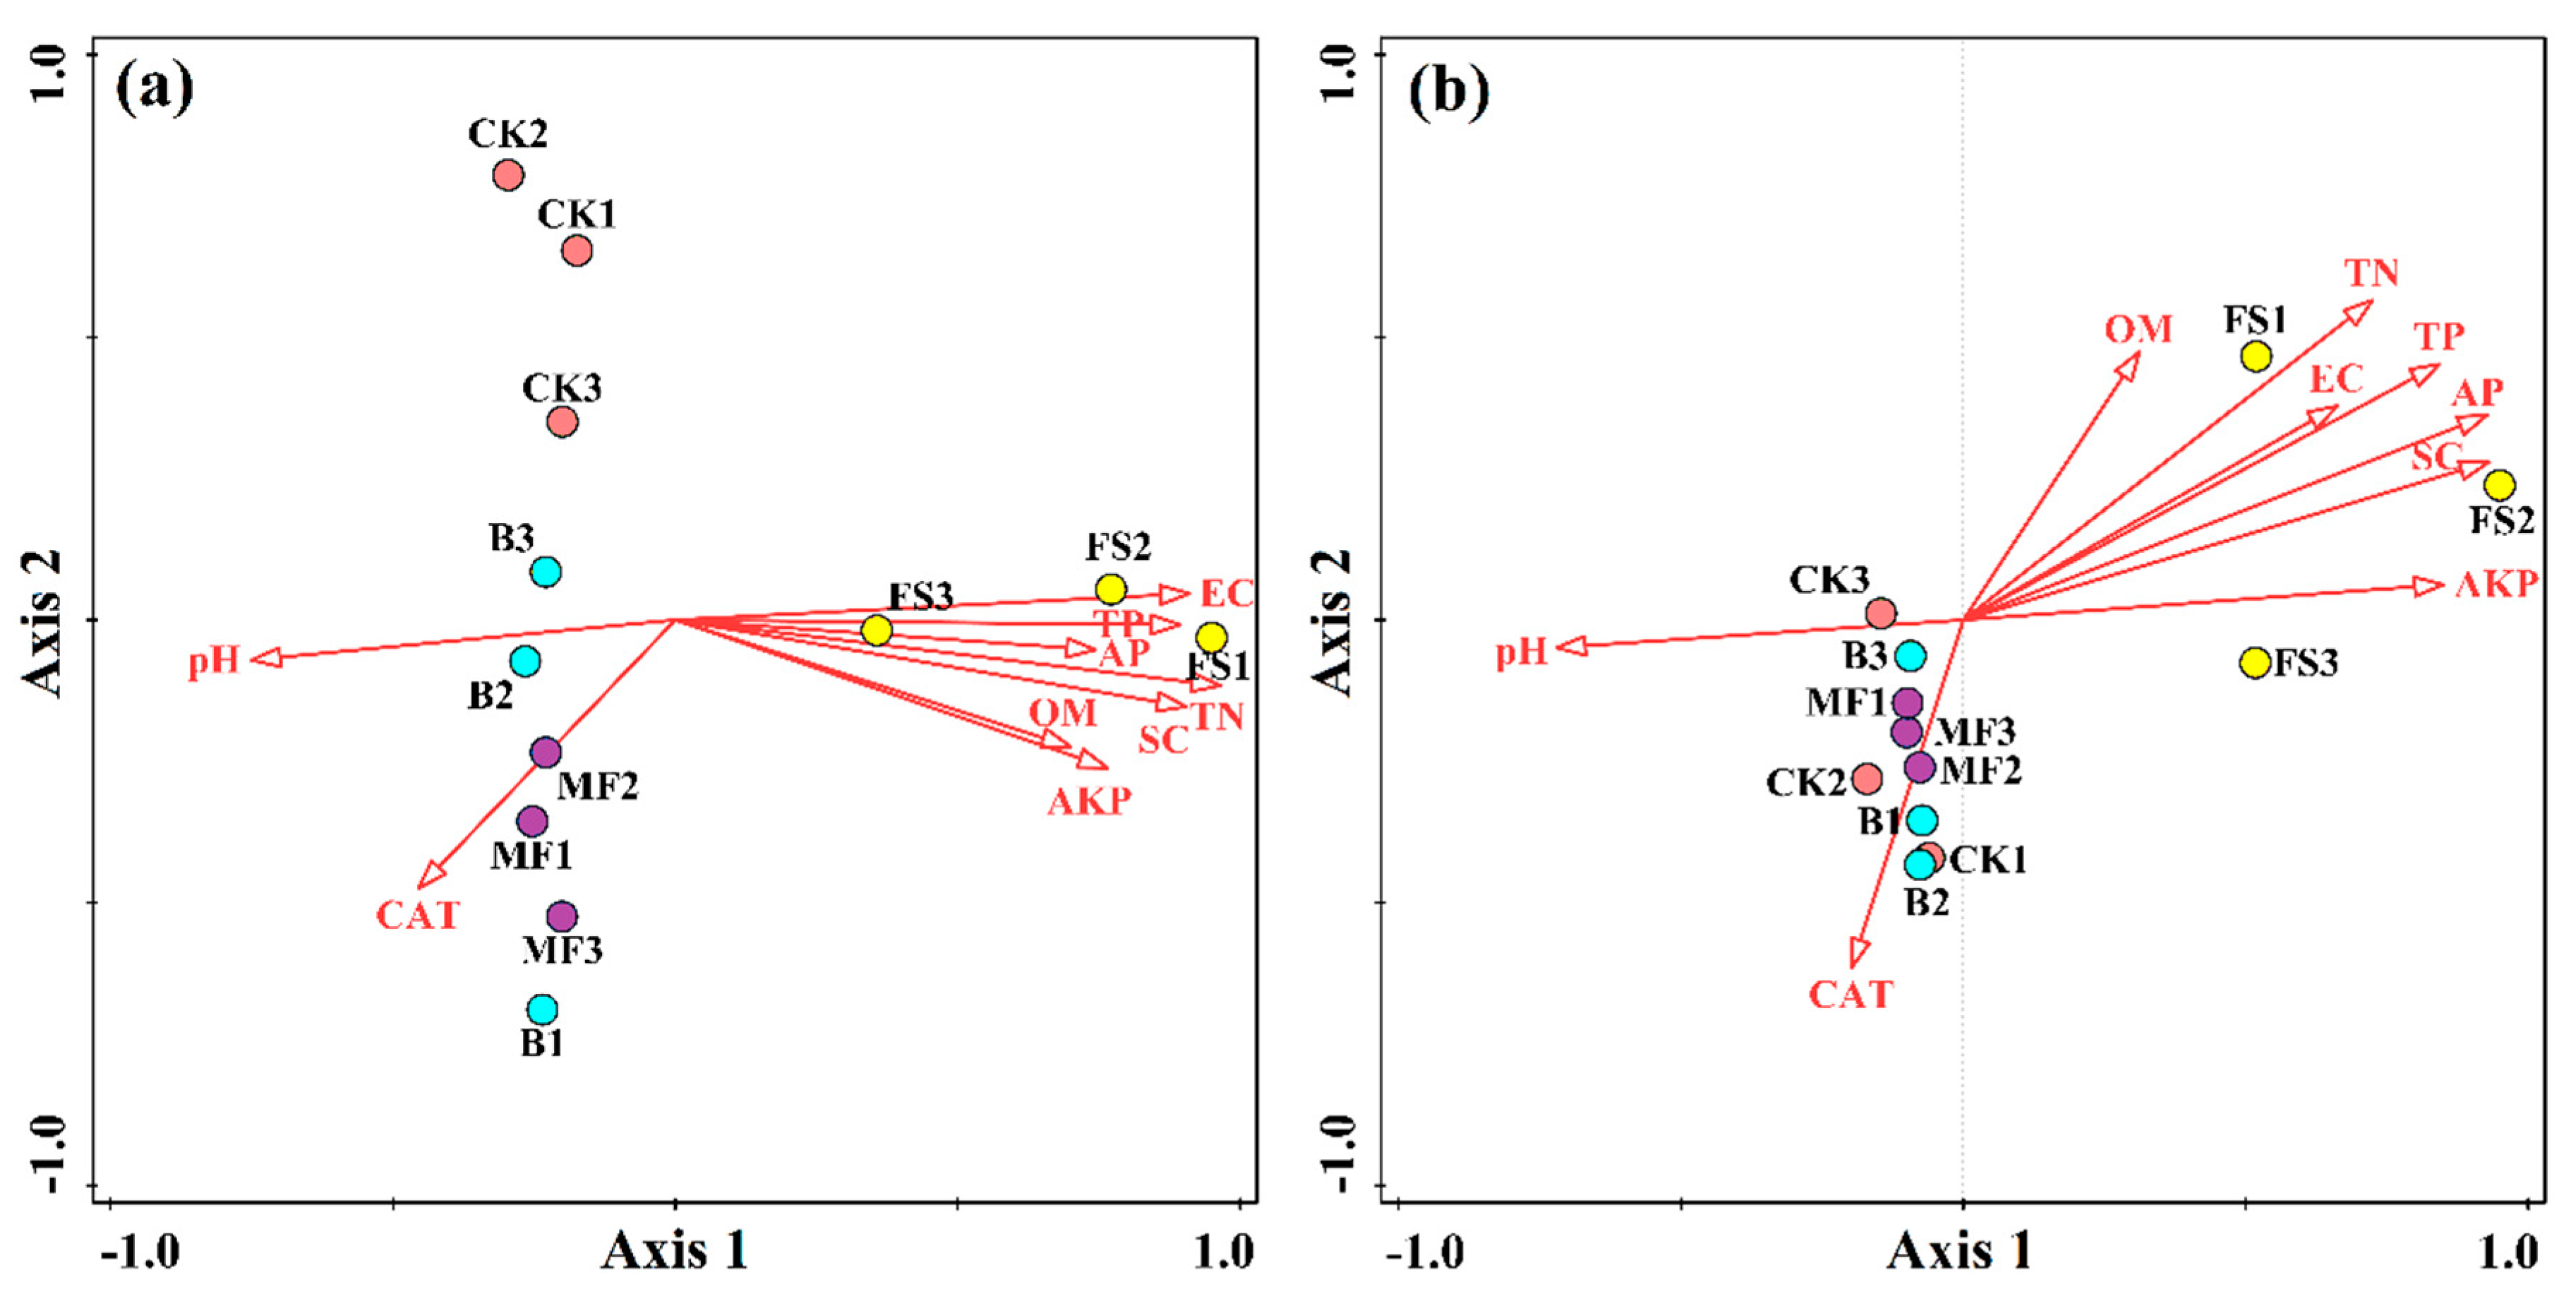
3.4. Relationship Between Bacterial Community Structure and Soil Properties

Redundancy analysis was used to determine the correlations between bacterial community and soil chemical properties. The first four axes (as constrained by the measured soil environmental variables) explained 77.09% and 68.15% of the total variation in the bacterial community structure for the topsoil and rhizosphere, respectively, with the first axis explaining 46.68% and 30.86%, and with the corresponding second axis explaining 13.18% and 19.29% (Figure 4). According to a Monte Carlo permutation test, the first canonical axis was highly significant in both the topsoil (F = 1.8; p = 0.002) and rhizosphere (F = 0.9; p = 0.032) community structures. Of the environmental factors examined, total N (F = 7.9, p = 0.004) and available phosphorus (F = 4.3, p = 0.004) were the dominant controls of soil bacterial community changes in the topsoil and rhizosphere, respectively, and explained 44.0% and 30.2% of the total variation in the bacteria community. In addition, bacterial community structures under the FS treatment were negatively correlated with soil pH in both soils.

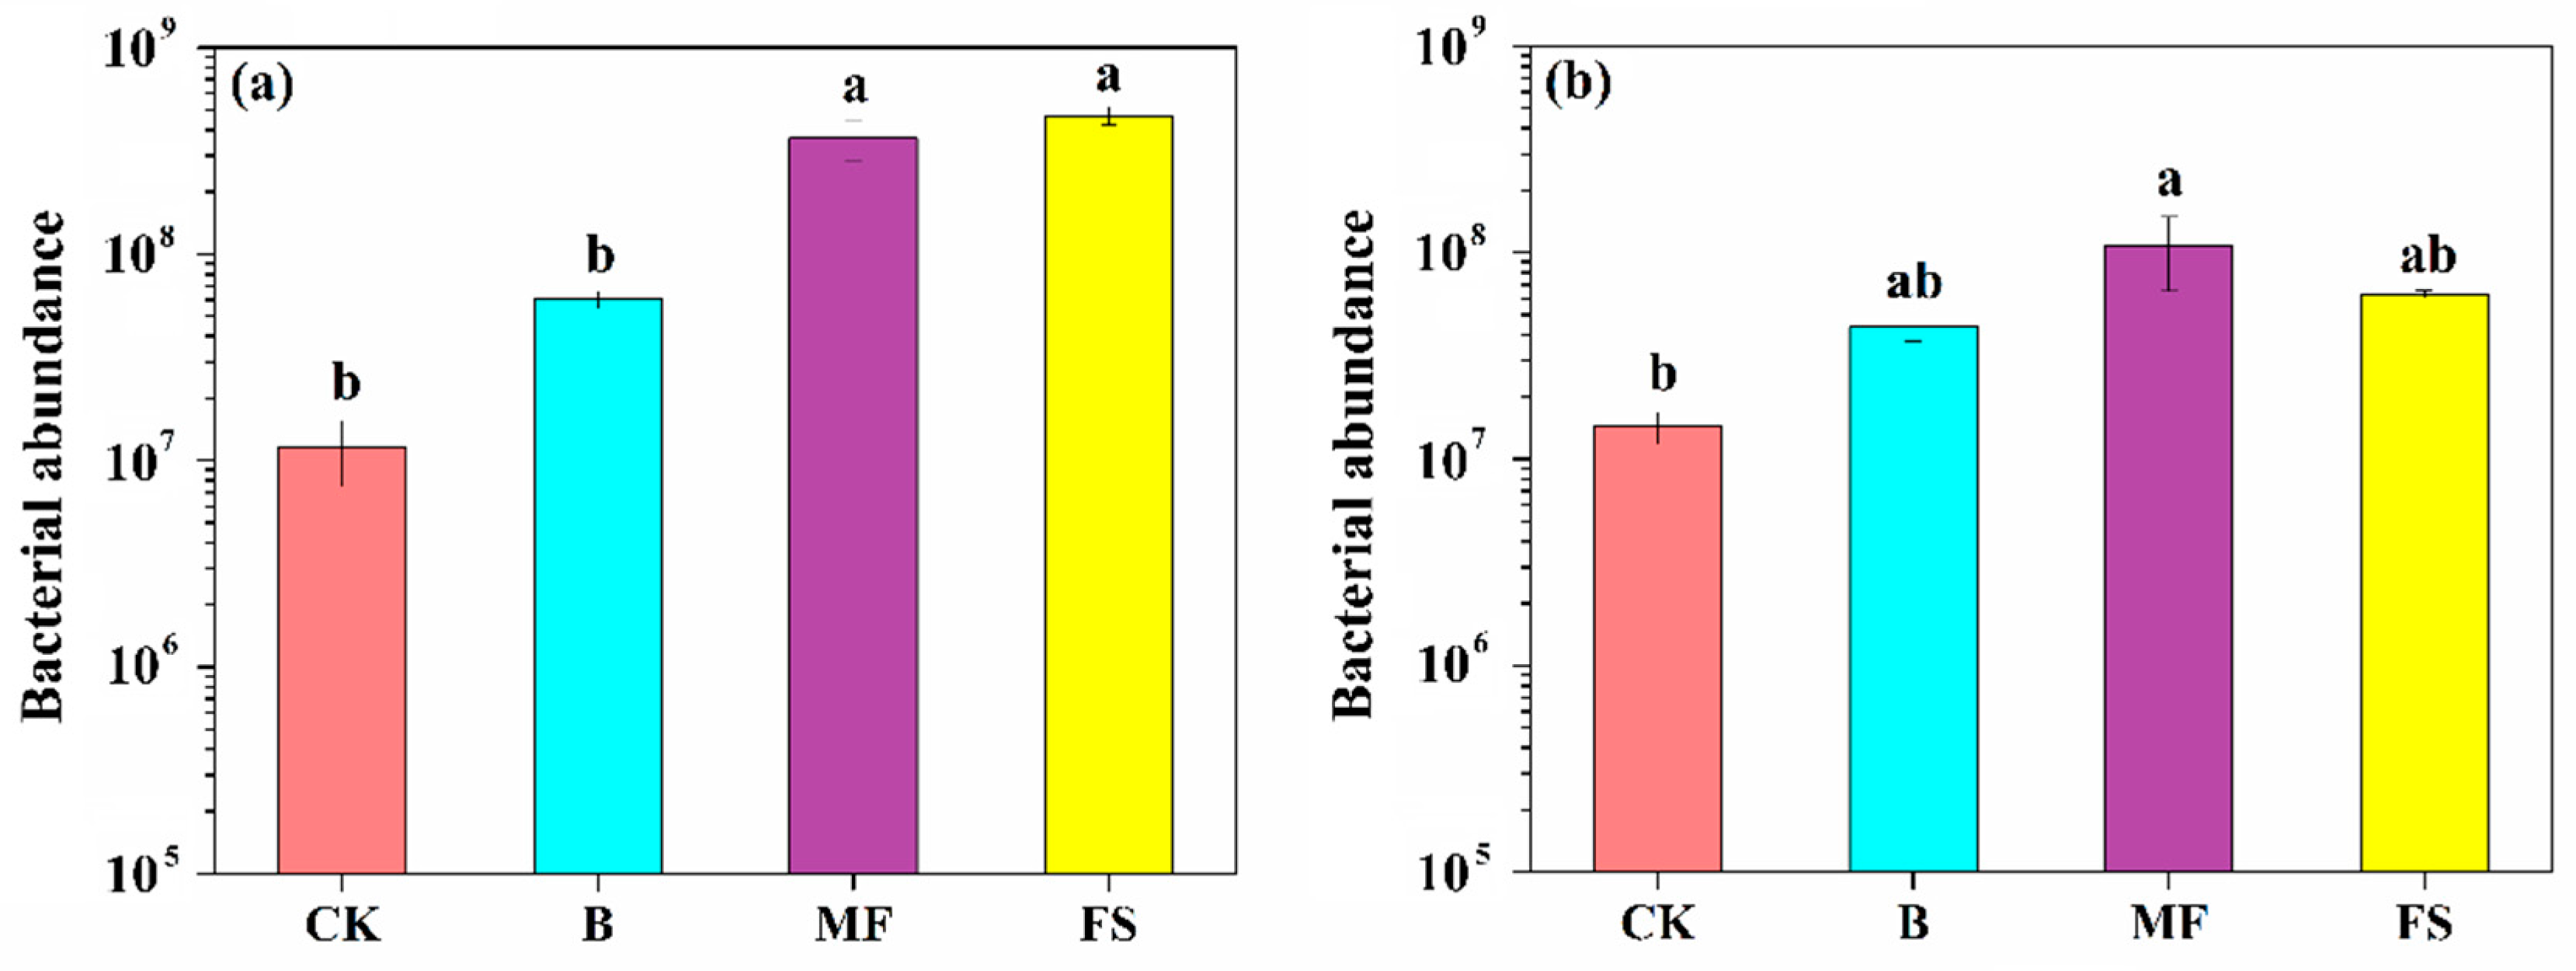
3.5. Quantification of Bacterial Abundance

The qPCR indicated that the gene copy numbers of the bacterial 16S rRNA gene were significantly higher under the B, MF, and FS than CK in the topsoil, and reached the maximum value of 4.69 × 10⁸ copies in the FS (Figure 5a). The absolute bacterial abundance under the MF (1.07 × 10⁹ copies) was significantly higher than other treatments in the rhizosphere (p < 0.05). However, no significant differences were found between the CK and B, and FS (p > 0.05, Figure 5b).

4. Discussion

We observed that soil bacterial diversity responded differently to short-term eco-friendly fertilizer addition. The Shannon and Ace indexes of the bacterial community showed no significant differences between the CK and B, and MF in both topsoil and rhizoshpere (p > 0.05) but decreased under the FS treatment (Figure 1 and Table A3). Previous studies have shown an inconsistent effect of fertilization on soil bacterial diversity [26,36]. This diversity effect of fertilization was probably due to the different sensitivity of soil bacterial community is likely to differ among the B, MF, and FS. Soil bacteria were characterized by higher total abundance while lower diversity under the FS treatment. This may be due to the increase in nutrients content and enzyme activities induced by the FS, which modified the microbial community in the soil and increased the number of dominant bacteria involved in nitrogen metabolism, organic matter degradation, the iron cycle, and photosynthesis, but reduced the number of non-dominant bacteria [11,37]. These results indicate that the addition of eco-friendly fertilizers had positive effects on the dominant bacteria.
The Proteobacteria, Chloroflexi, Acidobacteria and Actinobacteria were the dominant phyla in both soils, suggesting that they played important roles in croplands (Figure 2). However, their responses to eco-friendly fertilizers were different. This was probably associated with the difference in their environmental adaptability. It is known that the Proteobacteria are ubiquitous in soils and sediments for both arid and humid regions [38], and Acidobacteria usually thrive in soils with limited nutrients [39]. The addition of eco-friendly fertilizers resulted in the alteration of soil properties such as pH, total nitrogen and available phosphorus, leading to a decrease in relative abundance of some bacterial phyla. Another possible explanation was that bacteria in this phylum were inhibited by other promoted bacterial groups, through biological activities such as competition for food sources and the production of suppressive materials [26]. At the genus level, Nitrosospira and Massilia in the topsoil, and Flavobacterium, Nitrosospira and Pseudomonas in the rhizosphere were much higher under the FS treatment than others (Figure 3). Ge et al. [36] also found that the added fertilizers enhanced the relative abundance and the diversity of a certain bacterial population. However, this result was not consistent with that from Bates et al. [40], in which they found that the increase in N fertilization led to a reduction in the percentage of Nitrosospira, indicating a reduction in N-cycling function. This result in our study was probably associated with an increase in the relative abundance of these genera under a lower pH value [41].
The population size and community structure of soil bacteria are sensitive to changes in soil chemical properties [42]. Several studies showed that the addition of biochar could increase soil pH [13,43]. A Similar result was also found in this study that soil pH was higher under the B treatment. As most of the alkaline ash contained in biochar is soluble, it could increase the soil base saturation and further reduce the level of exchangeable hydrogen ions and aluminum ions in the soil [24]. However, the MF had little effect on soil pH, and the FS significantly decreased soil pH. The possible reason for this was that the absorption and utilization rate of urea and ammonia fertilizers, as enhanced by FS, led to a decrease in soil pH [44]. In addition, an increase in EC resulted in a decrease in pH [45]. As confirmed by our study, the FS significantly led to an increase in EC. Our results also show that the FS significantly increased soil nutrient contents (i.e., TP, TN, AP and OM) compared to other treatments. A similar result was also found by Zhou et al. [19]. The activity of soil enzyme could directly reflect the intensity and direction of the soil biochemical process [46]. SC and AKP, which were involved in C cycle and P mineralization, showed the highest activity under the FS treatment. Catalase activity has been used as an indicator of soil fertility [47]. In this study, the CAT was highest in MF, indicating that it promoted soil bacterial activity and metabolic potential. Overall, the short-term addition of fertilizers improved soil nutrients and enzyme activities. These results are in line with Dehsheikh et al. [48], who found that biofertilizers would improve soil microbial properties. Crop yield is an important indicator to measure the effect of fertilizers [49]. The addition of eco-friendly fertilizers increased cabbage plant height, crown width, fruit diameter and yield, further illustrating that eco-friendly fertilizer addition had positive effects on soil fertility.
The results of PCoA and RDA showed that bacterial community compositions of topsoil and rhizosphere under the FS treatment significantly differed from that under the CK, B, and MF treatments. The dominant factors for bacterial community composition were total nitrogen and available phosphorus in the topsoil and rhizosphere, respectively. The main reason for this was that the three eco-friendly fertilizers had diverse effects on soil with long-term chemical fertilizer application, and the utilization rate of fertilizers were different between the topsoil and rhizosphere bacteria. However, RDA showed similar results for CK, B, and MF. The possible reason for this was that the diversity and richness of the bacterial community varied insignificantly between the CK and B as well as MF. Soil nutrients were closely related to bacterial communities, while soil nutrient contents (i.e., TP, TN, AP and OM) showed no significant differences among CK, B, and MF. In addition, the relative abundance of whole bacterial community was also less varied.

5. Conclusions

Cabbage growth characteristics (i.e., plant height, crown width, fruit diameter and yield) were increased in varying degrees under three eco-friendly fertilizers. Soil nutrient contents (i.e., TP, TN, AP and OM) and soil enzyme activities (i.e., UE, SC, AKP, and CAT) responded differently to three fertilizers. The FS treatment significantly enhanced soil nutrient contents between the topsoil and rhizosphere. The Shannon and Ace indexes of the bacterial community under B and MF treatments were significantly higher than that under the FS treatment in both soils, but the absolute bacterial abundance was maximal under the FS treatment in the topsoil and the MF treatment in the rhizosphere. The shifts in the soil bacterial community composition of both soils were closely related to soil biogeochemical properties, especially soil nutrients (soil total N and available phosphorus). Therefore, the application of eco-friendly fertilizer could be considered in fertilization management so as to maximize the quality of soil in supplying crop yield in arid agroecosystems.

Author Contributions

Y.L. and Z.W. conceived and designed the experiments. Y.L., W.Z., L.Z., J.Q., Y.W., and P.Z. performed the experiments. Y.L., Z.W., L.Z., and N.Z. analyzed the data and prepared figures and tables. Y.L., Z.W., and W.Z. contributed significantly to writing and revising the manuscript. All authors have read and agreed to the published version of the manuscript.

Funding

This work was financially supported by the Key Research and Development Program of Ningxia Hui Autonomous Region, China (grant no. 2018BBF02021) and the National Key Research and Development Program of China (2019YFC0507603-3).

Conflicts of Interest

The authors declare no conflict of interest.

Appendix A

Figure A1. Effect of different treatments on cabbage growth in the heading stage. CK, base fertilizer (a); B, biochar (b); MF, microbial fertilizer (c); FS, fertilizer synergist (d). Plant spacing (40 cm) and row spacing (60 cm).
Sustainability 12 04803 g0a1
Table A1. Sequence information of all samples in topsoil.
SamplesSequence NumbersBase NumbersMean LengthMinimum LengthMaximum Length
CK16628227658924417.3312512
CK27206730124601418.0220476
CK36210525882367416.8204488
CK Even6681827888631417.4245492
B16415826764080417.2245514
B26408926618299415.3238519
B37079229531375417.2203477
B Even6634627637918416.5229503
MF16111225451186416.5246488
MF25986324963098417.0306495
MF35447322681732416.4202500
MF Even5848324365339416.6251494
FS16557627353010417.1232487
FS26348926484438417.2283509
FS35512922994710417.1245468
FS Even6139825610719417.1253488
CK, base fertilizer; B, biochar; MF, microbial fertilizer; FS, fertilizer synergist.
Table A2. Sequence information of all samples in rhizosphere.
SamplesSequence NumbersBase NumbersMean LengthMinimum LengthMaximum Length
CK16659327799418417.5244468
CK25899024583105416.7265512
CK37473431215183417.7216512
CK Even6677227865902417.3242497
B16419426781738417.2227498
B25327722246172417.6245520
B36248026119546418.0245481
B Even5998425049152417.6239500
MF15465922805944417.2245503
MF26576627404662416.7222511
MF35820524298646417.5298468
MF Even5954324836417417.1255494
FS16602627535674417.0211497
FS25656223617658417.6287469
FS35916624732261418.0277511
FS Even6058525295198417.5258492
CK, base fertilizer; B, biochar; MF, microbial fertilizer; FS, fertilizer synergist.
Table A3. Overview of bacterial community for topsoil and rhizoshpere.
DepthSamplePhylumClassOrderFamilyGenusSpeciesOTUs
TopsoilCK3911131151995219475892
B3911031051196620076146
MF3910930651697419916228
FS3710728447490017915024
Rhizosphere CK3910529449592119325865
B3910830250996619795903
MF3810530251897620295950
FS3710429048491718535202
CK, base fertilizer; B, biochar; MF, microbial fertilizer; FS, fertilizer synergist.
Figure A2. Principal coordinate analysis (PCoA) of the bacterial community in the topsoil (a) and rhizosphere soil (b) under different fertilization treatments. Data are based on three replicates (1–3) per sample. CK, base fertilizer; B, biochar; MF, microbial fertilizer; FS, fertilizer synergist.
Sustainability 12 04803 g0a2

References

  1. Lin, Y.; Ye, G.; Kuzyakov, Y.; Liu, D.; Fan, J.; Ding, W. Long-term manure application increases soil organic matter and aggregation, and alters microbial community structure and keystone taxa. Soil Biol. Biochem. 2019, 134, 187–196. [Google Scholar] [CrossRef]
  2. Wu, L.; Zhang, W.; Wei, W.; He, Z.; Kuzyakov, Y.; Bol, R.; Hu, R. Soil organic matter priming and carbon balance after straw addition is regulated by long-term fertilization. Soil Biol. Biochem. 2019, 135, 383–391. [Google Scholar] [CrossRef]
  3. Xu, A.; Li, L.; Xie, J.; Wang, X.; Coulter, J.A.; Liu, C.; Wang, L. Effect of long-term nitrogen addition on wheat yield, nitrogen use efficiency, and residual soil nitrate in a semiarid area of the Loess Plateau of China. Sustainability 2020, 12, 1735. [Google Scholar] [CrossRef] [Green Version]
  4. Geisseler, D.; Scow, K.M. Long-term effects of mineral fertilizers on soil microorganisms—A review. Soil Biol. Biochem. 2014, 75, 54–63. [Google Scholar] [CrossRef]
  5. Fan, K.; Delgado-Baquerizo, M.; Guo, X.; Wang, D.; Wu, Y.; Zhu, M.; Yu, W.; Yao, H.; Zhu, Y.G.; Chu, H. Suppressed N fixation and diazotrophs after four decades of fertilization. Microbiome 2019, 7, 1–10. [Google Scholar] [CrossRef] [PubMed]
  6. Zhao, J.; Ni, T.; Li, J.; Lu, Q.; Fang, Z.; Huang, Q.; Zhang, R.; Li, R.; Shen, B.; Shen, Q. Effects of organic-inorganic compound fertilizer with reduced chemical fertilizer application on crop yields, soil biological activity and bacterial community structure in a rice-wheat cropping system. Appl. Soil Ecol. 2016, 99, 1–12. [Google Scholar] [CrossRef]
  7. Wang, Z.; Liu, Y.; Zhao, L.; Zhang, W.; Liu, L. Change of soil microbial community under long-term fertilization in a reclaimed sandy agricultural ecosystem. PeerJ 2019, 2019, 1–21. [Google Scholar] [CrossRef]
  8. Liu, X.; Zhang, F. Nitrogen fertilizer induced greenhouse gas emissions in China. Curr. Opin. Environ. Sustainability 2011, 3, 407–413. [Google Scholar]
  9. Wehmeyer, H.; de Guia, A.H.; Connor, M. Reduction of fertilizer use in South China—Impacts and implications on smallholder rice farmers. Sustainability 2020, 12, 2240. [Google Scholar] [CrossRef] [Green Version]
  10. Hu, X.; Liu, J.; Wei, D.; Zhu, P.; Cui, X.; Zhou, B.; Chen, X.; Jin, J.; Liu, X.; Wang, G. Soil bacterial communities under different long-term fertilization regimes in three locations across the Black Soil region of Northeast China. Pedosphere 2018, 28, 751–763. [Google Scholar] [CrossRef]
  11. Timilsena, Y.P.; Adhikari, R.; Casey, P.; Muster, T.; Gill, H.; Adhikari, B. Enhanced efficiency fertilisers: A review of formulation and nutrient release patterns. J. Sci. Food Agric. 2015, 95, 1131–1142. [Google Scholar] [CrossRef] [PubMed]
  12. Ritika, B.; Utpal, D. Biofertilizer, a way towards organic agriculture: A review. Afr. J. Microbiol. Res. 2014, 8, 2332–2343. [Google Scholar] [CrossRef] [Green Version]
  13. Dai, Z.; Zhang, X.; Tang, C.; Muhammad, N.; Wu, J.; Brookes, P.C.; Xu, J. Potential role of biochars in decreasing soil acidification—A critical review. Sci. Total Environ. 2017, 581–582, 601–611. [Google Scholar] [CrossRef] [PubMed]
  14. Ameloot, N.; Sleutel, S.; Das, K.C.; Kanagaratnam, J.; de Neve, S. Biochar amendment to soils with contrasting organic matter level: Effects on N mineralization and biological soil properties. GCB Bioenergy 2015, 7, 135–144. [Google Scholar] [CrossRef]
  15. Gul, S.; Whalen, J.K. Biochemical cycling of nitrogen and phosphorus in biochar-amended soils. Soil Biol. Biochem. 2016, 103, 1–15. [Google Scholar] [CrossRef]
  16. Aseri, G.K.; Jain, N.; Panwar, J.; Rao, A.V.; Meghwal, P.R. Biofertilizers improve plant growth, fruit yield, nutrition, metabolism and rhizosphere enzyme activities of Pomegranate (Punica granatum L.) in Indian Thar Desert. Sci. Hortic. 2008, 117, 130–135. [Google Scholar] [CrossRef]
  17. Khosro, M.; Yousef, S. Bacterial Biofertilizers for Sustainable Crop Production: A Review. J. Agric. Bol. Sci. 2012, 7, 307–316. [Google Scholar]
  18. Bhardwaj, D.; Ansari, M.W.; Sahoo, R.K.; Tuteja, N. Biofertilizers function as key player in sustainable agriculture by improving soil fertility, plant tolerance and crop productivity. Microb. Cell Fact. 2014, 13, 1–10. [Google Scholar] [CrossRef] [Green Version]
  19. Zhou, L.; Zhao, P.; Chi, Y.; Wang, D.; Wang, P.; Liu, N.; Cai, D.; Wu, Z.; Zhong, N. Controlling the hydrolysis and loss of nitrogen fertilizer (urea) by using a nanocomposite favors plant growth. ChemSusChem 2017, 10, 2068–2079. [Google Scholar] [CrossRef]
  20. Bamminger, C.; Zaiser, N.; Zinsser, P.; Lamers, M.; Kammann, C.; Marhan, S. Effects of biochar, earthworms, and litter addition on soil microbial activity and abundance in a temperate agricultural soil. Biol. Fertil. Soils 2014, 50, 1189–1200. [Google Scholar] [CrossRef]
  21. Dangi, S.; Gao, S.; Duan, Y.; Wang, D. Soil microbial community structure affected by biochar and fertilizer sources. Appl. Soil Ecol. 2020, 150, 103452. [Google Scholar] [CrossRef]
  22. Wu, S.C.; Cao, Z.H.; Li, Z.G.; Cheung, K.C.; Wong, M.H. Effects of biofertilizer containing N-fixer, P and K solubilizers and AM fungi on maize growth: A greenhouse trial. Geoderma 2005, 125, 155–166. [Google Scholar] [CrossRef]
  23. Pereira, I.; Ortega, R.; Barrientos, L.; Moya, M.; Reyes, G.; Kramm, V. Development of a biofertilizer based on filamentous nitrogen-fixing cyanobacteria for rice crops in Chile. J. Appl. Phycol. 2009, 21, 135–144. [Google Scholar] [CrossRef]
  24. Zhang, A.; Cui, L.; Pan, G.; Li, L.; Hussain, Q.; Zhang, X.; Zheng, J.; Crowley, D. Effect of biochar amendment on yield and methane and nitrous oxide emissions from a rice paddy from Tai Lake plain, China. Agric. Ecosyst. Environ. 2010, 139, 469–475. [Google Scholar] [CrossRef]
  25. Locey, K.J.; Lennon, J.T. Scaling laws predict global microbial diversity. Proc. Natl. Acad. Sci. USA 2016, 113, 5970–5975. [Google Scholar] [CrossRef] [Green Version]
  26. Eo, J.; Park, K.C. Long-term effects of imbalanced fertilization on the composition and diversity of soil bacterial community. Agric. Ecosyst. Environ. 2016, 231, 176–182. [Google Scholar] [CrossRef]
  27. Tian, G.; Vose, J.M.; Coleman, D.C.; Geron, C.D.; Walker, J.T. Evaluation of the effectiveness of riparian zone restoration in the southern Appalachians by assessing soil microbial populations. Appl. Soil Ecol. 2004, 26, 63–68. [Google Scholar] [CrossRef] [Green Version]
  28. Bulgarelli, D.; Rott, M.; Schlaeppi, K.; Ver Loren van Themaat, E.; Ahmadinejad, N.; Assenza, F.; Rauf, P.; Huettel, B.; Reinhardt, R.; Schmelzer, E.; et al. Revealing structure and assembly cues for Arabidopsis root-inhabiting bacterial microbiota. Nature 2012, 488, 91–95. [Google Scholar] [CrossRef] [PubMed]
  29. Berendsen, R.L.; Pieterse, C.M.J.; Bakker, P.A.H.M. The rhizosphere microbiome and plant health. Trends Plant Sci. 2012, 17, 478–486. [Google Scholar] [CrossRef] [PubMed]
  30. Allison, S.D.; Martiny, J.B.H. Resistance, resilience, and redundancy in microbial communities. Light Evol. 2009, 2, 149–166. [Google Scholar] [CrossRef] [PubMed] [Green Version]
  31. Gao, Z.; Han, M.; Hu, Y.; Li, Z.; Liu, C.; Wang, X.; Tian, Q.; Jiao, W.; Hu, J.; Liu, L.; et al. Effects of continuous cropping of sweet potato on the fungal community structure in rhizospheric soil. Front. Microbiol. 2019, 10, 2269. [Google Scholar] [CrossRef] [PubMed]
  32. Walkley, A.; Black, I.A. An examination of the degtjareff method for determining soil organic matter, and a proposed modification of the chromic acid titration method. Soil Sci. 1934, 37, 29–38. [Google Scholar] [CrossRef]
  33. Sommers, L.E.; Nelson, D.W. Determination of total phosphorus in soils: A rapid perchloric acid digestion procedure. Soil Sci. Soc. Am. J. 1972, 36, 902–904. [Google Scholar] [CrossRef]
  34. Galanos, D.S.; Kapoulas, V.M. A rapid method for the determination of organic nitrogen and phosphorus based on a single perchloric acid digestion. Anal. Chim. Acta 1966, 34, 360–366. [Google Scholar] [CrossRef]
  35. Liu, L.; Liu, Y.; Zhang, P.; Song, G.; Hui, R.; Wang, Z.; Wang, J. Development of bacterial communities in biological soil crusts along a revegetation chronosequence in the Tengger Desert, northwest China. Biogeosciences 2017, 14, 3801–3814. [Google Scholar] [CrossRef] [Green Version]
  36. Ge, Y.; Zhang, J.B.; Zhang, L.M.; Yang, M.; He, J.Z. Long-term fertilization regimes affect bacterial community structure and diversity of an agricultural soil in northern China. J. Soils Sediments 2008, 8, 43–50. [Google Scholar] [CrossRef]
  37. Jiang, S.Q.; Yu, Y.N.; Gao, R.W.; Wang, H.; Zhang, J.; Li, R.; Long, X.H.; Shen, Q.R.; Chen, W.; Cai, F. High-throughput absolute quantification sequencing reveals the effect of different fertilizer applications on bacterial community in a tomato cultivated coastal saline soil. Sci. Total Environ. 2019, 687, 601–609. [Google Scholar] [CrossRef]
  38. Fierer, N.; Lauber, C.L.; Ramirez, K.S.; Zaneveld, J.; Bradford, M.A.; Knight, R. Comparative metagenomic, phylogenetic and physiological analyses of soil microbial communities across nitrogen gradients. ISME J. 2012, 6, 1007–1017. [Google Scholar] [CrossRef] [Green Version]
  39. Fierer, N.; Bradford, M.A.; Jackson, R.B. Toward an ecological classification of soil bacteria. Ecology 2007, 88, 1354–1364. [Google Scholar] [CrossRef]
  40. Bates, S.T.; Berg-Lyons, D.; Caporaso, J.G.; Walters, W.A.; Knight, R.; Fierer, N. Examining the global distribution of dominant archaeal populations in soil. ISME J. 2011, 5, 908–917. [Google Scholar] [CrossRef] [PubMed] [Green Version]
  41. De Boer, W.; Laanbroek, H.J. Ureolytic nitrification at low pH by Nitrosospira spec. Arch. Microbiol. 1989, 152, 178–181. [Google Scholar] [CrossRef]
  42. Xue, D.; Yao, H.; Huang, C. Microbial biomass, N mineralization and nitrification, enzyme activities, and microbial community diversity in tea orchard soils. Plant. Soil 2006, 288, 319–331. [Google Scholar] [CrossRef]
  43. Dai, Z.; Wang, Y.; Muhammad, N.; Yu, X.; Xiao, K.; Meng, J.; Liu, X.; Xu, J.; Brookes, P.C. The effects and mechanisms of soil acidity changes, following incorporation of biochars in three soils differing in initial pH. Soil Sci. Soc. Am. J. 2014, 78, 1606–1614. [Google Scholar] [CrossRef]
  44. Saha, B.K.; Rose, M.T.; Wong, V.N.L.; Cavagnaro, T.R.; Patti, A.F. Nitrogen dynamics in soil fertilized with slow release brown coal-urea fertilizers. Sci. Rep. 2018, 8, 1–10. [Google Scholar] [CrossRef] [PubMed]
  45. Liu, Y.; Wang, Z.; Zhao, L.; Wang, X.; Liu, L.; Hui, R.; Zhang, W.; Zhang, P.; Song, G.; Sun, J. Differences in bacterial community structure between three types of biological soil crusts and soil below crusts from the Gurbantunggut Desert, China. Eur. J. Soil Sci. 2019, 70, 630–643. [Google Scholar] [CrossRef]
  46. Burns, R.G.; DeForest, J.L.; Marxsen, J.; Sinsabaugh, R.L.; Stromberger, M.E.; Wallenstein, M.D.; Weintraub, M.N.; Zoppini, A. Soil enzymes in a changing environment: Current knowledge and future directions. Soil Biol. Biochem. 2013, 58, 216–234. [Google Scholar] [CrossRef]
  47. Trasar-Cepeda, C.; Gil-Sotres, F.; Leirós, M.C. Thermodynamic parameters of enzymes in grassland soils from Galicia, NW Spain. Soil Biol. Biochem. 2007, 39, 311–319. [Google Scholar] [CrossRef]
  48. Boveiri Dehsheikh, A.; Mahmoodi Sourestani, M.; Zolfaghari, M.; Enayatizamir, N. Changes in soil microbial activity, essential oil quantity, and quality of Thai basil as response to biofertilizers and humic acid. J. Clean. Prod. 2020, 256, 120439. [Google Scholar] [CrossRef]
  49. Du, Y.; Cui, B.; Zhang, Q.; Wang, Z.; Sun, J.; Niu, W. Effects of manure fertilizer on crop yield and soil properties in China: A meta-analysis. Catena 2020, 193, 104617. [Google Scholar] [CrossRef]
Figure 1. Shannon diversity and Ace richness indices at Operational Units’ (OTUs) level of bacterial community in the topsoil (a,b) and rhizosphere (c,d) under different fertilization treatments. CK, base fertilizer; B, biochar; MF, microbial fertilizer; FS, fertilizer synergist. Different letters above error bars among treatments indicate significant differences based on one-way ANOVA (Duncan test) at the 0.05 level.
Sustainability 12 04803 g001
Figure 2. Bacterial community compositions at the phyla level in the topsoil (a) and rhizosphere (b) under different fertilization treatments. CK, base fertilizer; B, biochar; MF, microbial fertilizer; FS, fertilizer synergist. Different letters above error bars among treatments indicate significant differences based on one-way ANOVA (Duncan test) at the 0.05 level.
Sustainability 12 04803 g002
Figure 3. Bacterial community compositions at the genus level in the topsoil (a) and rhizosphere (b) under different fertilization treatments. Major bacteria had an abundance of >3% in at least one sample. CK, base fertilizer; B, biochar; MF, microbial fertilizer; FS, fertilizer synergist. Different letters above error bars among treatments indicate significant differences based on one-way ANOVA (Duncan test) at the 0.05 level.
Sustainability 12 04803 g003
Figure 4. Redundancy analysis (RDA) of bacterial community structures in relation to topsoil (a) and rhizosphere (b) physiochemical properties. The arrows indicate the direction and magnitude of the soil chemical index associated with bacterial community structures. The length of the arrows in the RDA plot correspond to the strength of the correlation between variables and community structure. Each circle represents the bacterial community structure for each sample (three replicates per sample, 1–3). CK, Base fertilizer; B, biochar; MF, microbial fertilizer; FS, fertilizer synergist. EC, electrical conductivity; OM, organic matter; TP, total P; TN, total nitrogen; AP, available P; AKP, alkaline phosphatase; DHA, dehydrogenase; SC, sucrose; CAT, catalase; UE, urease.
Sustainability 12 04803 g004
Figure 5. Absolute abundances of bacteria in the topsoil (a) and rhizosphere (b) under different fertilization treatments. CK, base fertilizer; B, biochar; MF, microbial fertilizer; FS, fertilizer synergist. Different letters above error bars among treatments indicate significant differences based on one-way ANOVA (Duncan test) at the 0.05 level.
Sustainability 12 04803 g005
Table 1. Effect of different treatments on cabbage growth characteristics.
TreatmentPlant Height (cm)Crow Width (cm)Fruit Diameter (cm)Yield (t ha−1)
CK14.73 ± 0.18 c33.80 ± 0.75 c12.47 ± 0.32 c42.65 ± 2.15 b
B16.10 ± 0.17 b37.87 ± 0.35 b13.63 ± 0.09 b47.88 ± 2.11 ab
MF16.67 ± 0.09 a39.07 ± 0.26 b14.57 ± 0.18 a49.89 ± 1.34 a
FS16.77 ± 0.09 a40.83 ± 0.24 a14.93 ± 0.33 a51.56 ± 2.64 a
CK, base fertilizer; B, biochar; MF, microbial fertilizer; FS, fertilizer synergist. The plant height and crown width were measured during the heading stage. Fruit diameter and yield were measured during the maturity stage. The mean value ± standard deviation (n = 3). Different letters after means among treatments indicate significant differences based on one-way ANOVA (Duncan test) at the 0.05 level.
Table 2. Soil chemical properties of the topsoil and rhizosphere under different fertilization treatments.
DepthSamplepHEC (μs cm−1)OM (g kg−1)TP (mg kg−1)TN (mg kg−1)AP (mg kg−1)
TopsoilCK7.80 ± 0.05 b342.33 ± 39.82 b10.92 ± 1.71 b654.43 ± 7.74 b641.40 ± 34.48 b21.53 ± 5.05 b
B8.23 ± 0.10 a227.27 ± 21.94 b12.92 ± 1.09 b608.89 ± 25.74 b640.06 ± 10.74 b22.13 ± 2.22 b
MF7.65 ± 0.10 b364.67 ± 43.47 b11.40 ± 0.21 b716.65 ± 36.53 b708.35 ± 24.79 b34.87 ± 6.37 b
FS7.28 ± 0.05 c720.00 ± 26.58 a17.15 ± 1.22 a1316.97 ± 75.85 a1044.42 ± 72.03 a220.04 ± 89.57 a
RhizosphereCK7.59 ± 0.03 bc405.33 ± 70.76 b9.04 ± 0.64 b660.20 ± 17.36 b618.86 ± 24.45 b24.34 ± 8.25 b
B8.24 ± 0.17 a232.10 ± 43.05 b14.95 ± 1.49 a588.87 ± 49.89 b634.99 ± 50.78 b24.18 ± 5.26 b
MF7.86 ± 0.07 b347.33 ± 13.13 b11.00 ± 1.69 b712.71 ± 22.99 b728.80 ± 22.96 b34.62 ± 4.28 b
FS7.30 ± 0.05 c720.67 ± 149.42 a16.46 ± 0.37 a1093.04 ± 72.78 a1135.53 ± 115.27 a196.37 ± 36.64 a
CK, base fertilizer; B, biochar; MF, microbial fertilizer; FS, fertilizer synergist. EC, electrical conductivity; OM, organic matter; TP, total P; TN, total nitrogen; AP, available P. The mean value ± standard deviation (n = 3). Different letters after means among treatments indicate significant differences based on one-way ANOVA (Duncan test) at the 0.05 level.
Table 3. Soil enzyme activities of the topsoil and rhizosphere under different fertilization treatments.
DepthSampleDHA (μg h−1 g−1)AKP (μmol h−1 g−1)SC (mg h−1 g−1)CAT (μmol h−1 g−1)UE (μg h−1 g−1)
TopsoilCK2.26 ± 0.15 a0.05 ± 0.00 c0.28 ± 0.01 c1.22 ± 0.05 b8.09 ± 0.30 b
B2.11 ± 0.31 a0.08 ± 0.00 b0.38 ± 0.07 bc1.25 ± 0.03 b10.42 ± 0.53 a
MF2.25 ± 0.31 a0.06 ± 0.01 bc0.47 ± 0.03 b1.73 ± 0.10 a9.69 ± 0.67 ab
FS2.05 ± 0.36 a0.11 ± 0.01 a0.83 ± 0.06 a1.13 ± 0.00 b8.67 ± 0.33 b
RhizospherieCK2.57 ± 0.29 a0.08 ± 0.01 bc0.28 ± 0.02 b1.38 ± 0.13 b7.71 ± 0.43 d
B2.08 ± 0.31 a0.10 ± 0.01 b0.26 ± 0.03 b1.44 ± 0.08 b11.48 ± 0.30 b
MF2.81 ± 0.31 a0.06 ± 0.01 c0.37 ± 0.02 b1.87 ± 0.01 a9.00 ± 0.29 c
FS2.50 ± 0.25 a0.16 ± 0.02 a0.95 ± 0.11 a1.24 ± 0.05 b13.74 ± 0.11 a
CK, base fertilizer; B, biochar; MF, microbial fertilizer; FS, fertilizer synergist. AKP, alkaline phosphatase; DHA, dehydrogenase; SC, sucrose; CAT, catalase; UE, urease. The mean value ± standard deviation (n = 3). Different letters after means among treatments indicate significant differences based on one-way ANOVA (Duncan test) at the 0.05 level.

