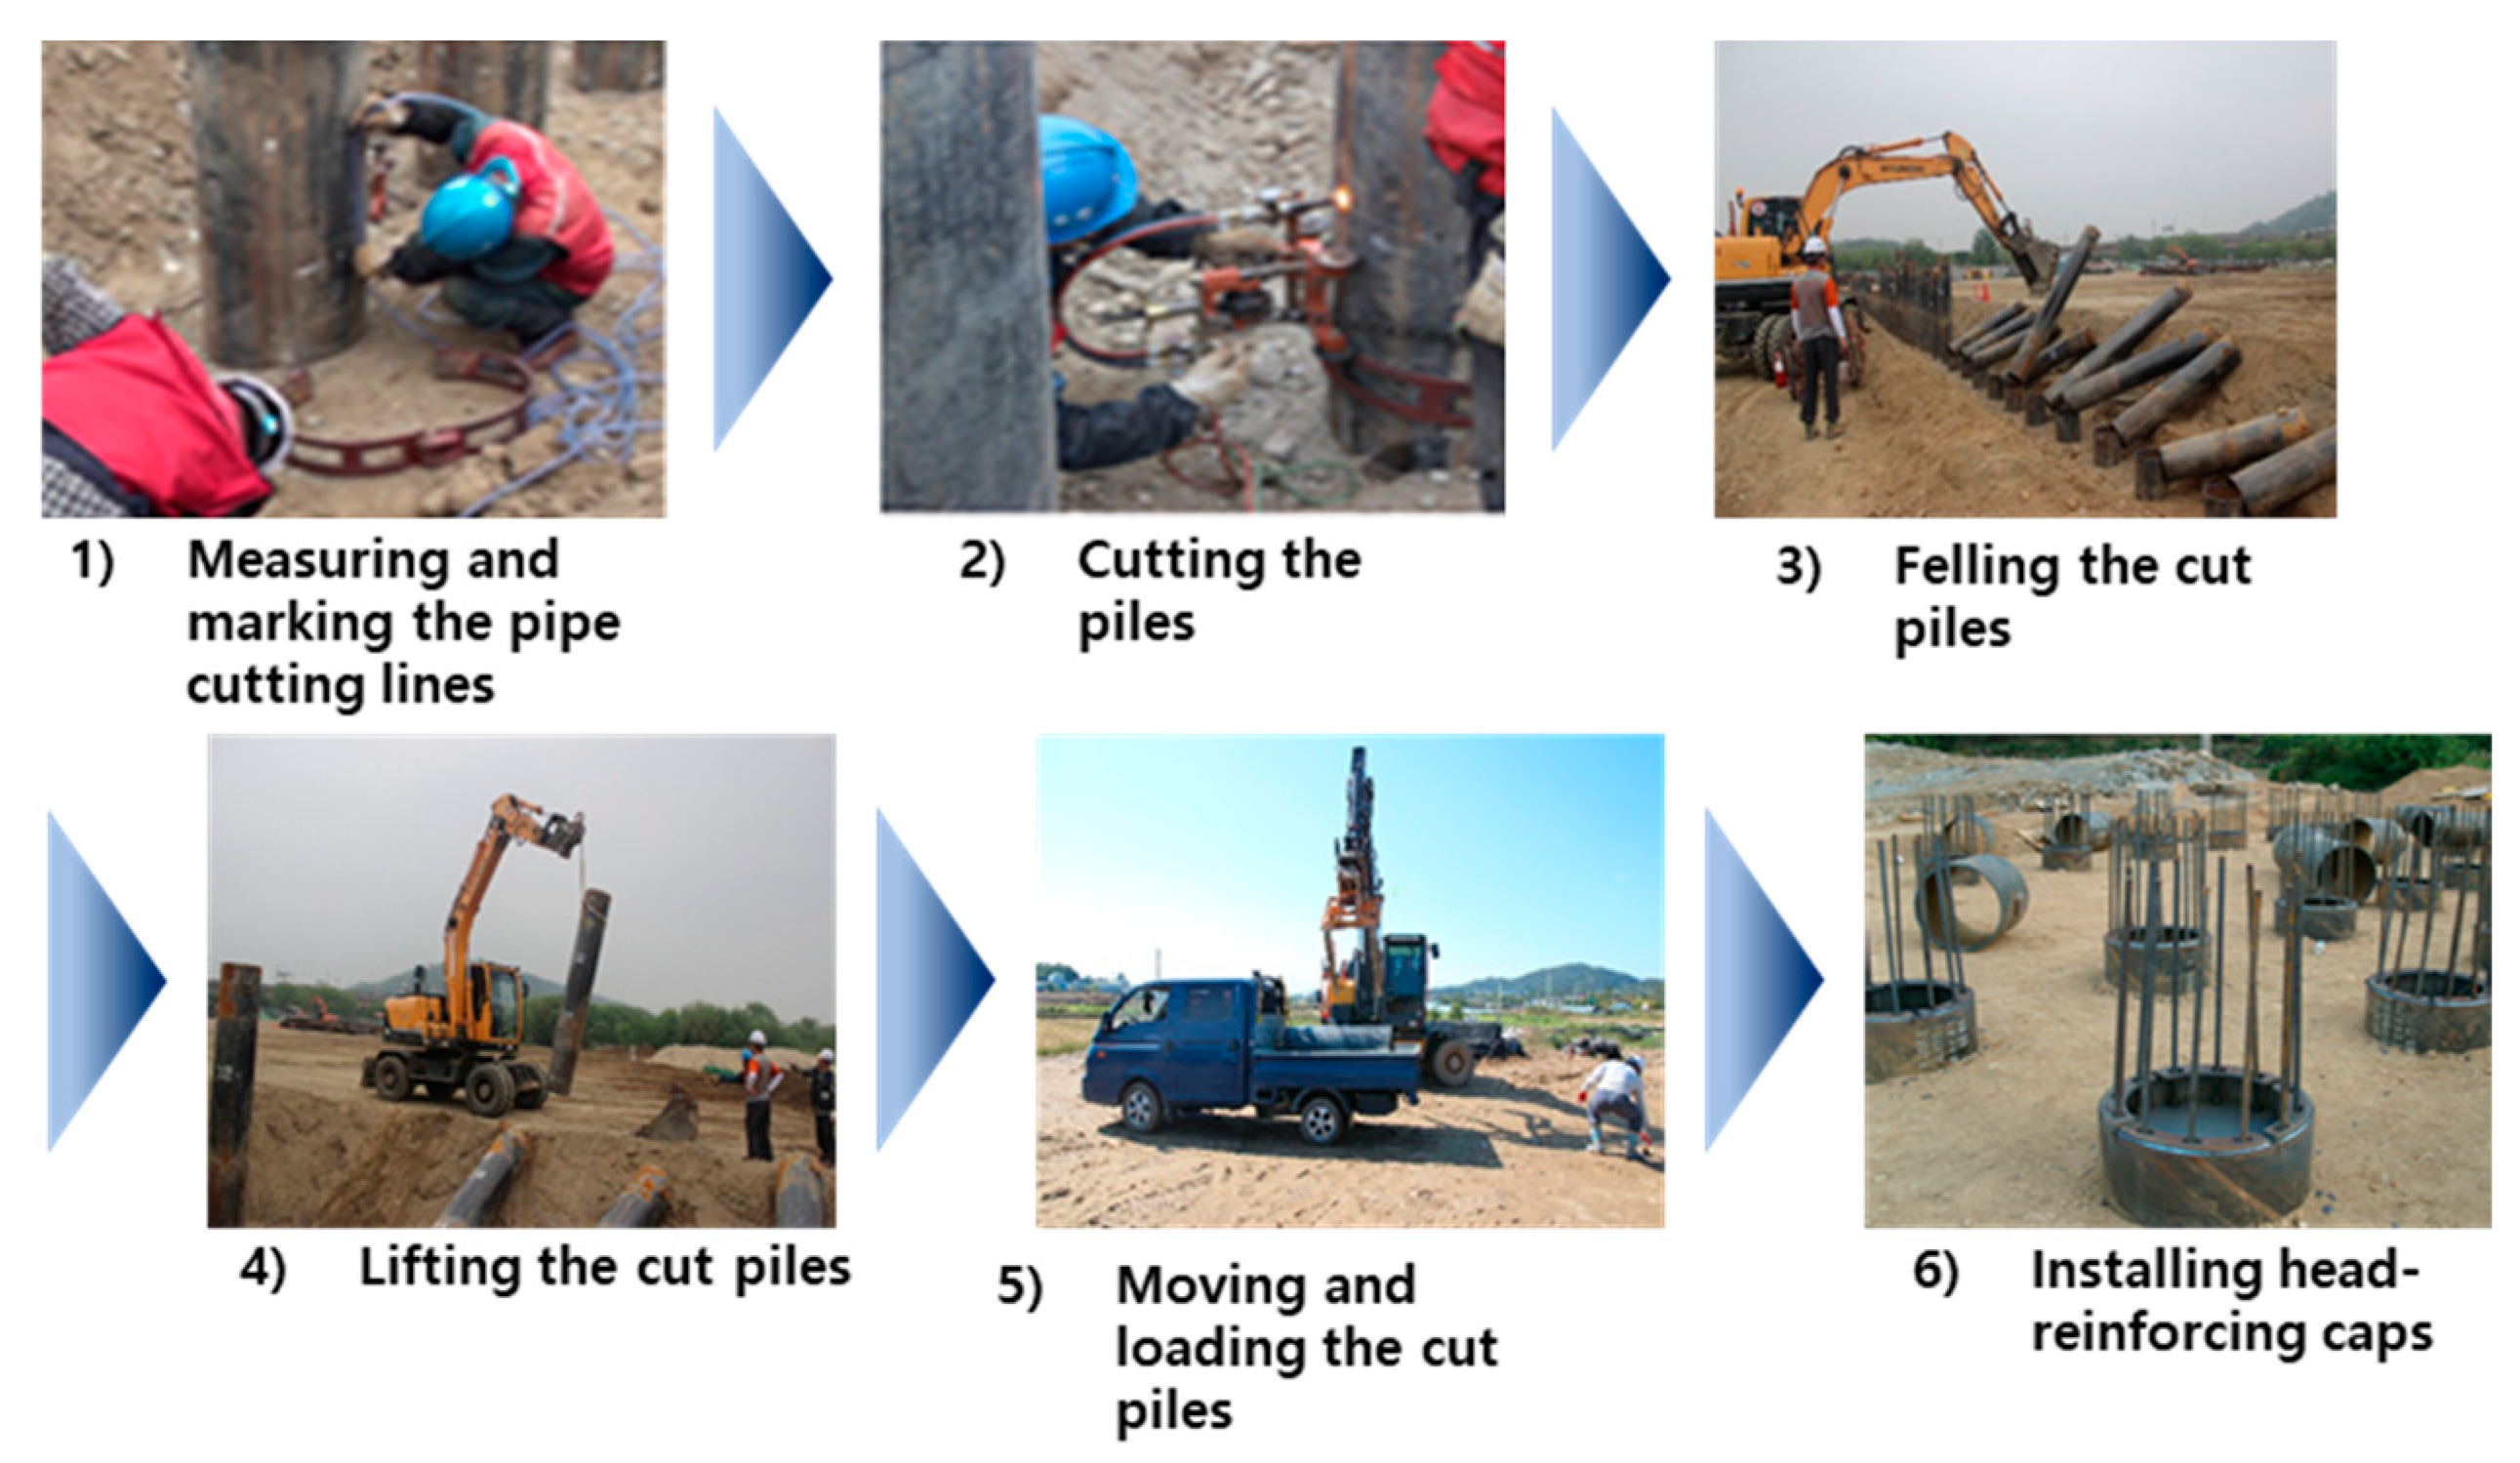
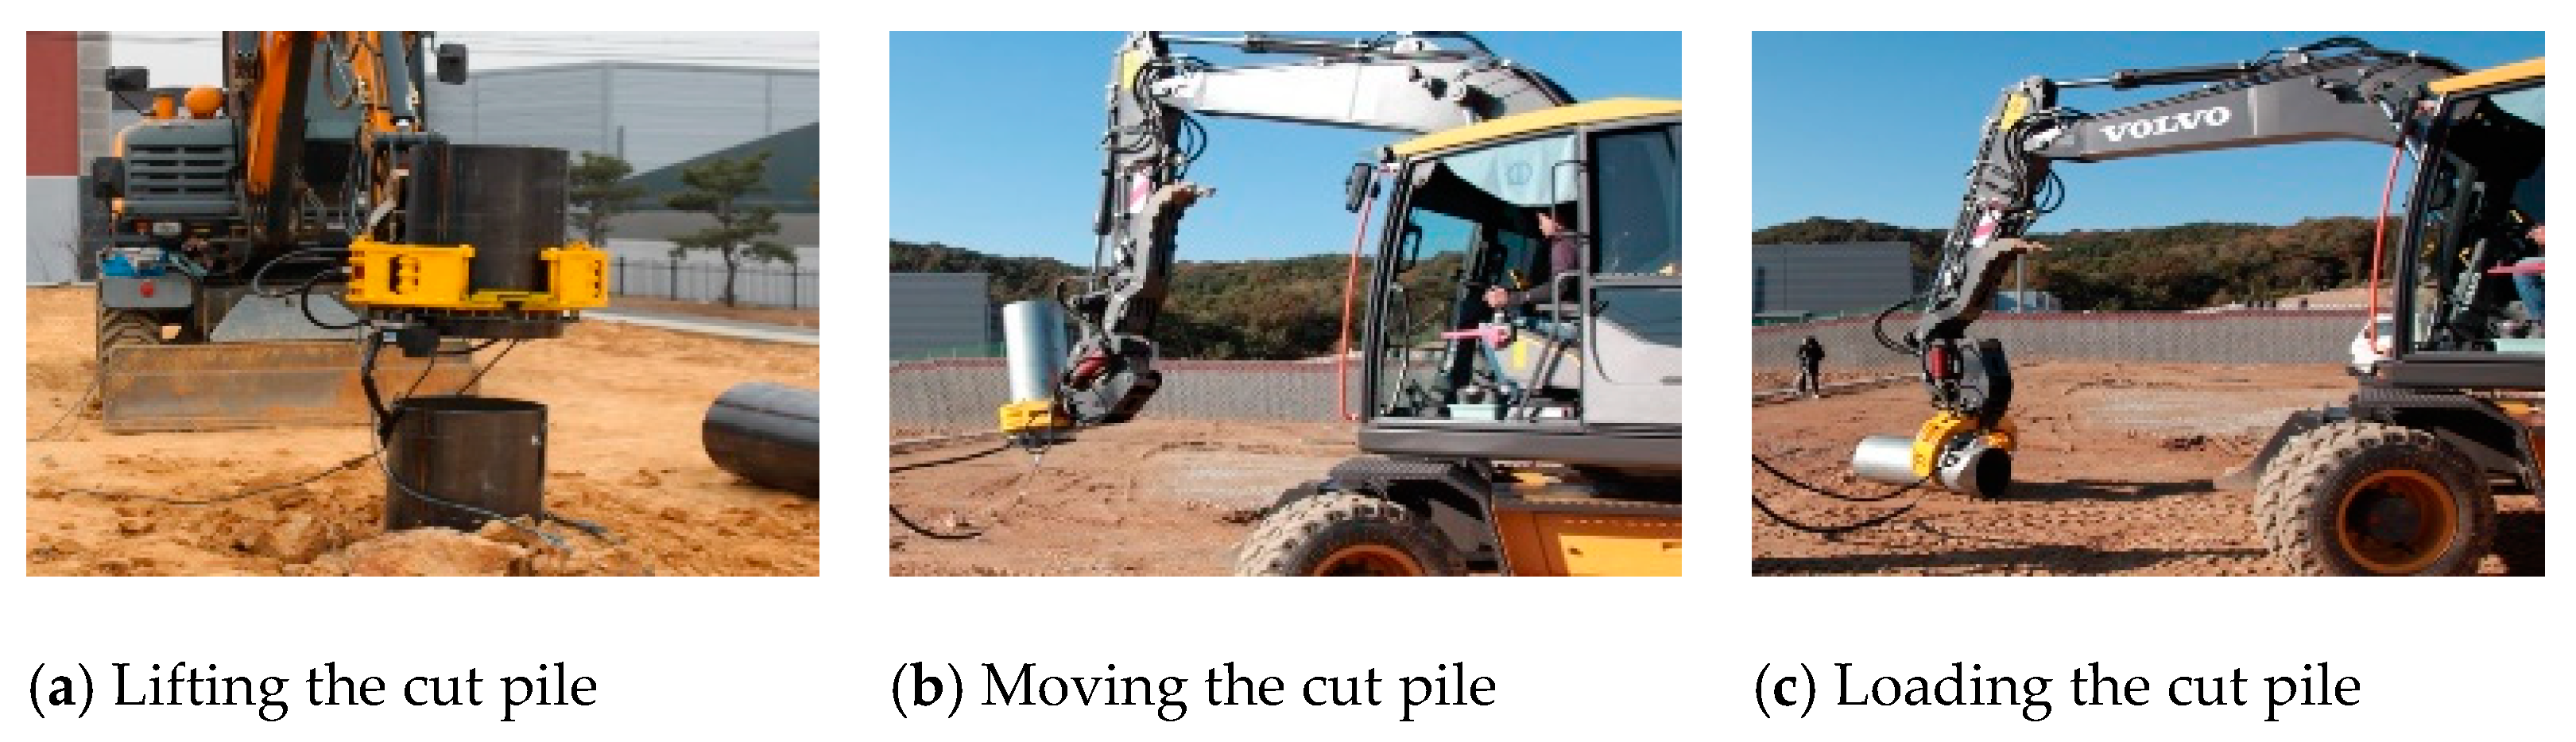
Article

Life Cycle Cost Analysis of the Steel Pipe Pile Head Cutting Robot

1
Department of Architectural Engineering, Inha University, Incheon 22201, Korea
2
Post-Doctoral Researcher, Department of Construction Policy Research, Korea Institute of Civil Engineering and Building Technology, Goyang 283, Korea
*
Author to whom correspondence should be addressed.
Sustainability 2020, 12(10), 3975; https://doi.org/10.3390/su12103975
Submission received: 23 March 2020 / Revised: 2 May 2020 / Accepted: 8 May 2020 / Published: 12 May 2020
(This article belongs to the Special Issue Advanced Construction and Architecture 2020)

Abstract

:
Steel pipe pile head cutting work is performed to adjust the horizontal levels of piles, and it is essential for the stable transfer of an upper structure load to the ground. However, the field survey results show that steel pipe pile head cutting process is highly dangerous as laborers especially deal with gas and plasma cutting machines. Moreover, the laborers are exposed to continuous risks because the piles are frequently felled, lifted, moved, and loaded using construction equipment, such as excavators, immediately after the piles are cut. Recently, the authors of this study developed a prototype of a steel pipe pile head cutting robot and verified its performance through laboratory experiments to improve work safety, productivity, and the quality of steel pipe pile head cutting work. The purpose of this study is to secure the economic feasibility of robot development and verify the sustainable utilization of a developed robot by analyzing the comprehensive performance and economic efficiency throughout the life cycle of a steel pipe pile head cutting robot developed in South Korea. In this study, sensitivity analysis was also performed on the variables expected to have a significant influence or variables that must be considered for the future commercialization of the developed robot. When the developed robot is applied to construction sites in the future, its ripple effects will be significant because it will be possible to prevent labor safety accidents, improve work productivity, secure uniform quality, and reduce input costs.

1. Introduction

1.1. Background and Study Purpose

Steel pipe piles are mainly used for large structures like bridges, harbors, and plants due to their significant load-bearing capacity per unit area compared to piles. Their bearing capacity for lateral loading is particularly high as well as their bending moment [1]. Steel pipe piles are constructed as follows: (1) The piles are installed in the ground using an embedding or driving method, (2) the pile heads are then cut to a designed level, and (3) then the bearing capacity is secured by connecting the piles to the upper structure. The second process, steel pipe pile head cutting work, aims to make the horizontal levels of the installed piles equal, and it is essential for securing the bearing capacity of soil by allowing the load of the upper structure to be transferred to the ground in a stable manner. Steel pipe pile head cutting comprises the following: (1) Measuring and marking the pipe cutting lines, (2) cutting the piles, (3) felling the cut piles, (4) lifting the cut piles, (5) moving and loading the cut piles, and (6) installing head-reinforcing caps.
A recent field survey and expert interviews conducted at civil-engineering work sites where steel pipe pile head cutting work was underway indicate that the cutting process is considered highly dangerous as laborers use gas and plasma cutting machines. Moreover, the laborers are exposed to continuous risks because the cut steel pipe piles are frequently felled, lifted, moved, and loaded using construction equipment, such as excavators, immediately after the piles are cut. To address these problems, we developed a prototype of a steel pipe pile head cutting robot with the following components: a sensing unit, cutting unit, and handling unit. The robot is capable of performing all steel pipe pile head cutting processes and its performance has been verified in laboratory experiments [2,3,4,5,6].
The purpose of this study is to secure the economic feasibility of robot development and verify the sustainable utilization of the developed robot by analyzing its life cycle cost to improve the commercialization and utilization possibilities of the steel pipe pile head cutting robot prototype developed through the previous study [2,3,4,5,6]. When the commercialization and utilization of a developed robot are successfully achieved in the future, its ripple effects will be significant because it will be possible to prevent labor safety accidents that may occur during the steel pipe pile head cutting process and to reduce input costs by improving work productivity and securing uniform quality.

1.2. Scope and Study Methods

Based on the previously developed prototype of a steel pipe pile head cutting robot [2,3,4,5,6], this study’s scope is limited to analyzing the work productivity of the automated method compared to that of the conventional method and verifying the economic feasibility of a developed robot by analyzing its life cycle cost. The methods of this study are as follows:
(1)
The characteristics and problems of steel pipe pile head cutting work are investigated, and the status of the developed steel pipe pile head cutting robot is investigated and analyzed.
(2)
The productivity of the automated steel pipe pile head cutting work is compared with that of the conventional method, and the life cycle cost of a steel pipe pile head cutting robot is analyzed compared to that of the conventional method.
(3)
The economic feasibility of a steel pipe pile head cutting robot according to the specific variables and assumptions is analyzed through a sensitivity analysis.

2. The Steel Pipe Pile Head Cutting Robot

2.1. Characteristics and Problems of Steel Pipe Pile Head Cutting Work

For the foundations of a building, steel pipe pile head cutting work is performed to allow the load of the upper structure to be transferred to the ground in a stable manner by making the horizontal levels of the installed piles equal. As previously mentioned, a field survey and expert interviews revealed that steel pipe pile head cutting work includes the processes of (1) measuring and marking the pipe cutting lines, (2) cutting the piles, (3) felling the cut piles, (4) lifting the cut piles, (5) moving and loading the cut piles, and (6) installing head-reinforcing caps (Figure 1).
The process of steel pipe pile head cutting work is problematic in terms of (1) labor safety, (2) quality uniformity, (3) work productivity and convenience, and (4) shortage of skilled workers (Figure 2). The results of the field survey indicate that these problems need to be improved urgently through alternatives such as automation and robots.

2.2. The Steel Pipe Pile Head Cutting Robot

We developed a steel pipe pile head cutting robot [2,3,4,5,6], as shown in Figure 3, to address the problems of steel pipe pile head cutting work.
The steel pipe pile head cutting robot consists mainly of a sensing unit using a laser leveler and sensing technology, a handling unit using an attachment-based manipulator, and a cutting unit using plasma cutting technology.

2.2.1. Sensing Unit Using a Laser Leveler and Sensing Technology

The sensing unit consists of a laser leveler, a laser beam receiver, and a sensing module. When the laser generated from the laser leveler is irradiated to the cutting position of a steel pipe pile, the robot approaches the pile and the laser beam receiver detects the laser irradiation position. For the robot operator to recognize intuitively the sensing result, the control box installed in the excavator cabin sounds an alarm when the unit accurately detects the irradiation position (Figure 4).

2.2.2. Handling Unit with an Attachment-Based Manipulator

The handling unit is mounted as an attachment on an excavator. It consists of a hydraulic-clamp-based bilateral semi-circle-type grab and claw to respond to changes in the steel pipe pile specifications. The handling unit performs cutting work by holding a steel pipe pile with the grab. Upon the completion of the cutting work, the unit successively lifts, moves, and loads the cut pile (Figure 5).

2.2.3. Cutting Unit using Plasma Cutting Technology

The cutting unit consists of a carriage, driving roller, holding roller, guide rail, and cutting nozzle. When a steel pipe pile to be cut is grabbed by the handling unit, the unit cuts the pipe while the carriage rotates 360° along the guide rail (Figure 6).
Figure 7 depicts the work process of the proposed steel pipe pile head cutting robot.

3. Comparison of Work Productivity between Conventional and Automated Steel Pipe Pile Head Cutting Work

Prior to the robot’s life cycle cost analysis, the work productivity of the automated method was compared with that of a conventional method. It is difficult to generalize any one conventional method because different construction companies use various methods and have varied personnel. Moreover, even when using the same method, work productivity may differ depending on site conditions. Therefore, here, we assume a conventional work process, which can be universally applied to the sites of steel pipe pile head cutting work, based on the literature review and expert interviews, and its productivity was analyzed.
(1)
The conventional process consists of measuring the cutting position, marking the cutting position, installing and uninstalling a guide rail, cutting a steel pipe pile, and lifting and loading the cut pile. The cutting position measurement process is excluded from the work productivity comparison because it is performed the same way in both methods.
(2)
The cutting position of a steel pipe pile is higher than the ground level, and the pile is not submerged by the inflow of groundwater.
(3)
The cutting process begins when a guide rail is installed on the first steel pipe pile and ends when the last steel pipe pile is cut and the guide rail is uninstalled.
(4)
Three guide rails and one steel pipe pile plasma cutting machine are used. The guide rail installation/uninstallation and steel pipe pile cutting work are performed continuously without any downtime.
(5)
The cut piles are lifted by a clip-type bucket without a separate felling process and loaded nearby.

3.1. Time Required for Each Process in The Conventional Method and The Productivity Measure

In this study, a highway bridge construction site in Asan city, South Korea, is used as a sample site to analyze the productivity of the conventional method. At the site, steel pipe piles were being used to build a pier foundation, which was the lower structure of a bridge. Table 1 presents an overview of the pier foundation construction site.
We measured the productivity of the head cutting work on 30 steel pipe piles with a 508 mm diameter and a 12 mm thickness being used for a pier foundation. The productivity was derived by filming the work processes from start to finish and analyzing the time required for each process. An analysis of the productivity of the conventional method was conducted at the site, as shown in Figure 8. The average time required for each process is shown in Table 2.
When the productivity of the conventional method was analyzed, we found that marking the cutting position required 13 s per pile, and the installation of the first guide rail and the uninstallation of the last guide rail required 50 s, on average. Steel pipe pile cutting required 2 min and 10 s per pile and lifting and loading the cut pile required 30 s per pile, on average. Based on these results, the work productivity of the conventional method was found to be 166 piles per day in eight hours of work.

3.2. Time Required for Each Process of The Automated Method and The Productivity Measure

Next, a work environment similar to that of the observed bridge construction site was created and a field experiment was performed to analyze the productivity of the automated method. We conducted the experiment once the excavator operator was fully trained on the cutting robot. The analysis of the productivity was conducted at the site, as shown in Figure 9. The time required for each process is shown in Table 3.
Analyzing the productivity of the automated method, we found that measuring the cutting position required the same time as the conventional method, cutting position recognition required 15 s per pile, holding the pile required 3 s per pile, and pile cutting required 1 min and 31 s per pile, on average. Lifting and loading the cut pile required 10 s per pile on average. Based on these results, the work productivity of the automated method was found to be 242 piles per day in eight hours of work.

3.3. Comparison of Productivity between The Conventional And Automated Methods

Based on the analysis results, the work productivity of the conventional method was found to be 166 piles per day, whereas that of the automated method is 242 piles per day. Therefore, the work productivity of the automated method was approximately 45.78% higher compared to the conventional method.

4. Life Cycle Cost of the Steel Pipe Pile Head Cutting Robot

Although the performance of the robot was shown to be superior to that of the conventional method in terms of work productivity, safety, and quality uniformity, it is difficult to continue the research and development of automatic robots and to commercialize and introduce such robots into actual construction sites if the economic feasibility of robot development is not secured [7]. Therefore, as a next step, we verified the sustainable utilization of the developed robot by determining its economic efficiency throughout its life cycle using the productivity results from the conventional and automated analyses.

4.1. Assumptions and Variable Setting for Life Cycle Cost Analysis

Using the work productivity results, we derive the input labor costs and equipment costs of the conventional and automated methods. In addition, the manufacturing cost and annual maintenance cost of the robot, as well as the number of working days per year and discount rates, are set as variables for the analysis of the economic efficiency of the robot.

4.1.1. Input Labor Costs and Equipment Costs

For the input labor costs, we use the labor cost of each occupational category in the Construction Association of Korea’s report on construction industry wages for the first half of 2018 [8]. In the case of the conventional method, the total daily labor cost is calculated as $302.14 because the method involves two welders. In the case of the automated method, we assume that one excavator operator and one welder (who provides technical support to the excavator operator) are required for a more conservative analysis, although the robot had been developed to perform the work with just one excavator operator. Accordingly, the total daily labor cost of the automated method is calculated as $151.07 (Table 4).
For the input equipment cost, the daily rent of an excavator is calculated and applied based on Korea Price Research Center’s 2018 general information for construction [9]. In this study, we assume that both the conventional and automated methods utilize a 0.6 m3 excavator (tire). The rent of the excavator based on an eight-hour workday, including the labor cost of its operator, is calculated as $533.21.

4.1.2. Manufacturing and Maintenance Costs of The Steel Pipe Pile Head Cutting Robot

Next, the manufacturing cost of the robot and the service life of each of its components are analyzed through face-to-face interviews with the manufacturer of the robot and experts in each component, as shown in Table 5.
The manufacturing cost of the robot is calculated as $25,913.86 (Table 5), which is the sum of the manufacturing costs of each component. The life cycle cost of the robot is analyzed under the assumption that the individual components will be replaced at the end of their service lives. In addition, the service life of the robot is set as 10 years based on interviews with the experts.

4.1.3. Number of Working Days per Year

Although the Korean architectural standard specifications and the standard specifications for civil engineering work [10,11] do not specify conditions when steel pipe pile head cutting work should be stopped, the interviews with experts revealed that such conditions include precipitation such as snow and rain. As such, in this study, we assume that the cutting work is not possible when the hourly rainfall or snowfall exceeds 0 mm. By analyzing the precipitation statistics in South Korea over the last 10 years, the number of working days per year for steel pipe pile head pile cutting work is calculated as 172 days considering overlapping legal holidays (Table 6).

4.1.4. Annual Input Cost

The annual volume of steel pipe pile head cutting work is calculated as 28,552 piles considering the number of working days per year (172 days) and the daily work productivity of the conventional method (166 piles/day). If the same work volume (28,552 piles) is handled using the steel pipe pile head cutting robot (242 piles/day), the required period is 118 days, indicating that the construction period can be shortened by 54 days. Thus, the annual input cost of the conventional method, including the equipment and labor cost, is calculated as $143,680.20, and that of the automated method as $80,745.04, resulting in an annual benefit of $62,935.16 due to the introduction of the automated method (Table 7).

4.1.5. Discount Rate

Finally, we analyze the consumer price index (CPI) and the base interest rate of the Bank of Korea over the last 10 years (2008–2017), along with the discount rates presented by the World Bank, Office of Management and Budget (OMB), and Asian Development Bank (ADB) to determine the discount rate to be applied to the analysis of the life cycle cost of the steel pipe pile head cutting robot (Table 8).
We use the discount rate of 2.28%, which is the average of the CPI fluctuation over the last 10 years. In addition, to improve the reliability of our study results, we conduct a sensitivity analysis based on the average base interest rate of the Bank of Korea over the last 10 years (2.23%), as well as the discount rates presented by the World Bank and OMB (10–12%) and the ADB (9%).

4.2. The Economic Efficiency of The Automated Method Compared with The Conventional Method

We derive a cash flow diagram of the robot throughout its life cycle based on our assumptions and variables for the life cycle cost analysis, as shown in Figure 10.
In addition, we compare the economic feasibility of the robot throughout its life cycle with that of the conventional method through the following analyses using the derived cash flow: Benefit–cost ratio, profitability, break-even, and sensitivity.

4.2.1. Benefit–Cost Ratio Analysis

The benefit/cost ratio is a general economic indicator used to measure economic profitability through the ratio of the present worth (PW) of the benefit generated by an investment alternative to that of its added cost [7]. As shown in Table 7, the annual benefit generated by the introduction of the steel pipe pile head cutting robot is $62,935.16, and the PW of the generated benefit obtained by applying the discount rate of 2.28% and the operation period of 10 years to the annual benefit is $557,127.34. In addition, the introduction of the steel pipe pile head cutting robot incurs manufacturing and maintenance costs. The PW of the required cost obtained by applying the discount rate of 2.28% and the operation period of 10 years is $72,859.88. Therefore, the benefit–cost ratio of the steel pipe pile head cutting robot was calculated to be 7.65. As this value is much higher (B/C ratio) than 1.0, which secures economic feasibility, it was found that the automated method is economical compared to the conventional method (Table 9).

4.2.2. Profitability Analysis

The internal rate of return (IRR) is the discount rate R at which the PW of the benefit becomes identical to that of the cost. In other words, it is a discount rate that brings the net present value (NPV) to zero based on the implementation of a project [15]. The profitability analysis reveals that the IRR for the introduction of the steel pipe pile head cutting robot is 240.84% (Table 10), indicating that the economic efficiency of the automated method is significantly higher than that of the conventional method (Figure 11).

4.2.3. Break-Even Analysis

The break-even point occurs when the total income and total cost in a certain period are identical [16]. In this study, we define this as the point at which the PW of the benefit generated by the introduction of the robot equals that of the required cost. We find that the break-even point of the robot is approximately 1.17 years (one year and two months; break-even point), indicating that the investment cost for the robot can be recovered one year and two months after its introduction (Table 11) and that net profit occurs afterward (Figure 12).

4.2.4. The Annual Construction Cost Reduction Effect

The equivalent uniform annual cost method compares and analyzes two or more alternatives under the assumption that the benefit and cost generated during a certain period are uniformly distributed each year. When we analyzed the annual construction cost reduction, we found that the reduction due to the introduction of the automated method was approximately 38.07% compared with the conventional method, as shown in Table 12 (Figure 13).

4.3. Sensitivity Analysis

The assumptions and variables for the life cycle cost may vary depending on the economic environment and site conditions, which can affect the results for automatic robots [7]. Therefore, in this study, we examine variations in the life cycle cost due to changes in specific variables or assumptions through a sensitivity analysis. The sensitivity analysis is conducted for the following three items that are highly likely to change with the economic environment and conditions: (1) The manufacturing cost of the steel pipe pile head cutting robot, (2) the discount rate, and (3) the number of working days per year (Table 9).

4.3.1. Sensitivity Analysis for The Manufacturing Cost of The Robot

The steel pipe pile head cutting robot is fabricated as a single product. The assumption is that its manufacturing cost is likely to come down if commercialization and mass production occur. Additional manufacturing costs, however, may be incurred due to changes in the economic environment and conditions in manufacturing the robot. Therefore, a sensitivity analysis is conducted ranging the manufacturing cost of the robot within 50%–200% of the current manufacturing cost.
The sensitivity analysis reveals that the economic efficiency of the automated method is still maintained even if the manufacturing cost of the robot increases by 200% of the current cost (benefit–cost ratio: 5.35, profitability: 112.22%, break-even point: 1.65 years, and annual construction cost reduction effect: 36.40%). To lose its economic efficiency (i.e., benefit–cost ratio less than 1), the manufacturing cost of the robot would have to increase to 1968% of the current cost (Table 13). In other words, the effect of the robot’s manufacturing cost on its economic efficiency is insignificant.

4.3.2. Sensitivity Analysis of The Discount Rate

We conducted a sensitivity analysis of the discount rate to examine its effect on the economic efficiency of the automated method. The results reveal that the benefit–cost ratio is much higher than 1 in the 2.23%–12.00% discount range (Table 14), and the break-even point and annual construction cost reduction are not sensitive to any discount rate change. In other words, the effect of the discount rate on the economic results is insignificant within the analysis range.

4.3.3. Sensitivity Analysis of The Number of Working Days per Year

Although we use 172 working days per year in the life cycle cost analysis, this number could vary depending on the site location and work period based on local changes in climate. The sensitivity analysis results for the number of working days per year show that the robot could lose economic efficiency if the number fell below 25 days (Table 15). However, as there is only the slimmest possibility that changes in the local climate would reduce the number of working days per year below 25, the economic efficiency of the robot remains.

5. Conclusions

In this study, a steel pipe pile head cutting robot was analyzed to improve laborer safety, work productivity, and quality uniformity in terms of steel pipe pile head cutting work. In addition, the work productivity improvement effect of the automated method compared to the conventional method was analyzed through a field survey and experiments. Based on the results, the economic efficiency of the automated method throughout the life cycle of the steel pipe pile head cutting robot compared to the conventional method was derived.
(1)
When the status of the developed steel pipe pile head cutting robot was analyzed, it was found that the robot is composed of sensing, cutting, and handling units and that it could perform all tasks related to steel pipe pile head cutting from the recognition of the cutting position to the loading of the cut piles because it mounts on an excavator in the form of an attachment.
(2)
When the productivity of the automated steel pipe pile head cutting work was compared with that of the conventional method, the conventional method was found to complete 166 piles per day, whereas the automated method could complete 242 piles per day based on the analysis target site. Consequently, the work productivity improvement effect of the automated method compared to the conventional method was approximately 45.78% based on eight hours of work per day.
(3)
The analysis of the life cycle cost of the steel pipe pile head cutting robot revealed that the economic efficiency improvement effects of a 7.65 benefit–cost ratio, 240.84% profitability, 1.17-year break-even point, and a 38.07% annual reduction in construction costs compared to the conventional method could be obtained by the utilization of the automated method for 10 years, which is the service life of the developed robot.
(4)
When a sensitivity analysis was conducted on the life cycle cost analysis results of the steel pipe pile head cutting robot, the effects of the robot manufacturing cost, discount rate, and number of working days per year on the economic analysis results were found to be not significant within the analysis range.
If the steel pipe pile head cutting robot is commercialized and applied to the field based on the results of this study, it is expected that laborer safety accidents that occur during the steel pipe pile head cutting process can be prevented and the input cost will be additionally reduced due to the improved work productivity and convenience. Finally, the authors of this study anticipate that the developed steel pipe pile head cutting robot will be able to contribute to image improvement and future-oriented sustainability of the construction industry by safely and automatically carrying out the whole process of steel pipe pile head cutting work when comparing with the conventional method.

Author Contributions

J.-H.H. conceived the idea for this study and wrote the manuscript. D.-J.Y. conceived the idea and revised the manuscript. J.-S.K. contributed to data curation and editing the paper. Y.S.K. conceived the idea, supervised the research, and revised the manuscript. All authors read and approved the final manuscript.

Funding

This work was supported by the National Research Foundation of Korea (NRF) grant funded by the Korea government (MSIT) (No. 2016R1A2B2013985 and No. 2020R1A2C2008616).

Conflicts of Interest

The authors declare no conflict of interest.

References

  1. There are No Sou Korea Iron and Steel Association. Latest Report on the Steel Pipe Pile Market and Technology Trends. Available online: http://www.steelcon.or.kr/steeltubesandpipes/board/data?tpf=board/view&board_code=19&code=896 (accessed on 10 March 2020).
  2. Han, J.H.; Yeom, D.J.; Kim, Y.S. A study on the current status and problem analysis for steel pipe pile head cutting work. In Proceedings of the KICEM Annual Conference 2017, Seoul, Korea, 17–18 November 2017. [Google Scholar]
  3. Jeong, E.H.; Yeom, D.J.; Han, J.H.; Kim, Y.S. Selection of key technologies for the development of an all-in-one attachment based steel pipe pile cutting robot. In Proceedings of the KICEM Annual Conference 2018, Seoul, Korea, 9–10 November 2018. [Google Scholar]
  4. Han, J.H.; Jeong, E.H.; Yeom, D.J.; Kim, Y.S. Economic analysis of steel pipe pile cutting and handling robot. In Proceedings of the KICEM Annual Conference 2018, Seoul, Korea, 9–10 November 2018. [Google Scholar]
  5. Yeom, D.J.; Han, J.H.; Jeong, E.H.; Kim, Y.S. Conceptual Design and Technical Feasibility Analysis of an All-in-one Attachment Based Steel Pipe Pile Cutting Robot. J. Architect. Inst. Korea Struct. Constr. 2018, 34, 45–52. [Google Scholar]
  6. Yeom, D.J.; Han, J.H.; Jeong, E.H.; Kim, Y.S. Development of all-in-one attachment based steel pipe pile cutting robot prototype. Korea J. Constr. Eng. Manag. 2018, 19, 115–123. [Google Scholar]
  7. Ministry of Land, Transport and Infrastructure. Report on the Development and Research of Remote Control Equipment for Automated Road Maintenance: Development of Equipment for Road Crack Detection and Automatic Sealing. Available online: http://www.ndsl.kr/ndsl/search/detail/report/reportSearchResultDetail.do?cn=TRKO201800017727 (accessed on 10 March 2020).
  8. The Construction Association of Korea. Report on Wages in the Construction Industry in the First Half of 2018. Available online: http://www.cak.or.kr/board/boardView.do?menuId=60&boardId=spend_wage&dataId=35441 (accessed on 10 March 2020).
  9. Korea Price Research Center Editor. 2018 General Information for Construction, 37th ed.; Korea Price Research Center: Seoul, Korea, 2018; pp. 774–775. [Google Scholar]
  10. Korea Construction Standards Center. Building Construction Standard Specification. Available online: http://www.kcsc.re.kr/Search/ListCodes/1010# (accessed on 10 March 2020).
  11. Korea Construction Standards Center. Civil Engineering Works General Specification. Available online: http://www.kcsc.re.kr/File/3/CIGCSSF90043/CIGCSSF90043.pdf (accessed on 10 March 2020).
  12. Statistics Korea. Consumer Price Index Fluctuation. Available online: http://kosis.kr/statHtml/statHtml.do?orgId=101&tblId=DT_1J17042&checkFlag=N (accessed on 10 March 2020).
  13. Economic Statistics System. Base Interest Rate of Bank of Korea. Available online: http://ecos.bok.or.kr/ (accessed on 10 March 2020).
  14. Korea International Cooperation Agency. Guidelines on the Analysis of the Economic Efficiency of KOICA Projects. Available online: http://www.alio.go.kr/informationResearchView.do?seq=2399377 (accessed on 10 March 2020).
  15. Korea Development Institute. General Guidelines for Conducting Preliminary Feasibility Studies (Fourth Edition). Available online: http://www.kdi.re.kr/research/subjects_view.jsp?pub_no=9011 (accessed on 10 March 2020).
  16. Lee, J.H.; Lee, J.B.; Jeong, H.H.; Kim, Y.S. Development of an automated pavement crack sealing machine and its economic feasibility analysis. Korea J. Constr. Eng. Manag. 2006, 7, 151–164. [Google Scholar]
Figure 1. Processes of steel pipe pile head cutting work.
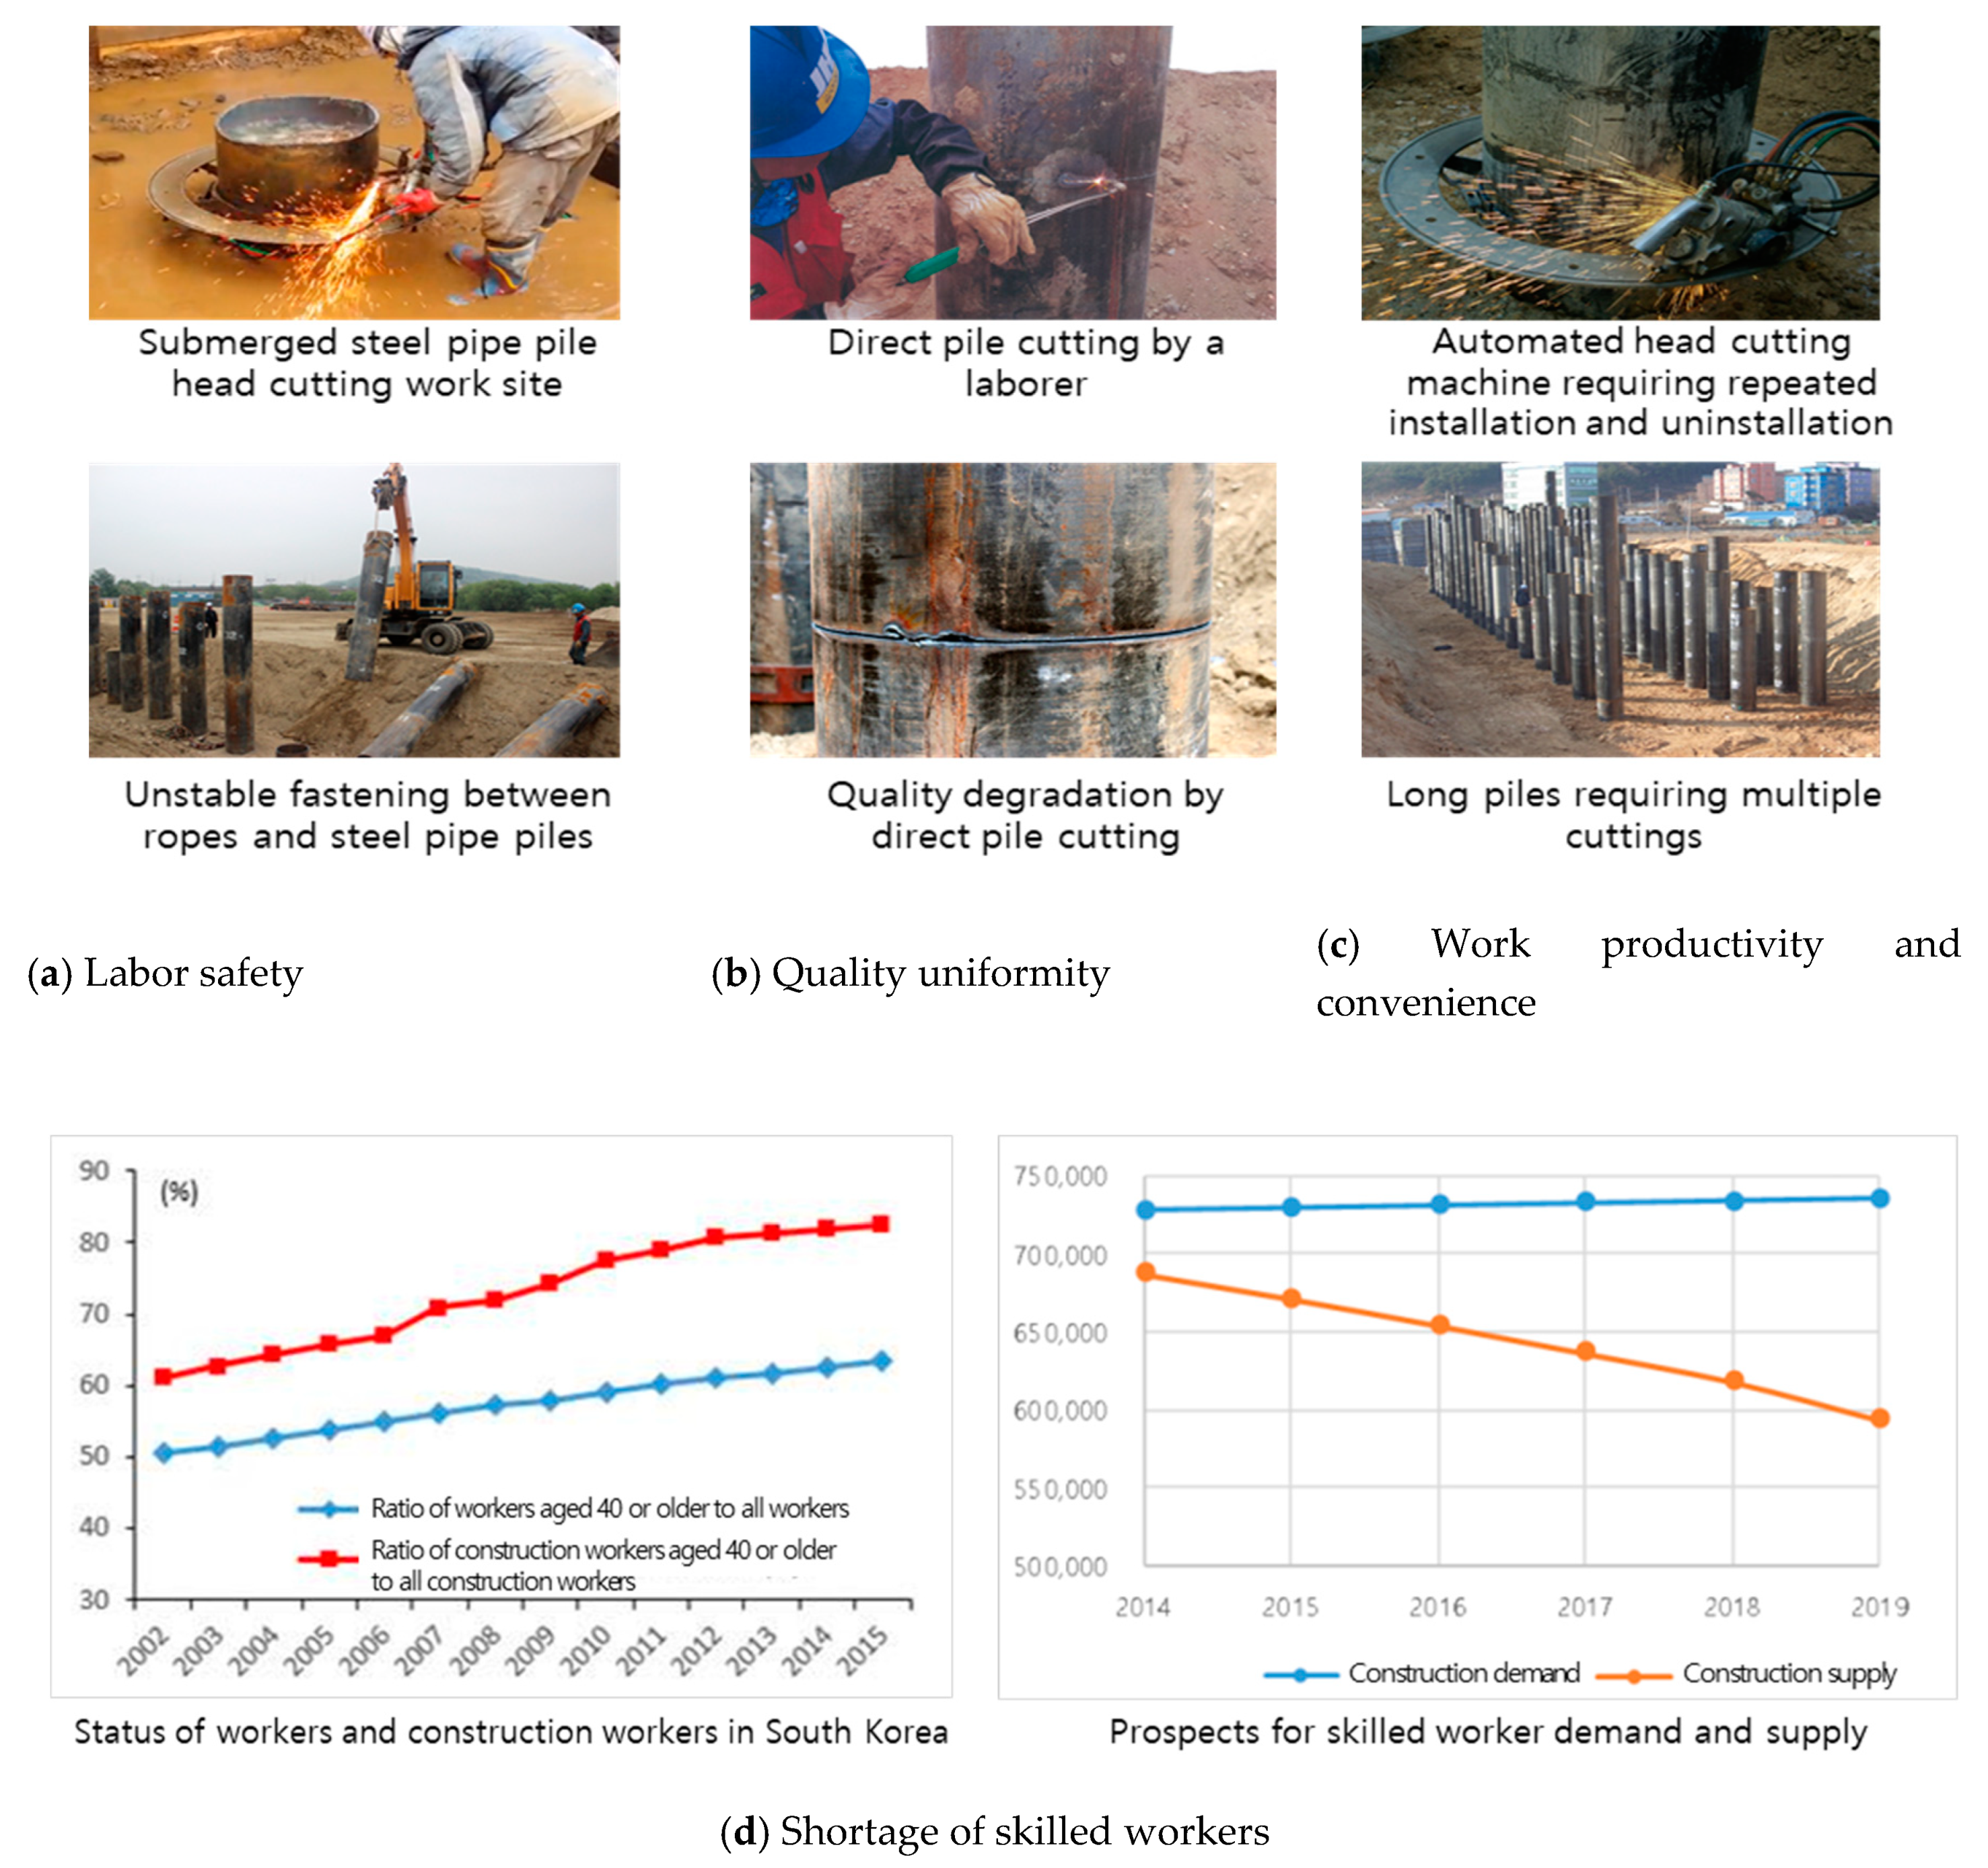
Sustainability 12 03975 g001
Figure 2. Problems with steel pipe pile head cutting work.
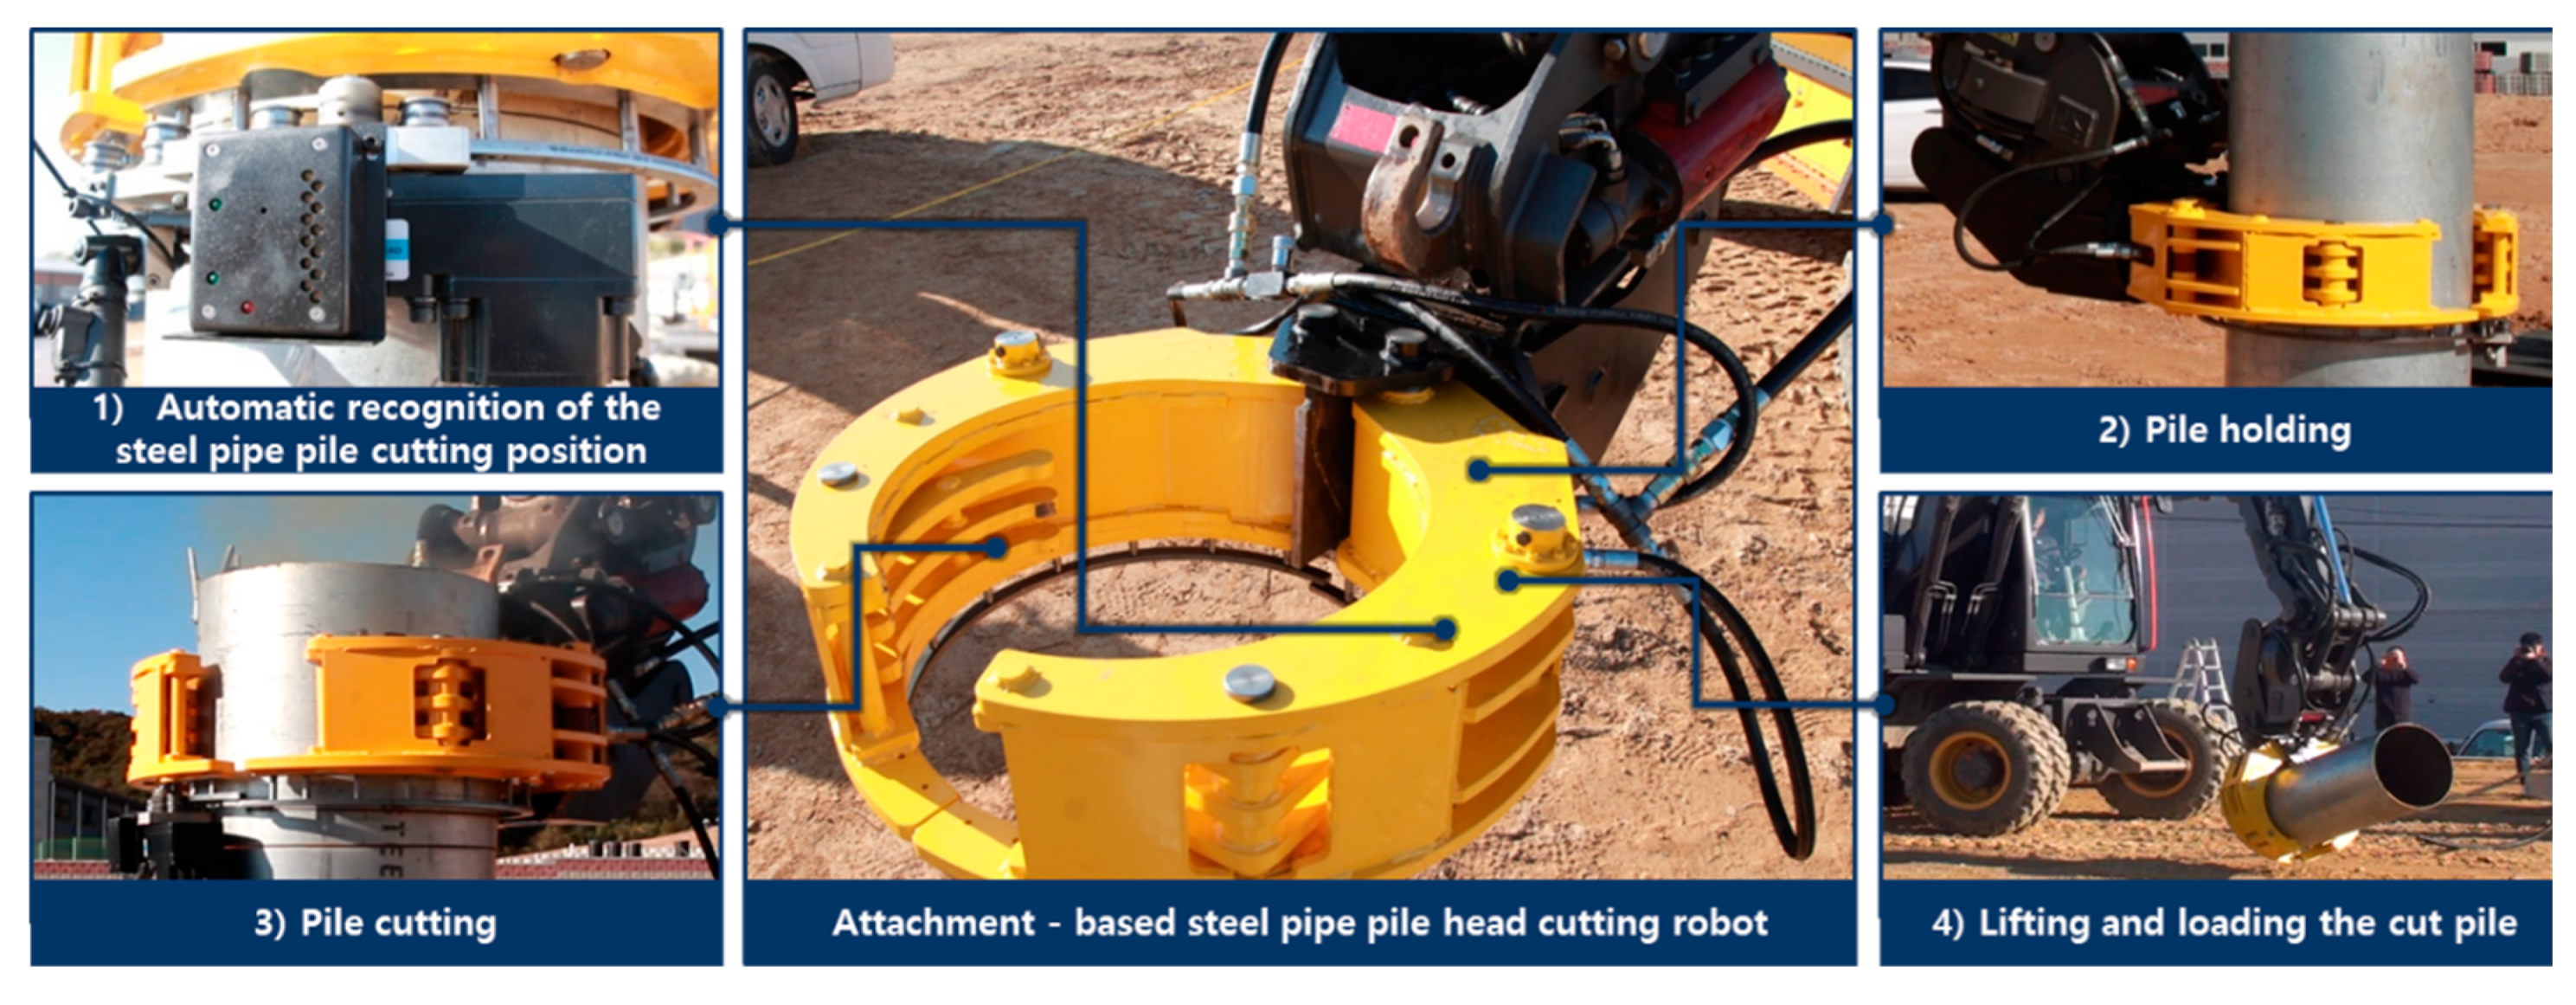
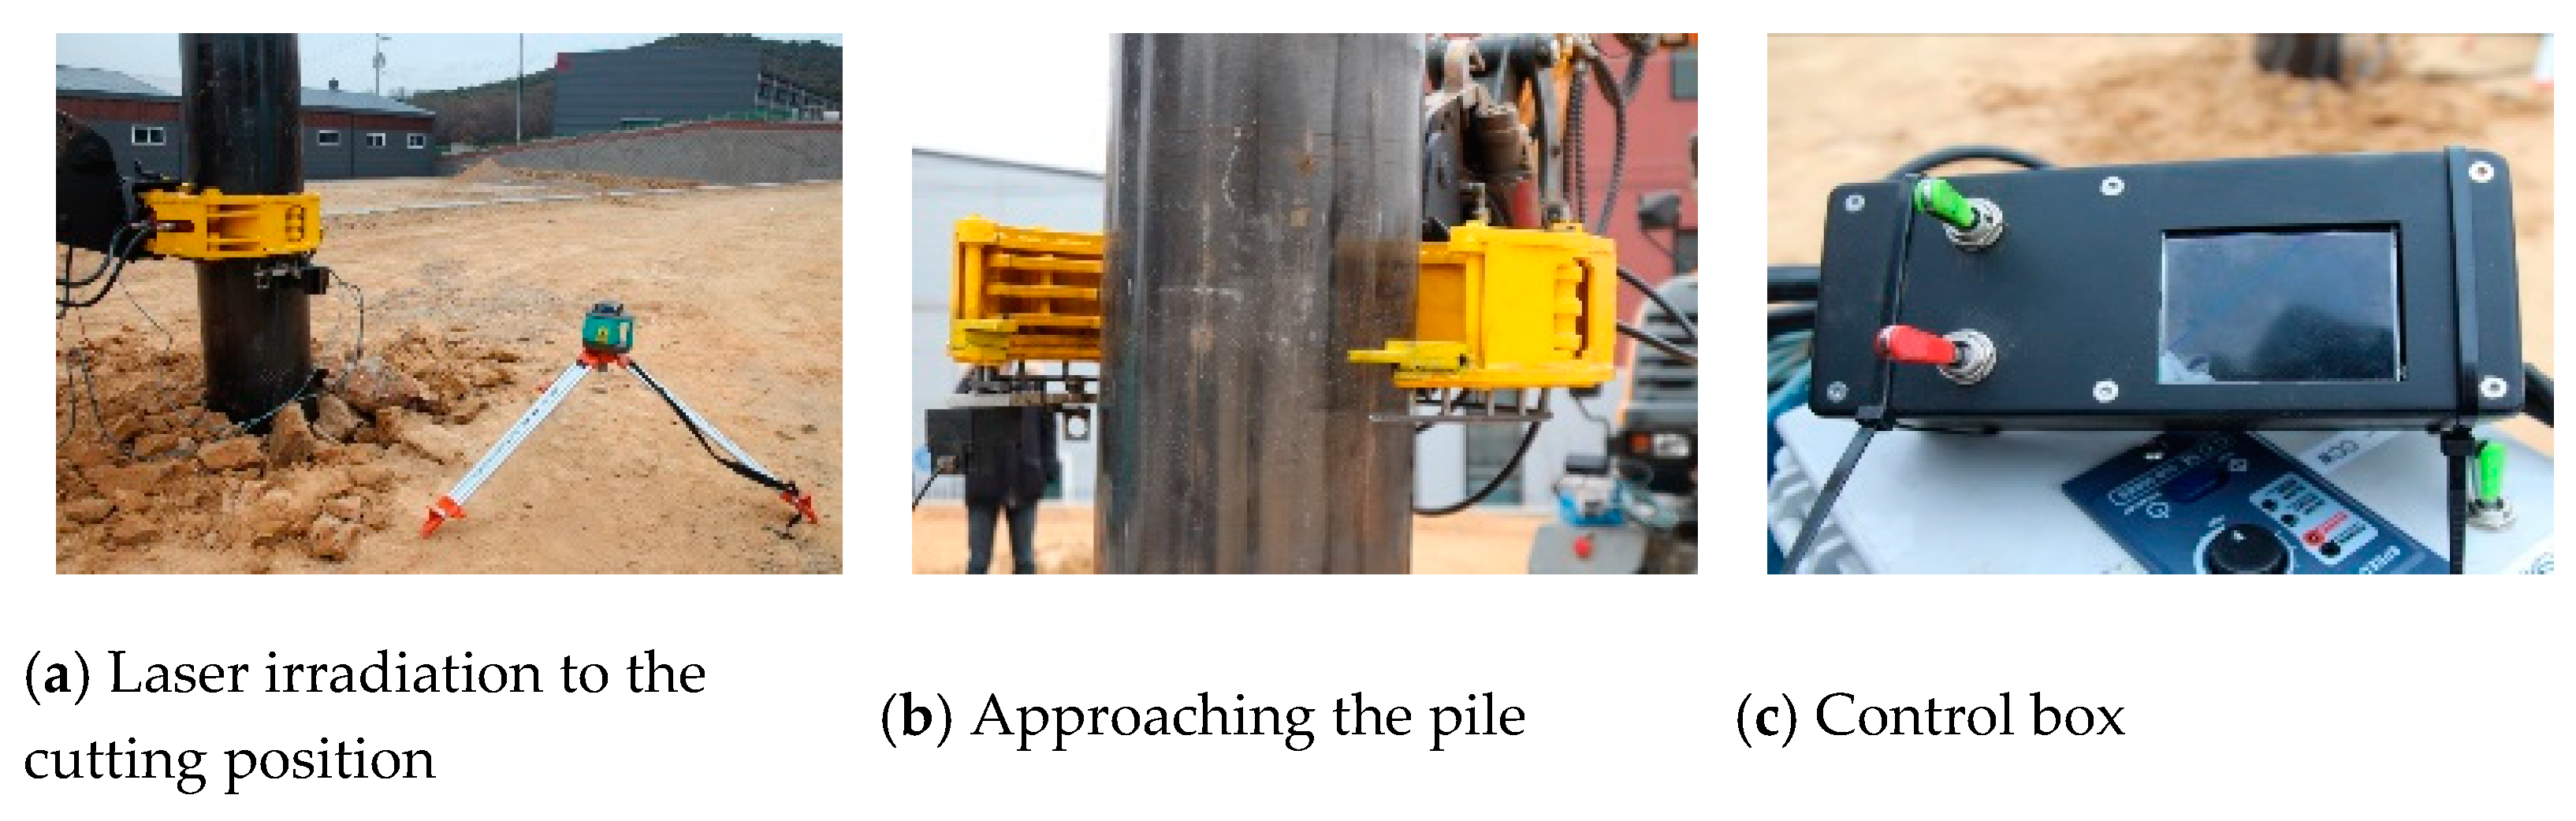
Sustainability 12 03975 g002
Figure 3. Steel pipe pile head cutting robot [6].
Sustainability 12 03975 g003
Figure 4. Operating process of the sensing unit of the steel pipe pile head cutting robot.
Sustainability 12 03975 g004
Figure 5. Operating process of the handling unit of the steel pipe pile head cutting robot.
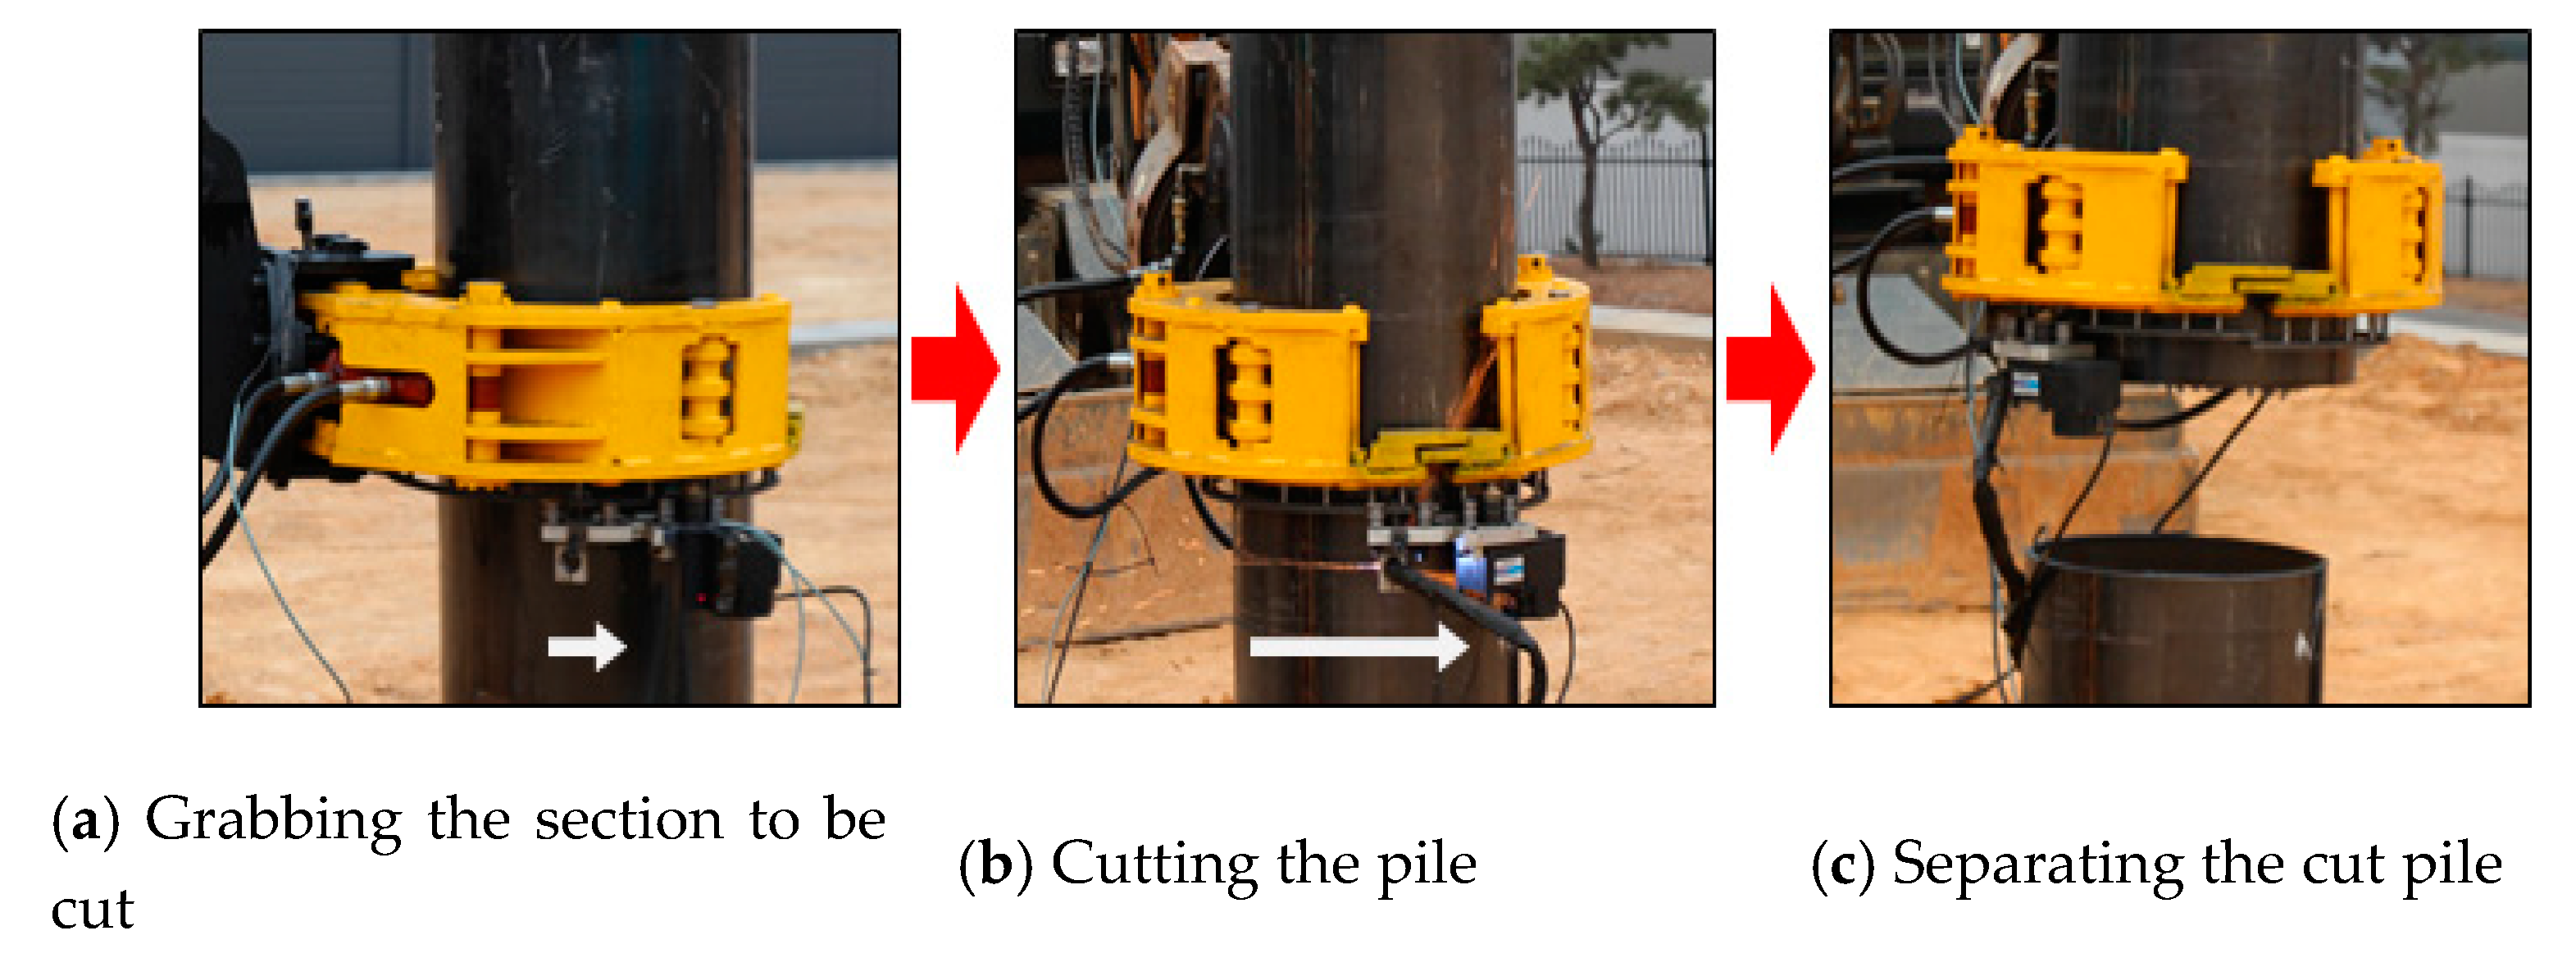
Sustainability 12 03975 g005
Figure 6. Operating process of the cutting unit of the steel pipe pile head cutting robot.
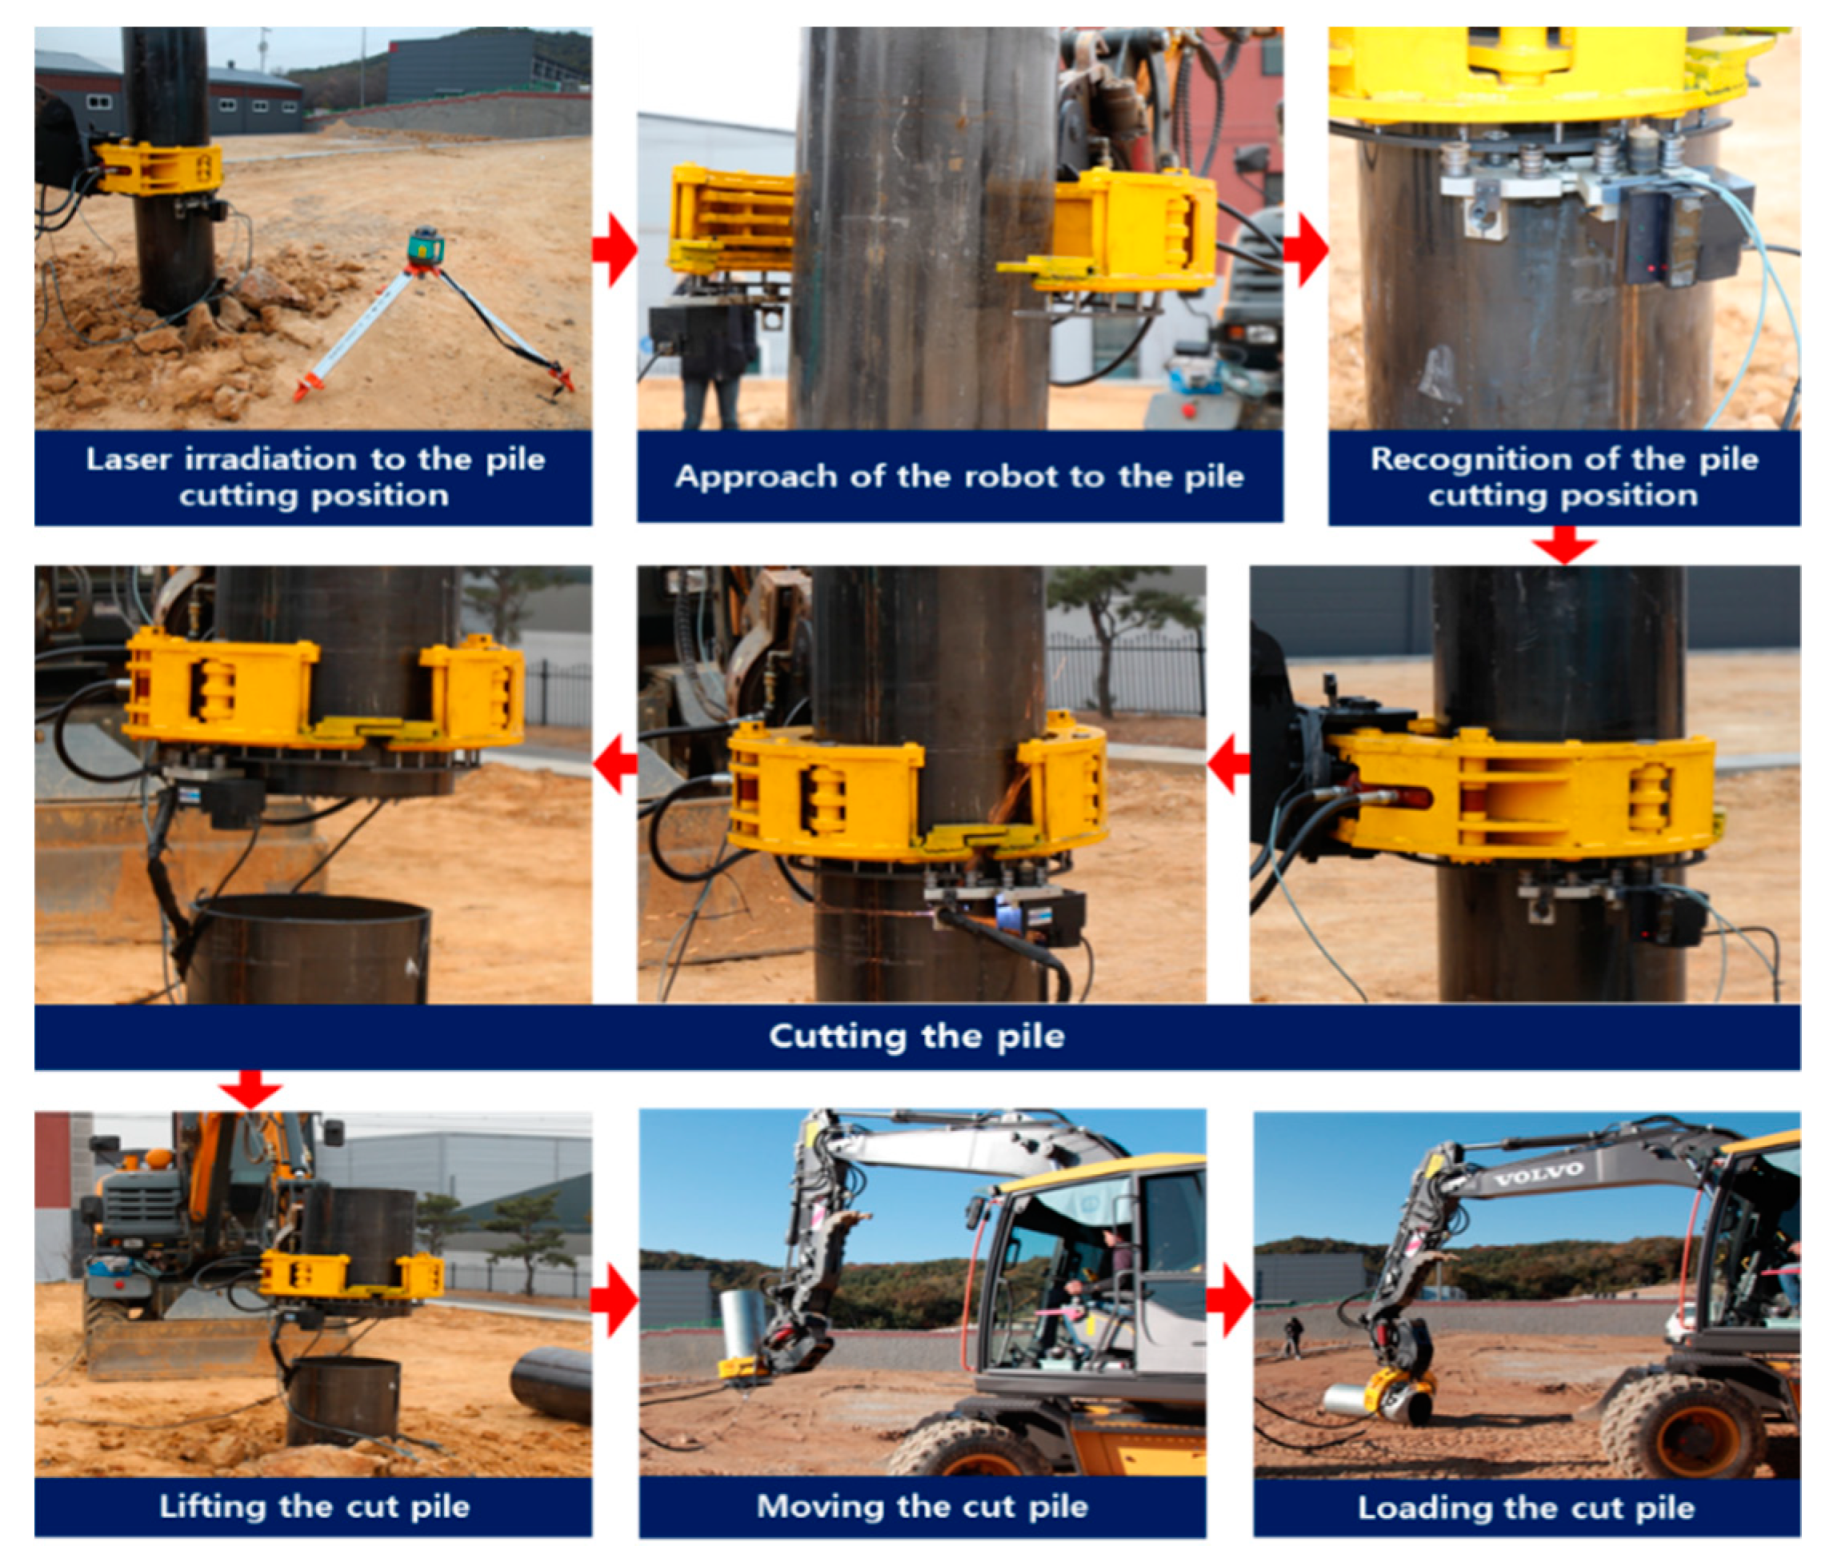
Sustainability 12 03975 g006
Figure 7. Work process of the steel pipe pile head cutting robot.
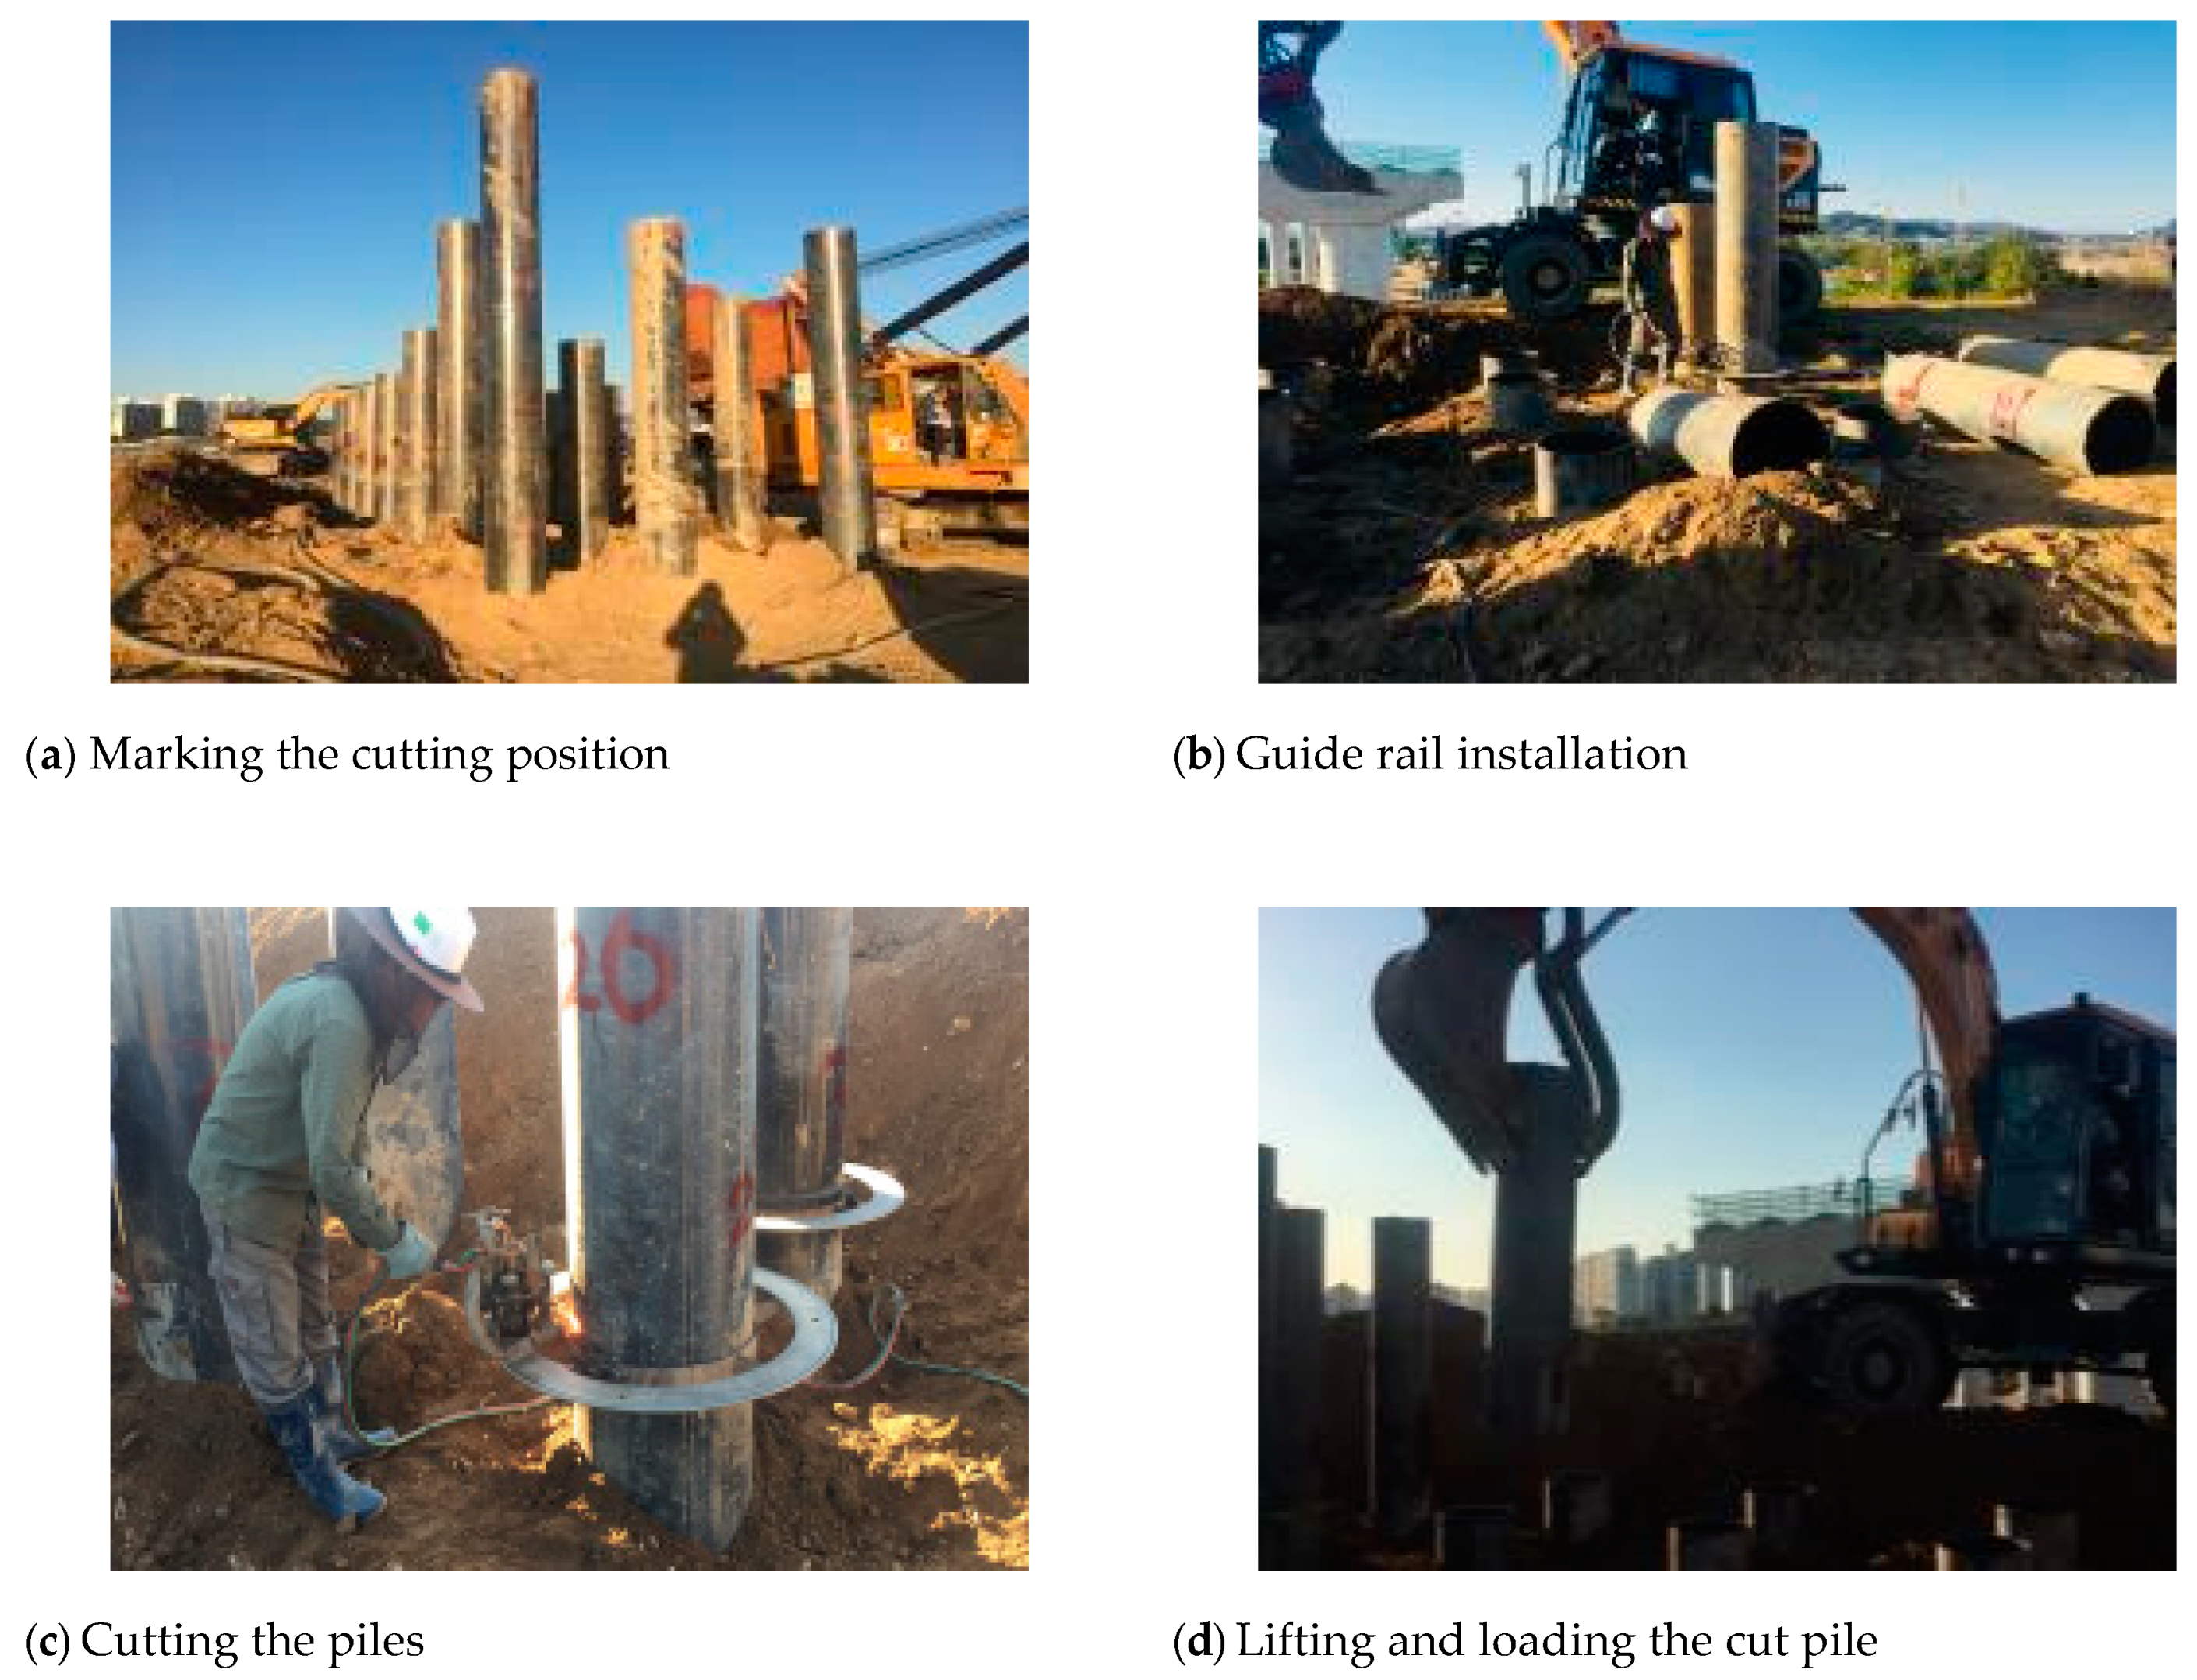
Sustainability 12 03975 g007
Figure 8. Steel pipe pile head cutting work using the conventional method (Asan city).
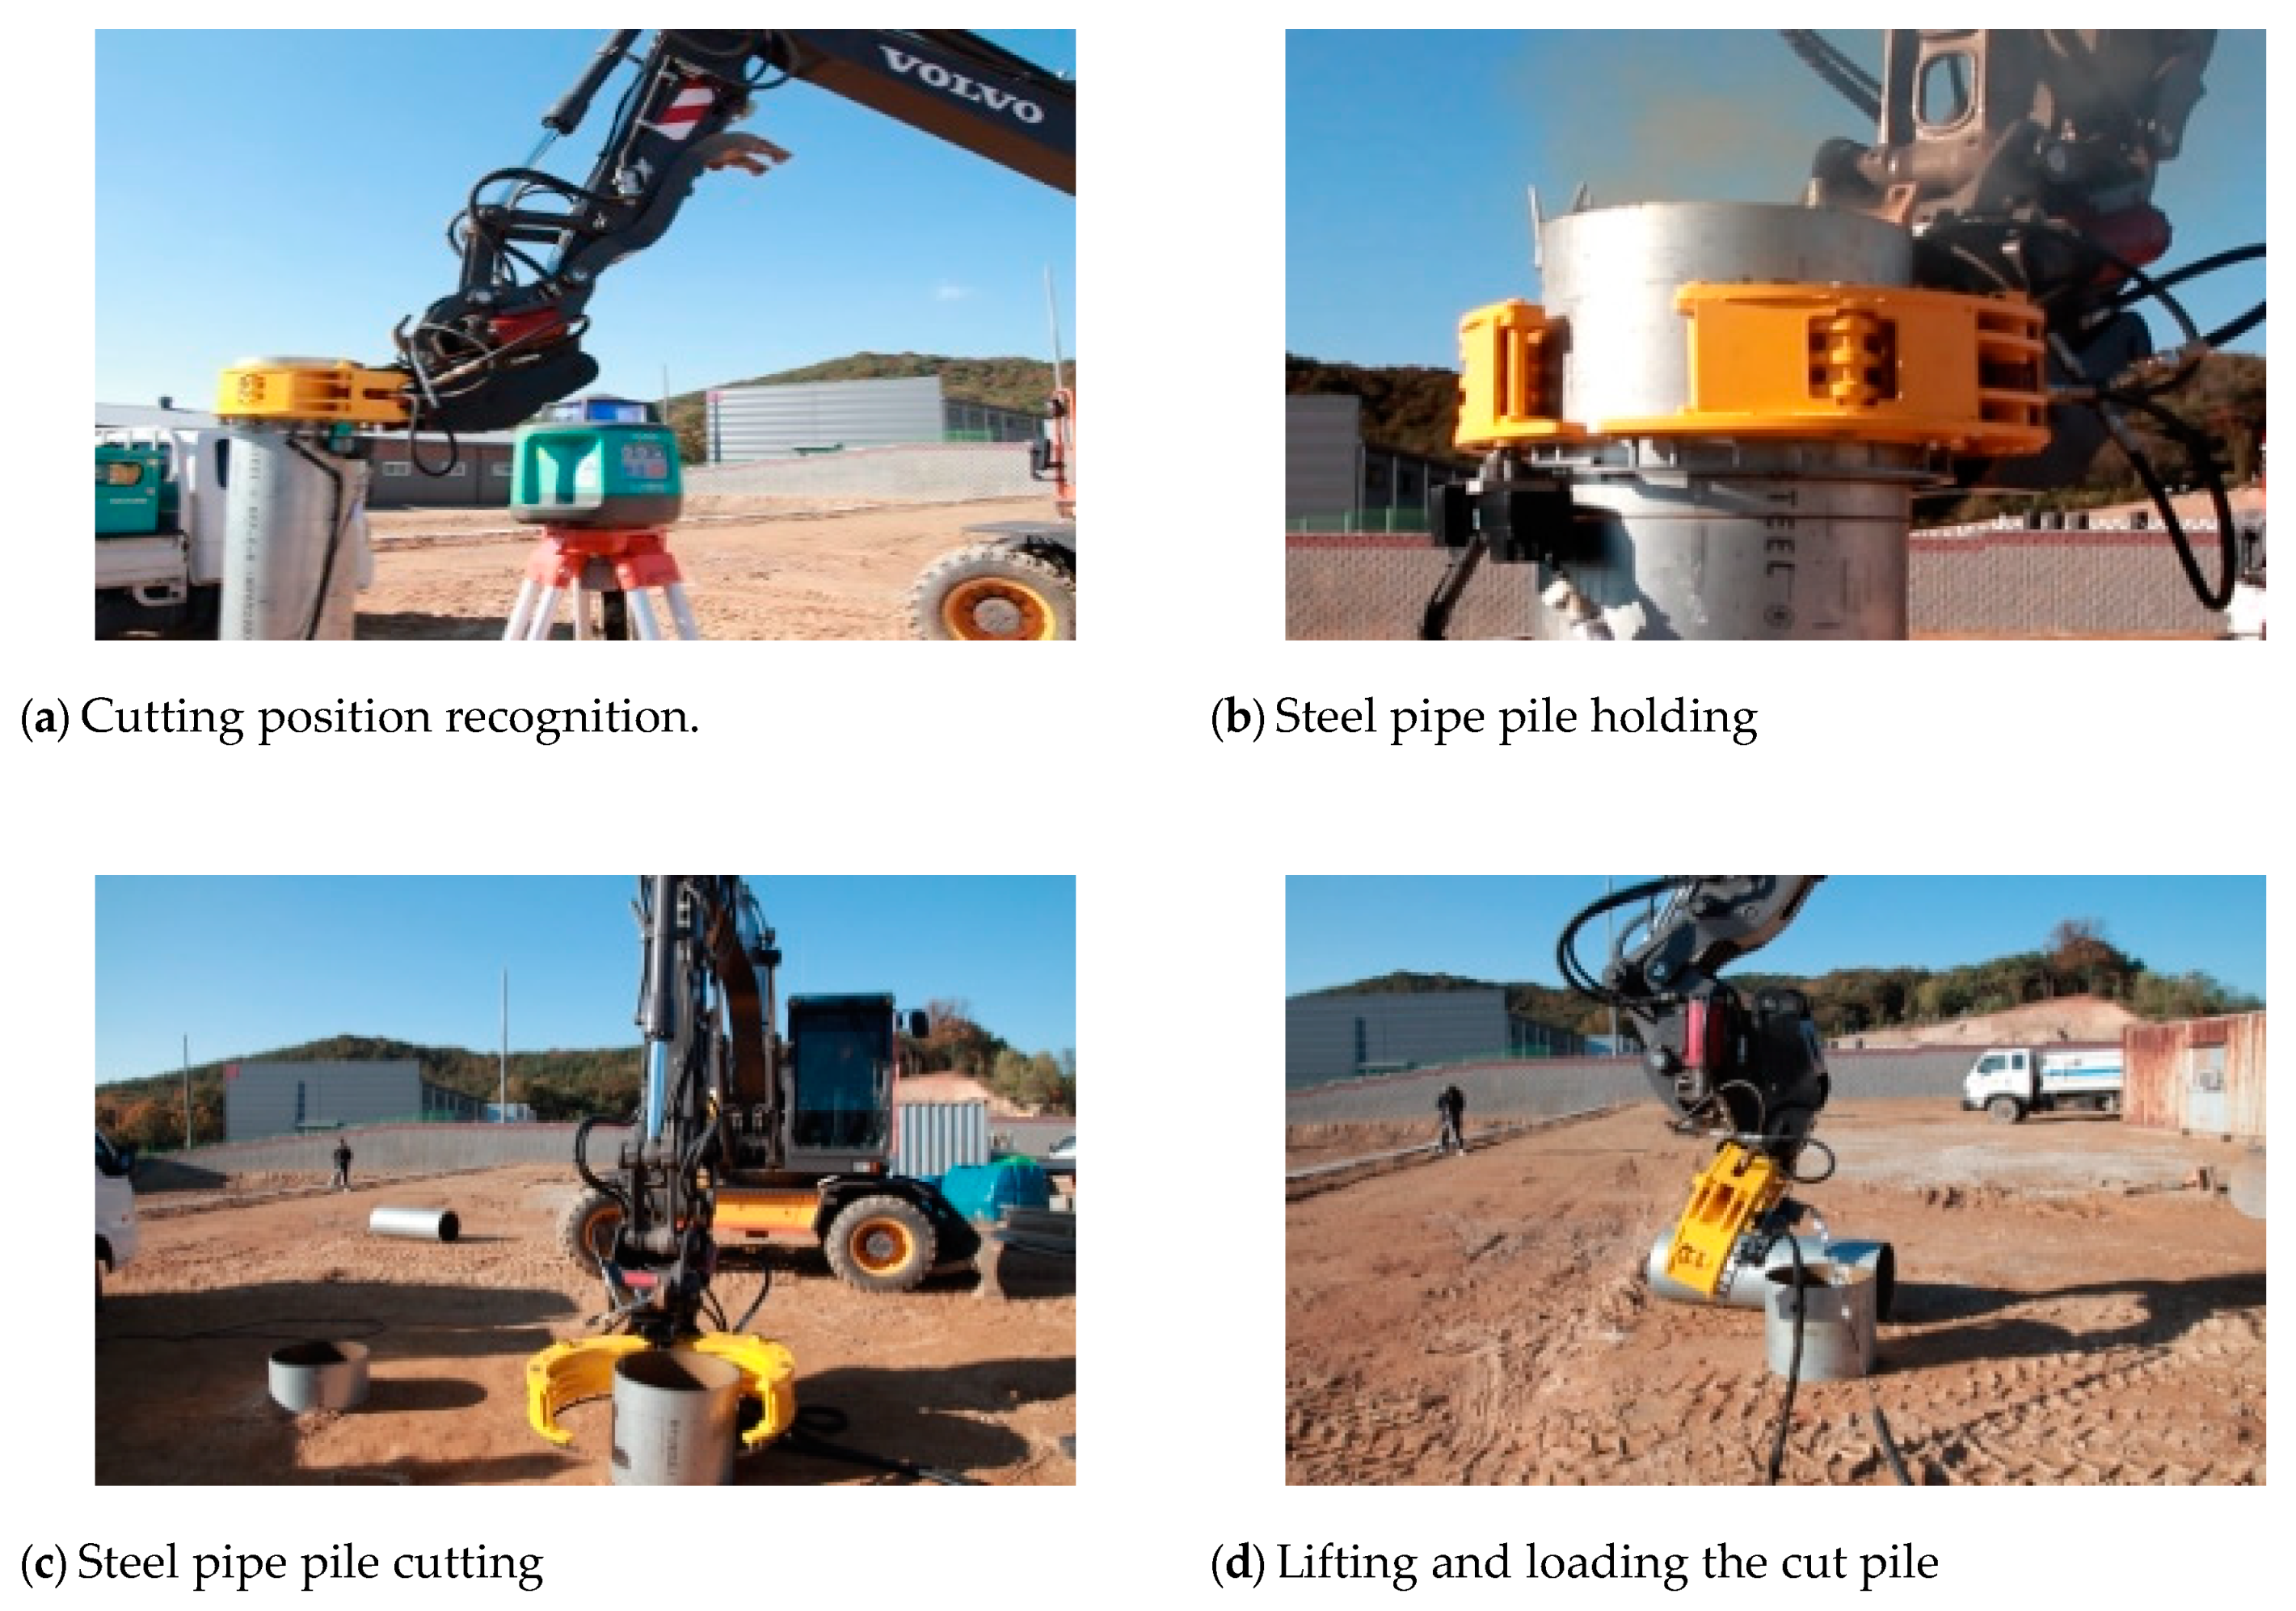
Sustainability 12 03975 g008
Figure 9. Steel pipe pile head cutting work using the automated method (Asan city).
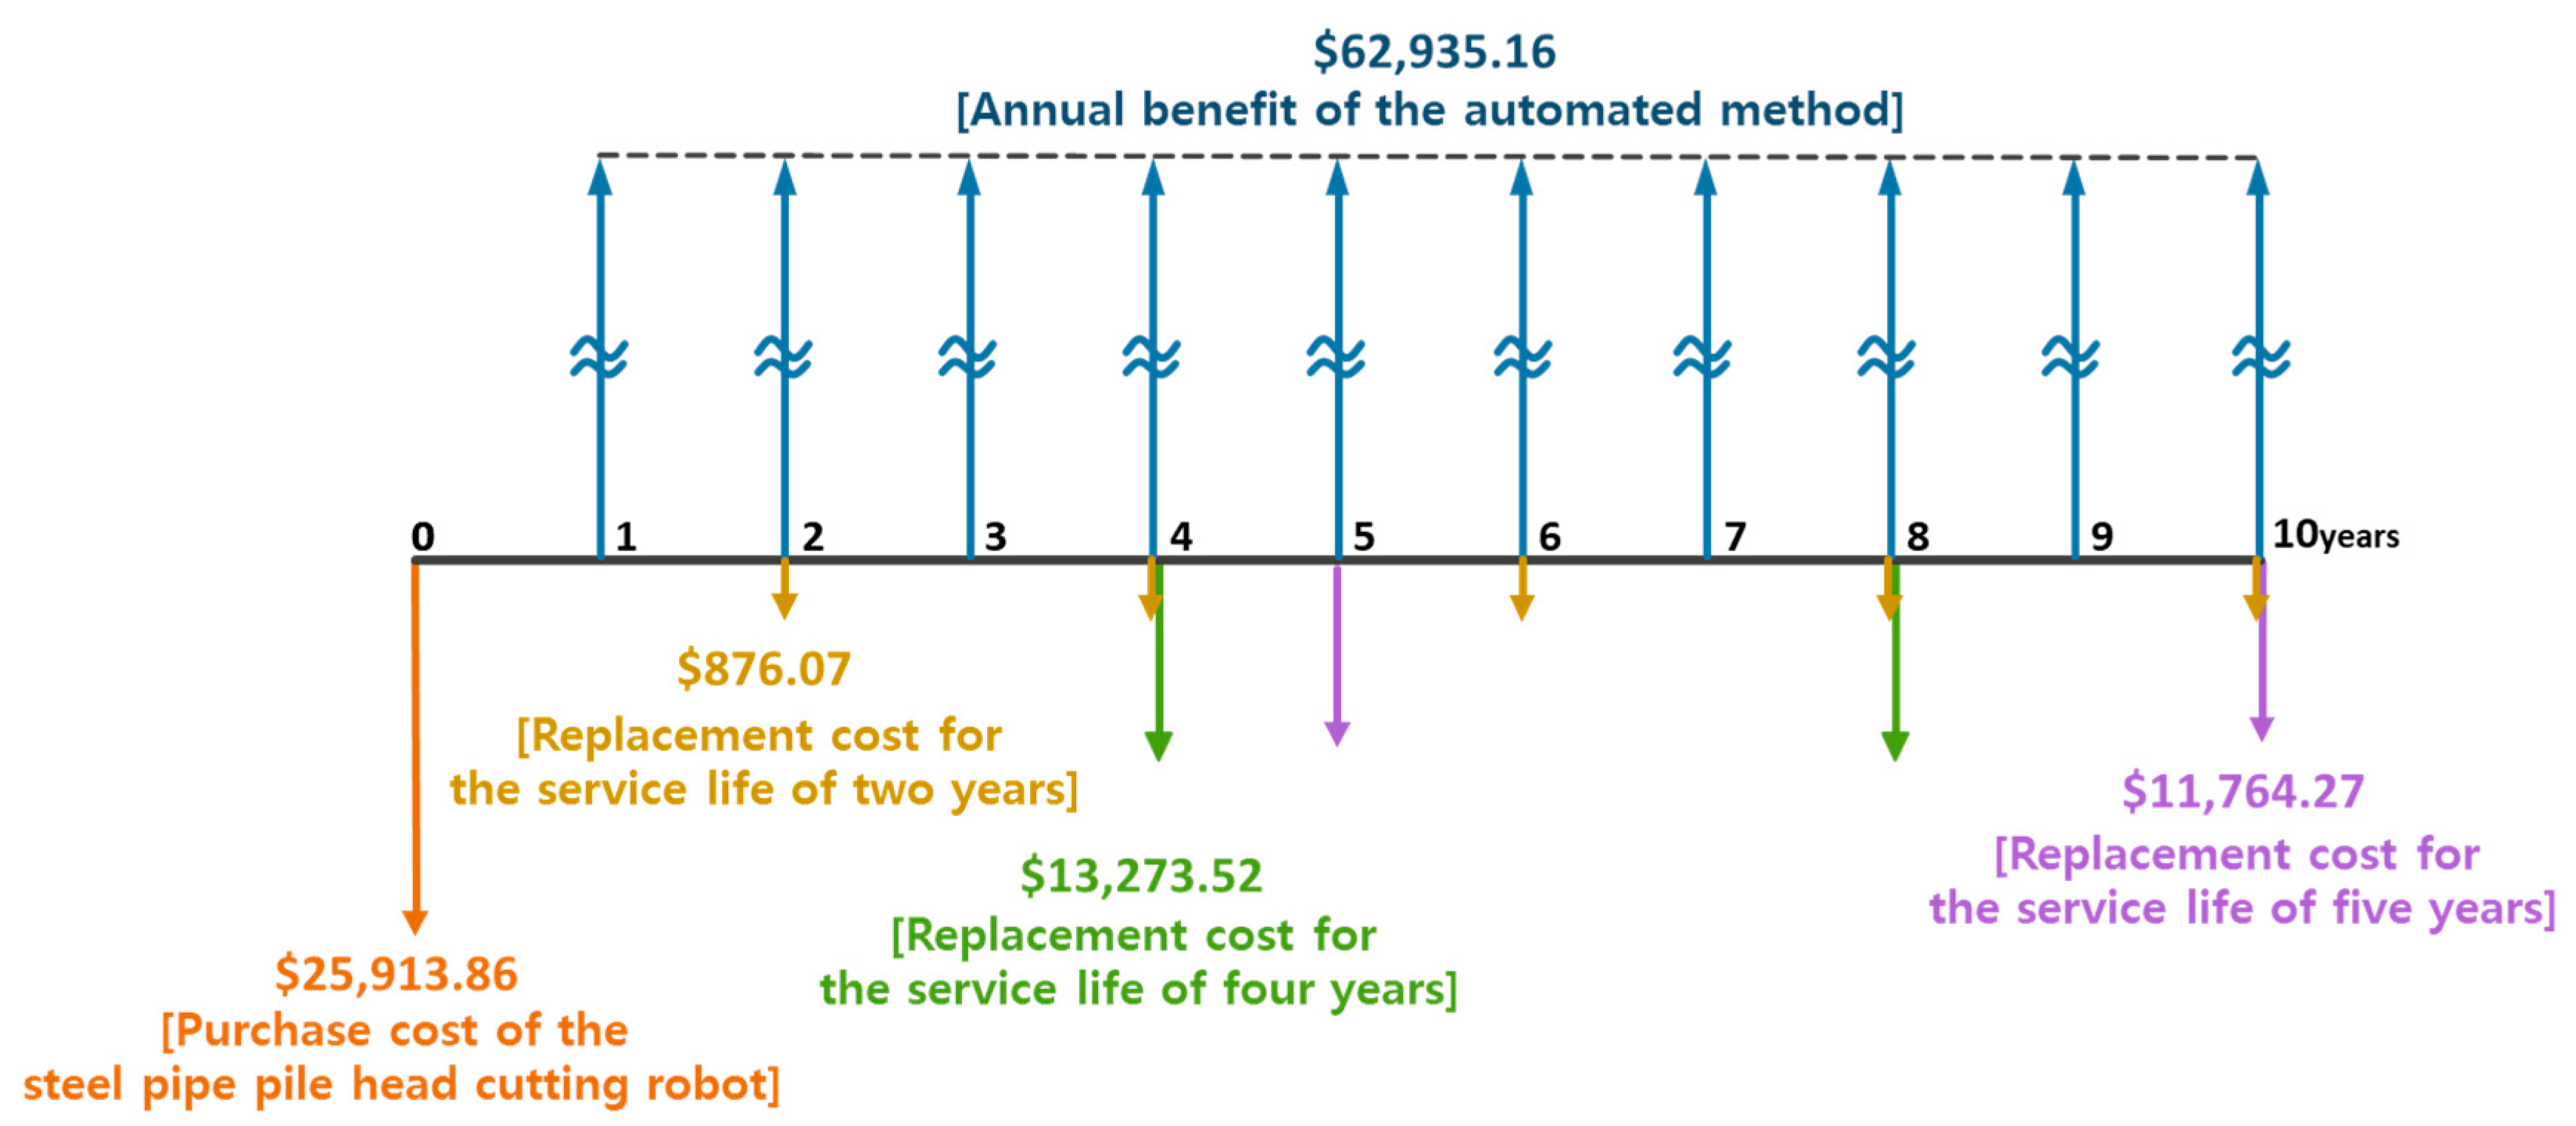
Sustainability 12 03975 g009
Figure 10. Cash flow diagram of the steel pipe pile head cutting robot.
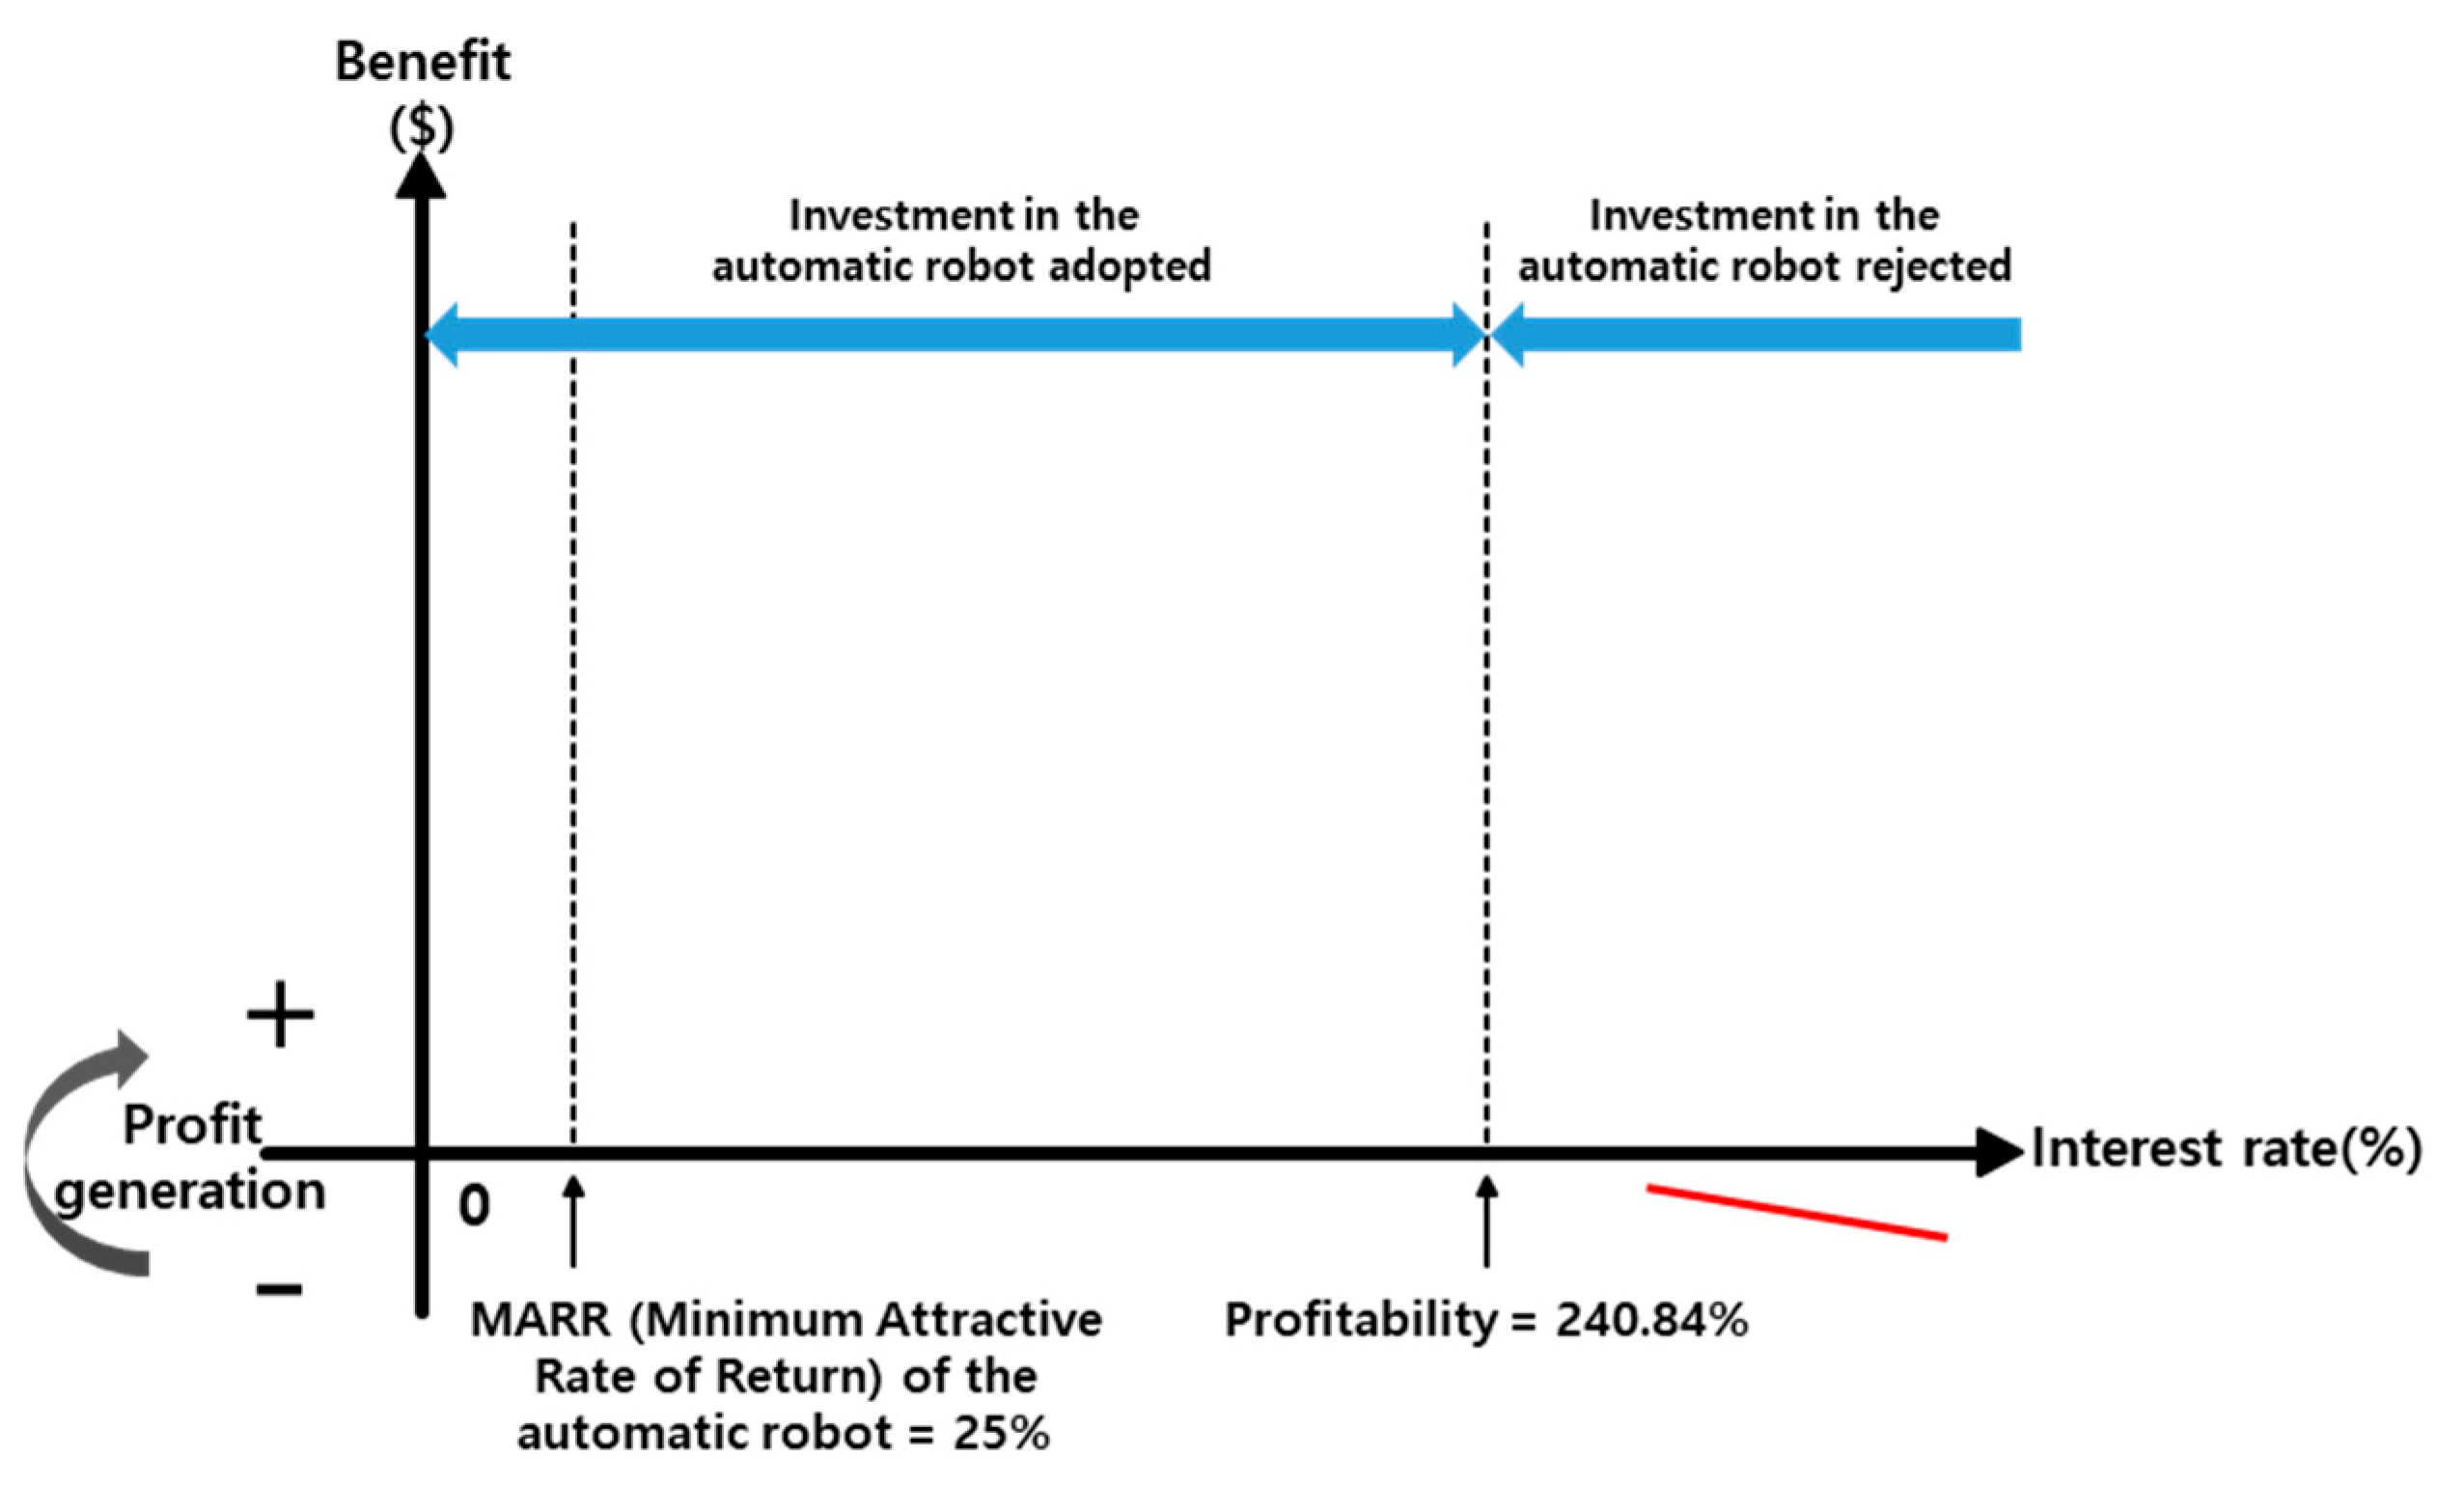
Sustainability 12 03975 g010
Figure 11. Profitability graph of the steel pipe pile head cutting robot.
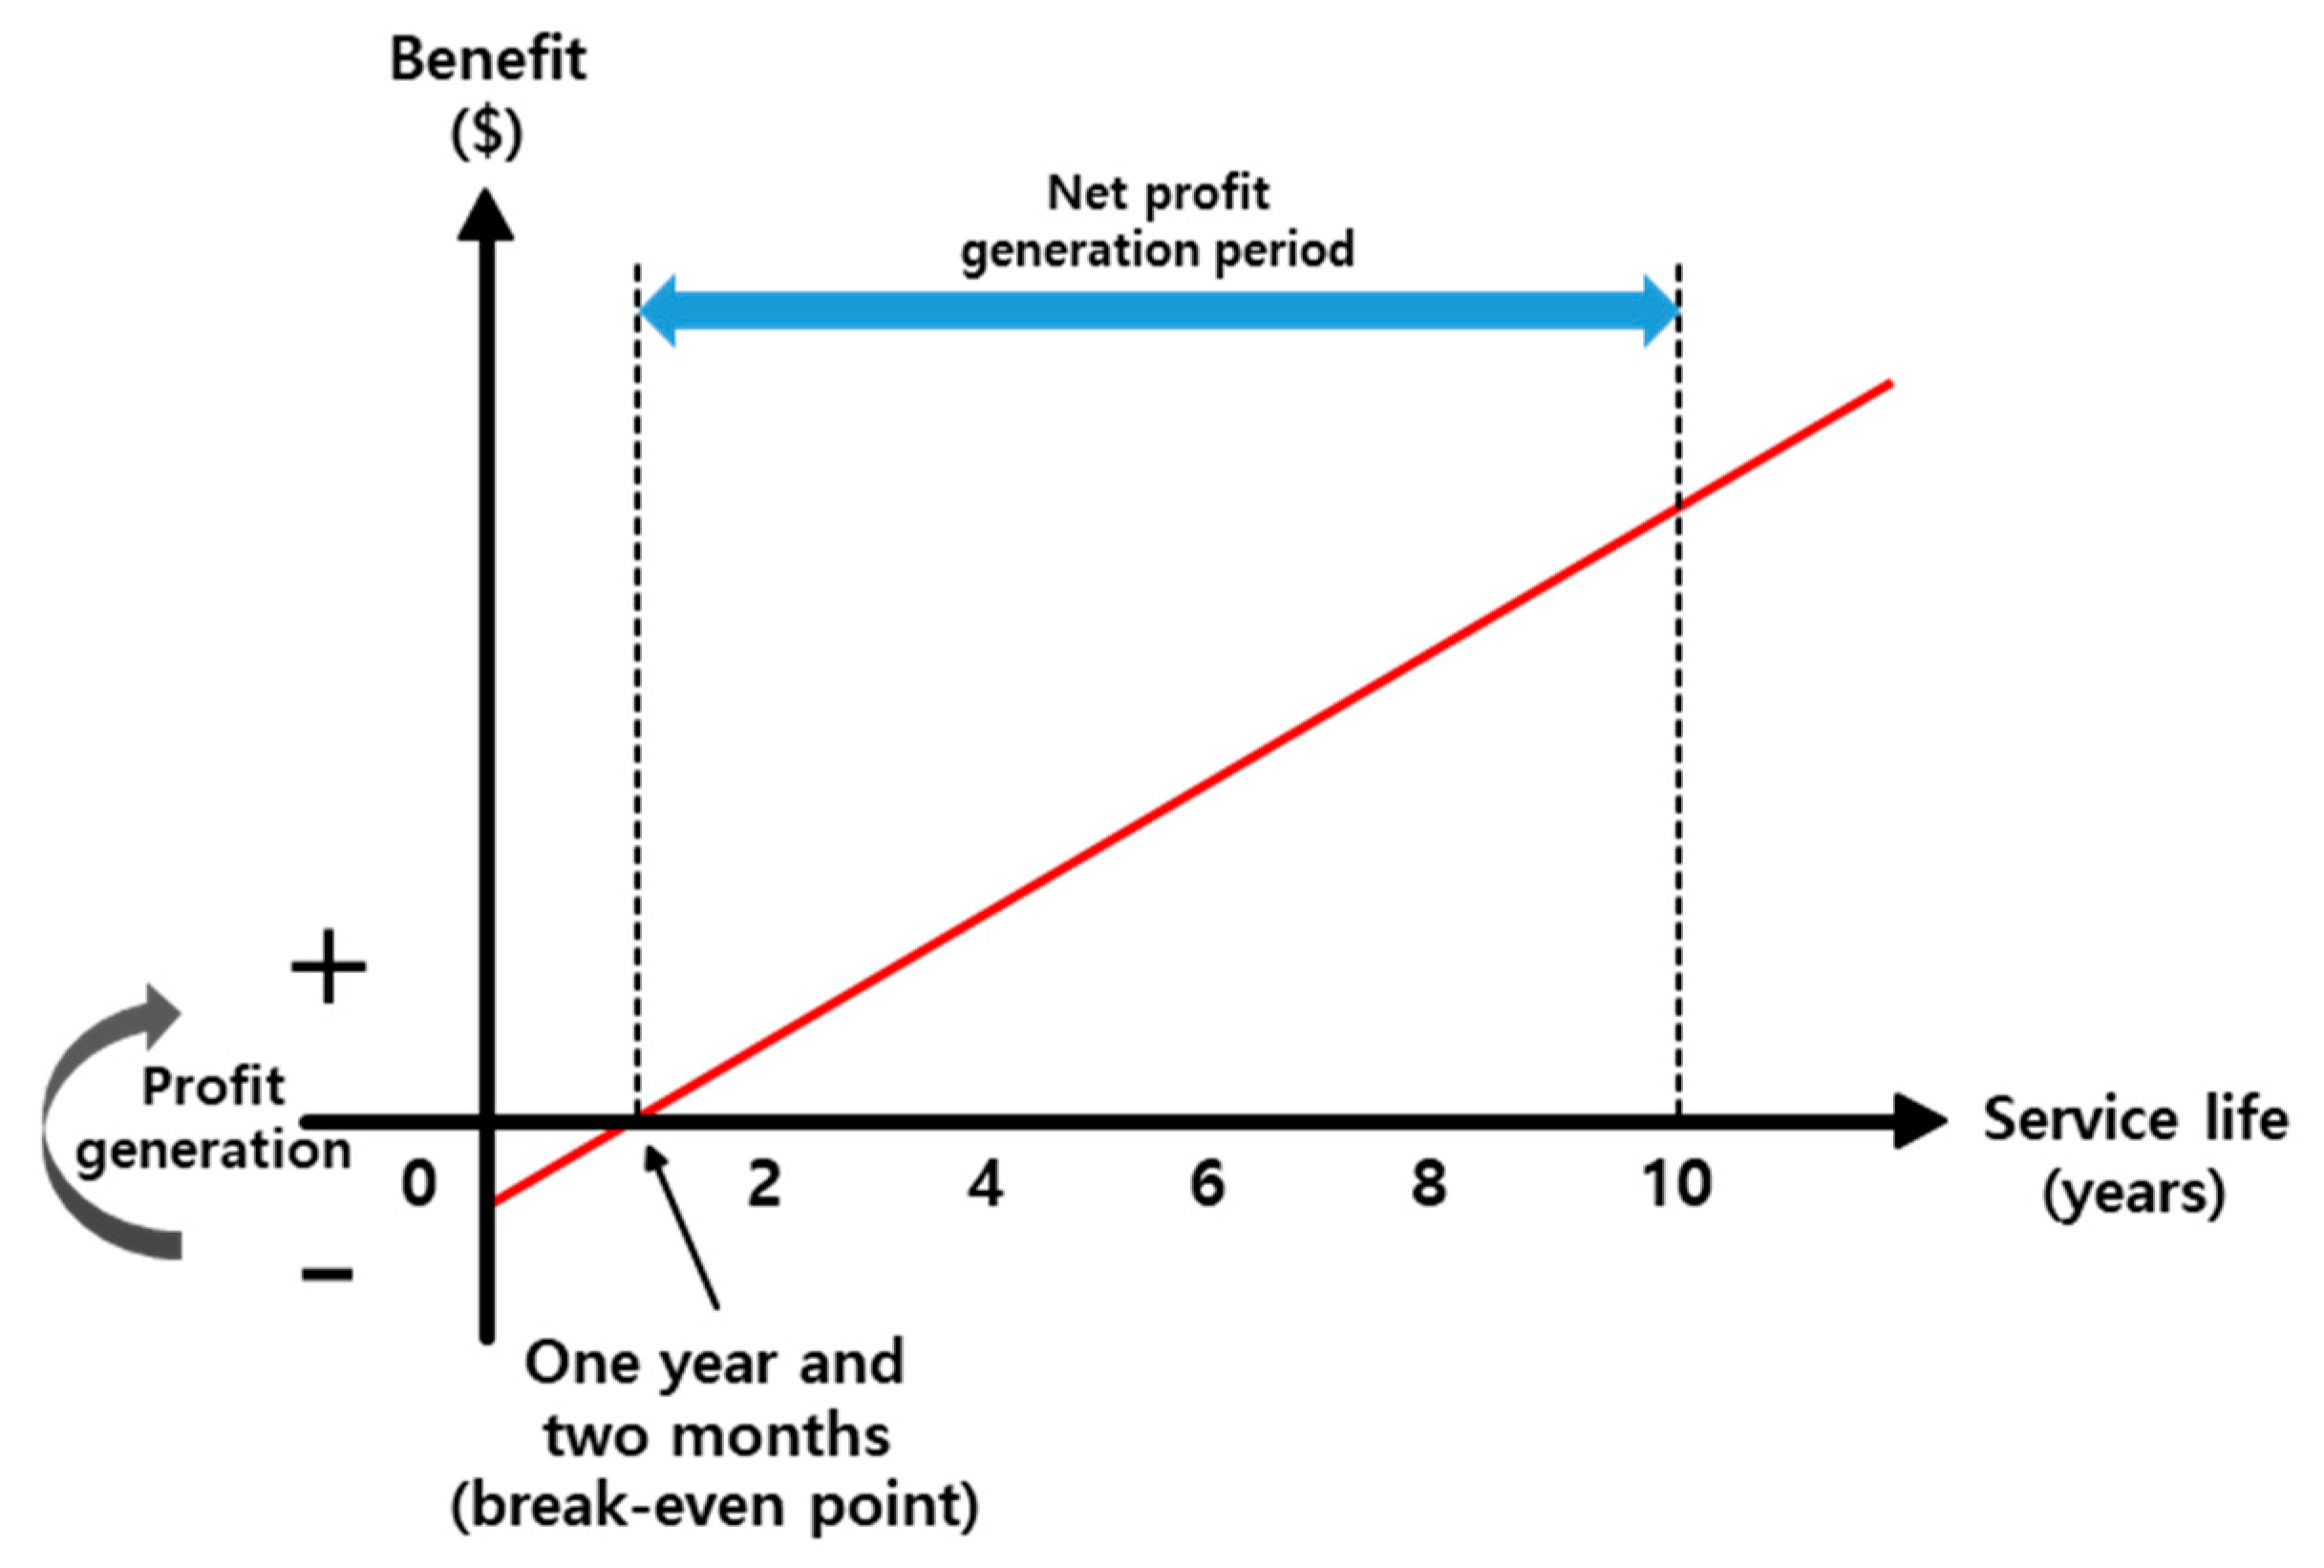
Sustainability 12 03975 g011
Figure 12. Break-even point graph of the steel pipe pile head cutting robot.
Sustainability 12 03975 g012
Figure 13. Annual total construction input costs of the conventional and automated methods.
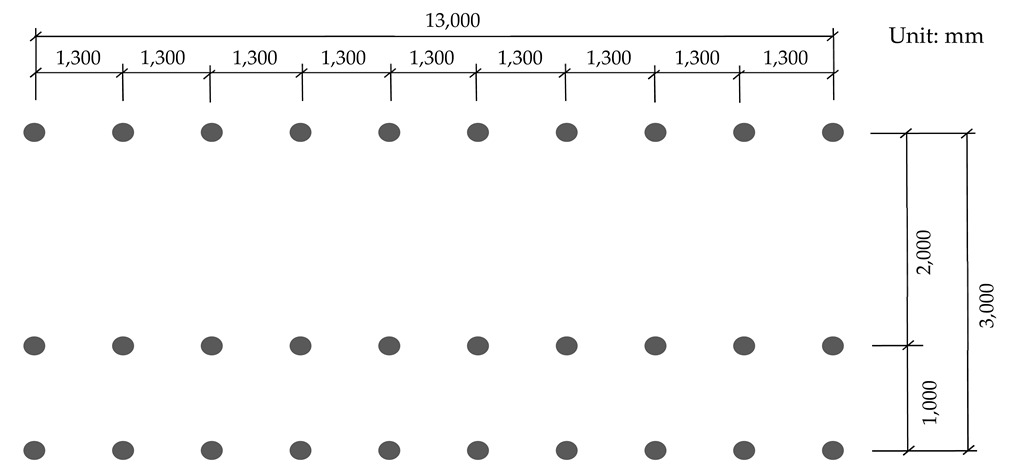
Sustainability 12 03975 g013
Table 1. Overview of the pier foundation construction site for the measurement of work productivity.
Sustainability 12 03975 i001
Target structurePier foundation of a highway bridge
Specifications of steel pipe pilesDiameter: 508 mm; thickness: 12 mm
Quantity of steel pipe piles30
Table 2. Time required for each process of the conventional method and its productivity measure.
CategoryMarking the Cutting PositionGuide Rail Installation/UninstallationSteel Pipe pile CuttingLifting and Loading the Cut PileWork Productivity
Conventional method13 s/pile50 s2 min and 10 s/pile30 s/pile166 piles/day
Table 3. Time required for each process of the automated method and the productivity measure.
CategoryCutting Position RecognitionSteel Pipe Pile HoldingSteel Pipe Pile CuttingLifting and Loading the Cut PileWork Productivity
Automated method15 s/pile3 s/pile1 min and 31 s/pile10 s/pile242 piles/day
Table 4. Daily labor costs of the conventional and automated methods.
Conventional MethodAutomated Method
CategoryInput PersonnelDaily Cost ($)Labor Cost ($)CategoryInput PersonnelDaily Cost ($)Labor Cost ($)
Welder2151.07302.14Welder1151.07151.07
Total302.14Total151.07
Daily labor cost saving of the automated method: 302.14 − 151.07 = $151.07 (50%)
Table 5. Manufacturing cost of the steel pipe pile head cutting robot.
ComponentService Life (years)Manufacturing Cost ($)
Grapple Assy46430.67
Cutting Assy2876.07
Sensing Assy51607.14
Rotation Rink46842.85
Power Package58464.28
Control Part51478.57
Unit Accessories5214.28
Manufacturing cost of the steel pipe pile head cutting robot ($)25,913.86
Table 6. Calculation of the number of working days per year for steel pipe pile head cutting work.
CategoryNumber of Nonworking/Working Days Per Year for Steel Pipe Pile Head Cutting
Year2018201720162015201420132012201120102009
Non-working daysHolidays114120118111117116114116113110
Precipitation
(exceeding 0 mm/h)
10799109104101129110108135113
Number of overlapping days27383431273830373836
Number of working days171184172171174158171178155178
Average number of working days per year for steel pipe pile head cutting work: 172 days
Table 7. Annual input costs of the conventional and automated methods.
Conventional Method
(172 Working Days Per Year)
Automated Method
(118 Working Days Per Year)
CategoryDaily Input Cost ($)Annual Input cost ($)CategoryDaily Input Cost ($)Annual Input Cost ($)
Equipment cost533.2191,712.12Equipment cost533.2162,919.28
Labor cost302.1451,968.08Labor cost151.0717,826.26
Total835.35143,680,20Total684.2880,745.04
Annual benefit generated by the introduction of the automated method
143,680.20 − 80,745.04 = $62,935.16/year
Table 8. Discount rate for the analysis of the economic efficiency of the steel pipe pile head cutting robot [12,13,14].
YearCPI Fluctuation (%)Base Interest Rate of Bank of Korea (%)The World Bank and OMBADB
20171.901.5010–12%9%
20161.001.25
20150.701.50
20141.302.00
20131.292.50
20122.212.75
20114.003.25
20102.952.50
20092.762.00
20084.673.00
Average2.282.23
Table 9. Benefit–cost ratio analysis results.
  A n n u a l   b e n e f i t   ( B ) B = C c × D c C α × D α = 835.35 × 172 654.28 × 118 = 143,680.20 80,745.04                      = $ 62,935.16
  P W   o f   t h e   a n n u a l   b e n e f i t   ( B p w ) B p w = B ( P / A , i , n )                   = 62,935.16 ( P / A , 2.28 % , 10 )                       = $ 557,127.34
  P W   o f   t h e   a d d e d   c o s t   ( C p w )                    C p w = R P + M C      = 25,913.86 + 876.07 ( P / F , 2.28 % , 2 ) + 876.07 ( P / F , 2.28 % , 4 ) + 876.07 ( P / F , 2.28 % , 6 ) +      876.07 ( P / F , 2.28 % , 8 ) + 876.07 ( P / F , 2.28 % , 10 ) +     13,273.52 ( P / F , 2.28 % , 4 ) + 13,273.52 ( P / F , 2.28 % , 8 ) +      11764.27 ( P / F , 2.28 % , 5 ) + 11,764.27 ( P / F , 2.28 % , 10 )        = $ 72,859.88
  B e n e f i t / c o s t   r a t i o   ( B / C   ratio ) B / C   r a t i o = P W   o f   B e n e f i t P W   o f   C o s t       = B p w C p w = $ 557,127.34 $ 72,859.88                    = 7.65
Table 10. Profitability analysis results.
∎ Internal rate of return (IRR)
N P V = P W   o f   B e n e f i t P W   o f   C o s t = 0        = 62,935.16 ( P / A , i , n ) { 25,913.86 + 876.07 ( P / F , i , 2 ) + 876.07 ( P / F , i , 4 ) +       876.07 ( P / F , i , 6 ) + 876.07 ( P / F , i , 8 ) + 876.07 ( P / F , i , 10 ) + 13,273.52 ( P / F , i , 4 ) +        13,273.52 ( P / F , i , 8 ) + 11,764.27 ( P / F , i , 5 ) + 11,764.27 ( P / F , i , 10 ) } = 0 i r = 240.84 %                    i r :   I n t e r n a l   r a t e   o f   r e t u r n   ( I R R )
Table 11. Break-even analysis results.
B r e a k e v e n   p o i n t   ( N )   P W   o f   B e n e f i t P W   o f   C o s t = B p w C p w = 0     62,935.16 ( P / A , 2.28 % , N ) 73,859.88 = 0 ( P / A , 2.28 % , N ) = 72,859.88 62,935.16   1.1577   N   1.17   y e a r s   ( o n e   y e a r   a n d   t w o   m o n t h s )
Table 12. Annual construction cost reduction effect analysis results.
  A n n u a l   t o t a l   c o n s t r u c t i o n   i n p u t   c o s t   o f   t h e   c o n v e n t i o n a l   m e t h o d   ( A C c )   A C c = C c × D c                   = 835.35 × 172                   = $ 143,680.20
  A n n u a l   t o t a l   c o n s t r u c t i o n   i n p u t   c o s t   o f   t h e   a u t o m a t e d   m e t h o d   ( A C α )   A C c = C α × D α + M C                   = 684.28 × 118 + 72, 859.88 ( A / P , 2.28 % , 10 )                   = 80,745.04 + 8230.52                   = $   88,975.56
  A n n u a l   c o n s t r u c t i o n   c o s t   r e d u c t i o n   e f f e c t   o f   t h e   a u t o m a t e d   m e t h o d   c o m p a r e d   w i t h   t h e         c o n v e n t i o n a l   m e t h o d       A C C A C α A C c × 100 = ( 143 , 680.20 88 , 975.56 ) 143,680.20 × 100 = 38.07 %
Table 13. Sensitivity analysis results for the manufacturing cost of the robot.
Manufacturing Cost Change RateBenefit–Cost RatioProfitability (%)Break-Even Point (years)Annual Construction Cost Reduction Effect (%)
50%9.30484.240.9839.09
100%
($25,913.86)
7.65240.841.1738.07
120%7.14200.201.2537.67
140%6.69171.121.3337.26
160%6.30149.291.4136.85
180%5.95132.301.4936.44
200%5.64118.701.5736.04
702%2.4330.013.7026.60
1968%1.002.279.632.29
Table 14. Sensitivity analysis results for the discount rate.
Discount RateBenefit–Cost RatioProfitability (%)Break-Even Point (years)Annual Construction Cost Reduction Effect (%)
2.23%7.65240.841.1738.08
2.28%7.651.1738.07
9.00%7.050.9137.59
10.00%6.960.8837.51
11.00%6.870.8637.42
12.00%6.770.8337.33
Table 15. Sensitivity analysis results for annual working days.
Number of Working Days Per YearBenefit–Cost RatioProfitability (%)Break-Even Point (Years)Annual Construction Cost Reduction Effect (%)
Conventional MethodAutomated Method
25170.994.659.731.61
26181.0811.058.765.39
36251.5832.785.3515.75
50354.1956.934.2722.95
1006935.00135.592.0733.63
172118104.00240.841.1738.07

