Article

Techno-Economic Feasibility Assessment of Grid-Connected PV Systems for Residential Buildings in Saudi Arabia—A Case Study

Department of Electrical and Computer Engineering, King Abdulaziz University, Jeddah 21589, Saudi Arabia
*
Author to whom correspondence should be addressed.
Sustainability 2020, 12(1), 262; https://doi.org/10.3390/su12010262
Submission received: 11 November 2019 / Revised: 21 December 2019 / Accepted: 23 December 2019 / Published: 28 December 2019
(This article belongs to the Special Issue Economic Evaluation of Renewable Energy Sources)

Abstract

:
This paper presents a techno-economic feasibility evaluation for a grid-connected photovoltaic energy conversion system on the rooftop of a typical residential building in Jeddah, one of the major cities in Saudi Arabia. In Saudi Arabia, electric energy consumption is the highest in the domestic sector, with 48.1% of the total electricity consumption. As the power generation in Saudi Arabia mainly relies on conventional resources, environmental pollution and energy sustainability are major concerns. To minimize these issues, the Saudi government is in the process of maximizing the utilization of renewable energy resources for power generation. Investing in solar energy in Saudi Arabia is important because the country is witnessing a rapid increase in load demand, with annual growth rates of 6%. In this paper, the system advisor model software for renewable energy modeling has been utilized to perform a techno-economic feasibility analysis of a residential grid-connected solar photovoltaic (PV) system, which is proposed for a typical apartment in Saudi Arabia, on the basis of various key performance indicators, namely: yield factor, capacity factor, performance ratio, levelized cost of energy, net present value, internal rate of return, and payback period. A sensitivity analysis that investigates the impact of varying techno-economic parameters on system performance and feasibility is also discussed. The size of the PV system for a typical Saudi Arabian apartment is estimated to be 12.25 kW. Results have shown that the proposed system can generate 87% of the electricity needs of an apartment. The technical analysis showed that the capacity factor and the performance ratio were 22% and 78% respectively. The levelized cost of energy and net present value revealed competitive figures of 0.0382 $/kWh and $4378, respectively. The investigations indicate that residential PV installations are an effective option for energy management in the country.

1. Introduction

Conventional fuels utilized to generate electricity have negative potential impacts on the environment [1]. In addition, reports show that fossil fuels and oil resources are constantly declining every year and will run out in the near future [2,3]. Hence, according to Vision 2030, Saudi Arabia aims to boost its renewable energy resources in its total energy share by producing nearly 9.5 GW of energy from sustainable energy sources by 2023, of which solar photovoltaic (PV) generation comprises a considerable portion [4,5,6,7]. The installed conventional power generation capacity in Saudi Arabia is the largest compared to other countries in the Middle East, with a total capacity of 88,685 MW of power generation in 2017. The average cost of electricity production in Saudi Arabia is 0.0544 $/kWh. Energy costs have been calculated based on the government-subsidized fuel price, which is much lower than the international average electricity price [8]. With reference to the electricity demand in Saudi Arabia, the country has experienced drastic growth in recent years as a result of the continued expansion of both its population and industrial development. Saudi Arabia’s energy usage increased from roughly 296,648 GWh in 2016 to 298,439 GWh in 2017, with a growth rate of 6%, while the peak load demand increased from 32,000 MW in 2008 to 63,121 MW in 2017, with a 63.2% average growth rate [9,10]. According to an independent study, it is expected that the peak load will continue to increase to over 70,000 MW by 2020 [11]. This figure of demand has been driven by population expansion, urbanization, higher levels of material comfort, and economic growth [12].
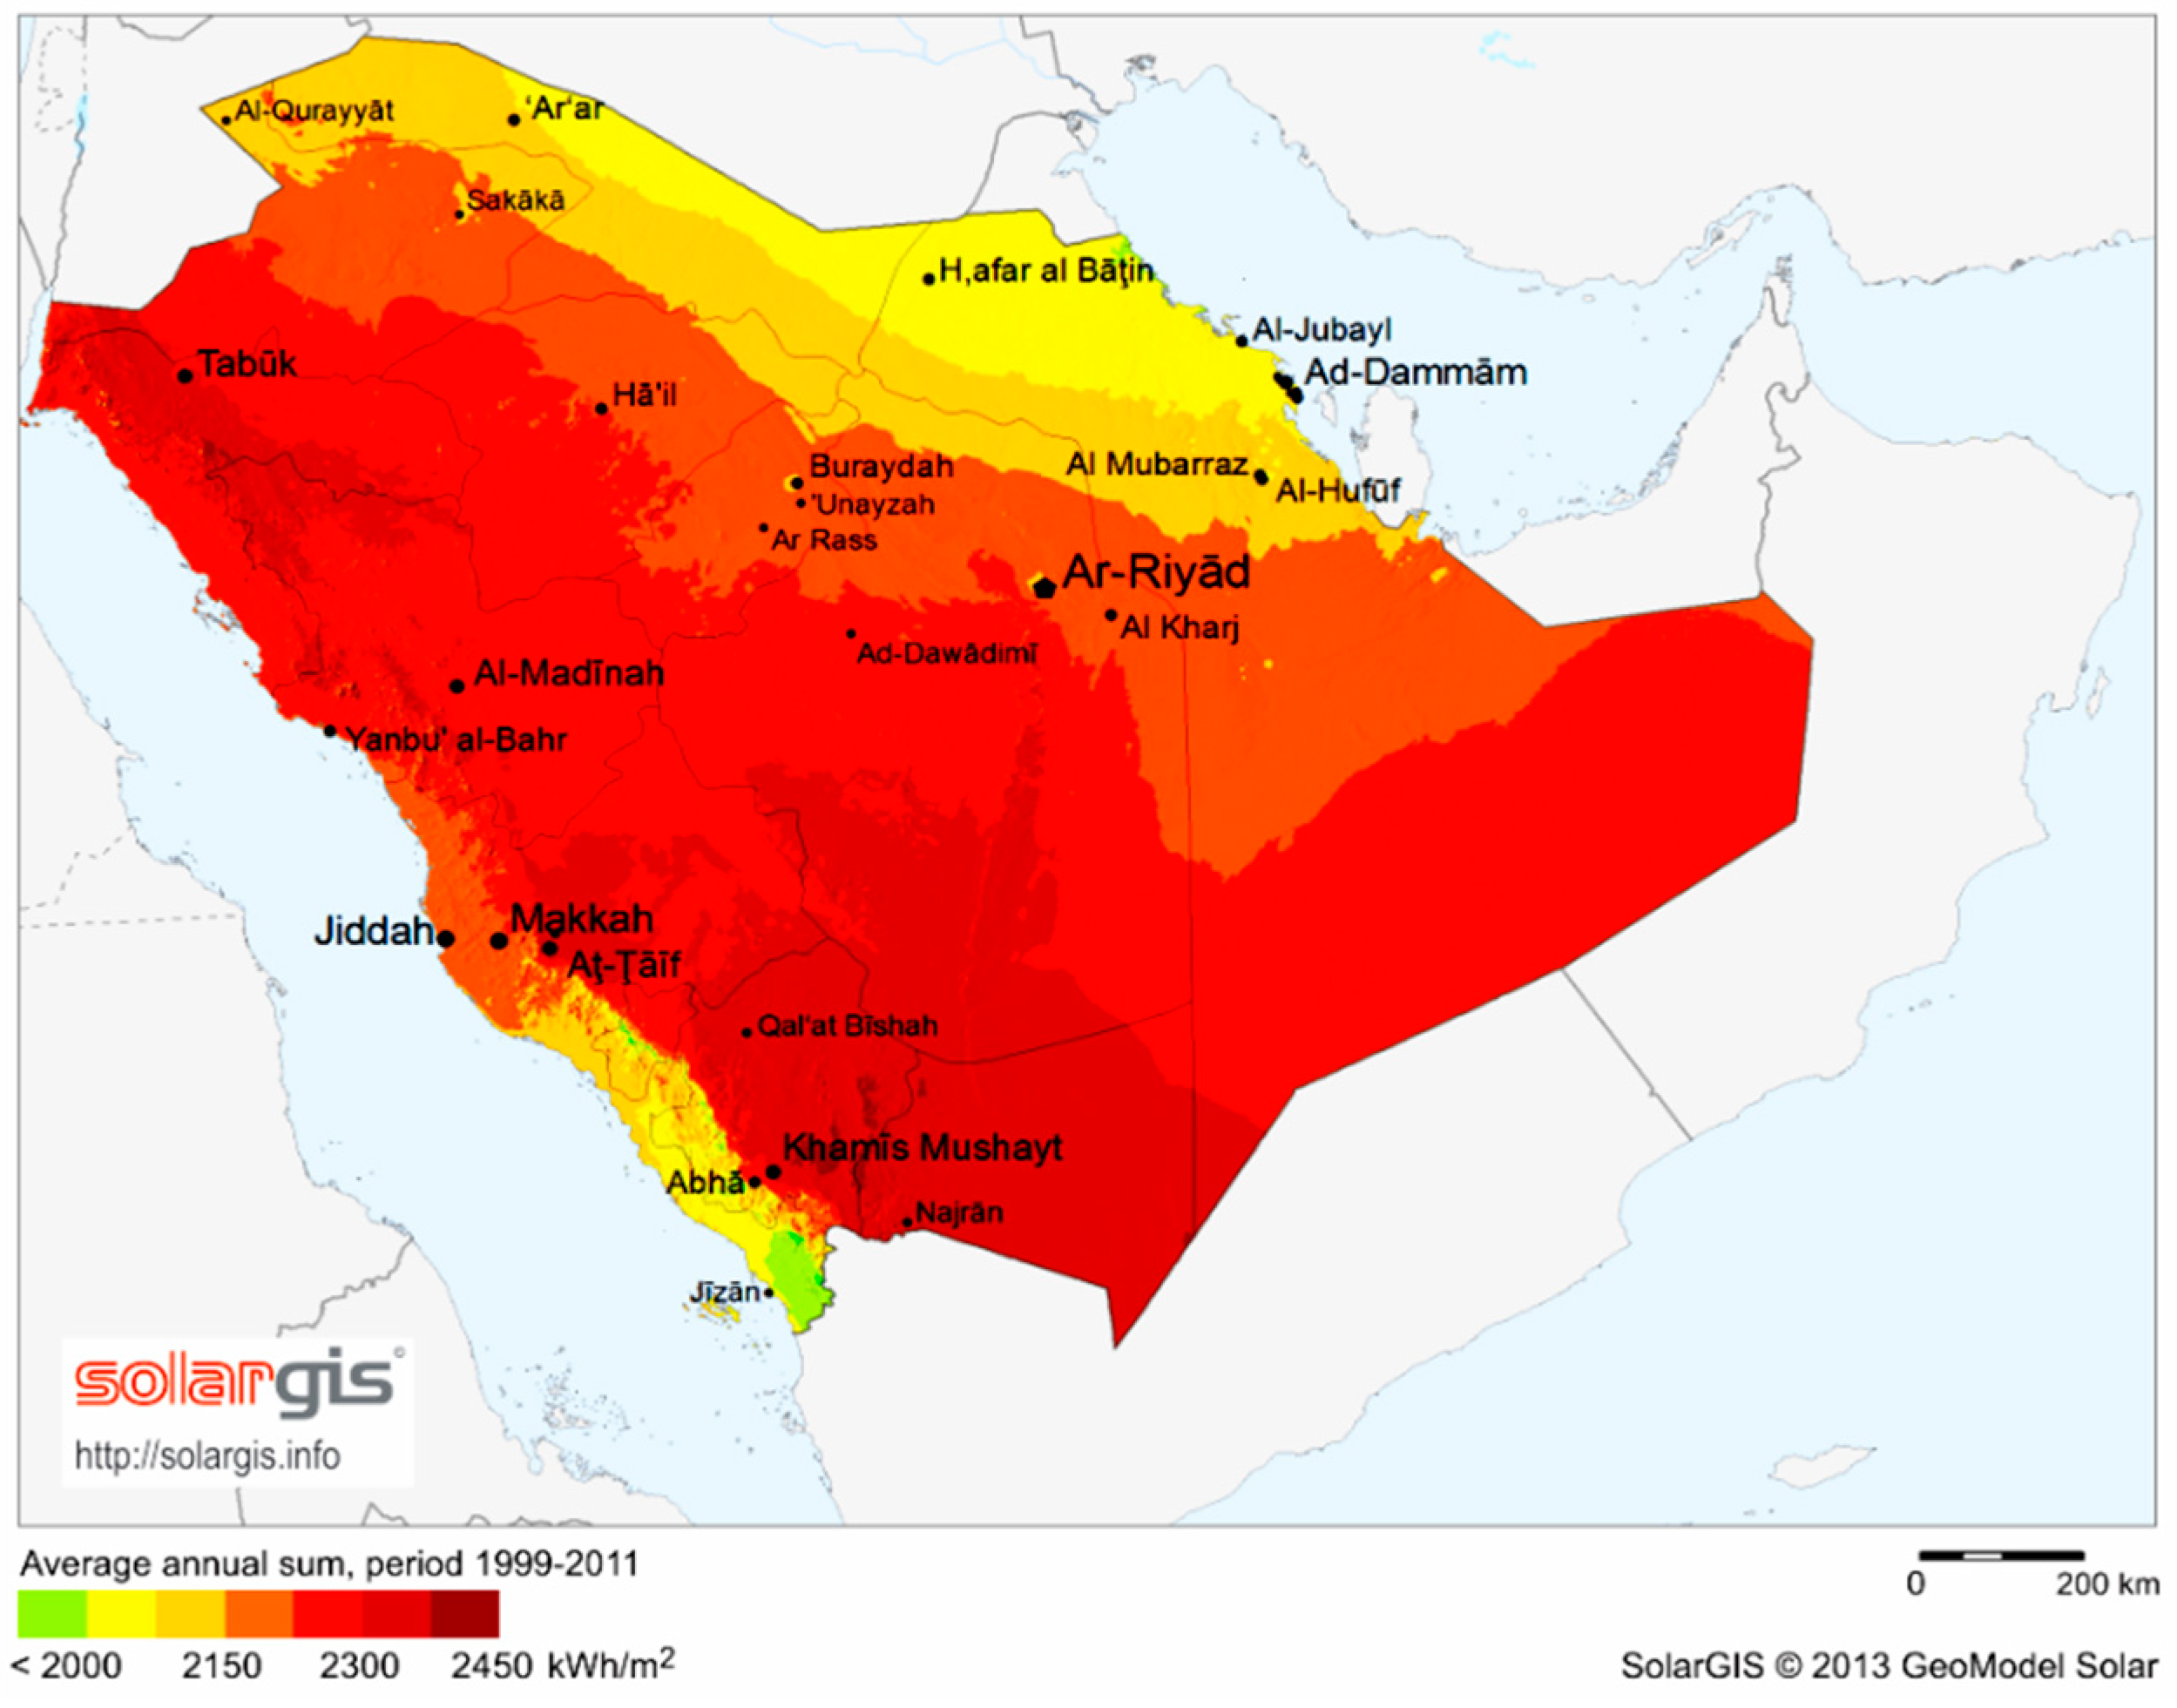
The building sector is responsible for almost 80% of electrical energy consumption in the country, with over 50% attributed to residential buildings [13]. Therefore, the presence of alternative energy solutions in the domestic sector is of the utmost importance. Solar energy is one of the best solutions to overcome the issue of electric energy demand growth [14]. Since Saudi Arabia possesses a large potential for solar energy, a considerable share of its energy needs may be harvested from solar energy. Saudi Arabia’s high solar irradiation availability, significant rainless areas, and long daylight hours make th country among the most suitable countries for the utilization and deployment of solar energy resources on a large-scale basis. The annual average irradiation in the countries with highest radiation potential ranges between 100–200 W/m2. Saudi Arabia, however, has an annual solar radiation reaching 250 W/m2, outpacing many other countries. In addition, Saudi Arabia has the advantage of long average hours of sunshine per day (8.53 h), vast expanses of free lands, and a cloud-free atmosphere [15]. These factors make Saudi Arabia a very favorable environment for the use of solar PV technologies. Figure 1 shows the global horizontal solar irradiation in Saudi Arabia [16].
Saudi Arabia began to apply solar energy in 1966. The King Abdullah City for Science and Technology was founded in 1977, and research and development in the field of solar energy technologies was among the most active research areas in the city. In 1980, the Kingdom of Saudi Arabia established the “Solar village”, the largest solar energy project at that time (350 kW), with the purpose of supplying three rural villages with electric power [17]. Large-scale solar energy production in Saudi Arabia began in 2010 with the commission of a rooftop solar photovoltaic system with a total capacity of 2 MW on the roof of King Abdullah University of Science and Technology (KAUST). This project consisted of 9300 solar panels and covered an area of 11,600 m2 of the roof. The annual production capacity of this project was about 3281 MW. In 2012, the world’s largest solar car parking at that time (10 MW) was established in Saudi Aramco’s headquarters in Dhahran. The carport’s integrated solar photovoltaic system occupies 4500 m2 of the parking space. More than 120,000 Copper Indium Selenide photovoltaic modules were utilized over the parking territory to provide parking shades to deliver electrical power. The King Abdullah Petroleum Studies and Research Center (KAPSARC) project is the largest ground-mounted photovoltaic system in Saudi Arabia. It was commissioned in 2013 with a total capacity of 3.5 MW in Riyadh, Saudi Arabia. The project was constructed on a total area of 55,000 m2, and a total of 12,684 photovoltaic modules were installed. The project produces 5800 MWh of solar electricity annually and thus reduces 4900 tons of CO2 emissions. Implementing a ground-mounted photovoltaic system with an installed capacity of 5.4 MW was a part of the King Abdulaziz International Airport Development Project. The project was commissioned in 2013, over an area of 600,000 m2, with an annual production of approximately 9.3 GWh [18,19,20].
At present, residential scale solar PV systems contribute significantly to the total energy share. Developed countries (e.g., Germany) have developed encouraging regulations to expand the use of solar systems in buildings. Germany, having implemented a feed-in-tariff approach in the early 1990s, has established a large base of residential solar PV systems. The feed-in-tariff concept has been applied throughout the world in countries like the UK, the USA, Spain, Italy, and Japan, witnessing rapid expansion in their PV markets [16].
Recently, Saudi Arabia has introduced regulations pertaining to small scale residential grid-connected PV systems for eligible consumers to encounter the issues associated with the high-power consumption peak load demand in the domestic sector. A net metering scheme has been proposed by the Electricity and Cogeneration Regulatory Authority (ECRA) to be implemented to bill the eligible customers who are installing grid-connected PV systems in Saudi Arabia. In the net metering scheme, the excess generation fed to the grid is rolled over to the next month’s bill, effectively reducing the billable kilowatt-hours in that month. Excess generation at the end of December is credited to the December electricity bill at the year-end sell rate, which is equivalent to the utility rate for purchased electricity [21].
The grid-connected solar PV system is designed to operate alongside the utility power grid. However, a techno-economic viability investigation for this system is a substantial process needed to persuade individuals to turn to solar energy. Even though it is theoretically feasible to replace the present fossil fuel electricity infrastructure with renewable energy conversion facilities, such as solar PV systems, financial boundaries remain the essential obstacle to a renewably-powered society [22]. As an off-grid solar PV system is to be incorporated with an energy storage system, battery packs are used for energy storage in territories without power grids. Nevertheless, integrating an energy storage system reflects a higher energy production cost [23]. On the other hand, in grid-connected systems, the grid can be used as storage. A grid-connected PV system feeds the grid when it has extra energy production, and when the housing demand exceeds the produced energy, the shortage will be substituted from the grid [24]. Significant studies have been carried out in order to design and analyze the techno-economic viability of residential-scale and utility-scale grid-connected solar PV systems by employing different simulation tools and carrying out experimental work.
Rehman et al. [25] analyzed the technical, environmental, and economic feasibility of installing a 10 MW power plant at different sites in Saudi Arabia to select the most viable location. This study revealed that Bisha is the most suitable site for installing a 10 MW grid-connected PV (GCPV) system due to its long sunshine hours and high amount of solar irradiance. Thus, this system would eliminate 8182 tons of greenhouse gases every year. Makbul and Ayong [26] presented a performance analysis of a potential PV system located in the western region of Saudi Arabia. This estimate was based on solar irradiance, while a stand-alone system with 85 MW capacity was analyzed. The study in [27] reported a total energy yield of 1 MW over the lifetime of a proposed 42,978.9 MWh grid-connected PV system in the Qassim region, assuming a 1% annual energy yield reduction due to project degradation. The yield factor, capacity factor, and performance ratio were analyzed as technical performance indicators, while the levelized cost of energy and payback period were used as economic performance indicators. In [28], a rooftop PV solar generation was studied. The author examined various design options to define the most feasible design for a rooftop PV system in the city of Majmaah, Riyadh province. The study concluded that the most feasible option from an economic point of view in Riyadh is a grid-connected system without battery storage. In [29], Okello et al. carried out a comparative study between the real measurements and simulated performance of a 3.2 kWp GCPVS located at Nelson Mandela Metropolitan University, South Africa. The system supplies 5757 kWh to the local distribution network. The resulting performance ratio was found to be 84%, which is higher than the ratios of 74%, 81.5%, 67.4%, 70%, and 64.5% reported in Khatkar-Kalan (India) [30], Dublin (Ireland) [31], Crete (Greece) [32], Karnataka (India) [33], and Malaga (Spain) [34], respectively. Pietruszko [35] presented a 1 kWp rooftop-mounted GCPVS located in Warsaw, Poland. The annual energy production was 830 kWh, exceeding the simulation results. The performance ratio and efficiency were found to be between 60% and 80% and 4% and 5%, respectively. Milosavljević et al. [36] presented a performance analysis study of a 2 kW GCPVS mounted on the roof of the building for the Faculty of Sciences and Mathematics in Niš, Serbia. Weather data were taken from 1 January 2013 to 1 January 2014. The performance ratio annual mean value and annual capacity factor with transmission integration were found to be 93.6% and 12.88%, respectively. The authors concluded that the connection of this system to the network is viable. El-Shimy [37] investigated the economic and environmental feasibility of, and the most advisable site in which to install, a 10 MW GCPVS in Egypt. The author acquired metrological data for 29 studied sites in Egypt from the NASA renewable energy resource website. The results showed that the system installed at the Site of The Oasis of Kharaa was the most efficient in terms of productivity, greenhouse gas emissions, and economic profit.
Although most researchers focus on utility-scale grid-connected systems, some research endeavors, some research endeavors were dedicated to investigating residential systems. In [38], Elieser et al. conducted a study to assess the technical, economic, and environmental aspects of a residential grid-connected PV system for the supply of household electricity load demand in Surabaya, Indonesia. The results showed that a 1 kW system can meet the basic electricity demand of a household in Surabaya. The authors in [39] studied the technical options, operation, and economic assessment of a grid-connected PV system installed in a residential building in Kastoria, Greece. The study concluded that the successful and efficient collaboration between solar system industries, investors, and utilities can be achieved only after a long introduction period and intensive cooperation.
Since residential, grid-connected PV systems are interconnected with the distribution grid, positive and negative impacts on the distribution network are associated with this interconnection. Shalwala [40] studied the impact of residential GCPV systems on the distribution network in Saudi Arabia. The outcomes revealed that, even under a wide penetration range of residential GCPV systems, a slight controllable voltage rise occurs in the distribution network. Shalwala [41] presented the role of residential GCPV systems in peak load demand reduction. Shalwala’s findings emphasize the ability of such systems to relieve the distribution network and provide an almost constant load profile.
The literature review affords a solid background for this research by presenting numerous techno-economic case studies carried out in Saudi Arabia and worldwide. However, most of the previous studies focused on only a few performance indicators. This paper involves an economic and technical feasibility study on installing a grid-connected PV system in a typical residential unit in Jeddah, Saudi Arabia. The main objective of this investigation is to assess the techno-economic feasibility via a wide range of performance indices. These indicators include energy yield, yield factor, capacity factor, and performance ratio as technical indicators, while economic indicators involve the levelized cost of energy, net present value, internal rate of return, and payback period. This study covers tilt angle optimization, which is one of the most significant factors that determines the productivity of a solar PV system and is rarely discussed in techno-economic studies. A sensitivity analysis was also conducted to optimize the PV system configuration and determine the response of the performance indicators to input variation.
The following section presents the methodology and data used in this case study. Section 3 analyzes the measured performance results and the effects of input variability on both technical and economic indicators. Finally, Section 4 concludes the findings of the investigation.

2. Materials and Methods

The main contribution of this techno-economic feasibility study is to provide foundational knowledge for the viability of residential grid-connected PV (GCPV) system utilization. The investigation was performed using the system advisor model (SAM) software [42] while considering different techno-economic indicators. These indicators benchmark system performance at a specific location against the system’s performance under hypothetical operational standards.
In this section, the methods, tools, and assumptions used to perform the techno-economic investigations are outlined. First, the proposed system is described, and the data pertaining to this investigation are presented. Secondly, the performance indicators used to evaluate the system performance are explained. As the system operates under several economic parameters of uncertainty, this study includes a sensitivity analysis to investigate the impact of input variable variation on economic feasibility, as well as technical performance.

2.1. System Description

According to the 2018 annual report of the General Authority for Statistics in Saudi Arabia and related studies, apartments constitute 64% of the dwellings in Mecca province, where Jeddah city is located [43,44]. The residential building identified for this investigation represents a typical dwelling type in the western region of Saudi Arabia, the city of Jeddah (21.4858° N, 39.1925° E). The building consists of two floors. On each floor, there are two apartments, one of which is 170 m2, comprises three rooms, and is occupied by four persons. The building has a 400 m2 flat rooftop area for PV installation, and 60% of the area is utilizable. The assessments carried out in this study are based on the data highlighted in the following subsections.

2.1.1. Load Demand

The monthly energy consumption for one apartment obtained from actual utility bills is shown in Table 1. In the summer season from May to August, energy consumption appears to be relatively high due to the extensive use of air conditioners. The annual average consumption is 160 kWh/m2/year, which is reasonable when compared to the 116 kWh/m2/year, 202 kWh/m2/year, 176.5 kWh/m2/year, and 141.69 kWh/m2/year reported in [45,46,47,48]. The system advisor model uses the monthly total electricity consumption to estimate the monthly and annual load profiles shown in Figure 2. This load profile is very similar to the load pattern in Saudi Arabia reported in [49].

2.1.2. System Size

The major factors to be considered during PV system sizing include the average monthly energy consumption and peak sun hours. The system size approximation is calculated as follows:
i.
Determine the average daily energy consumption.
ii.
Find the location’s peak sun hours.
iii.
Divide the average daily energy consumption by the peak sun hours.
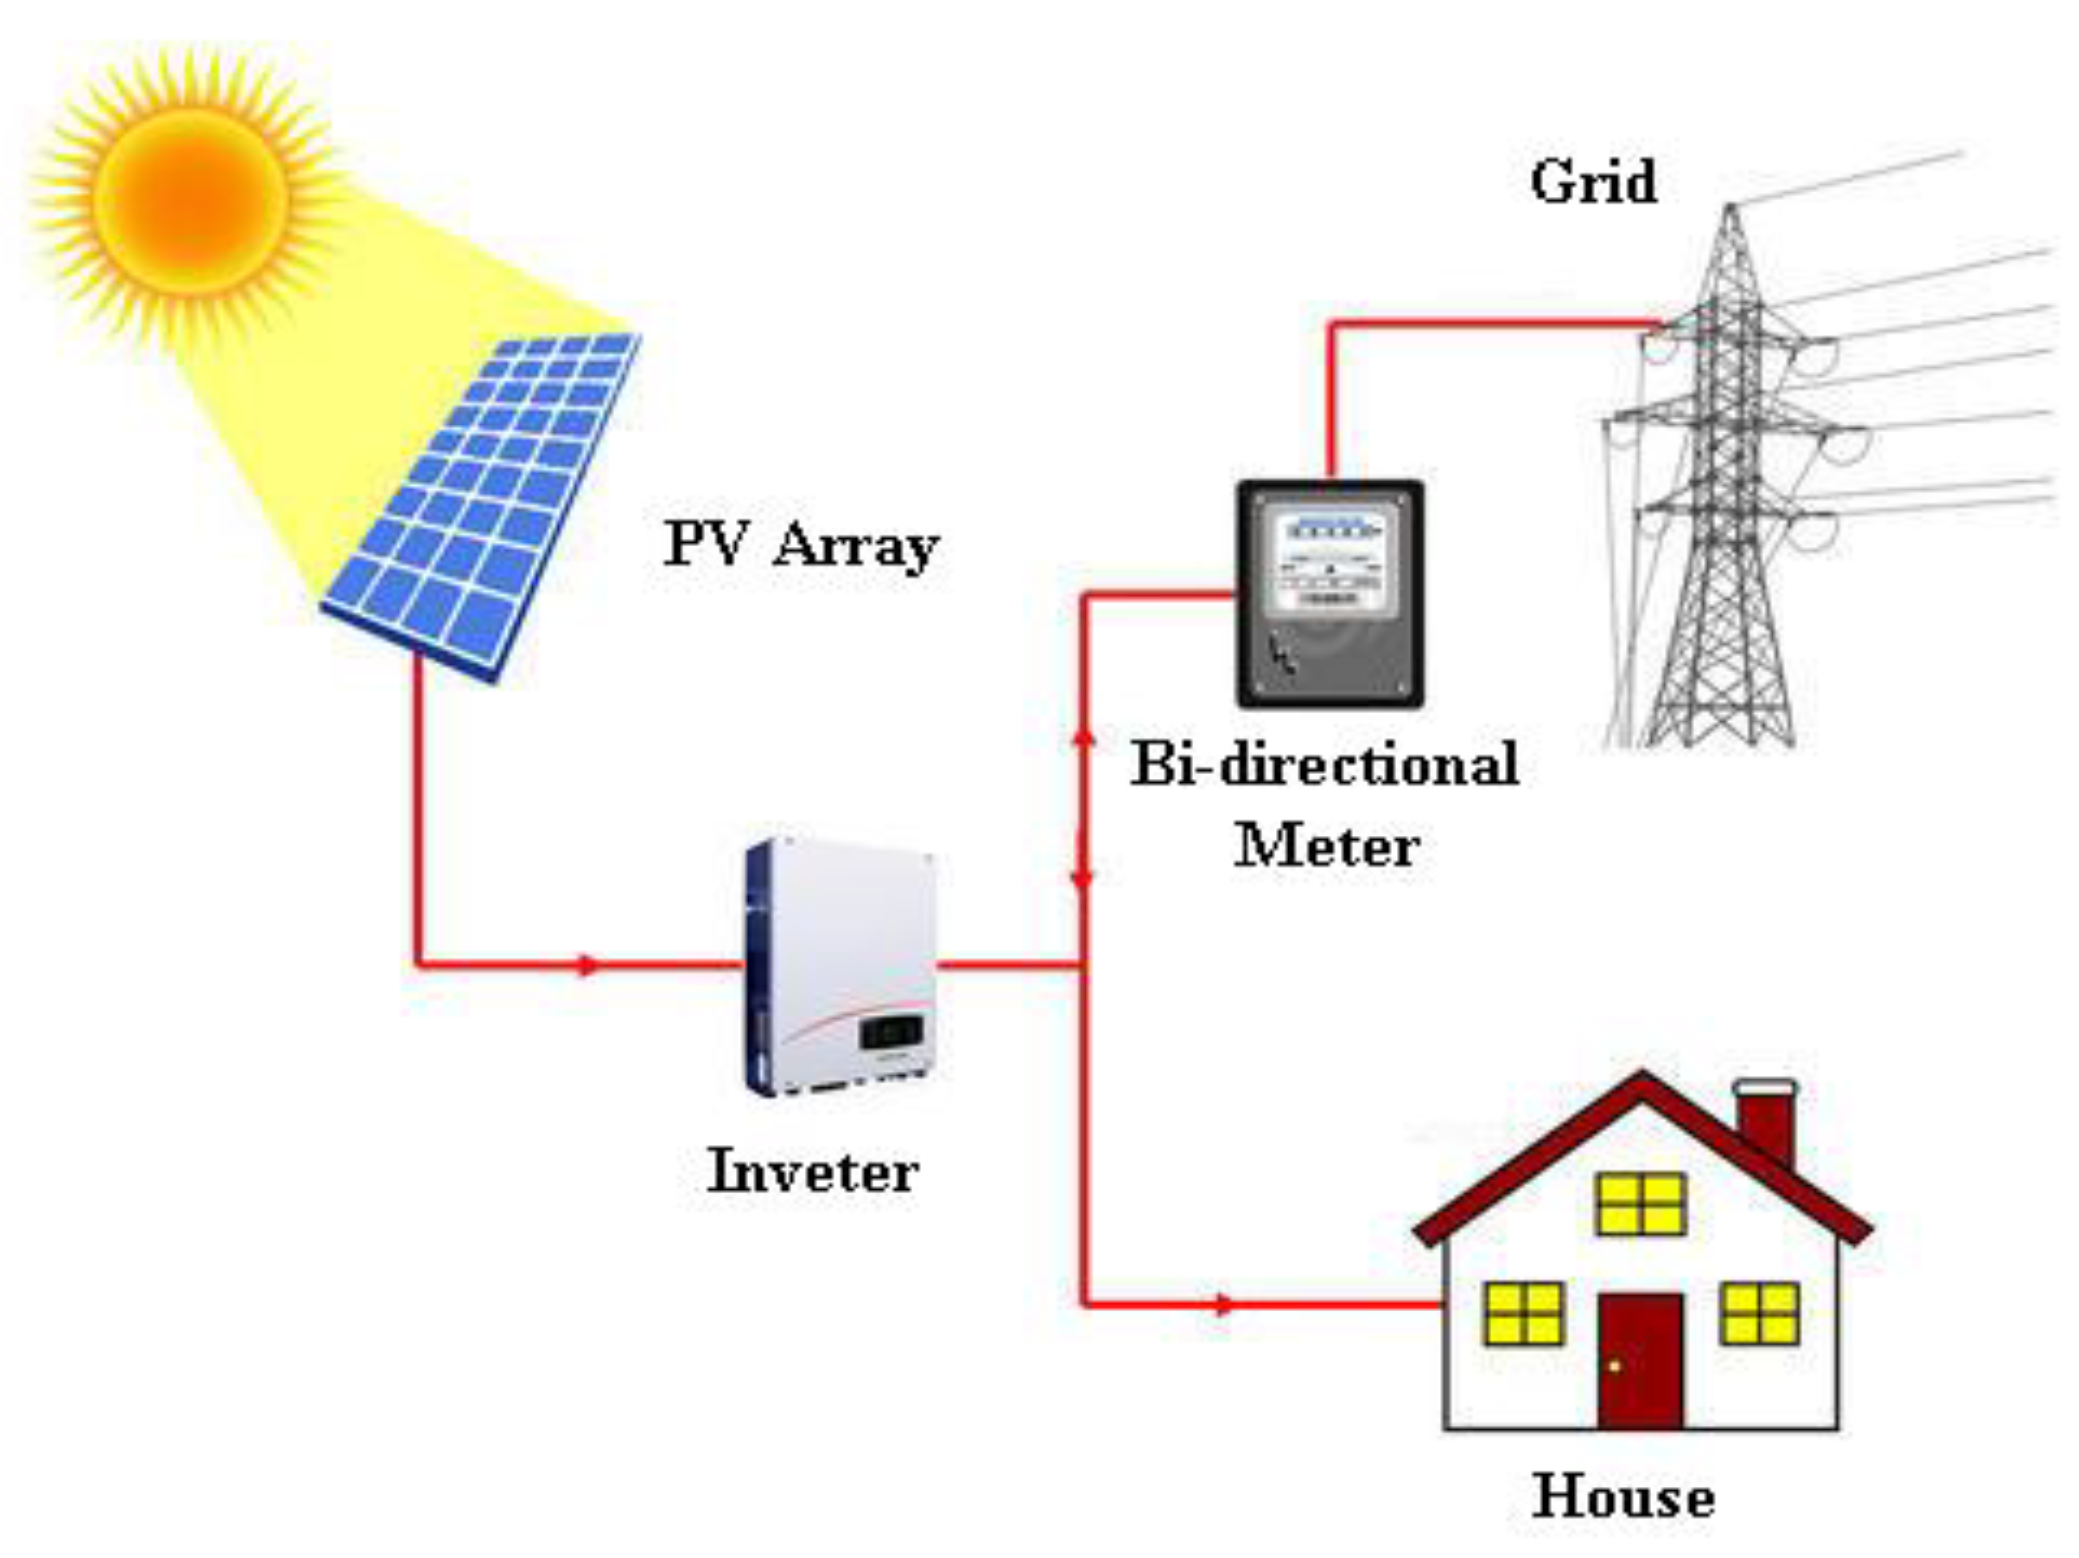
The proposed PV system is a residential grid-connected system (Figure 3 shows a typical residential grid-connected PV system). The proposed system size is estimated to be 12.25 kWp, consisting of 35 mono-crystalline silicon modules, with a nominal power rating of 350 Wp for each, at 21.49% efficiency and a 57 m2 total module area. In addition, two inverters are used in this study with 10 kW of maximum AC power. The system configuration is five modules per string and seven parallel strings, with a DC to AC ratio of 1.22. The lifetime of the PV modules is set at 25 years with a 0.5% degradation factor per year, while the inverter’s lifetime is set at 15 years, as stated in the manufacturer datasheets. The PV module and inverter data are presented in Table 2.

2.1.3. Economic Parameters and System Costs

The economic feasibility of residential grid-connected PV systems relies on the project’s capital cost, operation and maintenance cost, and running cost. The technology and installation costs were estimated based on the International Renewable Energy Agency (IRENA) costs database [50] and validated by quotations collected from Saudi Arabian markets. The total capital investment cost is approximately $10,529.46. Unlike rotary power conversion technologies, a PV system has no tangible operational cost, though minimal maintenance costs are required for sweeping the dust accumulated on the PV module’s surface. The operation and maintenance (O&M) cost is estimated to be $16 /kW/year. Considering the inverter’s lifetime, $1346.79 is set as the inverter’s replacement cost at year 15. Further, financial parameters, such as the interest and inflation rates in Saudi Arabia, were acquired from the Saudi Arabian Monetary Authority (SAMA) [51] and the King Abdullah Petroleum Studies and Research Center (KAPSARC) [52] data portal websites. In this study, the percentage of the net capital cost to be borrowed (deposit fraction) is specified as 100%, with a five-year loan term and a 2.5% interest rate. Table 3 shows the model costs and main financial input parameters.
The residential sector electricity tariff in Saudi Arabia is divided into two segments, as shown in Table 4. This rate structure for electricity utility companies has been adopted by the Saudi Electricity Company (SEC) and was implemented at the beginning of 2018; this cost is unified throughout the country [53].
There are several methods for billing the system owners for electricity injected into the utility grid. A net metering scheme has been proposed by the Electricity and Cogeneration Regulatory Authority (ECRA) to be implemented to bill eligible customers who are installing grid-connected PV systems in Saudi Arabia. In a net metering scheme, the excess generation fed to the grid is rolled over to the next month’s bill, effectively reducing the billable kilowatt-hours in that month. Excess generation at the end of December is credited to the December electricity bill at the year-end sell rate, which is equivalent to the utility rate for purchased electricity [21]. In this study, the time-of-use energy rate is applied to investigate its impacts on economic feasibility. Time-of-use energy rates are rates that vary with the time of day or month of the year, or both, as defined in the weekday and weekend schedules. This is an effective mechanism to reduce the electricity peak demand during peak load hours by applying higher electricity rates [54]. However, the proposed rate structure relies on time-of-use rather than energy consumption, as shown in Table 5.

2.1.4. Solar Resource

Solar irradiance and ambient temperature are crucial factors that influence a PV system’s output. Thus, the daily average solar radiation and daily average ambient temperature are the key inputs to estimate the system’s size and output. The PV module’s output power is [55]
P PV = Y PV f PV ( G T G T , STC ) [ 1 α P ( T C T C , STC ) ]
where YPV is the PV power output under standard test conditions (kW), fPV is the PV module de-rating factor (%), GT refers to the Solar radiation incident on the PV module (kW/m2), GT,STC represents the incident radiations at STC (1 kW/m2), αP indicates the temperature coefficient of power (%/°C), TC refers to PV cell temperature in the current time step (°C), and TC,STC is PV cell temperature at STC (°C).
The location and resource window in the modeling software enables the user access to diverse solar resource libraries. For the locations that are not included in the software library, a system advisor model allows the user to download data files from the National Solar Radiation Database (NSRDB) or to upload any available climatic data in a comma-separated values (CSV) format for solar resource data. SAM can also read solar resource data from files in the typical meteorological year (TMY3), (TMY2), and EnergyPlus Weather (EPW) formats.
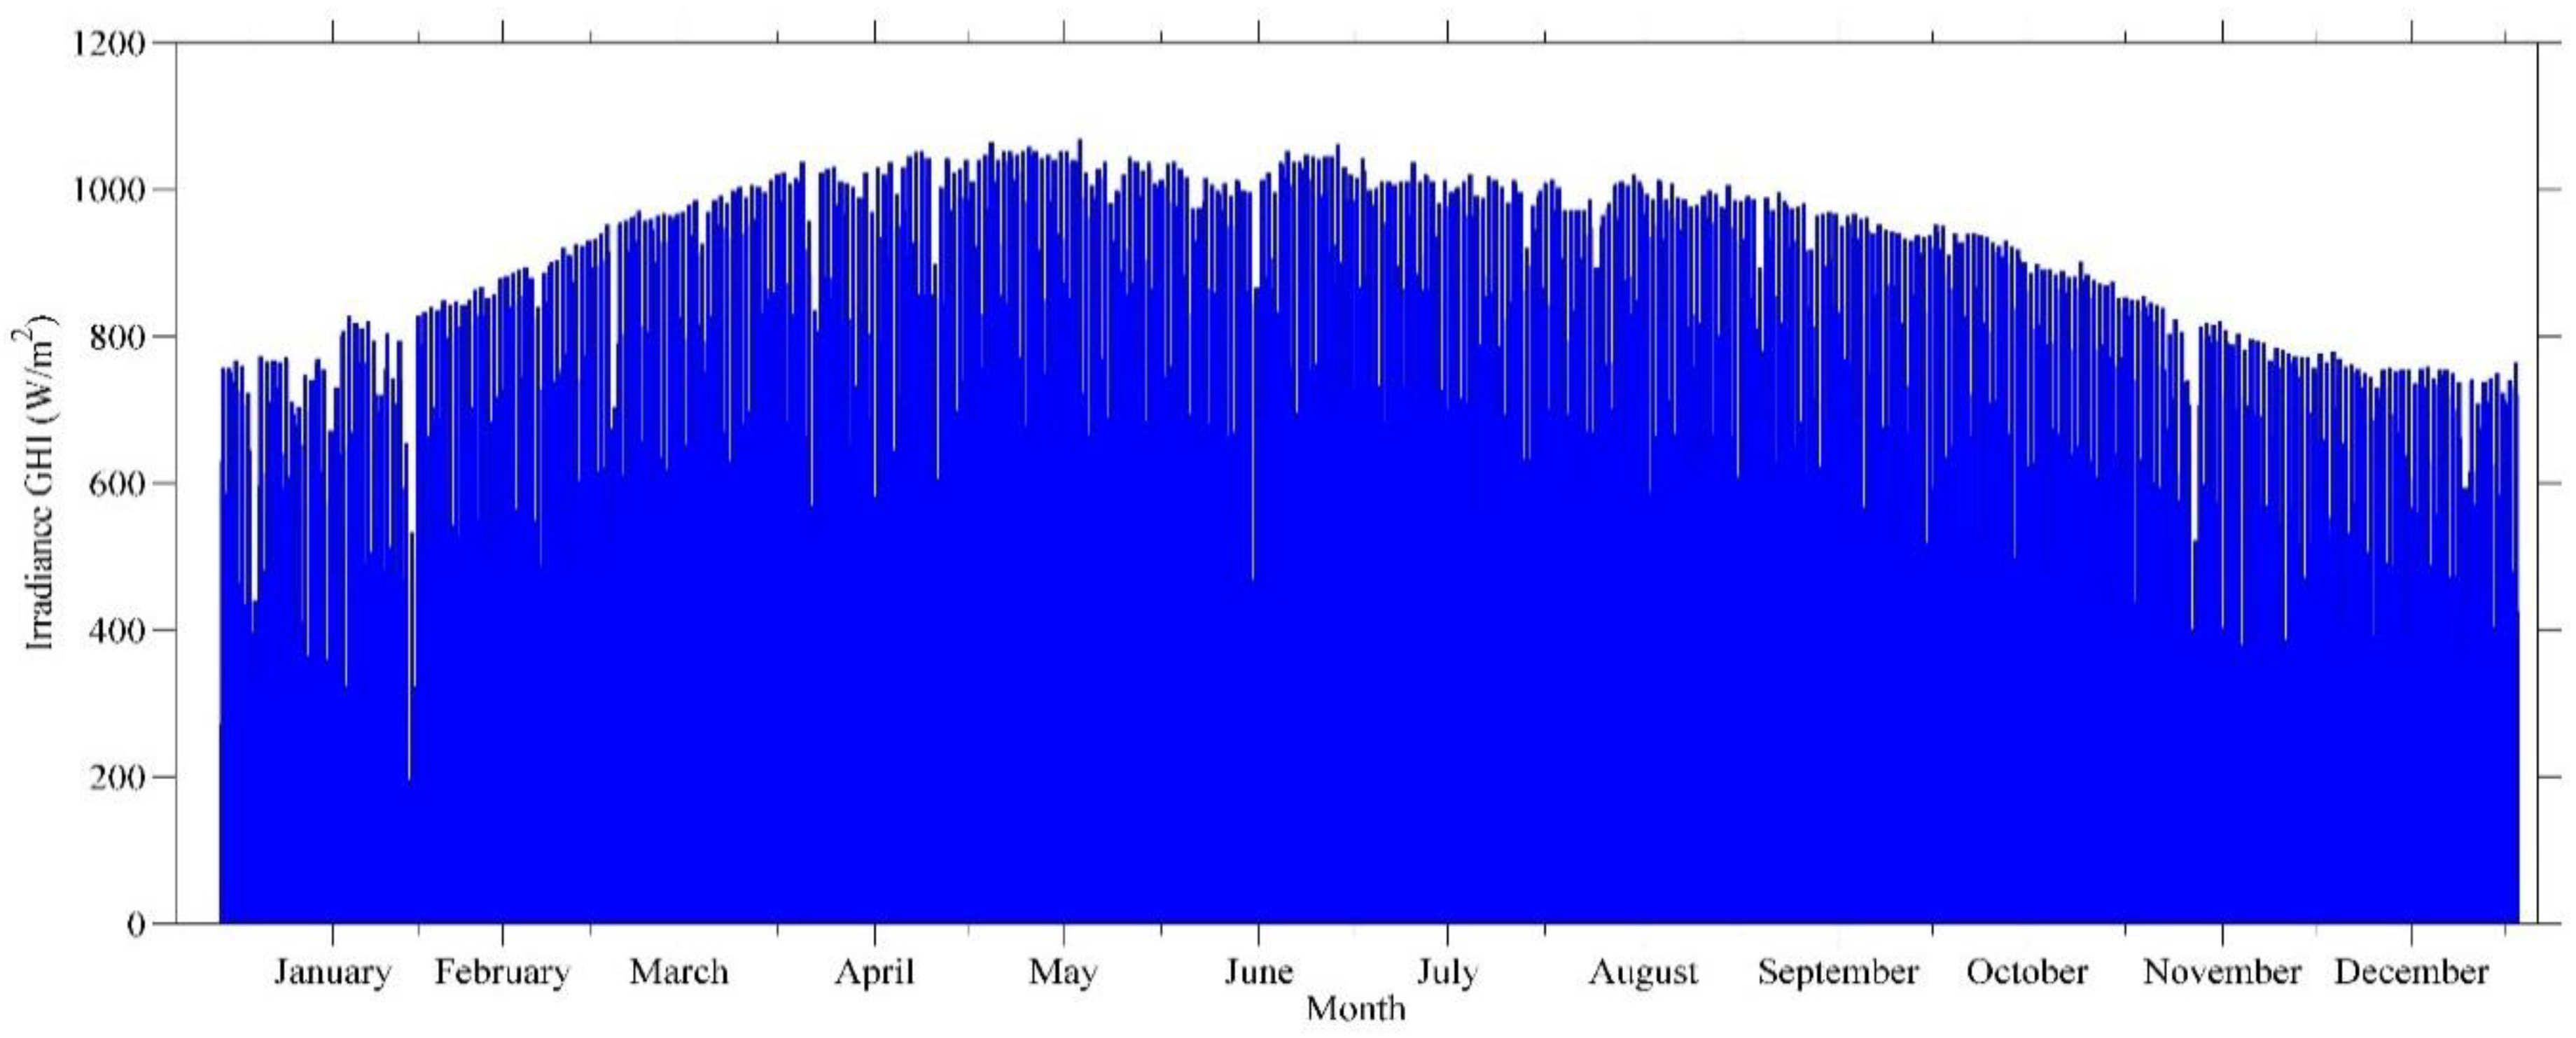
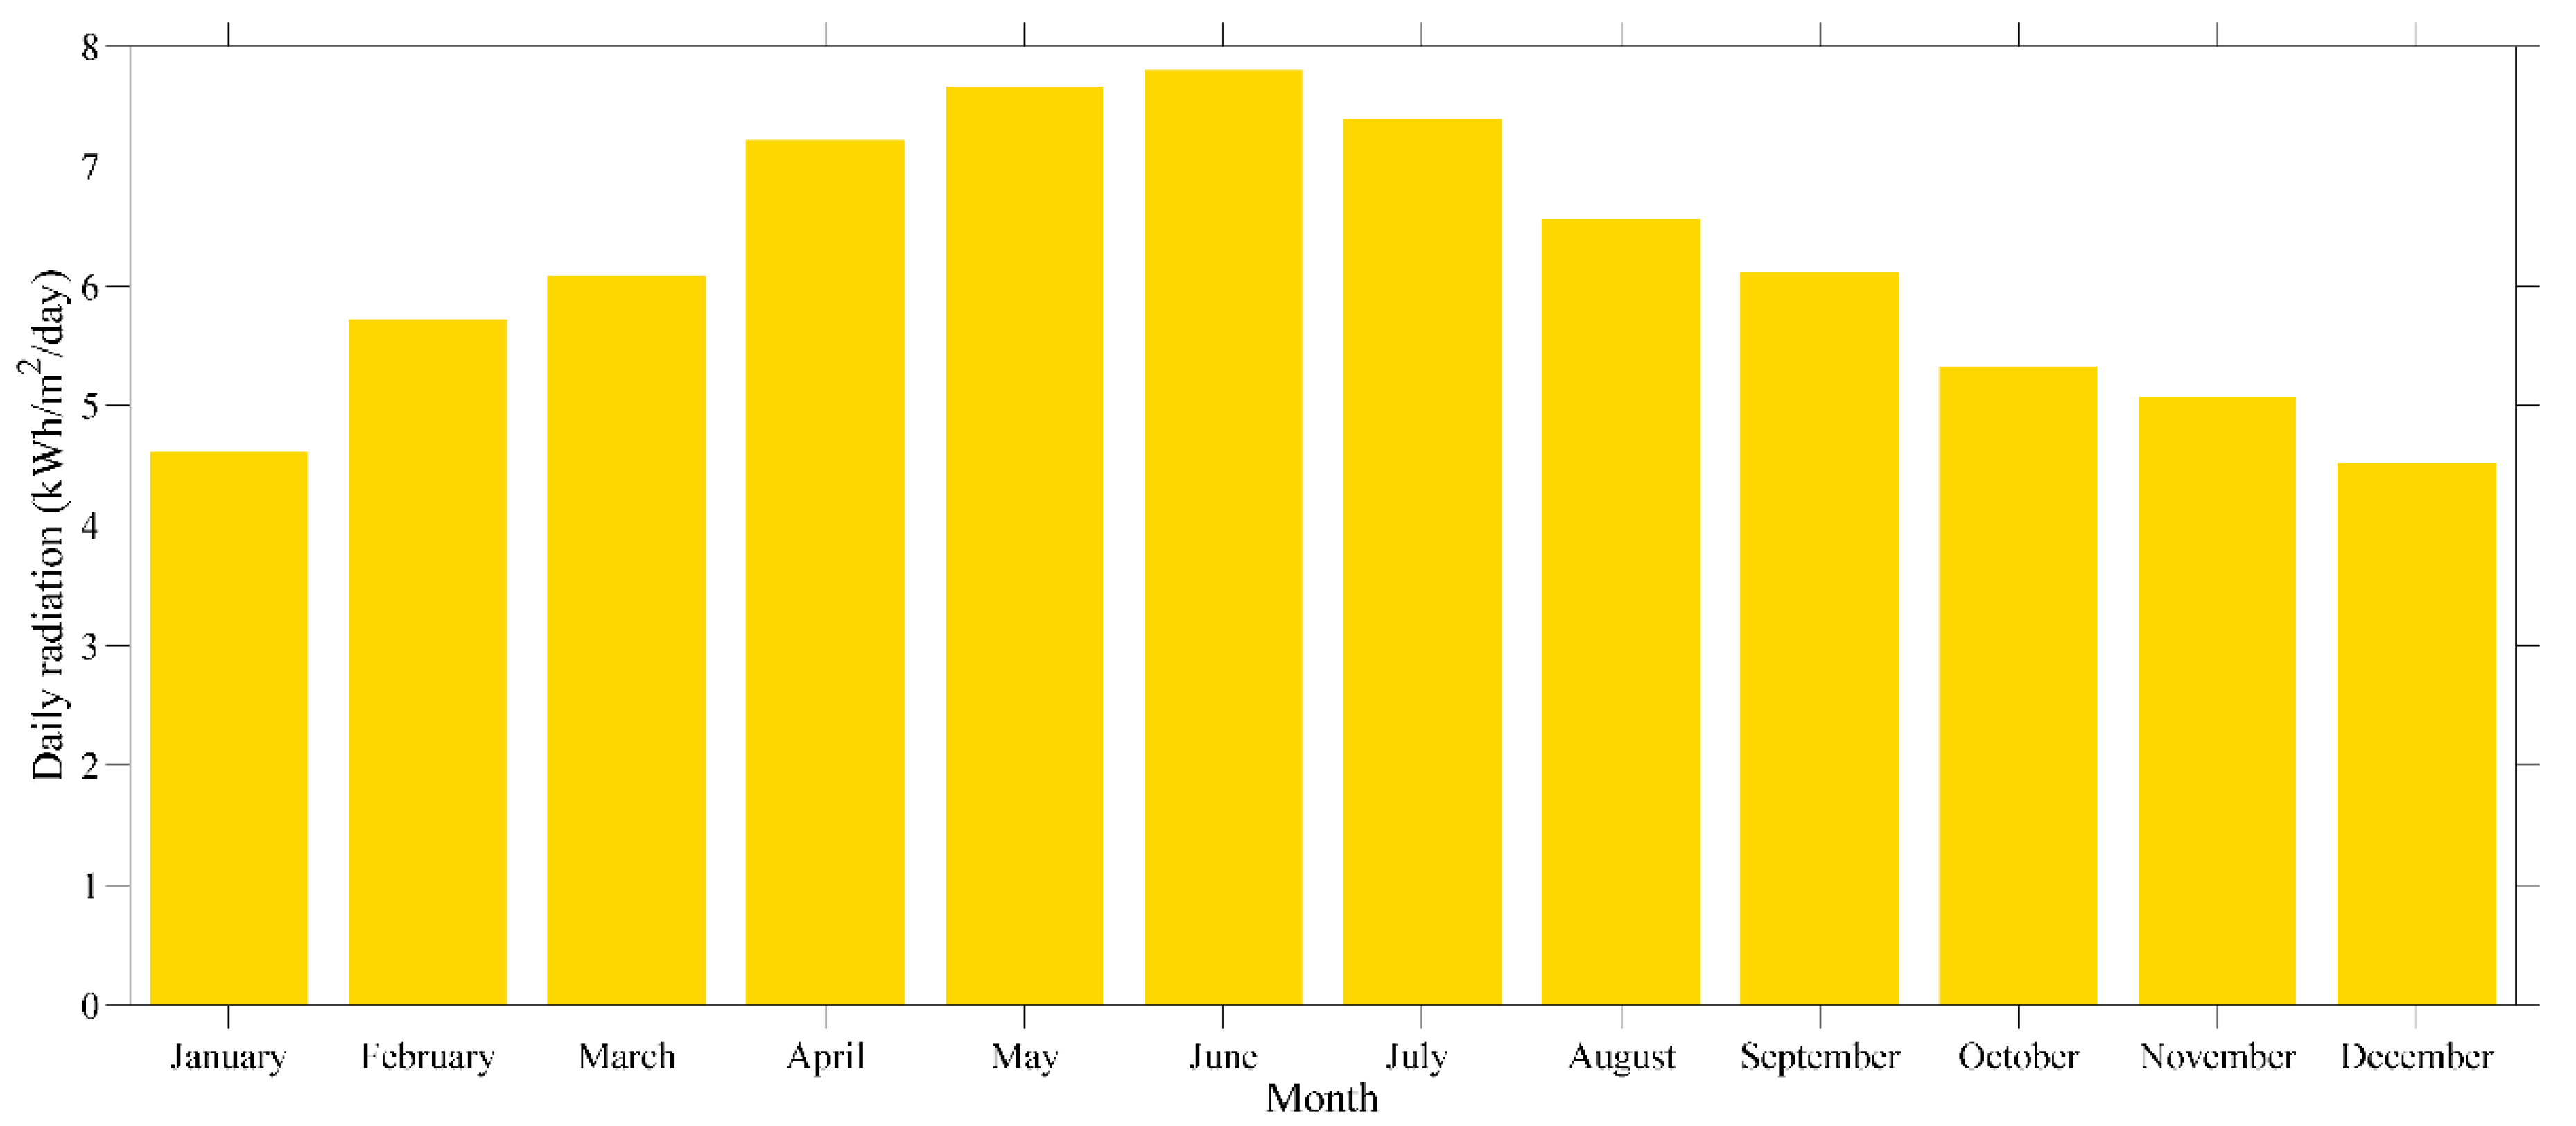
The weather data used in this study are the average data taken between 2003 and 2017 from King Abdulaziz International Airport Metrology Station (Station ID: 410240) and was retrieved from the European Commission Joint Research Centre database website. Jeddah has high solar radiation potential, ranging between 4.5 and 7.9 kWh/m2/day, with annual averaged daily global solar radiation of 6.35 kWh/m2/day on a horizontal surface. Based on the data obtained, the Global Horizontal Irradiance (GHI), ambient temperature time series data, and the monthly averaged daily global solar radiation are presented in Figure 4, Figure 5 and Figure 6 respectively [56].

2.2. Tilt Angle

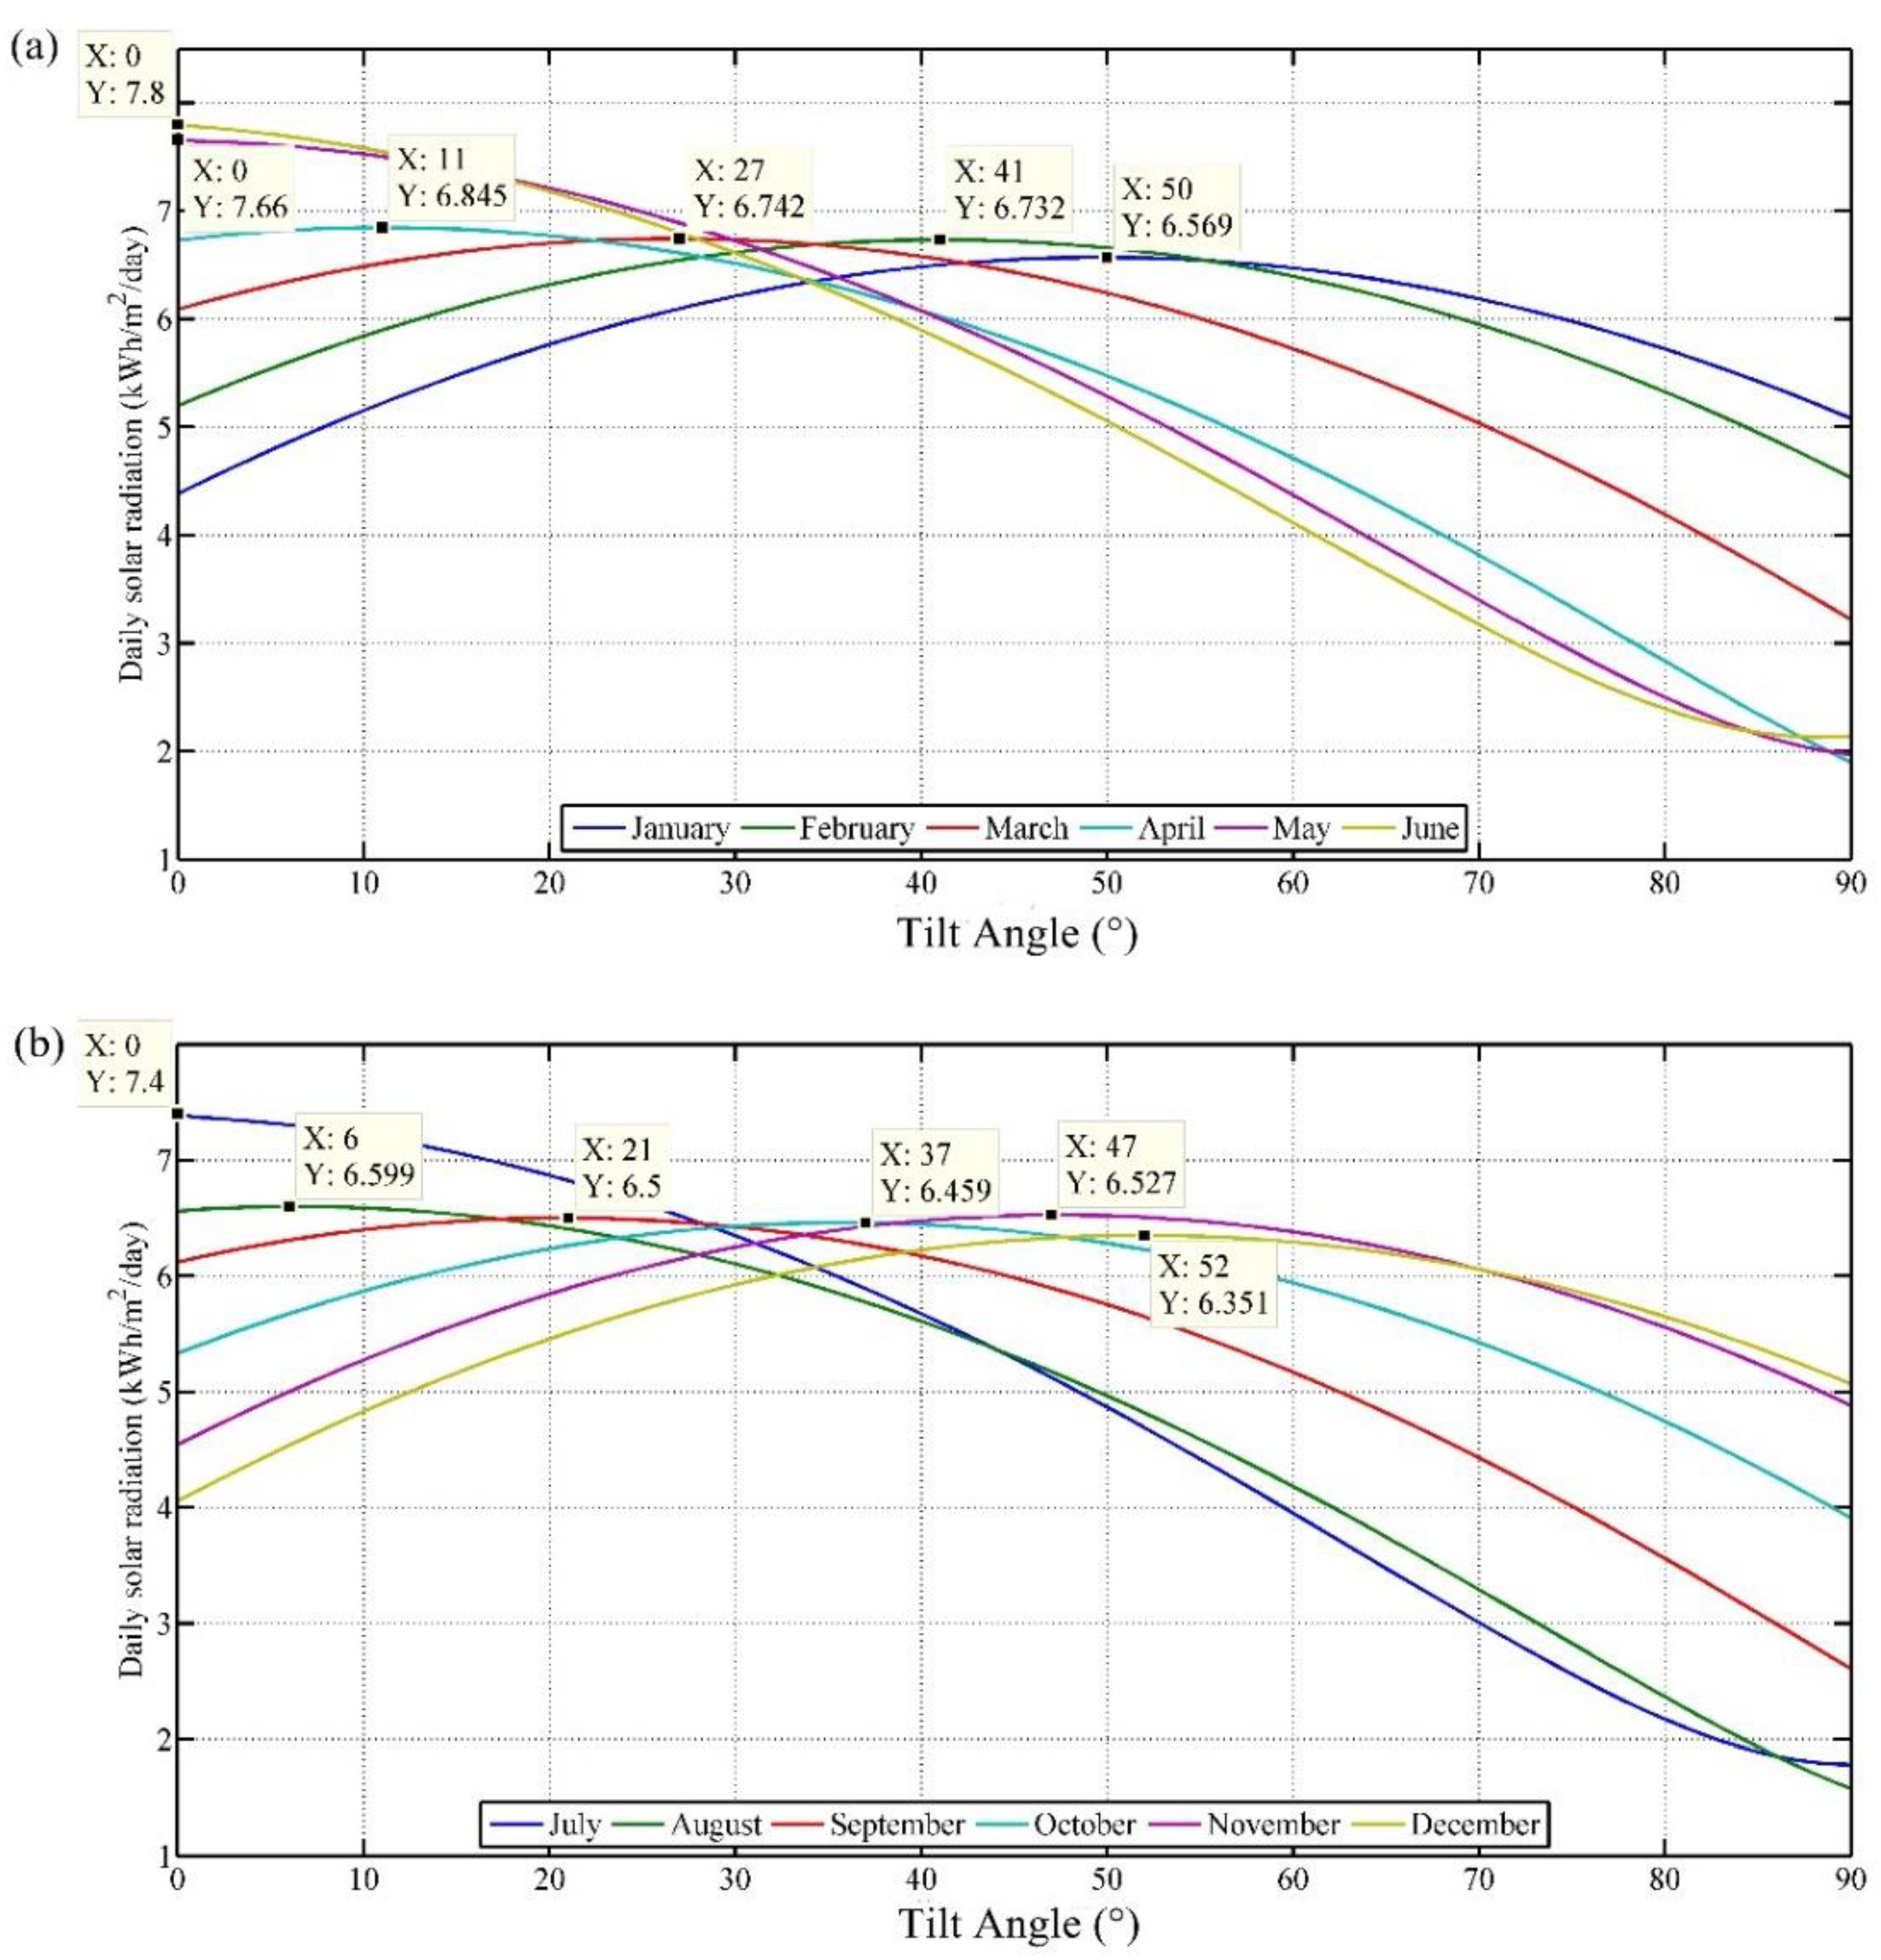
There are different ways to mount PV modules on a rooftop, including flat horizontal with zero inclination, tilted PV modules, and sun-tracking PV modules [57]. SAM parametric simulation allows the user to assign one or more input variables to one or more output variables in order to investigate the dependence of the outputs on the inputs. Parametric simulations are also helpful in optimizing the values of the input variables, for example, by creating a graph of the annual energy production or the solar incidence on a PV array versus the array tilt and azimuth to optimize the array orientation. In this study, the tilt angle varies between 0° and 90°, with a 1° increment step to detect the monthly and annual optimum tilt angles at which one square meter of the solar module gathers the maximum amount of solar radiation.

2.3. Technical Metrics Modeling

With the antecedent technical performance indicators, the entire technical performance of the grid-connected PV system can be assessed. These indicators can also be used to compare the system’s performance with that of any other system with similar installations, regardless of their location and installed capacity. The mathematical expressions used for the performance indices examined in this study are shown in the following subsections.

2.3.1. Yield Factor (YF)

Yield factor is the total energy produced by a PV system over one month or year. Because of the various module efficiencies and array designs, the yield factor is used to measure the system’s productivity. Yield factor is measured in kWh/kWp, by dividing the energy yield by the PV array’s nominal power (PSTC) [27].
YF = E Grid ( kWh / year ) PV Array ( kW Peak )
where YF is the yield factor, EGrid is the system’s energy yield, and PVArray is the PV array’s nominal power (PSTC).

2.3.2. Capacity Factor (CF)

Capacity factor is the ratio of the actual annual energy yield of a PV array to the energy it would produce when operating at full capacity over one year. Capacity factor estimates the percentage of the PV array that is usable, and the most ideal CF is 50% because of the daily sun availability (almost 12 h at maximum) [27].
CF = E Grid ( kWh year ) 8760 PV Array ( kW Peak ) = YF 8760 .

2.3.3. Performance Ratio (PR)

Performance ratio is a metric that defines the quality of a PV system regardless of its location and size. Specifically, PR is the ratio of the actual energy output of a PV system to the theoretical standard test condition output for a given reporting period. The performance ratio is independent of radiation conditions, and thus independent of the specific site and even module orientations. The performance ratio can therefore be used to compare different PV system designs, similar system designs but installed at another location, or for the same system over a specific period. However, there is a strong temperature dependence of the PR, which implies that in hot climates, performance ratio will be lower as compared with cold climates [58,59].
PR = YF G STC G t
where GSTC is amount of irradiance at STC and ΣGt is the accumulative irradiance on the PV array plane within a certain period (annual, monthly, or daily).

2.4. Economic Metrics Modeling

Feasibility analyses and evaluations of various energy system projects are critical to determining energy management policies for any country. A feasibility study contributes to the optimum allocation of energy resources at the national level and is a practical way to help capital owners make the right decisions. The financial model of the software calculates the cash inflow and outflow of the project during its operational lifetime. Cash flow includes the value equivalent to the generated electricity, incentives, project capital cost, operation and maintenance costs, taxes, and debt. The model also calculates the net present value of the after-tax cash flow and the payback period, which addresses the timeframe required for the total after-tax cash flow to cover the initial capital cost of the project.
The following economic feasibility indices are measured in this study.

2.4.1. Levelized Cost of Energy (LCOE)

Levelized cost of energy (LCOE) estimates the price of per unit energy ($/kWh) over the project’s lifetime. LCOE is used to compare the kWh cost of different power system technologies. LCOE is estimated by dividing the lifecycle cost of the project by the expected energy output [60].
LCOE = LCC E Grid
where LCC is the lifecycle cost and EGrid is the system energy yield. The lifecycle cost includes the initial capital cost, operation, and maintenance cost, as well as the replacement cost minus the salvage value, which is the project value at the system’s end of life.
LCC = C capital + C O & M + C replacement C salvage
where Ccapital is the capital cost, CO&M is the operation and maintenance cost, Creplacement is the replacement cost, and Csalvage is the salvage value or the project value at end of life.

2.4.2. Net Present Value (NPV)

The net present value refers to the difference between today’s value of cash inflow and the cash outflow over a project or business’s lifetime. NPV is measured, as in Equation (7) [61], during a project’s planning phase to analyze its profitability.
NPV = t = 0 N Revenue t Cost t ( 1 + d ) t
where N is the number of years of the economic analysis, t is the year variable in each summation, d refers to the discount rate, Revenuet is the PV system revenue in year t, and Costt represents the system cost in year t.

2.4.3. Internal Rate of Return (IRR)

The internal rate of return refers to the discount rate value at which the net present value of the cash flow of a particular investment is zero. This rate is measured to investigate the profitability of a potential investment. The internal rate of return is given by [61].
IRR : NPV = t = 0 N Revenue t Cost t ( 1 + d ) t = 0

2.4.4. Payback Period (PbP)

Payback period refers to the time needed for an investment to offset the amount invested in terms of profits or net cash flow. The payback period can be divided into a simple payback period and a discounted payback period. A simple payback period pertains to the period at which the revenue is equal to the investment cost, while a discounted payback period takes into consideration the time value of money. The simple payback period for residential PV systems is given by [61]:
Simple   Payback   period = PV   Price     Federal   ITC Annual   PV   Revenue     O   &   M

3. Results and Discussion

The technical performance and economic effectiveness of a GCPV system in a typical dwelling unit in Jeddah, Saudi Arabia is discussed in this section. A sensitivity analysis is carried out to determine the options that attain investor satisfaction.

3.1. Technical Analysis

3.1.1. Tilt Angle Optimization

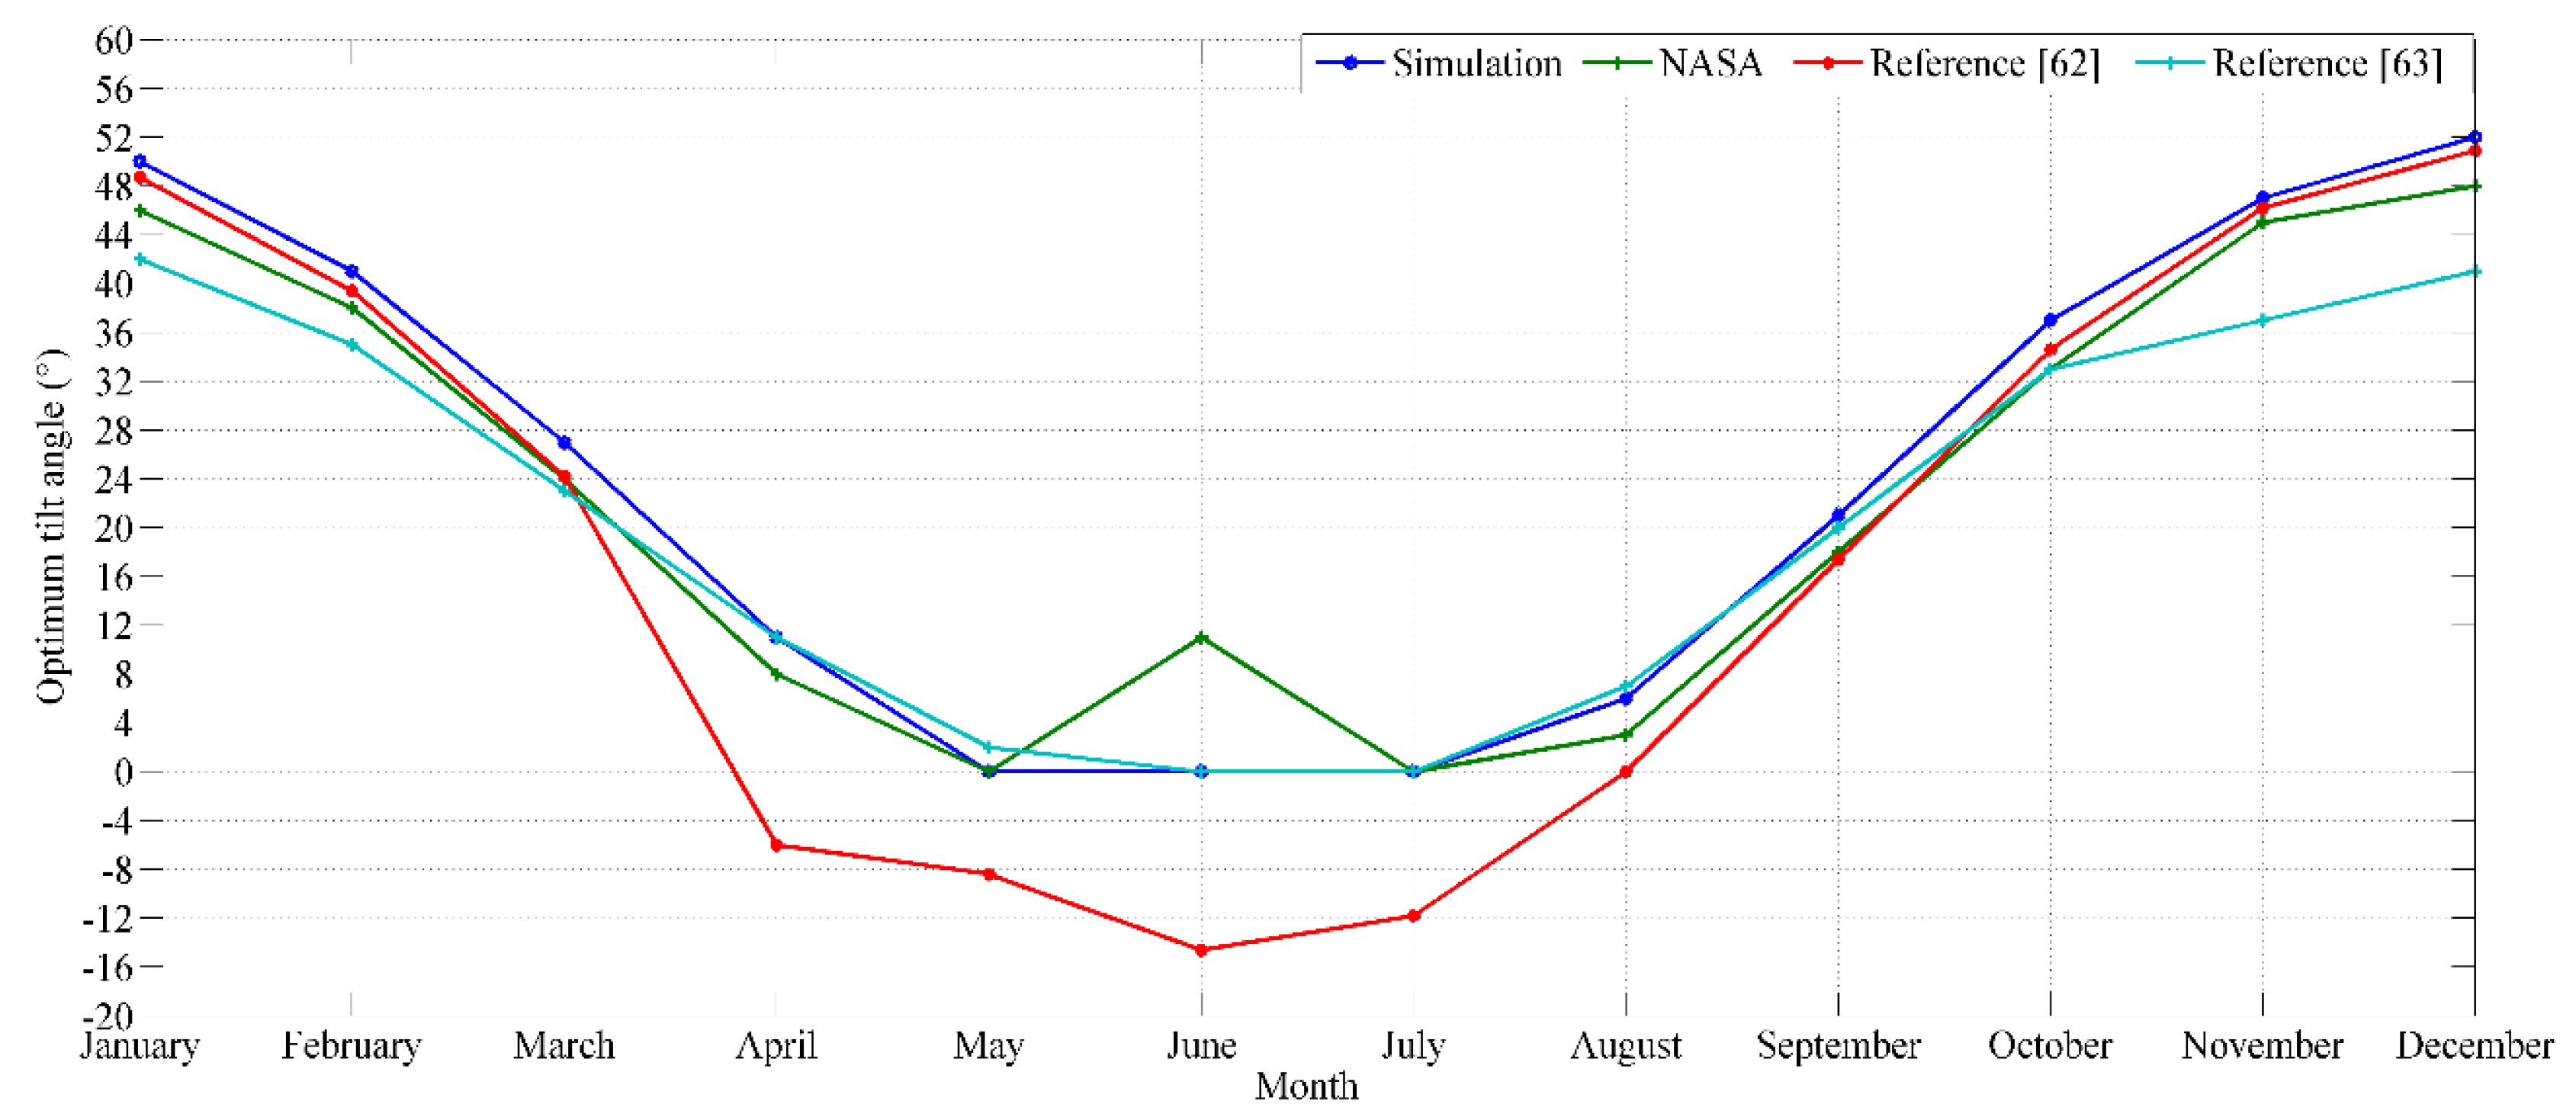
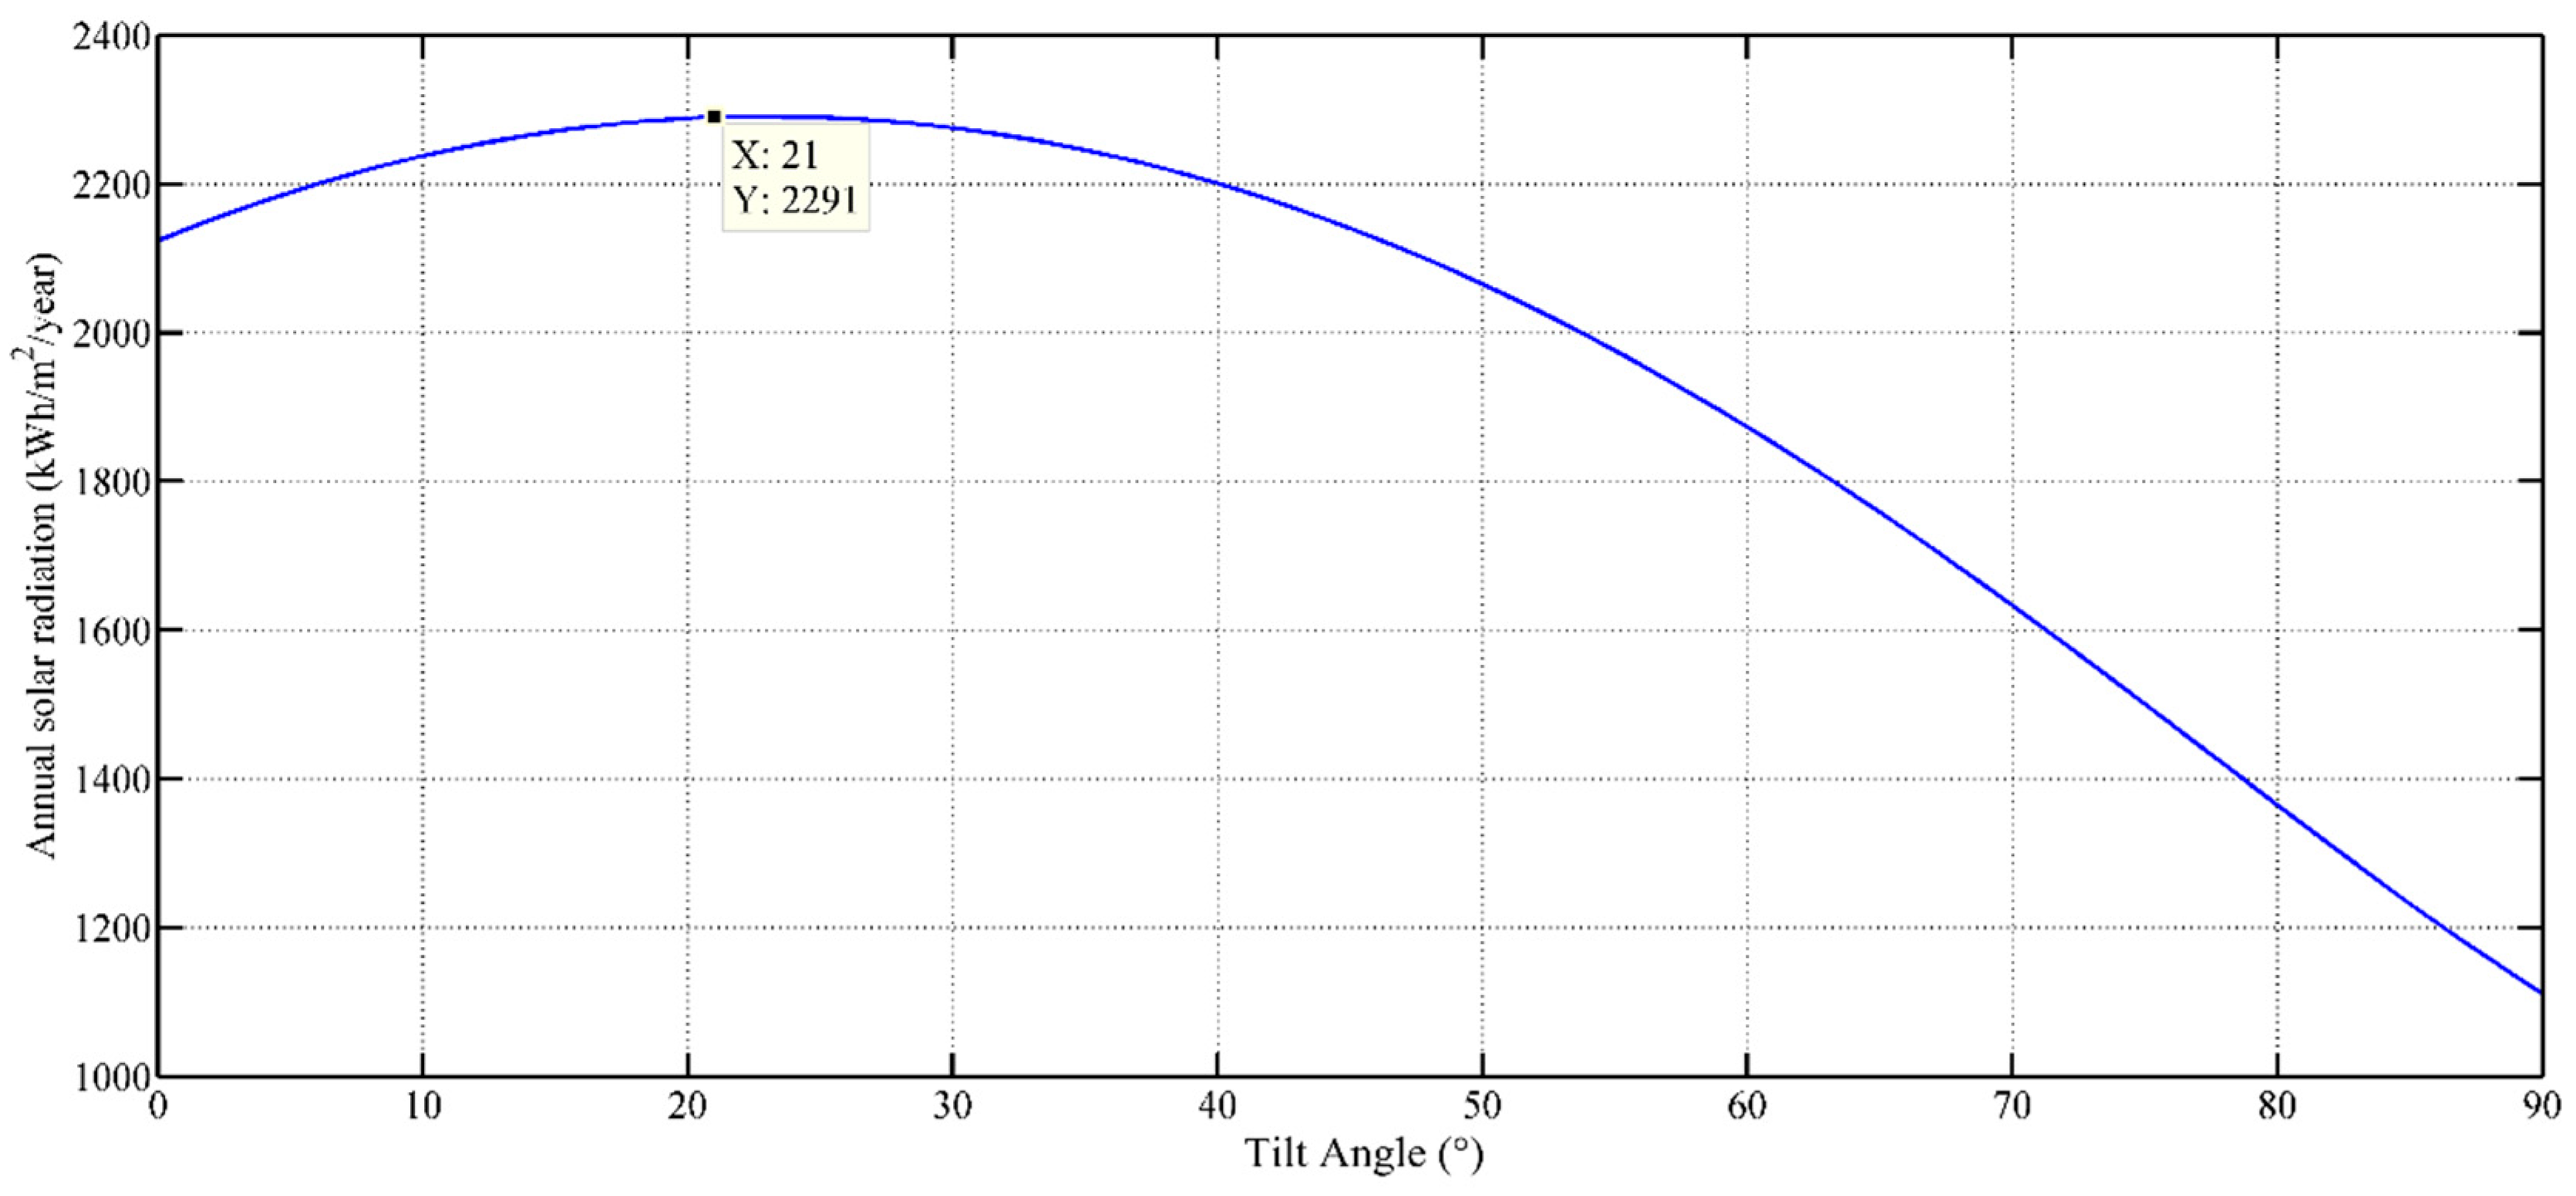
Tilt angle is one of the major factors that influences the PV module’s productivity. Based on an analysis of the average daily sum of GHI, the annual optimum tilt angle is determined and adopted in this study. Figure 7a,b presents the monthly optimum tilt angle from January to June and from July to December, respectively. Although the optimum tilt angle for each month is determined, solar radiation varies throughout the year because of the variation in sunray declination angle. It can be observed that the maximum solar radiation striking the PV modules occurs in the summer season (May to July) due to the sun’s path, which is orthogonal to the Earth’s surface during the summer season, and because of zero tilt angles, which reduce the PV modules’ self-shading. The obtained tilt angles are compared with the NASA data and the results of Kaddoura, reported in [62], as well as the findings of [63], as shown in Figure 8. Finally, the annual optimum tilt angle shown in Figure 9 is found to be 21°, which is close to Jeddah’s latitude (21.4858° N).

3.1.2. Energy Production

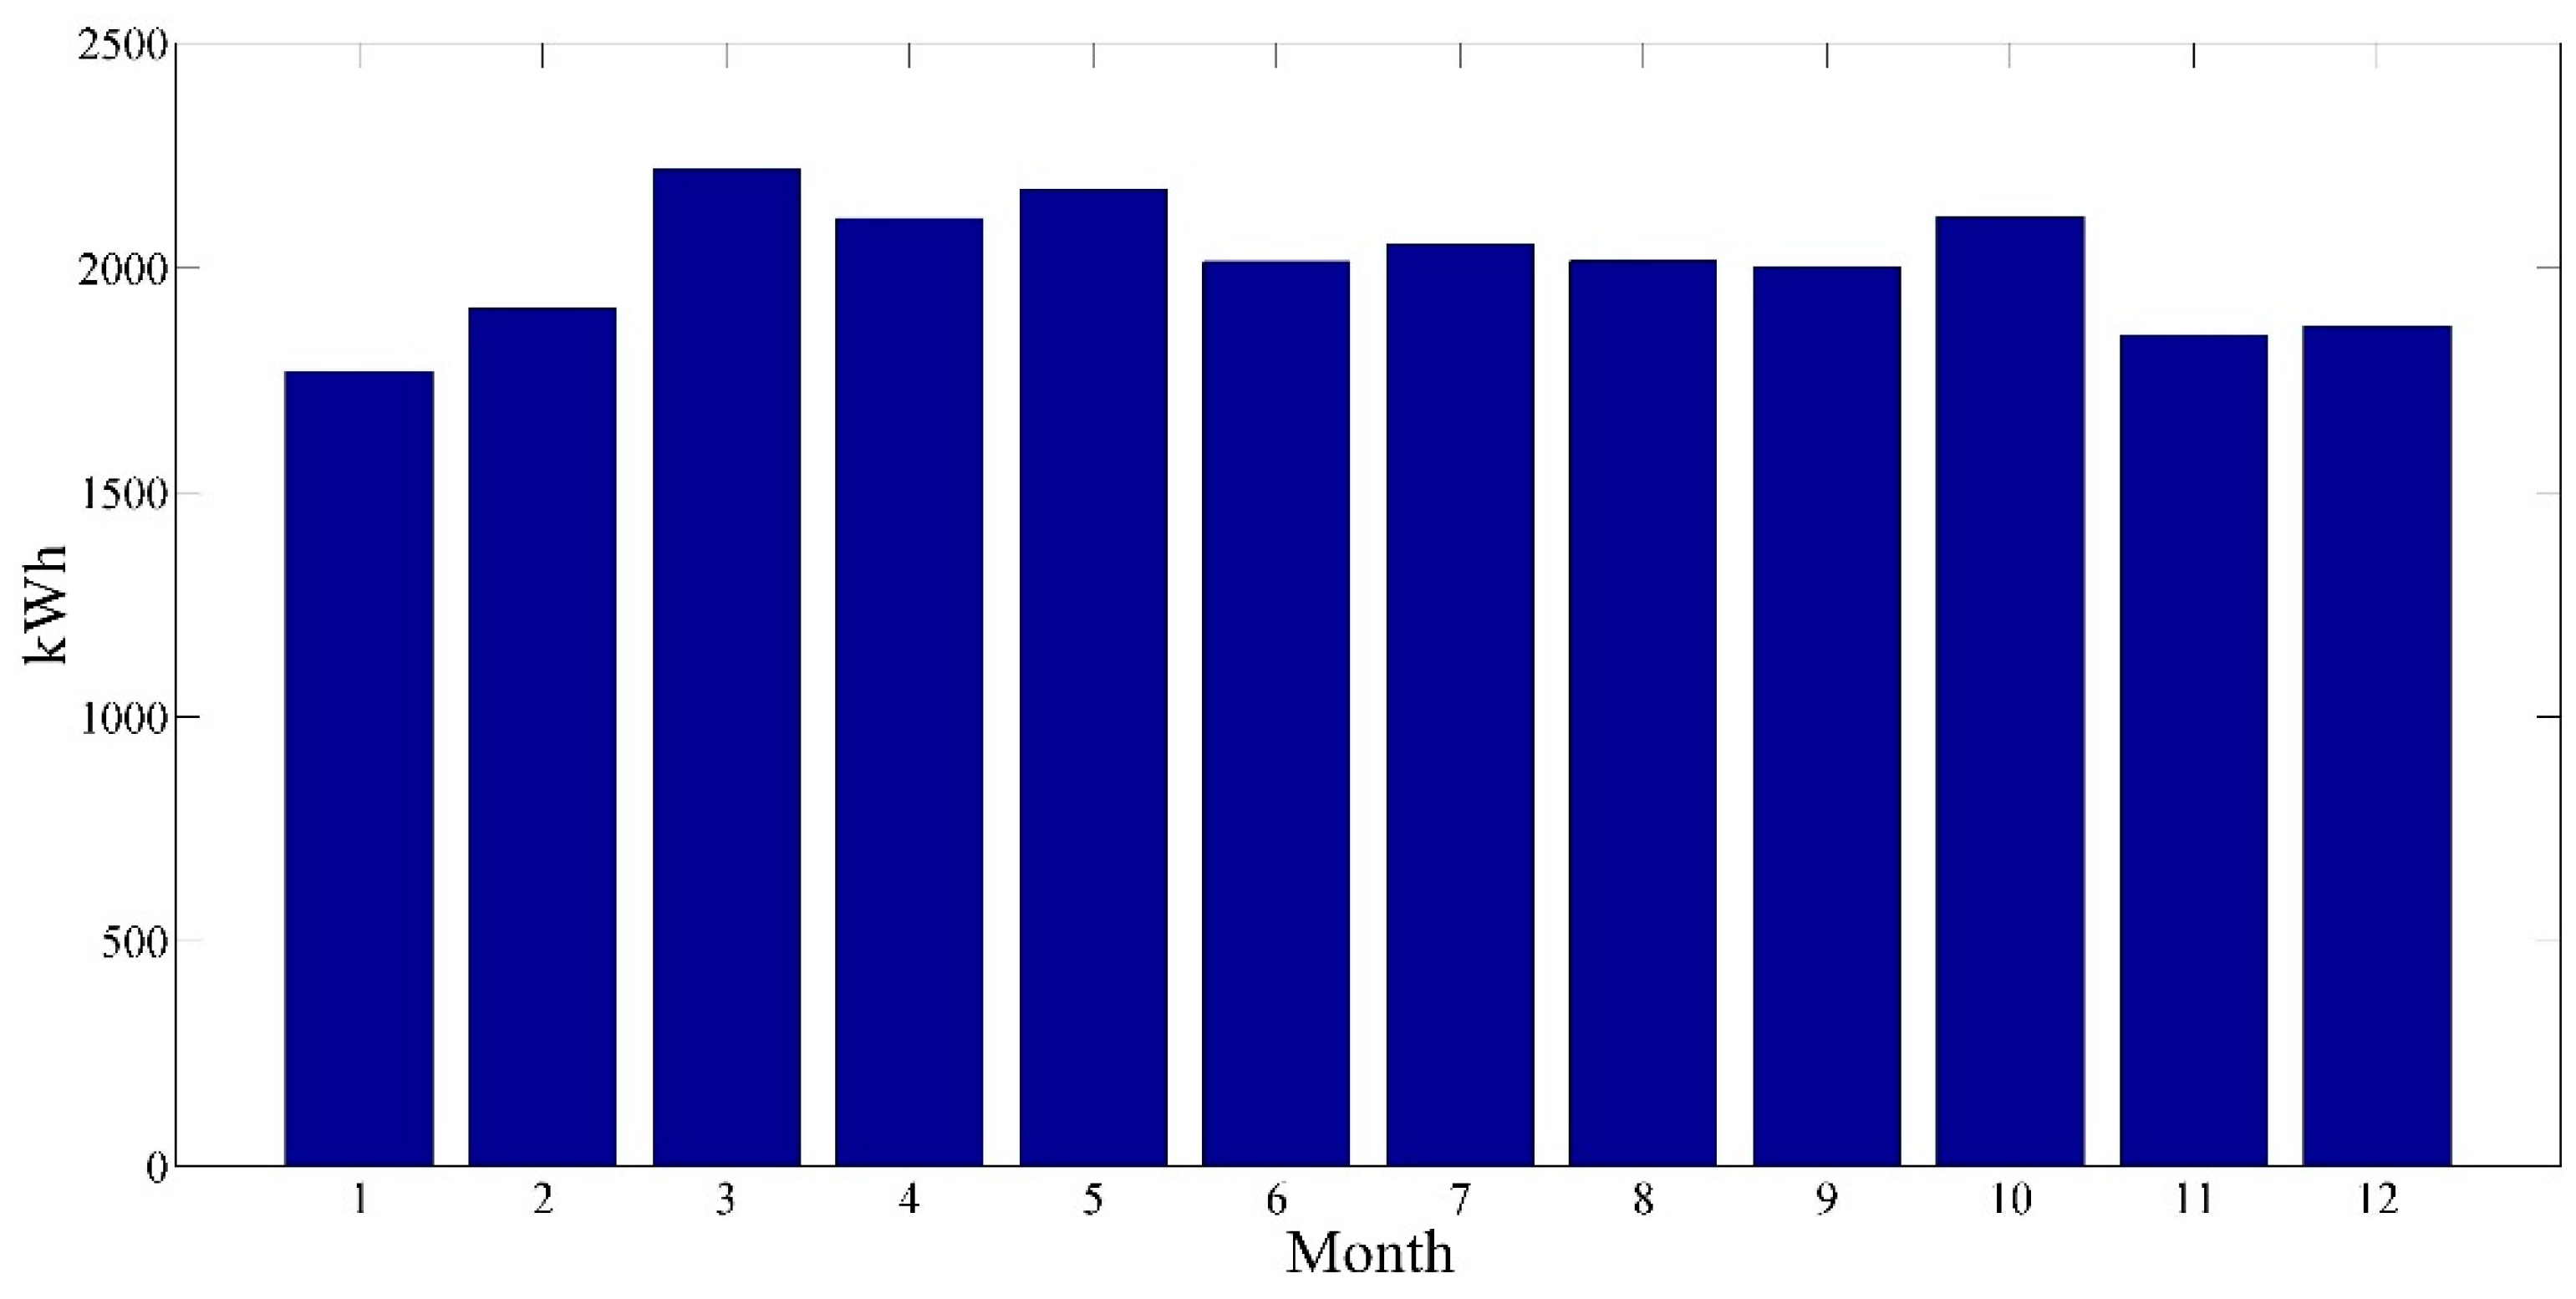
The simulation results indicate that the total monthly energy production over the first year varies between 2173.25 kWh in March and 1785.49 kWh in December. The total electric energy produced by the system in the first year is seen to be 23,589 kWh, with an average energy production of 1965.72 kWh/month. Figure 10 shows the monthly energy production of the system during the first year of operation. In comparison, the energy output in November and December (autumn season) and in January and February (winter season) are generally low due to cloudy weather in autumn and short sunshine periods and low solar irradiance in winter. High temperatures and soil losses due to dust accumulation do not have any appreciable effect on the energy yield in June.
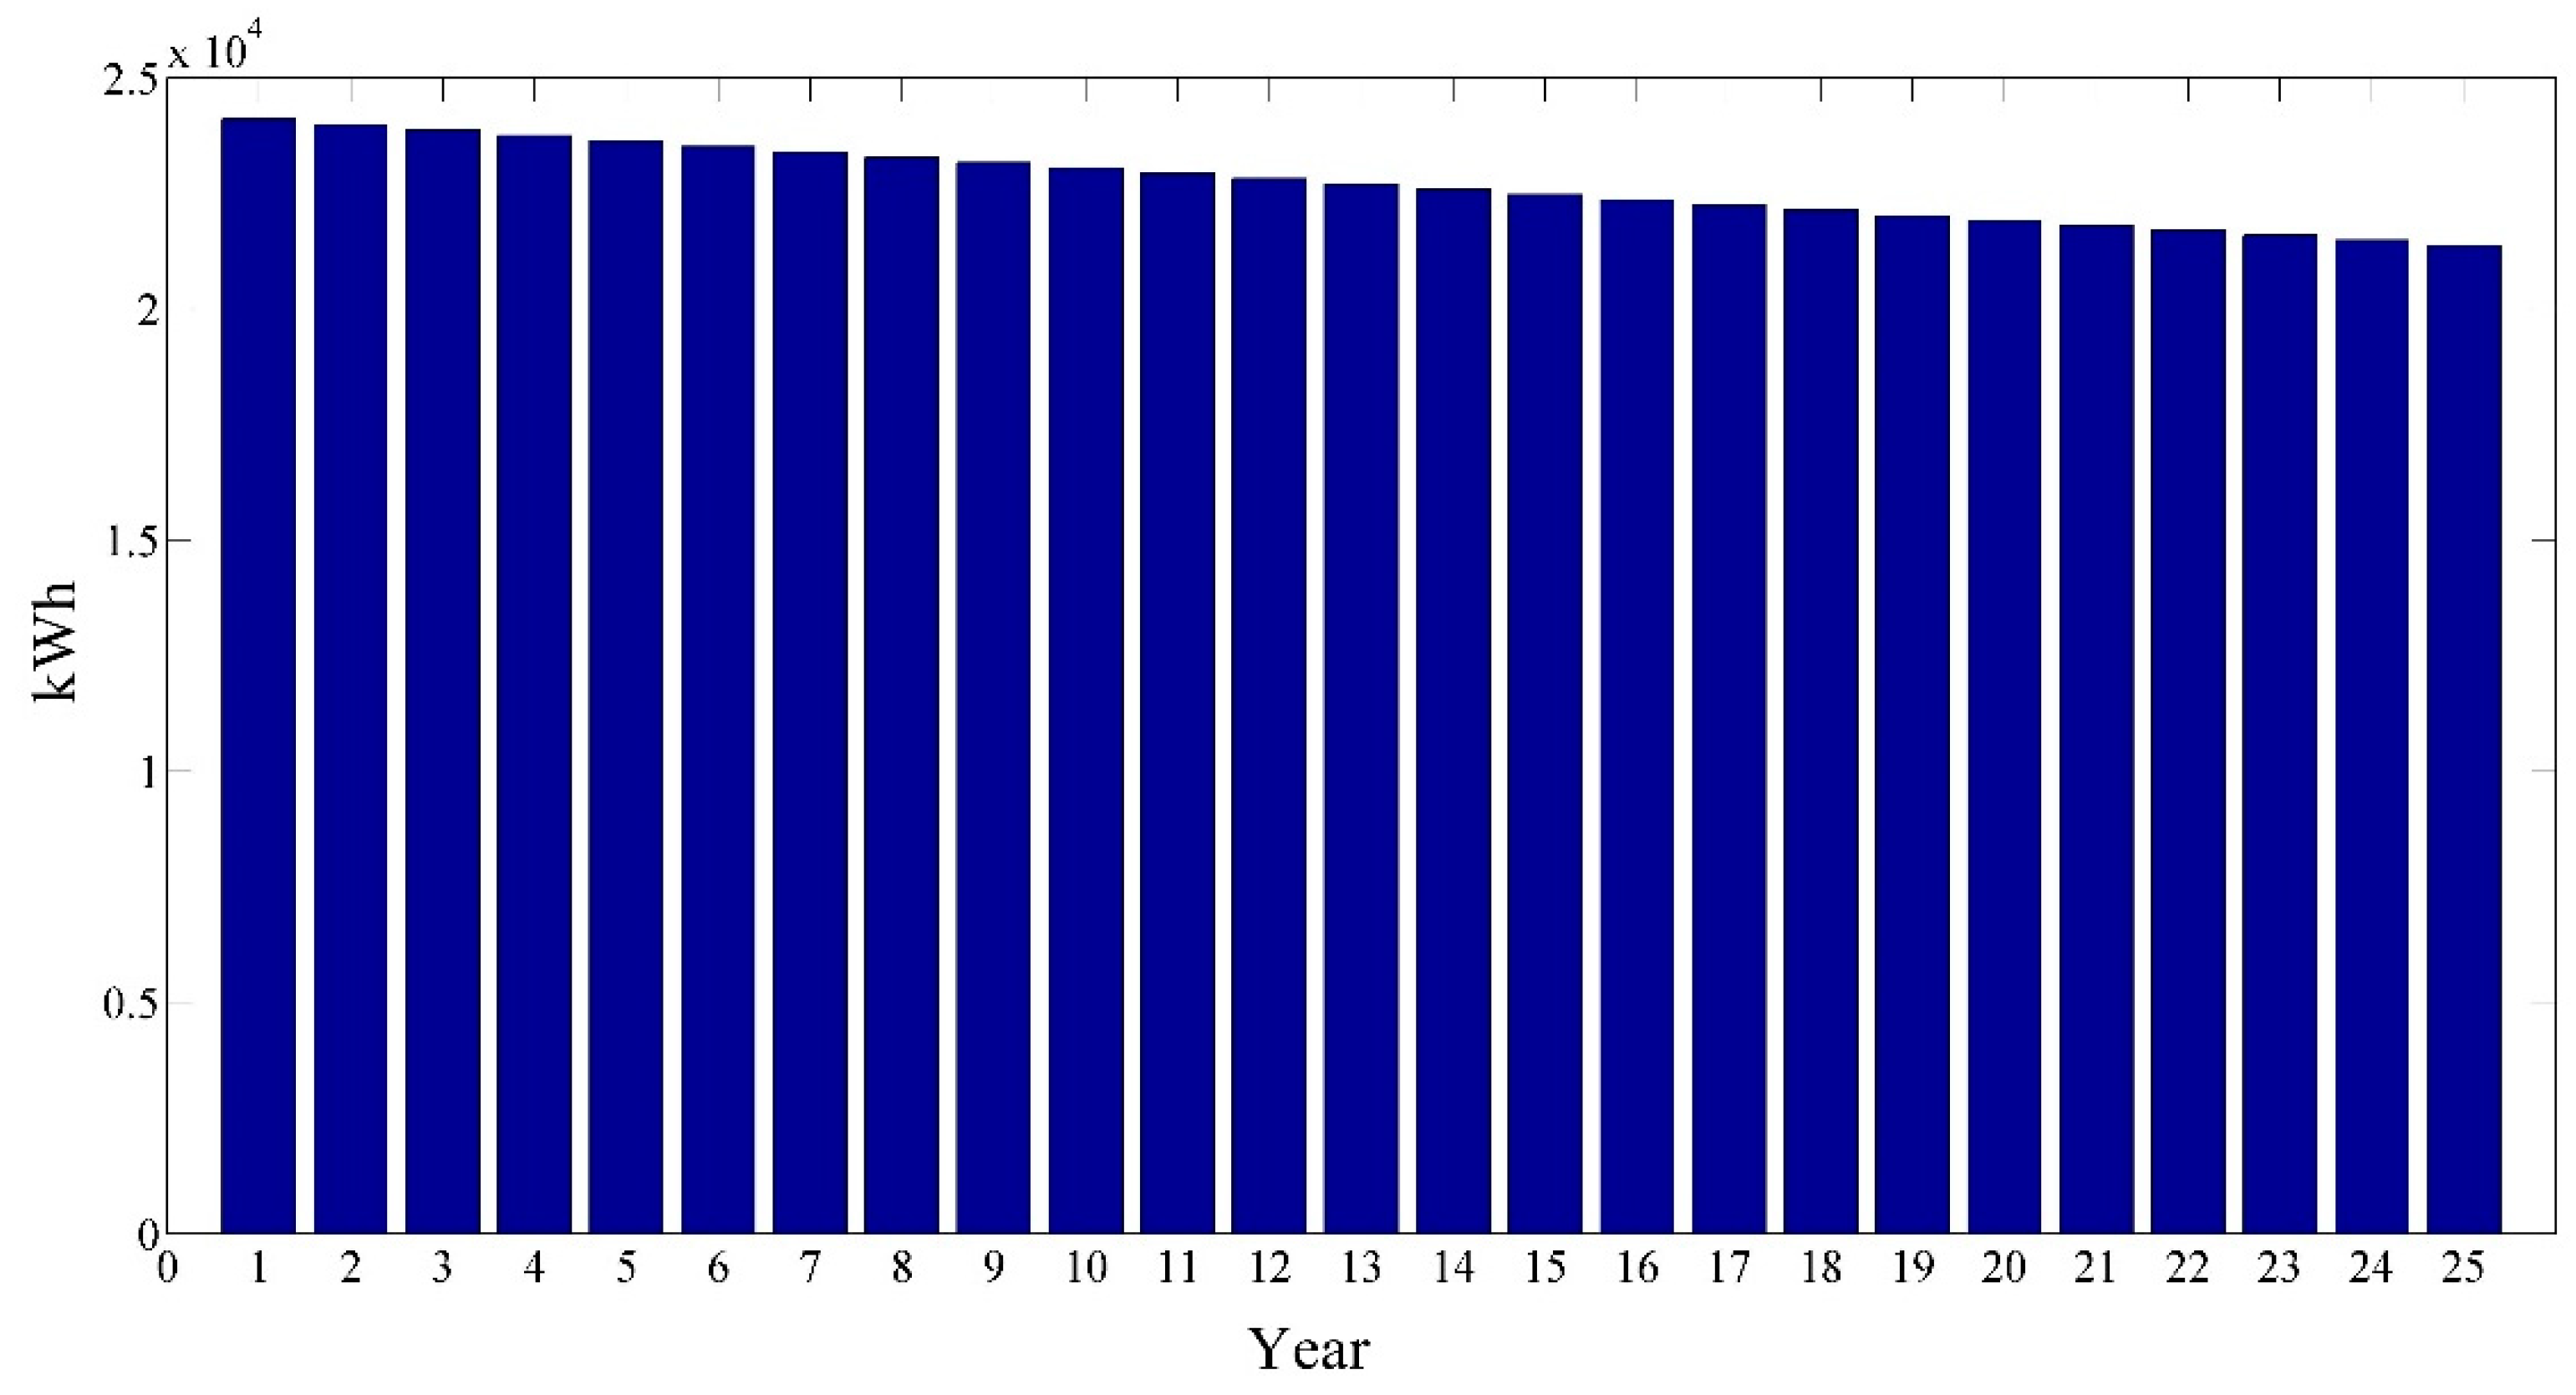
The total energy supplied by the system during the lifetime of the project is estimated to be 31,528,392.5 kWh, assuming annual reduction in the energy yield due to an annual degradation of 0.5% in the output power of the PV modules. Figure 11 shows the annual energy production during the lifetime period.
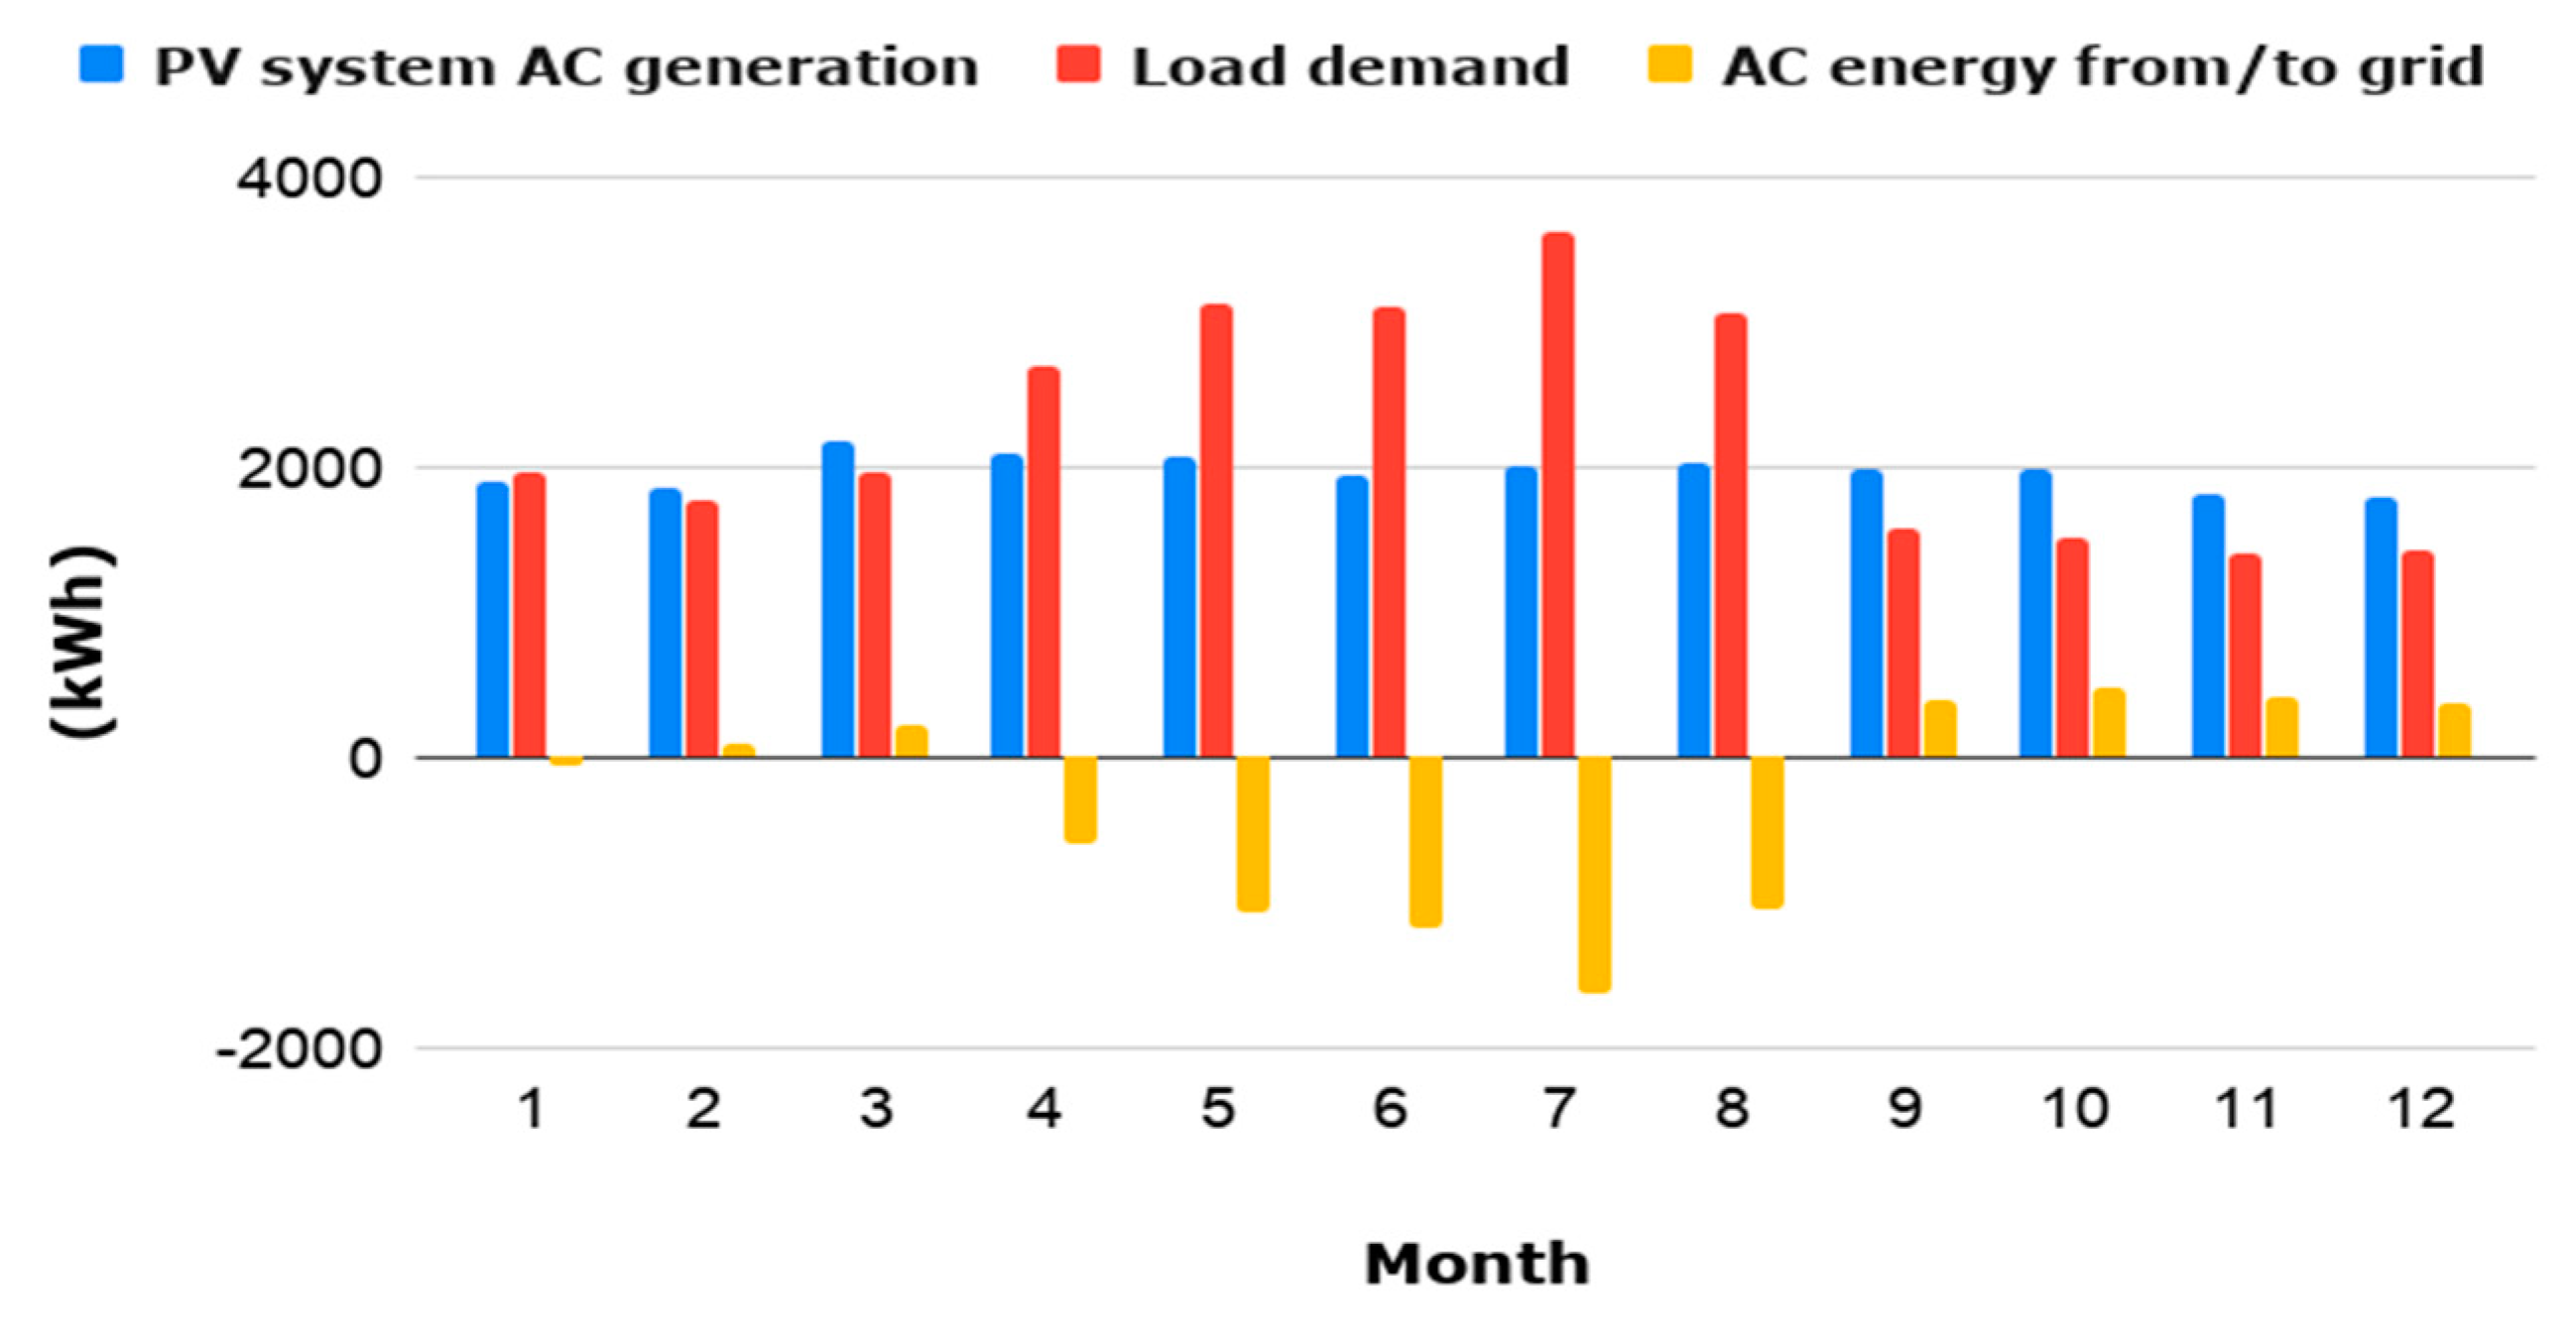
Figure 12 compares the monthly energy production of the proposed solar PV system and the consumption of the household. Based on this figure, the system is unable to meet the energy demand during the summer season (April to August) due to the high demand caused by the excessive use of air conditioners. In the remaining months of the year, excess power generation is fed into the distribution network, and customers will be paid based on mutual agreements with the distribution service provider.
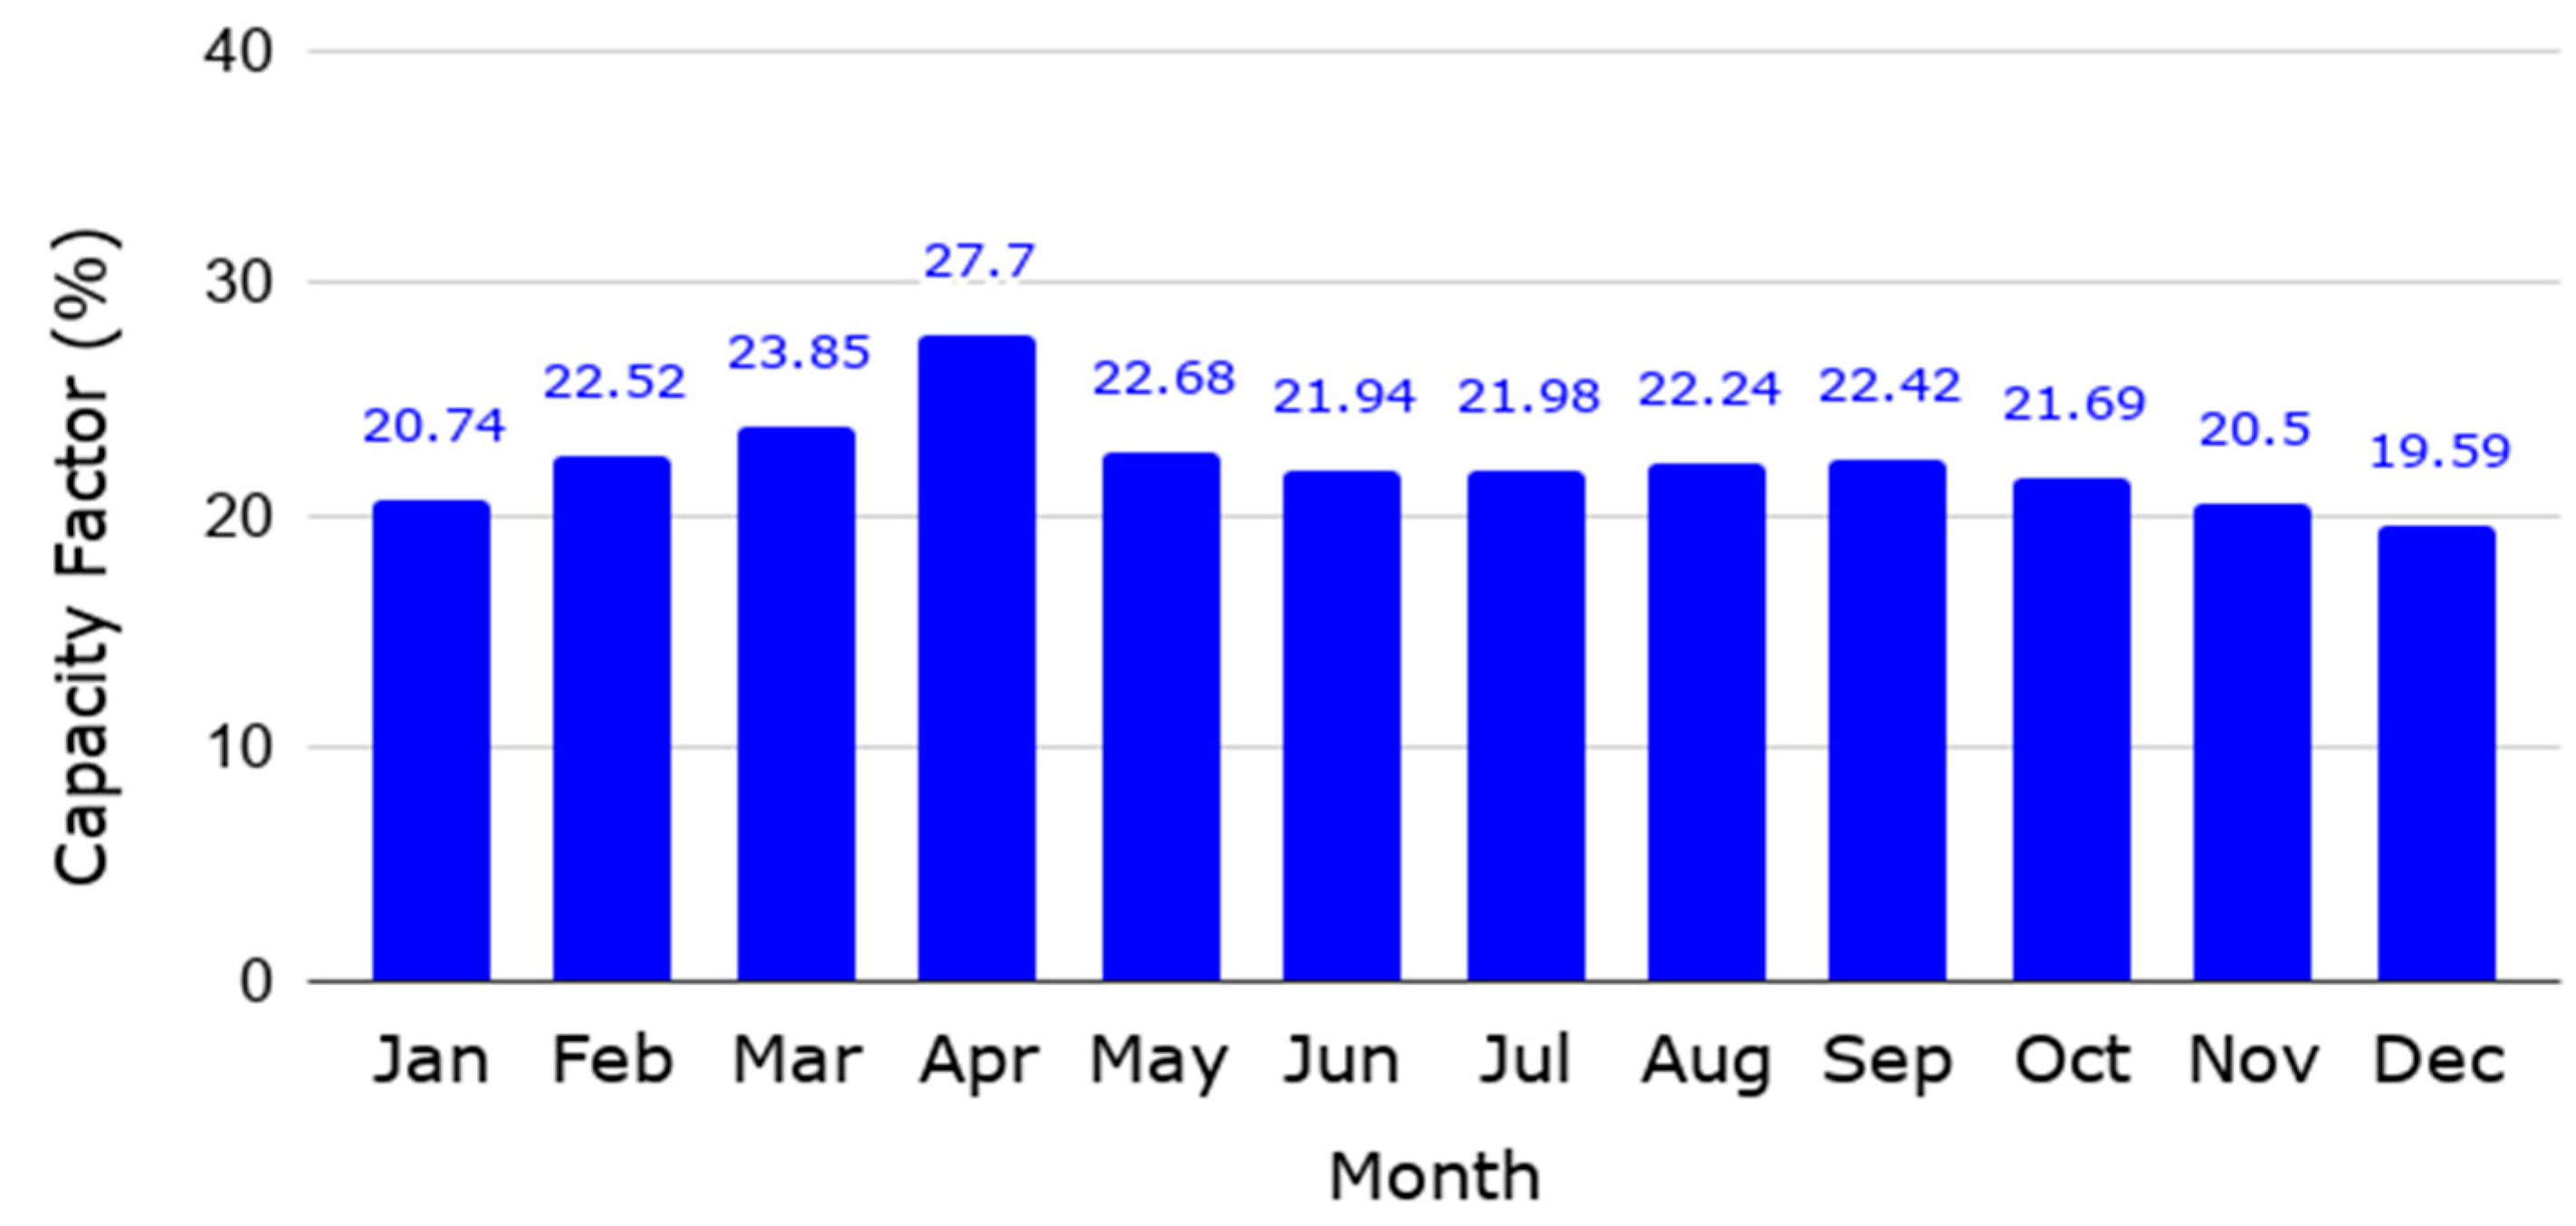
The annual yield factor for the system under investigation is 1927 kWh/kWp. This means that the system needs to operate at its rated power for 1927 h to provide the generated energy. The capacity factor (CF) of this system is 22%. This figure for CF is reasonable compared to similar grid-connected systems in the Gulf Cooperation Council (GCC) region (e.g., in Oman [64] and Kuwait [65]). The monthly capacity factor ranges between 23.85% in March and 19.59% in December, as shown in Figure 13.
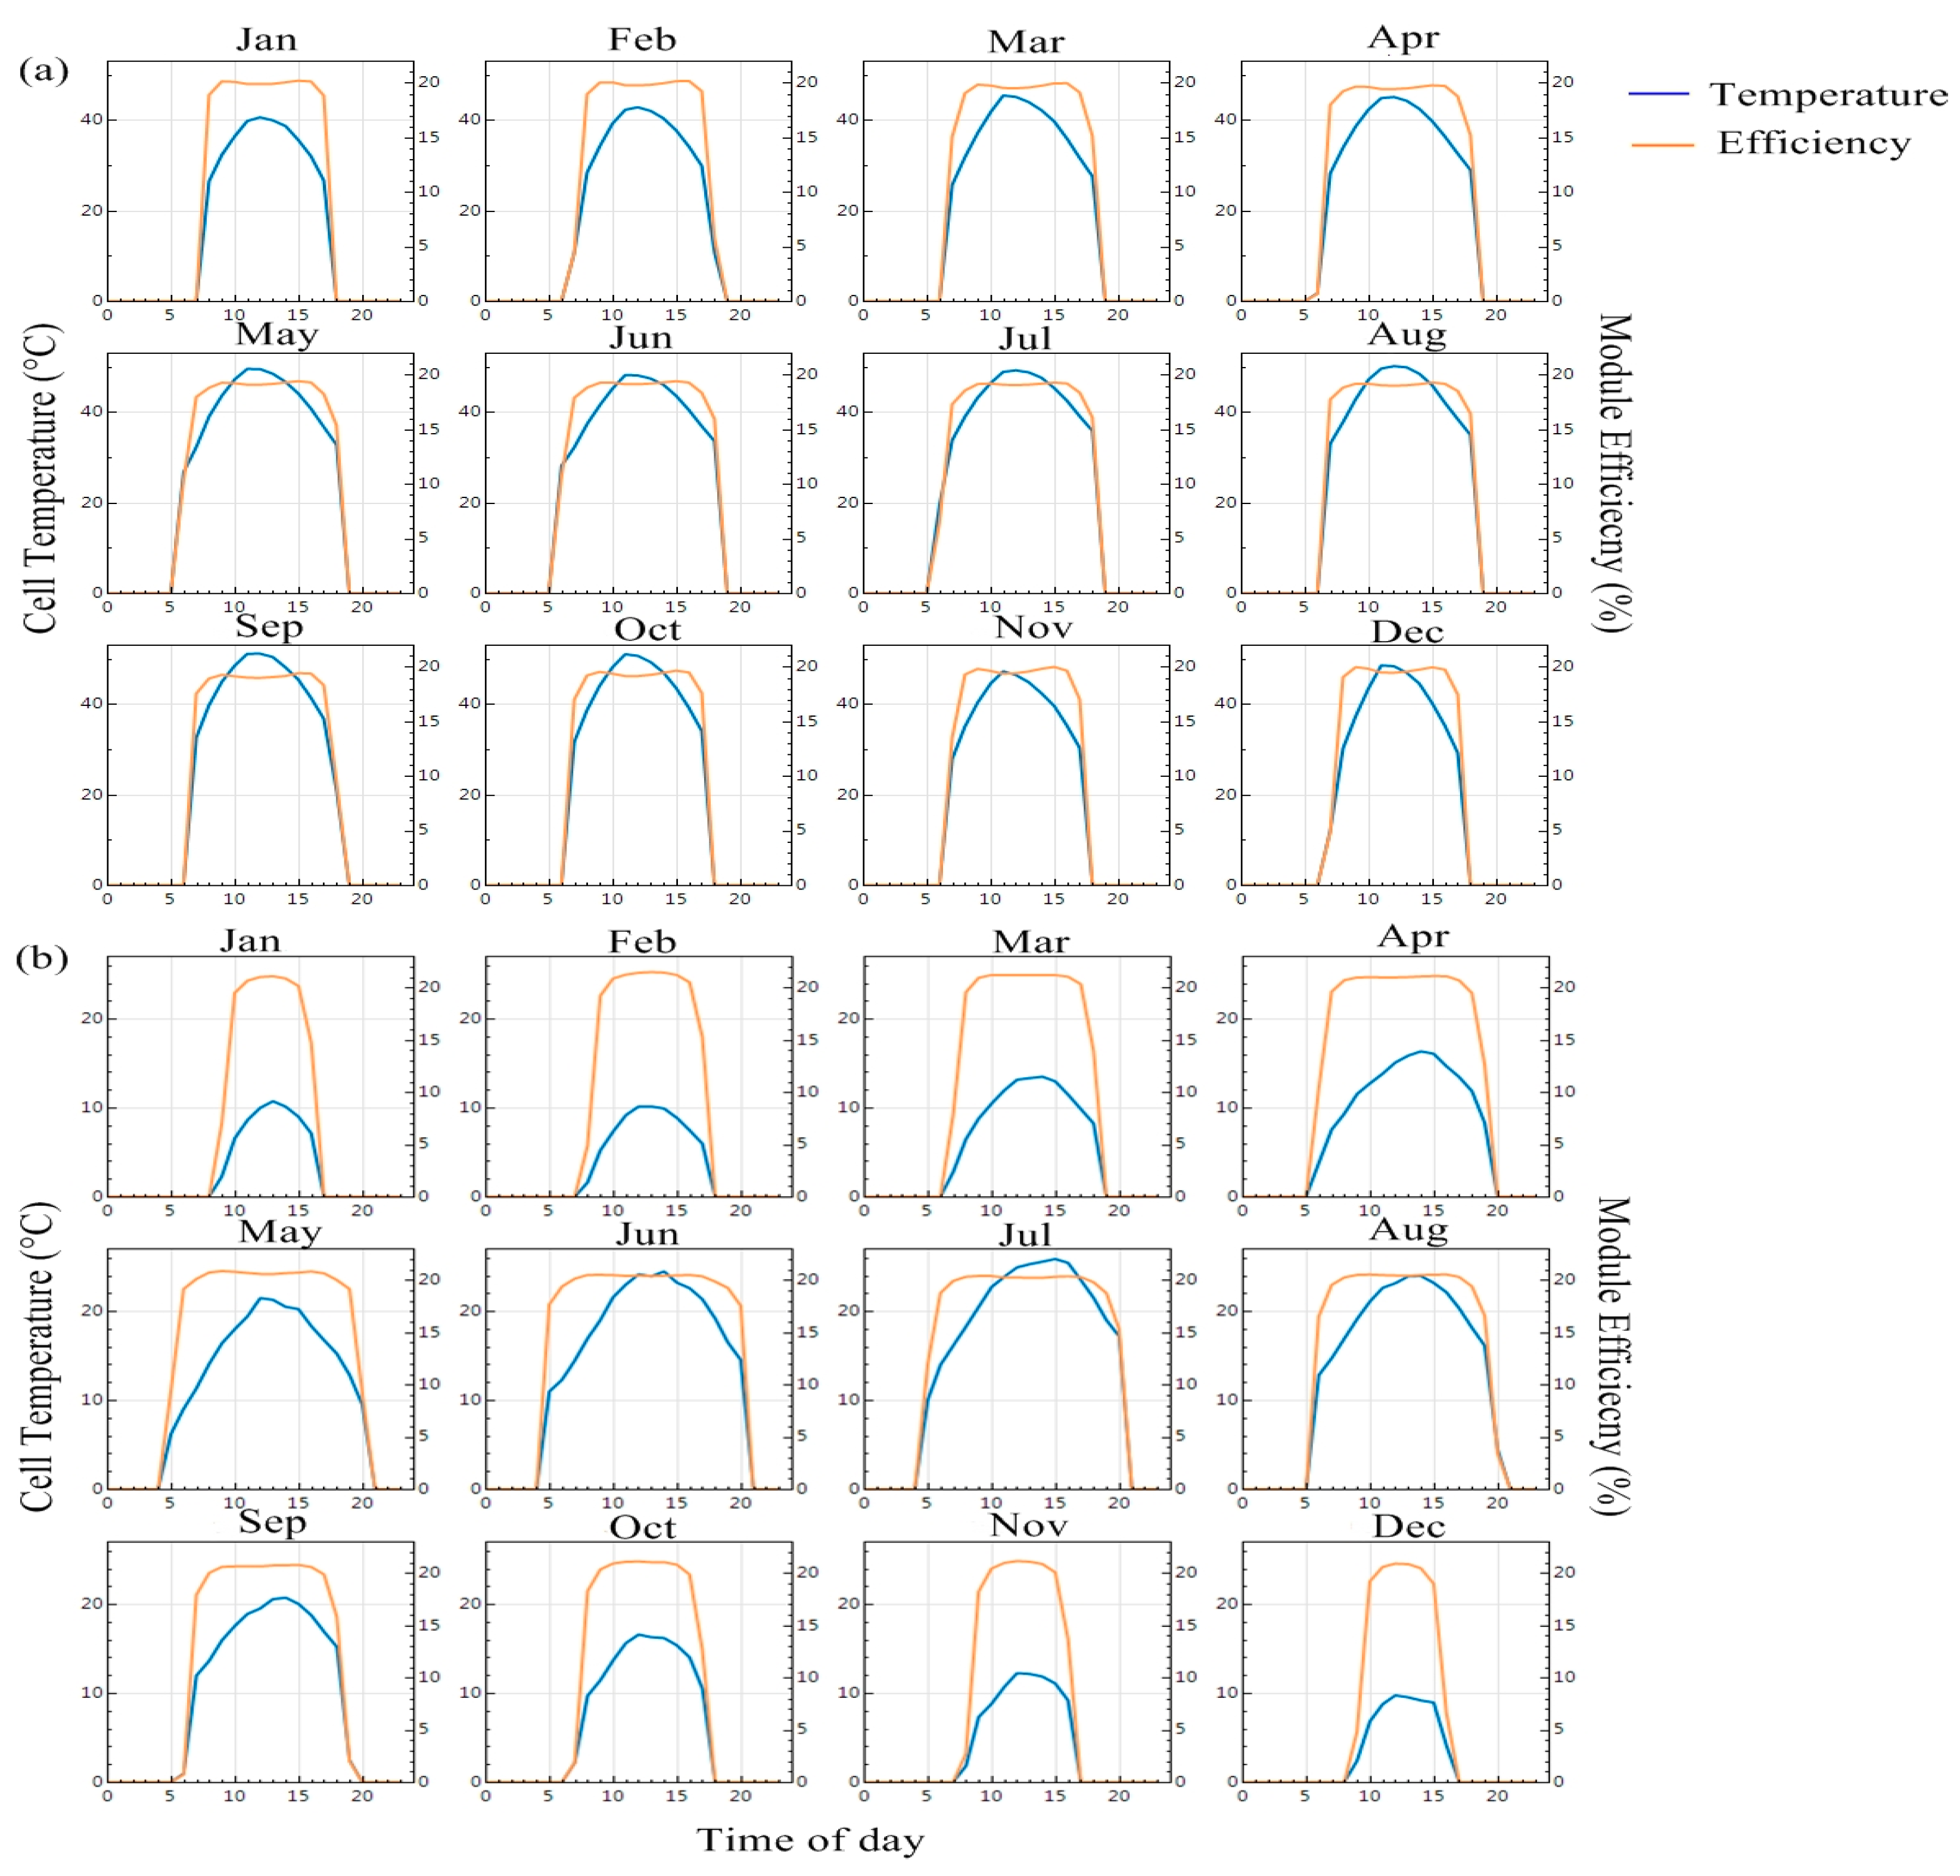
The proposed PV system’s annual performance ratio (PR) is estimated to be 78%. Although the system’s location has high solar potential, its performance ratio is slightly lower than the 81.5% recorded in Dublin, Ireland [17]. This is due to the high solar cell temperatures at the site decreasing the solar cells’ efficiency (Figure 14a in Jeddah and Figure 14b in Dublin).

3.2. Economic Analysis

The economic feasibility investigation comprises the levelized cost of energy, payback period, and net present value. After estimating the system’s lifetime expenditures and revenues in reference to IRENA’s renewable energy cost estimation, the economic indicators are presented in Table 6. The nominal and real LCOE are 0.031 $/kWh and 0.0382 $/kWh, respectively. Both the nominal and real LCOE are competitive with the electricity company tariff, which is 0.048 $/kWh for consumption up to 6000 kWh and 0.08 $/kWh for more than 6000 kWh.
LCOE is a good indicator for comparing the cost of PV energy production in different locations, or with alternative power generation, but is not adequate for measuring financial profitability. For that purpose, the net present value and payback period are measured. Net present value is one of the key concepts that cannot be avoided during grid-connected PV system feasibility evaluation. Net present value describes the present worth of future net cash flow over the project’s lifetime. The estimated net present value of the system over its lifetime is $4378. As shown in Table 6, a positive NPV indicates that the investor is earning money, and vice versa. The discounted payback period or the time needed for this system to offset its investment cost is 14.6 years. In general, LCOE and NPV indicators emphasize the ability of residential GCPV systems to compete as electricity utilities in terms of the cost of energy. In contrast, the long-term discounted payback period reduces the investment attraction and desirability of investors toward the installation of PV systems.

3.3. Sensitivity Analysis

3.3.1. Tracking System Analysis

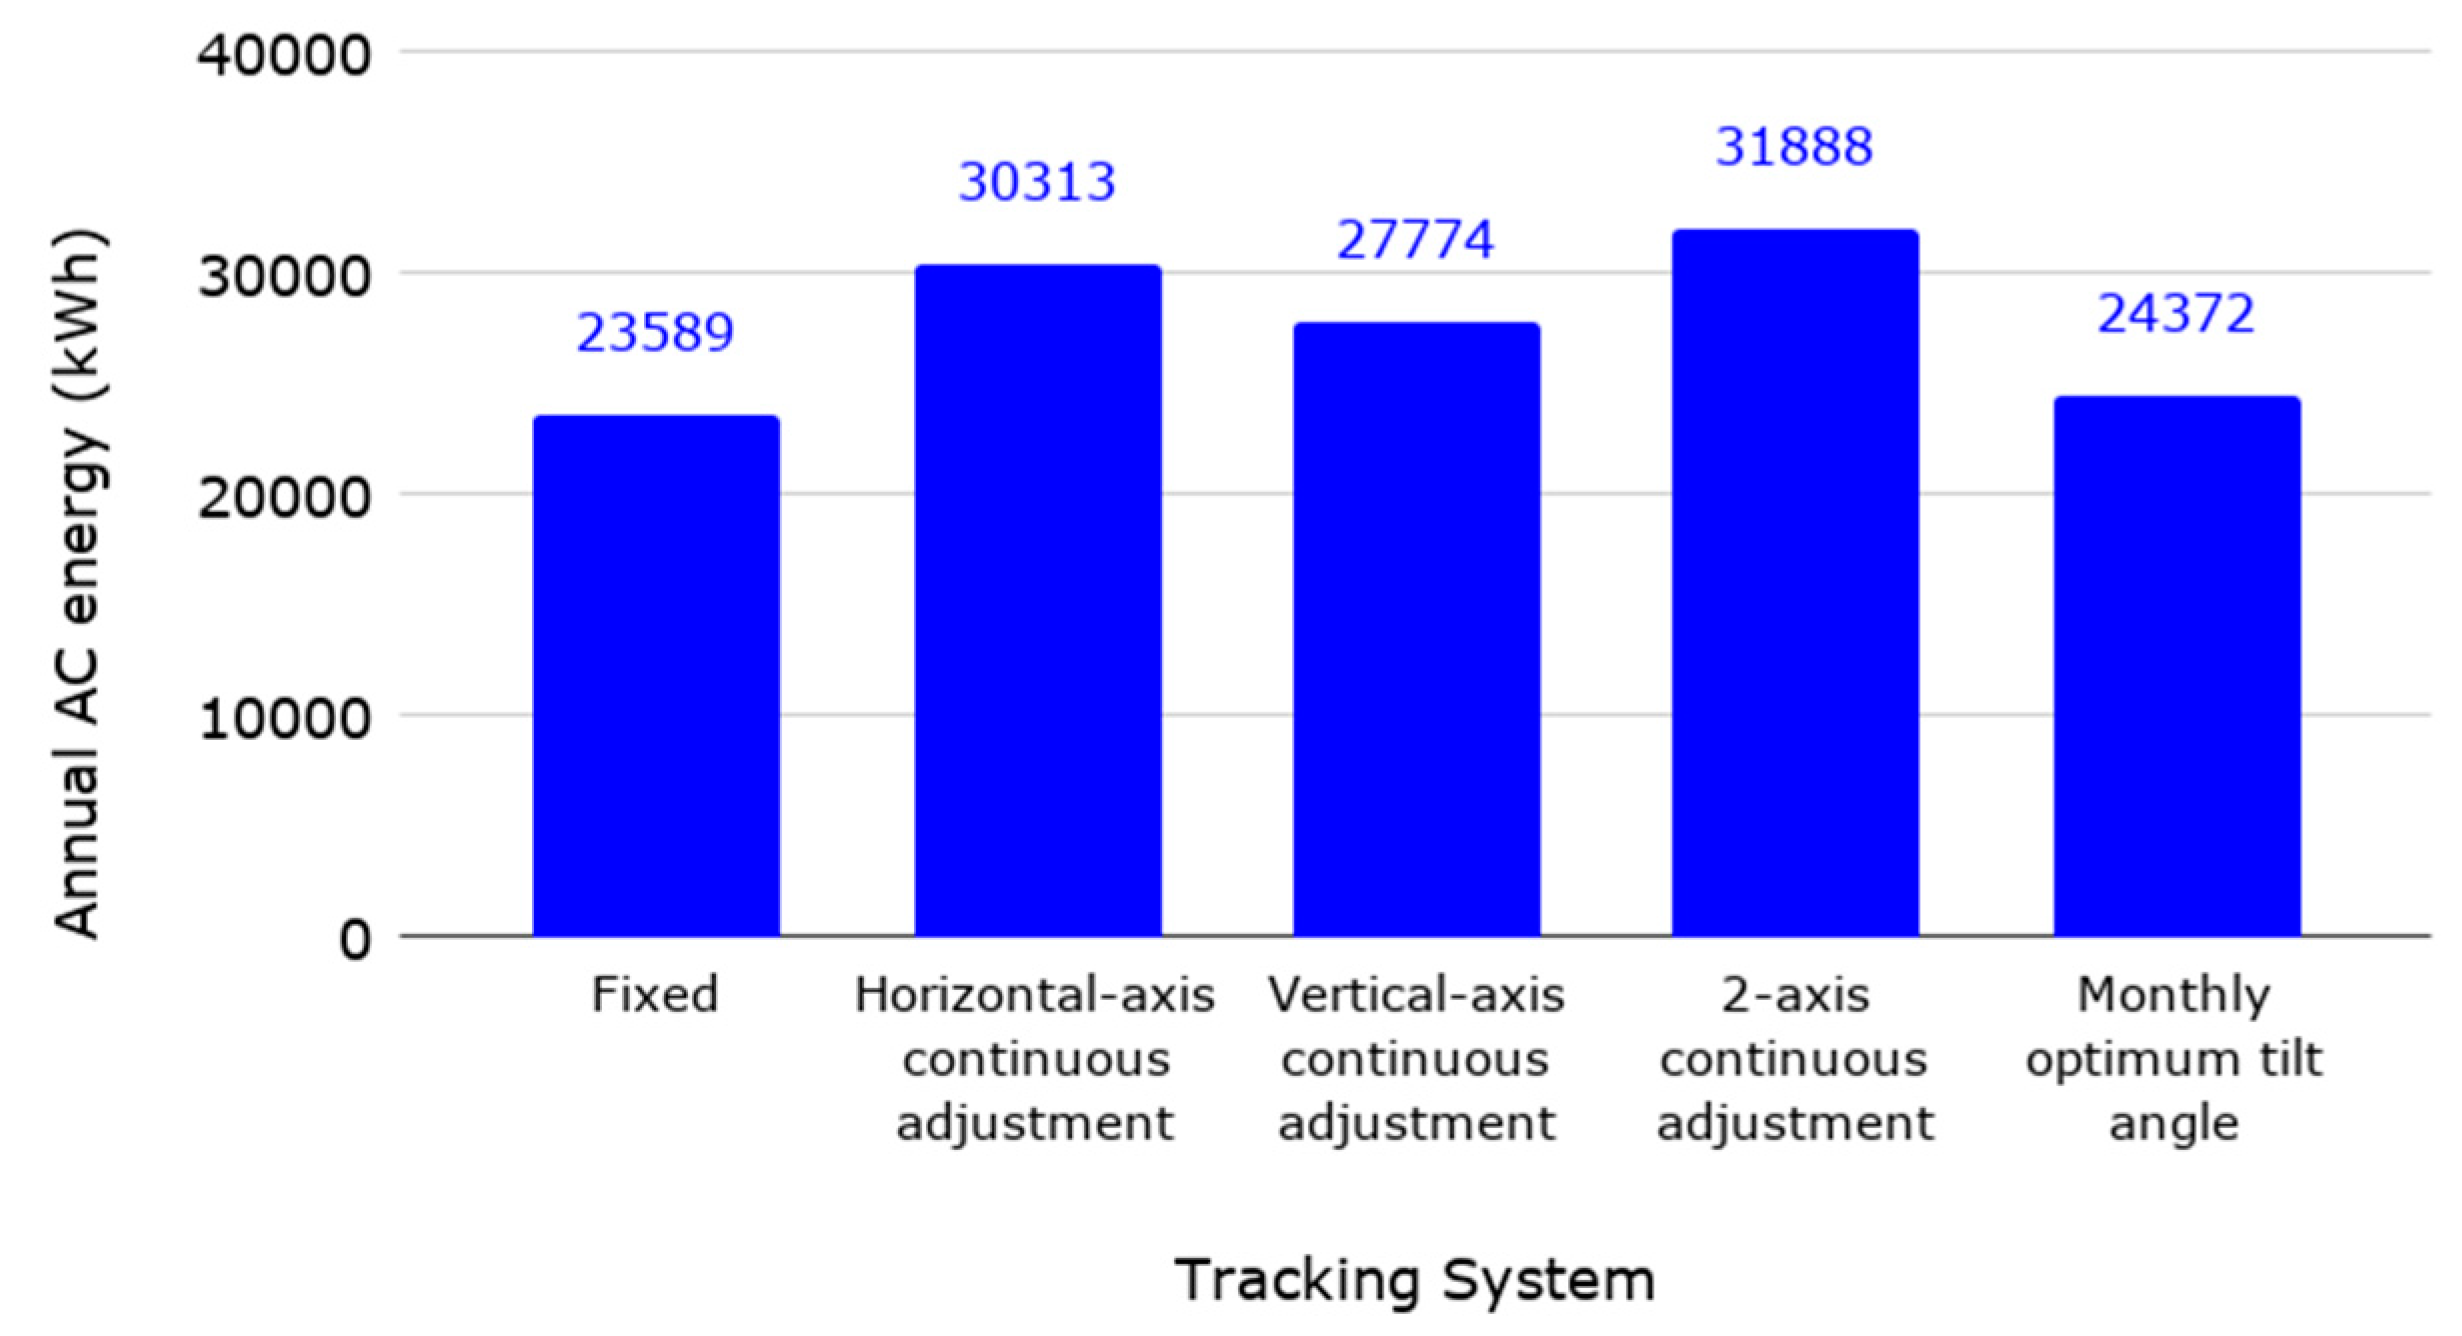
Implementation of the tracking system can raise the PV system’s productivity by 27% to 40% depending on the type of tracking system [52]. In this regard, this section examines the effect of possible tracking systems on system performance to determine the option that improves the system’s harvested energy. The annual energy production for different tracking systems is shown in Figure 15. Sensitivity indicates that the continuous two-axis tracking system outperforms the other tracking systems in terms of productivity, with an additional 35.2% annual energy production compared to the system fixed at an optimum tilt angle. Furthermore, adjustments to the monthly optimum tilt angle result in no significant production changes.
Although the tracking systems’ efficacy has been proven, the financial boundary remains a major obstacle to implementation. The tracking system’s economic sensitivity analysis is conducted by relying on the tracking system costs estimated in [53]. The results in Table 7 reveal that, despite the high productivity of continuous horizontal-axis and two-axis adjustment, the costs outweigh the revenue, as indicated by the negative NPV and the values of LCOE, which exceed the electricity utility rates. The monthly optimum adjustment tracking system results in an extended payback period, and the azimuth or vertical-axis tracking system has no significant technical improvement. Hence, the implementation of small-scale PV tracking systems is not economically justifiable at present.

3.3.2. Economic Parameter Analysis

An economic feasibility investigation in this study was conducted to assess whether the proposed GCPV system can be undertaken, or if the costs are too high, making the project unfeasible. The swings and volatility of economic parameters always change under economic investment forecasting. Responses to variations in the economic parameters that drive economic indicators and profitability, including interest rate, inflation rate, and sales tax, are analyzed.
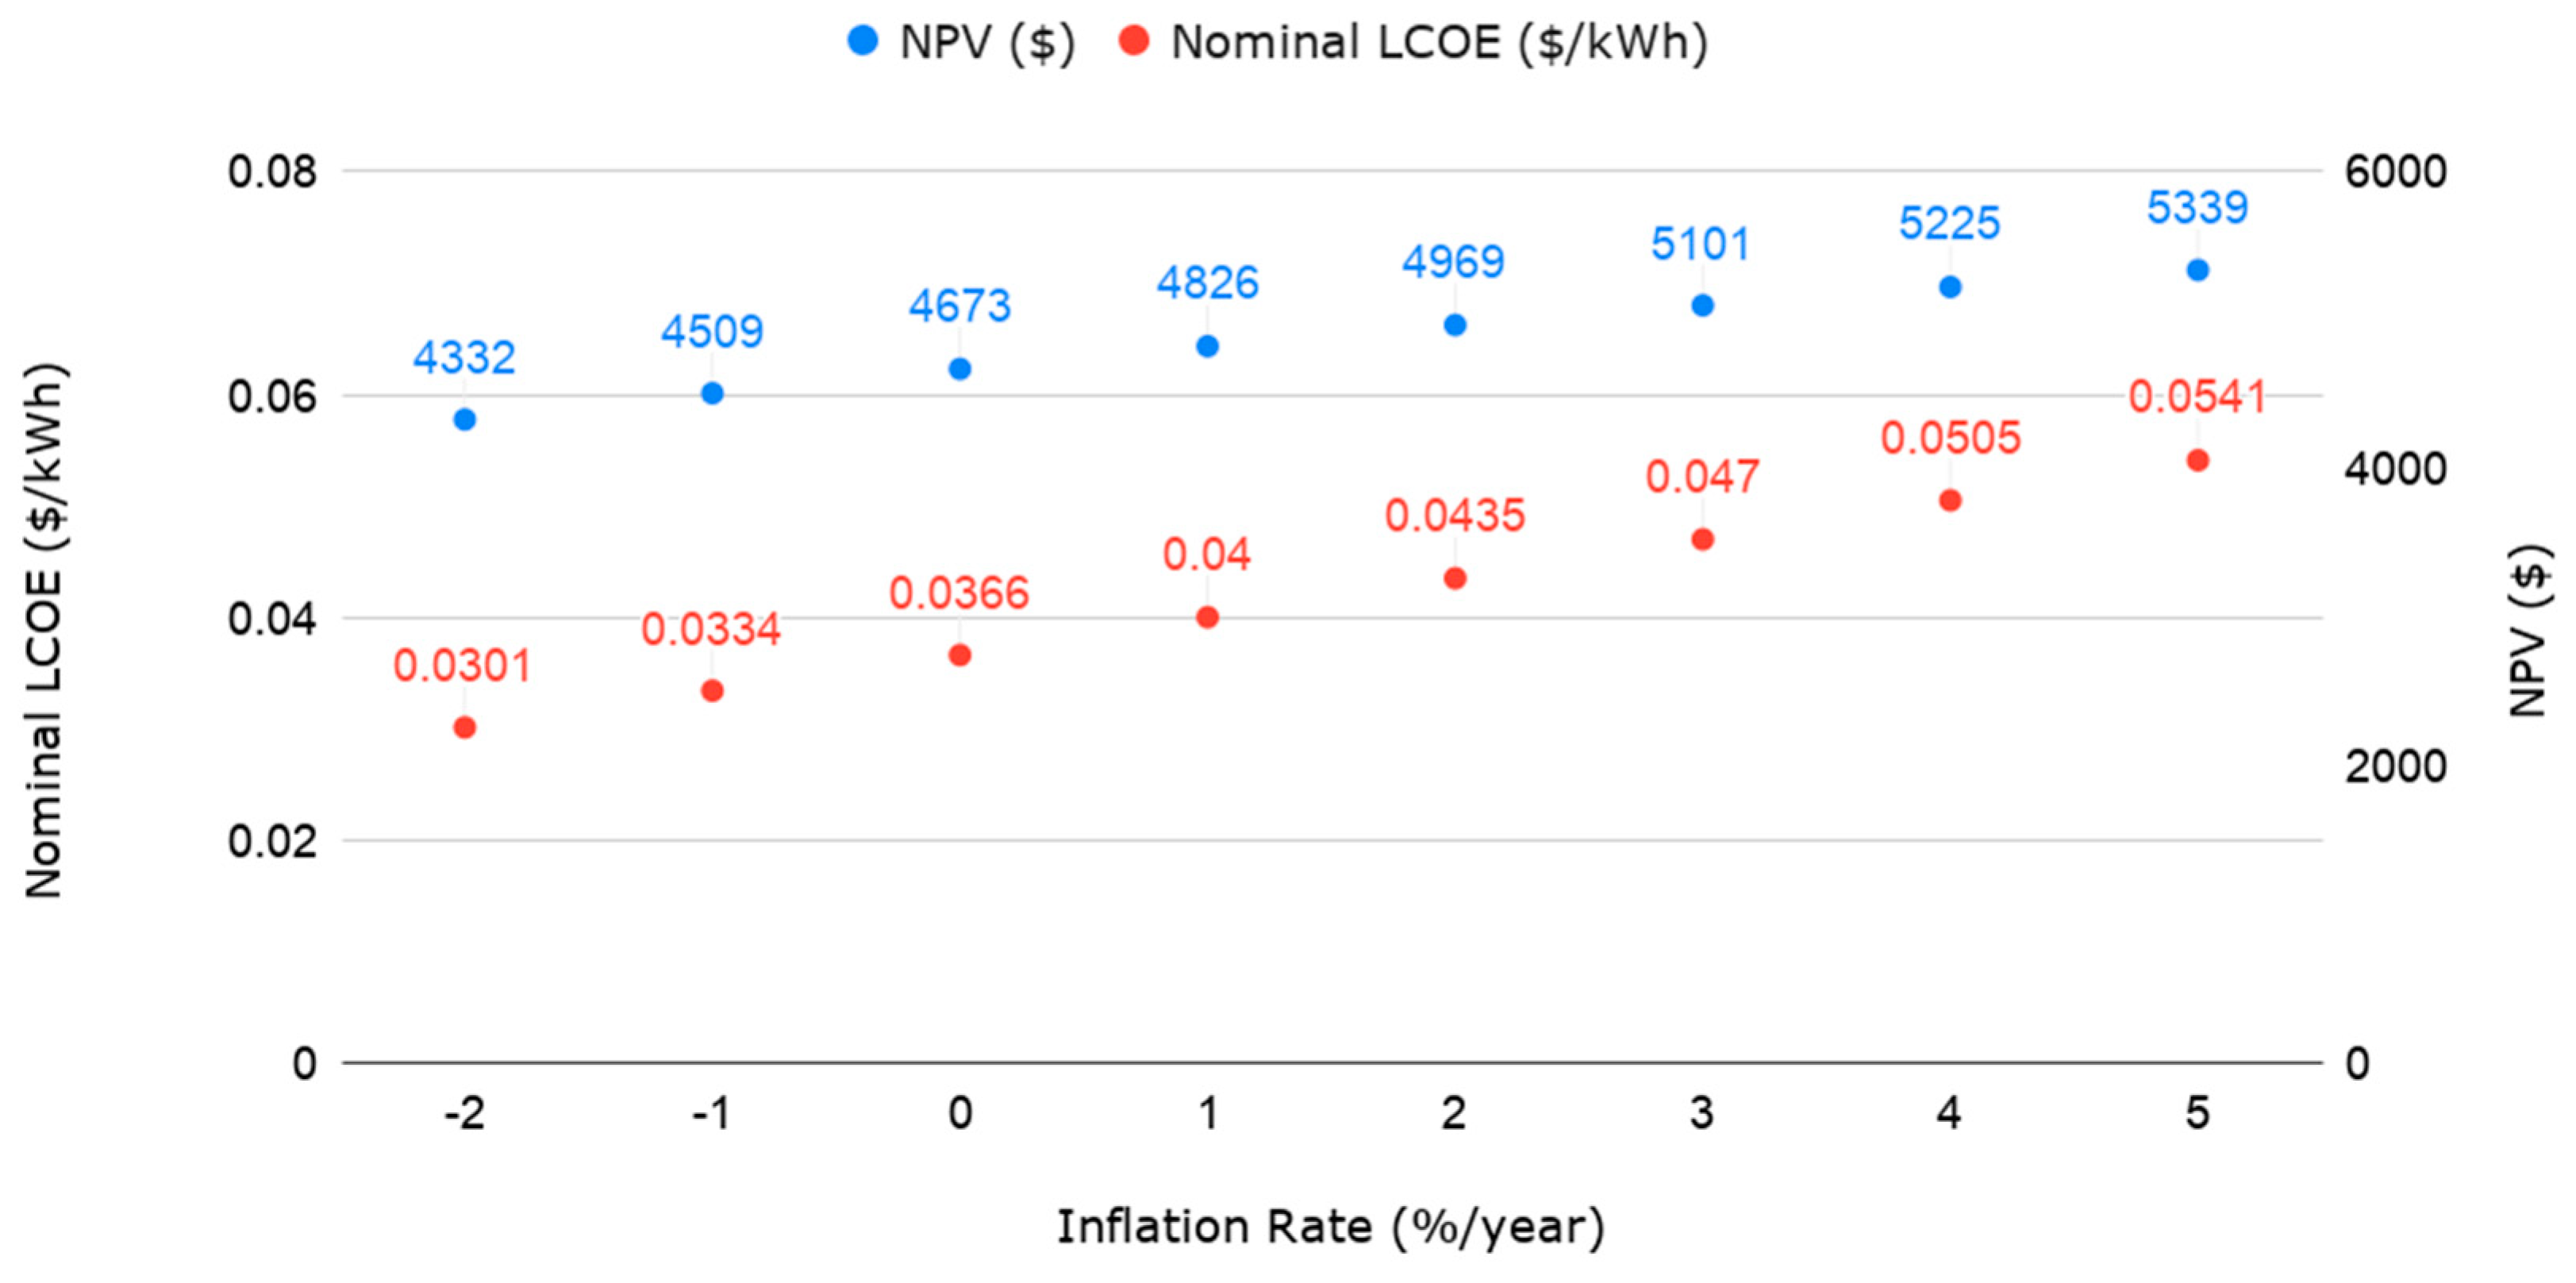
The inflation rate in Saudi Arabia fluctuated between 3.5% and −1.8% between 2016 and 2019, respectively [51,52]. Thus, it is necessary to subject LCOE to inflation rate variation. Figure 16 reveals the strong dependency of the cost of energy on the inflation rate. LCOE exceeds the electricity utility rate to 0.0505 $/kWh at an inflation rate of 4%. However, the NPV indicator shows that the investment is earning money, which emphasizes the fact that LCOE compares the cost of energy with alternative systems rather than evaluating economic profitability because the electricity utility rate is subjected to the same inflation rate.
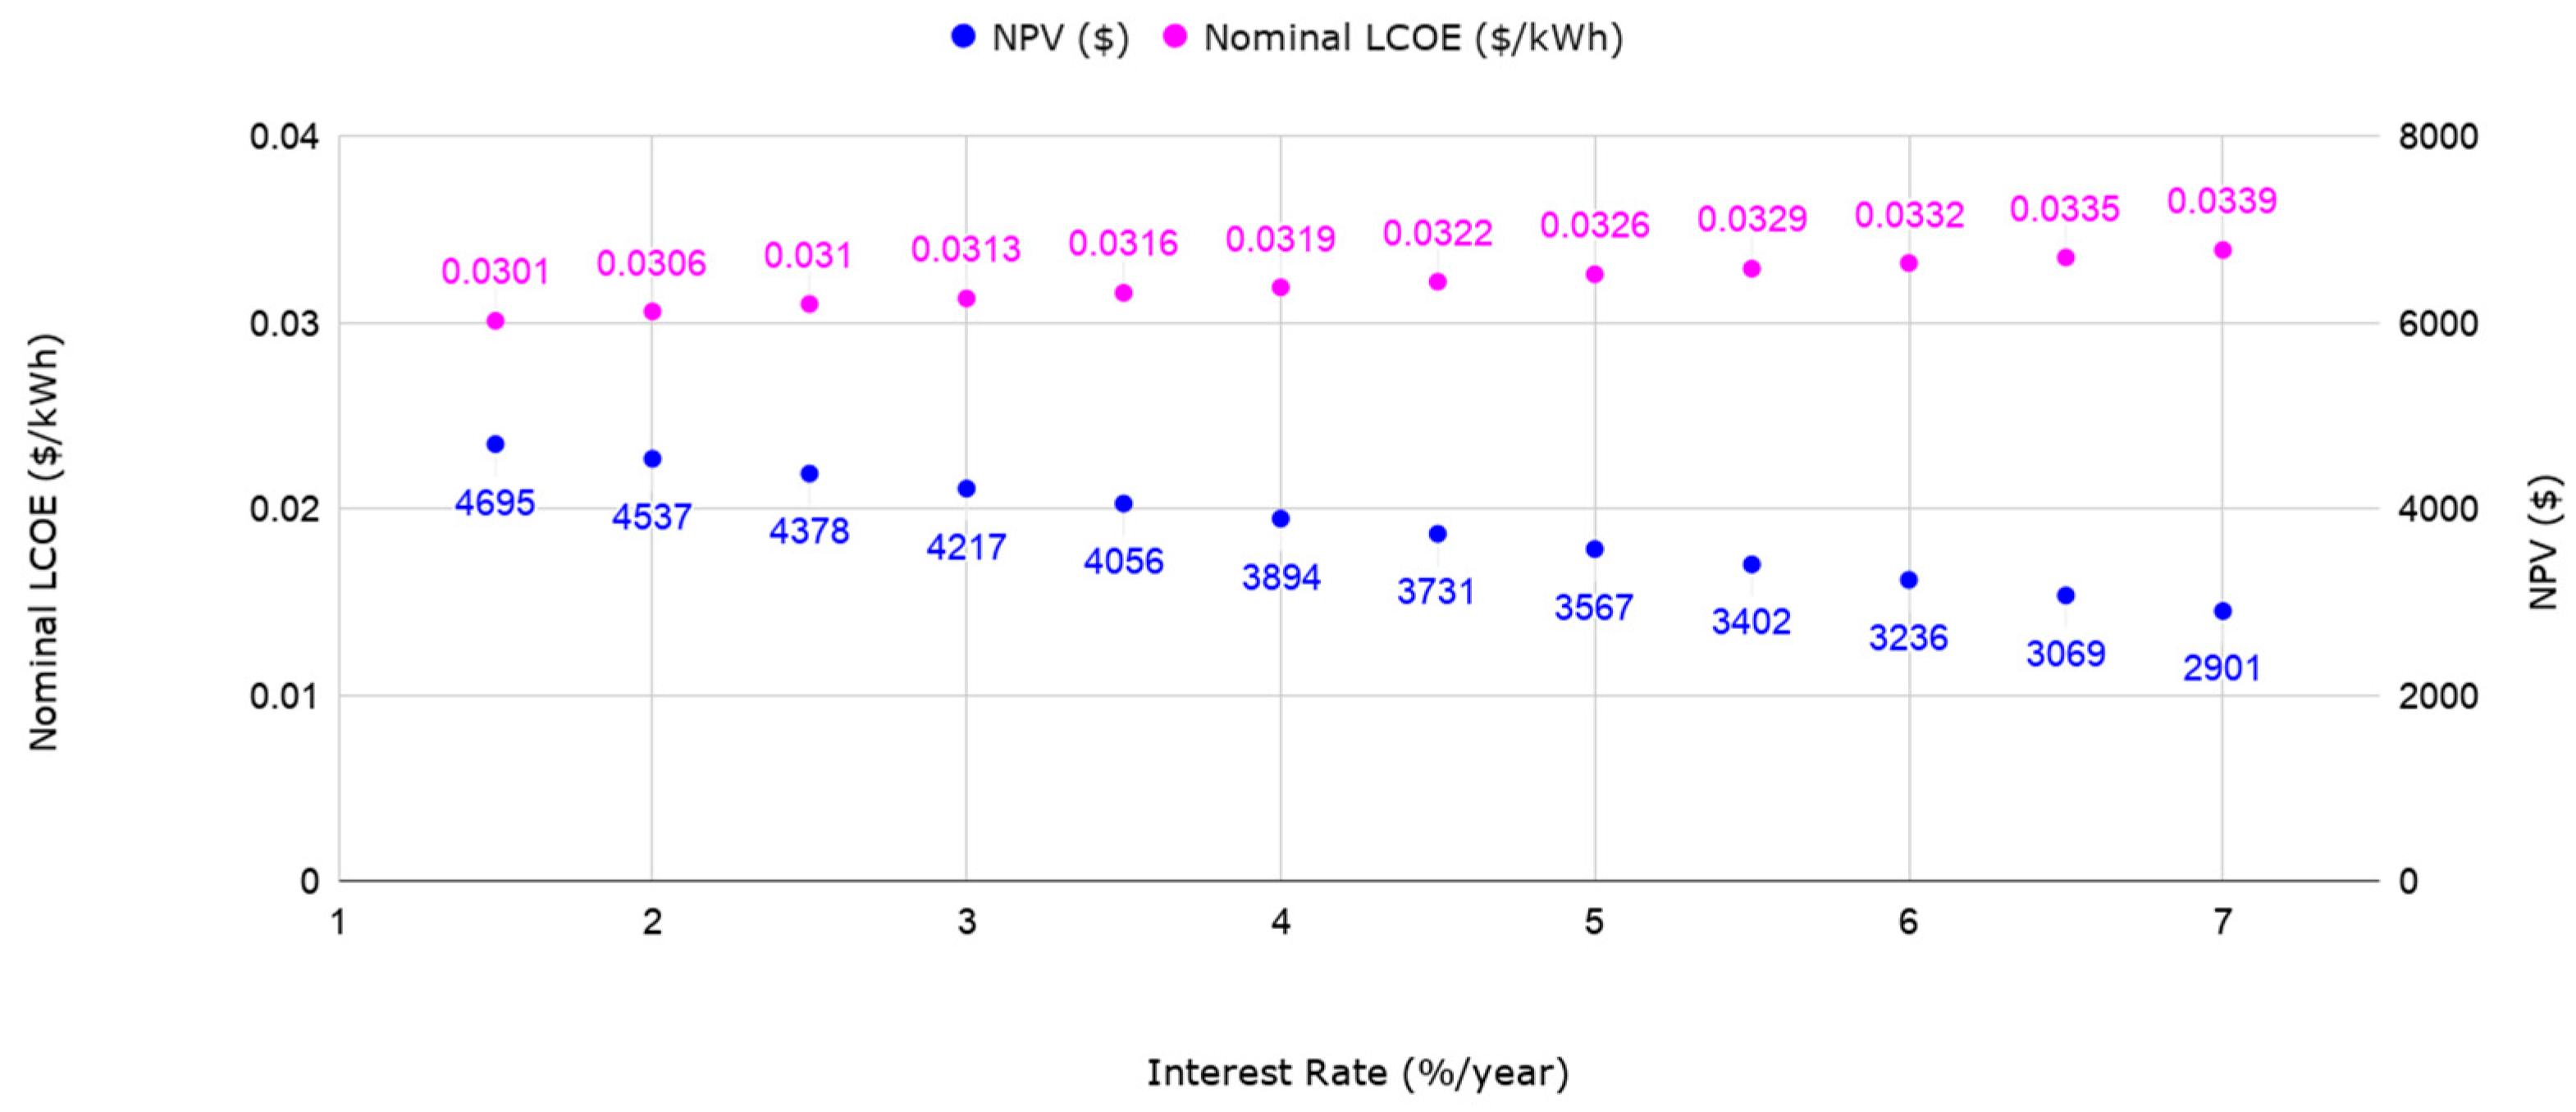
Figure 17 demonstrates how interest rate impacts the LCOE and NPV with the inflation rate kept constant at −1.8%. The trends of these indicators show that the higher the interest rate, the lower the income. As the Saudi Arabian interest rate for 12-month maturity was in the range of 7% to 3% between 1997 and 2019, this analysis proves that the investment is economically feasible for this range of interest rate.

3.3.3. Time-of-Use Billing Analysis

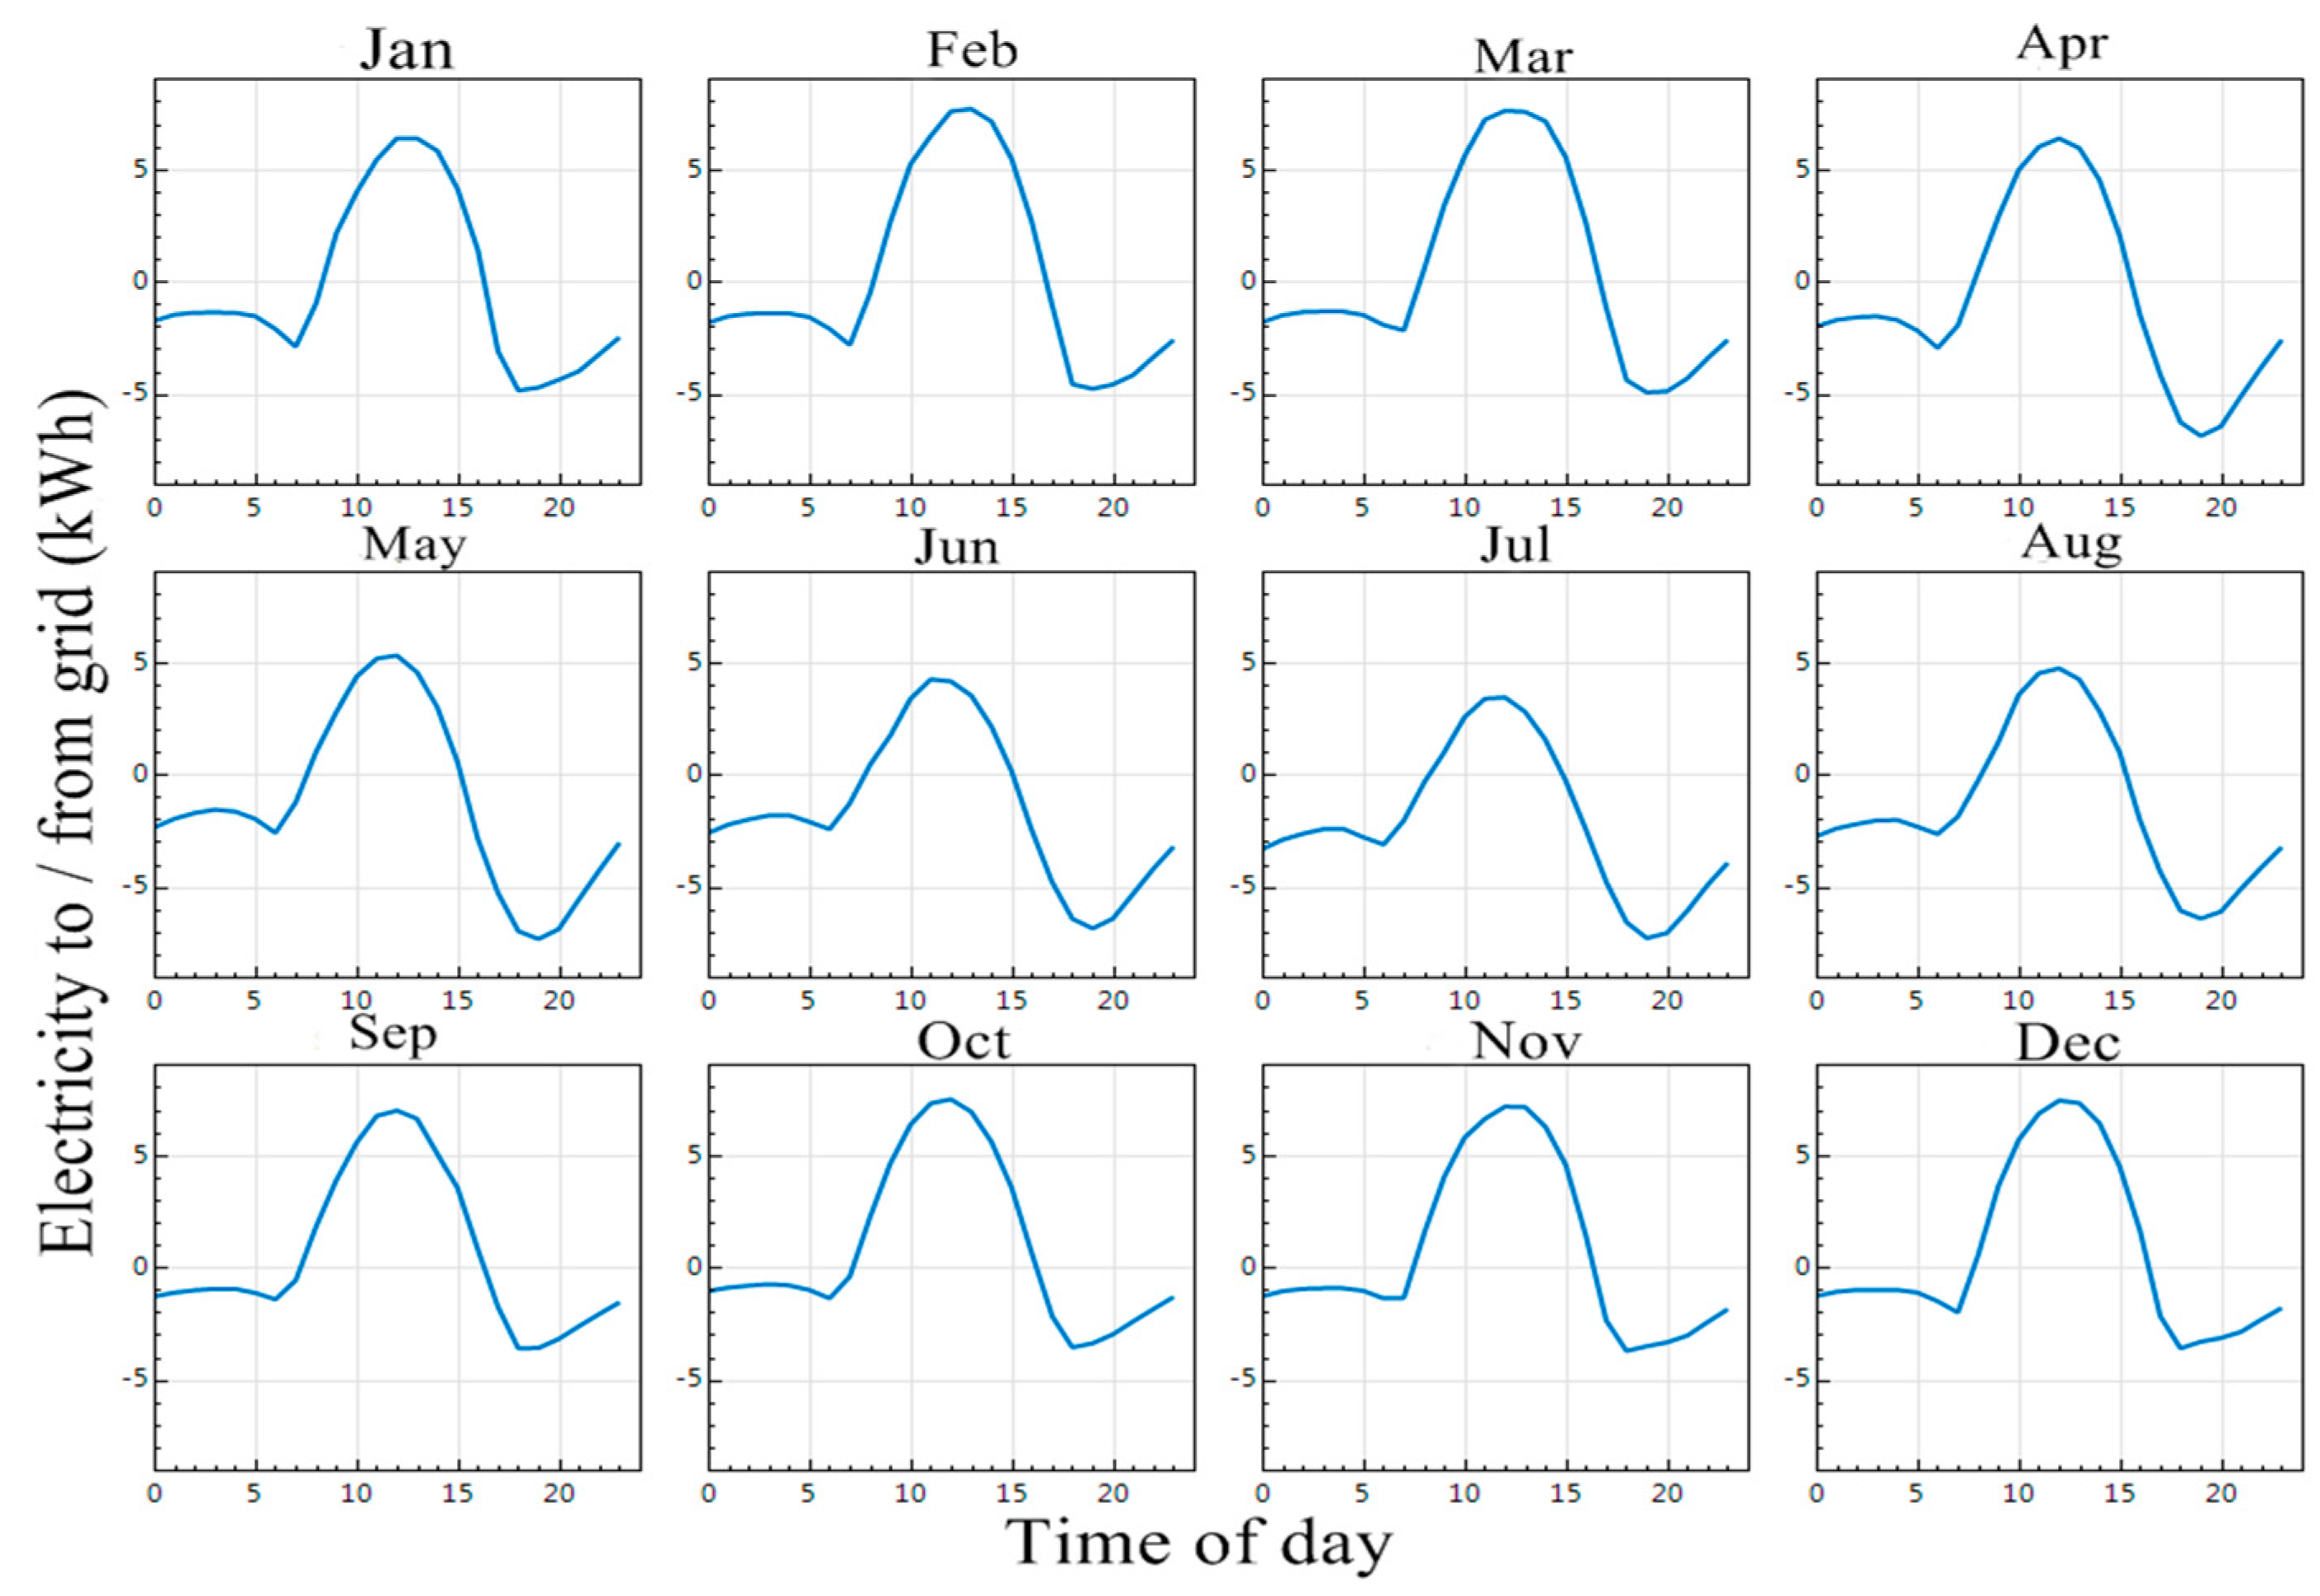
In Saudi Arabia, peak load demand occurs at midday on sunny days because of the wide use of air conditioners. Hence, the advantage of grid-connected PV system deployment plays an important role in relieving the distribution network, as the peak load demand coincides with the maximum solar radiation incidents [54]. In this case study, Figure 18 shows that the maximum energy injected into the utility grid always occurs during peak load demand hours, the negative sign power flow indicates that the energy flows from the utility grid to the customer, and vice versa. The time-of-use billing mechanism is investigated in this section to evaluate its preference over the current billing mechanism from the perspective of households.
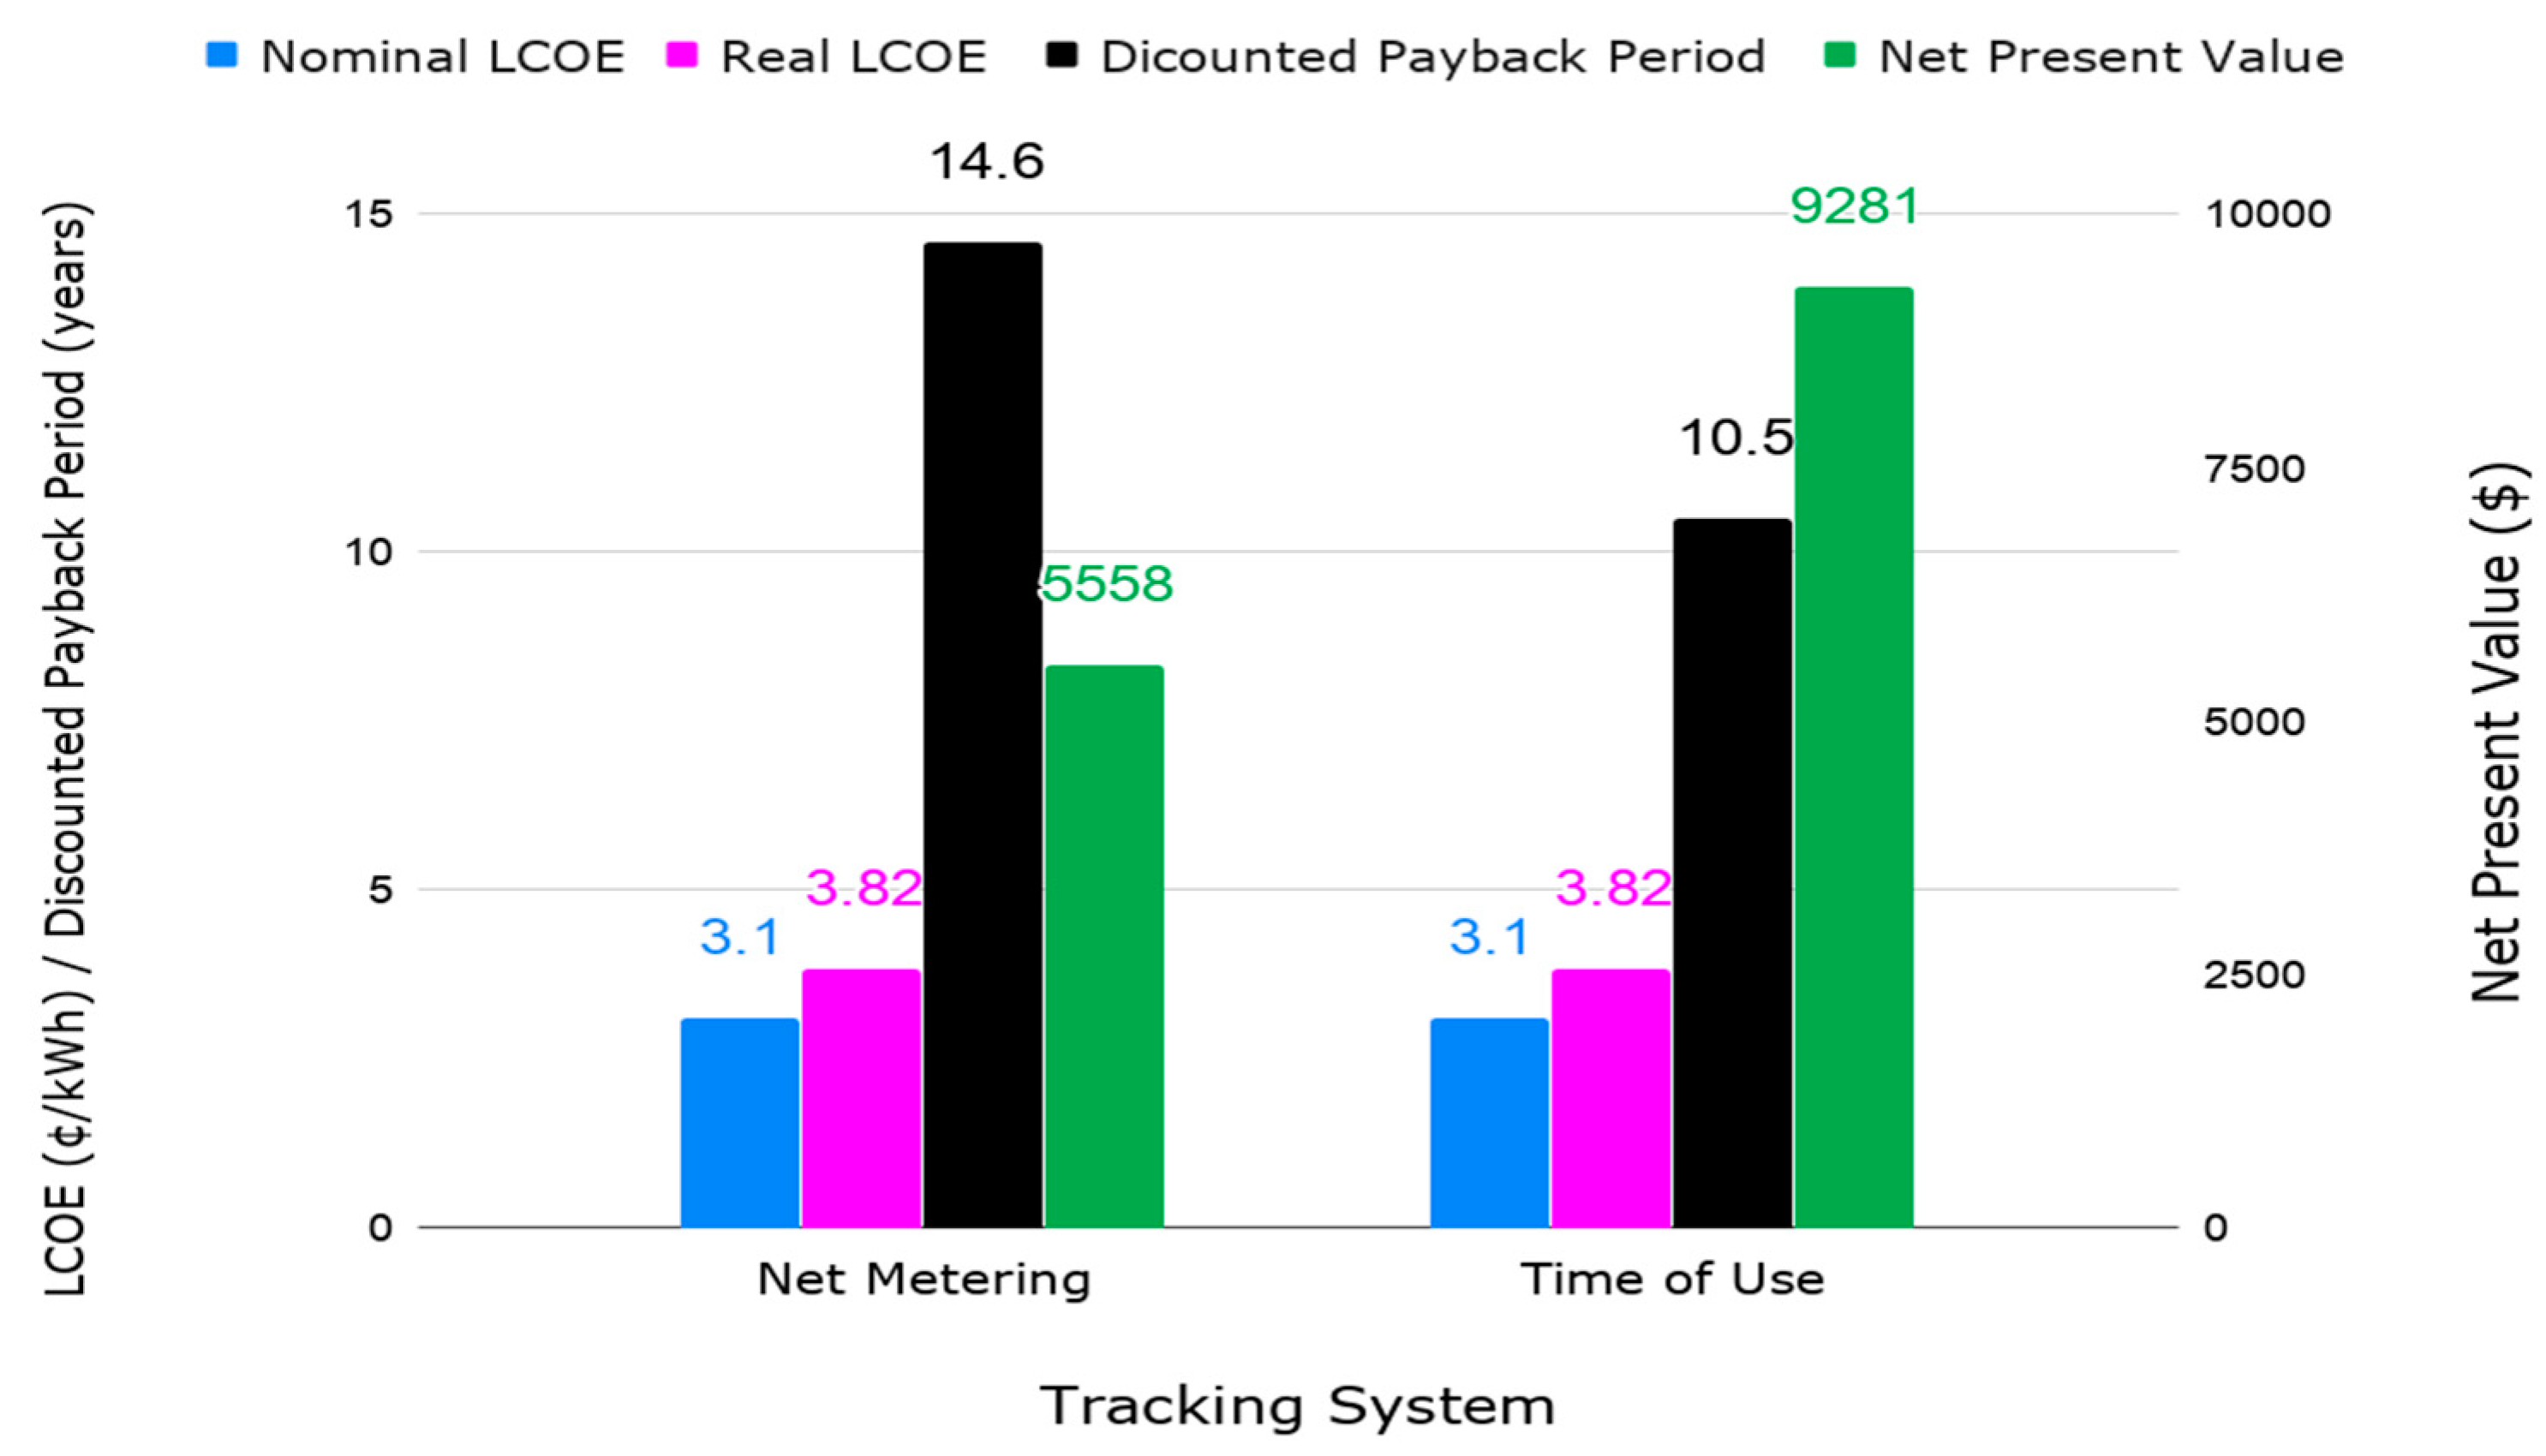
Figure 19 shows how the economic indicators respond to the implementation of the TOU mechanism. From these investigations, it is observed that the discounted payback period decreases to nearly 10.5 years, while NPV significantly increases to reach $9281, while LCOE remains unchanged. Hence, it can be inferred that the adoption of the TOU mechanism brings investors great economic benefit and, at the same time, can help to reduce the peak load demand.

4. Conclusions

Recently, Saudi Arabia has given more attention to renewable energy sources to gradually replace conventional energy conversion systems. In this regard, the government intends to encourage households to generate their own electricity by relying on renewable energy. Technically, photovoltaic power generation is the most applicable technique due to its stationary nature of operation and the high solar radiation potential in Saudi Arabia. In this paper, the techno-economic feasibility evaluation of a grid-connected solar PV system mounted on the rooftop of a residential building in Jeddah (21.4858° N, 39.1925° E), Saudi Arabia, is presented and analyzed. Several performance indicators, such as yield factors, net present value (NPV), internal rate of return (IRR), payback period, and a sensitivity analysis of the effects of the techno-economic parameters’ variation on system performance were considered for the assessment using the system advisor model (SAM), which is renewable energy modelling software.
The proposed PV system size is estimated to be 12.25 kWp of 35 mono-crystalline silicon modules, with a nominal power rating of 350 Wp per module, at 22% efficiency and with a 57 m2 total module area coupled with two inverters using a maximum of 10 kW of AC power. The system configuration includes five modules per string and seven parallel strings with a DC to AC ratio of 1.22. The lifetime of the PV modules is set at 25 years with a 0.5% degradation factor per year, while the inverter’s lifetime is set at 15 years, as stated in the manufacturer’s datasheets.
The technical results revealed the following:
  • The system’s total monthly energy production for the first year varied between 2173.25 kWh in March and 1785.49 kWh in December. The total system energy generated in the first year was 23,589 kWh, with an average energy production of 1965.72 kWh/month. The system’s lifetime total energy production was estimated to be 31,528,392.5 kWh, under the assumption of an annual reduction in energy yield due to an annual degradation of 0.5% in the output power of the PV modules. However, factors like cloudy weather in autumn and a short sunshine period and low solar irradiance in winter were found to affect the energy output in November and December, as well as in January and February, but high temperatures and soil losses due to dust accumulation did not have any appreciable effect on the energy yield in June.
  • The capacity factor (CF) of this system was found to be 22%, which is more reasonable than similar grid-connected systems in the GCC region, as found in the literature. The monthly capacity factor ranges between 23.85% in March and 19.59% in December.
  • The PV system’s annual performance ratio (PR) was estimated to be 78%. This was found to be low due to the high solar cell temperature at the site, which decreases solar cell efficiency.
Economic analysis resulted in the following findings:
  • The nominal and real LCOE is 0.0310 $/kWh and 0.0382 $/kWh. Both of these values are competitive with the electricity company tariff: 0.048 $/kWh for consumption up to 6000 kWh and 0.08 $/kWh for more than 6000 kWh.
  • The estimated NPV of the system over its lifetime is $4378, and its PBP is 14.6 years. Since the NPV is positive, the investor is earning money.
The key findings from the sensitivity analysis are the following:
  • It was found that a continuous two-axis tracking system outperforms other tracking systems in terms of productivity, with an additional 35.2% annual energy production relative to the system fixed at an optimum tilt angle. However, the costs of this tracking system outweigh its revenue. For example, this system has a negative NPV, and the values of LCOE exceed the electricity utility rates. Also, the optimum monthly adjustment tracking system results in an extended payback period, and the azimuth or vertical-axis tracking systems have no significant technical improvement. Thus, small-scale PV tracking systems were found not to be economically justifiable.
  • The interest rate and inflation rate were analyzed. It was found that Saudi Arabia’s inflation rate fluctuated from 3.5% to −1.8% between 2016 and 2019, and LCOE was also subjected to inflation rate variation. The LCOE exceeds the electricity utility rate up to 0.0505 $/kWh at a 4% inflation rate. The Saudi Arabian interest rate for 12-month maturity was in the range of 7% to 3% between 1997 and 2019, and the analysis proves that the investment is economically feasible for this range of interest rates.
  • The time-of-use billing (TOU) analysis revealed that the discounted payback period was decreased to nearly 10.5 years, while NPV was significantly increased to $9281, and LCOE remained unchanged. Hence, it can be inferred that the adoption of the TOU mechanism brings investors great economic benefit and, at the same time, can help in reducing the peak load demand.
In summary, it was found that 86.4% of the energy demand of a typical flat in the City of Jeddah can be generated by the proposed system. The energy yield, levelized cost of energy, and net present value indicate the satisfactory technical performance and economic viability of the system. A sensitivity analysis was performed to determine the optimum technical configuration and appropriate financial options that would obtain the maximum interest for households. The implementation of the solar PV tracking system shows that these tracking systems are technically feasible but not worthwhile from an economic point of view. Fluctuations in the economic parameters within the limits that Saudi Arabia has experienced do not pose risks to the economic viability of the project. Finally, the implementation of a time-of-use billing method can lead to significant economic benefits for investors.
This study can serve as a reference for similar solar energy projects, taking into account the differences in legislation and economic indicators for different countries. In addition, the installation cost of grid-connected solar photovoltaic (PV) systems has witnessed a rapid decline in recent years. Further investigations on the impact of the dynamic variations of solar electric power generation technology costs will be useful to help establish effective energy management schemes and policies that will orient energy production trends towards green and sustainable energy.
Author Contributions

Conceptualization, A.A.I.; Methodology, A.A.I., S.K.R., and Y.A.A.-T.; Software, A.A.I.; Validation, Y.A.A.-T. and S.K.R.; Formal analysis, A.A.I.; Resources, Y.A.A.-T. and S.K.R.; Writing—Original draft preparation, A.A.I.; writing—Review and editing, Y.A.A.-T. and S.K.R.; Supervision, Y.A.A.-T. and S.K.R.; Funding acquisition, Y.A.A.-T. and S.K.R. All authors have read and agreed to the published version of the manuscript.

Funding

This project was funded by the Deanship of Scientific Research (DSR), King Abdulaziz University, Jeddah, under grant No. (D1441-182-135). The authors, therefore, gratefully acknowledge DSR for their technical and financial support.

Acknowledgments

The first author would like to thank the deanship of graduate studies at King Abdul-Aziz University for the postgraduate scholarship.

Conflicts of Interest

The authors declare no conflict of interest.

References

  1. Barbir, F.; Veziroǧlu, T.; Plass, H., Jr. Environmental damage due to fossil fuels use. Int. J. Hydrogen Energy 1990, 15, 739–749. [Google Scholar] [CrossRef]
  2. Hoel, M.; Kverndokk, S. Depletion of fossil fuels and the impacts of global warming. Resour. Energy Econ. 1996, 18, 115–136. [Google Scholar] [CrossRef]
  3. Shafiee, S.; Topal, E. When will fossil fuel reserves be diminished? Energy Policy 2009, 37, 181–189. [Google Scholar] [CrossRef]
  4. Alfadda, A.; Rahman, S.; Pipattanasomporn, M. Solar irradiance forecast using aerosols measurements: A data driven approach. Sol. Energy 2018, 170, 924–939. [Google Scholar] [CrossRef]
  5. Salam, M.A.; Khan, S.A. Transition towards sustainable energy production—A review of the progress for solar energy in Saudi Arabia. Energy Explor. Exploit. 2018, 36, 3–27. [Google Scholar] [CrossRef]
  6. Senan, N.A.M. Financial markets and electricity consumption nexus in Saudi Arabia. Int. J. Energy Econ. Policy 2018, 8, 12–16. [Google Scholar]
  7. Toumi, S.; Toumi, H. Asymmetric causality among renewable energy consumption, CO2 emissions, and economic growth in KSA: Evidence from a non-linear ARDL model. Environ. Sci. Pollut. Res. 2019, 26, 16145–16156. [Google Scholar] [CrossRef]
  8. Electricity, E.; Co-Generation Regulatory Authority of Saudi Arabia. Electricity and Cogeneration Regulatory Authority Annual Report 2018; Co-Generation Regulatory Authority of Saudi Arabia: Riyadh, Saudi Arabia, 2018.
  9. Akinwale, Y.O. An empirical analysis of short run and long run relationships between energy consumption, technology innovation and economic growth in Saudi Arabia. Int. J. Energy Econ. Policy 2018, 8, 139–146. [Google Scholar]
  10. Bayomi, N.; Fernandez, J.E. Trends of energy demand in the Middle East: A sectoral level analysis. Int. J. Energy Res. 2018, 42, 731–753. [Google Scholar] [CrossRef]
  11. Almasoud, A.; Gandayh, H.M. Future of solar energy in Saudi Arabia. J. King Saud Univ. Eng. Sci. 2015, 27, 153–157. [Google Scholar] [CrossRef] [Green Version]
  12. Yahya, C.B.; El-Nakla, S.; Ouda, O.K.; Al-Taisar, F.; Al-Saif, S.; AlKhawaher, W. Smart Grid Technologies and Electricity Demand Management in KSA. In Proceedings of the 2018 Renewable Energies, Power Systems & Green Inclusive Economy (REPS-GIE), Casablanca, Morocco, 23–24 April 2018; pp. 1–5. [Google Scholar]
  13. Dehwah, A.H.; Krarti, M. Optimal Hybrid Power Energy Systems for Residential Communities in Saudi Arabia. J. Sol. Energy Eng. 2019, 141, 061002. [Google Scholar] [CrossRef]
  14. Shaahid, S.; Elhadidy, M. Economic analysis of hybrid photovoltaic–diesel–battery power systems for residential loads in hot regions—A step to clean future. Renew. Sustain. Energy Rev. 2008, 12, 488–503. [Google Scholar] [CrossRef]
  15. Aksakal, A.; Rehman, S. Global solar radiation in northeastern Saudi Arabia. Renew. Energy 1999, 17, 461–472. [Google Scholar] [CrossRef]
  16. Khan, M.; Asif, M.; Stach, E. Rooftop PV potential in the residential sector of the Kingdom of Saudi Arabia. Buildings 2017, 7, 46. [Google Scholar] [CrossRef]
  17. Pazheri, F.; Malik, N.; Al-Arainy, A.; Al-Ammar, E.; Imthias, A.; Safoora, O. Smart grid can make saudi arabia megawatt exporter. In Proceedings of the 2011 Asia-Pacific Power and Energy Engineering Conference, Wuhan, China, 25–28 March 2011; pp. 1–4. [Google Scholar]
  18. Alnaser, W.; Alnaser, N. The status of renewable energy in the GCC countries. Renew. Sustain. Energy Rev. 2011, 15, 3074–3098. [Google Scholar] [CrossRef]
  19. AlYahya, S.; Irfan, M.A. The techno-economic potential of Saudi Arabia’s solar industry. Renew. Sustain. Energy Rev. 2016, 55, 697–702. [Google Scholar] [CrossRef]
  20. Jeribi, F.; Hong, S. Solar Power and Electricity Market in Saudi Arabia. In Proceedings of the 2018 IEEE 16th International Conference on Software Engineering Research, Management and Applications (SERA), Kunming, China, 13–15 July 2018; pp. 7–12. [Google Scholar]
  21. ECRA. Laws & Regulations. Available online: https://.ecra.gov.sa/ (accessed on 16 April 2019).
  22. Lei, Y.; Lu, X.; Shi, M.; Wang, L.; Lv, H.; Chen, S.; Hu, C.; Yu, Q.; da Silveira, S.D.H. SWOT analysis for the development of photovoltaic solar power in Africa in comparison with China. Environ. Impact Assess. Rev. 2019, 77, 122–127. [Google Scholar] [CrossRef]
  23. Ismail, E.A.; Hashim, S.M. An Economic Evaluation of Grid Connected Photovoltaic System for a Residential House in Khartoum. In Proceedings of the 2018 International Conference on Computer, Control, Electrical, and Electronics Engineering (ICCCEEE), Khartoum, Sudan, 12–14 August 2018; pp. 1–6. [Google Scholar]
  24. Gautami, S.; Tiwari, R.; Vishwavidyalaya, B. A Survey on Smart Grid-Connected Photovoltaic Power Systems and Its Issues. IJOSTHE 2017, 4, 6. [Google Scholar] [CrossRef]
  25. Rehman, S.; Ahmed, M.; Mohamed, M.H.; Al-Sulaiman, F.A. Feasibility study of the grid connected 10 MW installed capacity PV power plants in Saudi Arabia. Renew. Sustain. Energy Rev. 2017, 80, 319–329. [Google Scholar] [CrossRef]
  26. Anwari, M.; Hiendro, A. Performance analysis of PV energy system in western region of Saudi Arabia. Engineering 2013, 5, 62–65. [Google Scholar] [CrossRef]
  27. Almarshoud, A. Technical and Economic Performance of 1MW Grid-connected PV system in Saudi Arabia. Int. J. Eng. Res. Appl. 2017, 7, 9–17. [Google Scholar] [CrossRef]
  28. Awan, A. Feasibility and Estimation of Technical Potential and Calculation of Payback Period of Roof-Top Solar PV System in the City of Majmaah, Province of Riyadh, K.S.A. J. Energy Nat. Resour. 2016, 5, 12. [Google Scholar] [CrossRef] [Green Version]
  29. Okello, D.; Van Dyk, E.; Vorster, F. Analysis of measured and simulated performance data of a 3.2 kWp grid-connected PV system in Port Elizabeth, South Africa. Energy Convers. Manag. 2015, 100, 10–15. [Google Scholar] [CrossRef]
  30. Sharma, V.; Chandel, S. Performance analysis of a 190 kWp grid interactive solar photovoltaic power plant in India. Energy 2013, 55, 476–485. [Google Scholar] [CrossRef]
  31. Ayompe, L.; Duffy, A.; McCormack, S.; Conlon, M. Measured performance of a 1.72 kW rooftop grid connected photovoltaic system in Ireland. Energy Convers. Manag. 2011, 52, 816–825. [Google Scholar] [CrossRef] [Green Version]
  32. Kymakis, E.; Kalykakis, S.; Papazoglou, T.M. Performance analysis of a grid connected photovoltaic park on the island of Crete. Energy Convers. Manag. 2009, 50, 433–438. [Google Scholar] [CrossRef]
  33. Padmavathi, K.; Daniel, S.A. Performance analysis of a 3 MWp grid connected solar photovoltaic power plant in India. Energy Sustain. Dev. 2013, 17, 615–625. [Google Scholar] [CrossRef]
  34. Sidrach-de-Cardona, M.; Lopez, L.M. Evaluation of a grid-connected photovoltaic system in southern Spain. Renew. Energy 1998, 15, 527–530. [Google Scholar] [CrossRef]
  35. Pietruszko, S.; Gradzki, M. Performance of a grid connected small PV system in Poland. Appl. Energy 2003, 74, 177–184. [Google Scholar] [CrossRef]
  36. Milosavljević, D.D.; Pavlović, T.M.; Piršl, D.S. Performance analysis of A grid-connected solar PV plant in Niš, republic of Serbia. Renew. Sustain. Energy Rev. 2015, 44, 423–435. [Google Scholar] [CrossRef]
  37. El-Shimy, M. Viability analysis of PV power plants in Egypt. Renew. Energy 2009, 34, 2187–2196. [Google Scholar] [CrossRef]
  38. Tarigan, E.; Djuwari, D.; Kartikasari, D. Techno-Economic Simulation of a Grid-Connected PV System Design as Specifically Applied to Residential in Surabaya, Indonesia. Energy Procedia 2015, 65, 90–99. [Google Scholar] [CrossRef] [Green Version]
  39. Bakos, G.C.; Soursos, M.; Tsagas, N.F. Technoeconomic assessment of a building-integrated PV system for electrical energy saving in residential sector. Energy Build. 2003, 35, 757–762. [Google Scholar] [CrossRef]
  40. Shalwala, R.; Bleijs, J. Impact of Grid-Connected PV systems on voltage regulation of a residential area network in Saudi Arabia. In Proceedings of the 2010 1st International Nuclear & Renewable Energy Conference (INREC), Amman, Jordan, 21–24 March 2010; pp. 1–5. [Google Scholar]
  41. Shalwala, R.; Bleijs, J. Impact of Grid-Connected PV systems in residential areas in Saudi Arabia. In Proceedings of the 2009 44th International Universities Power Engineering Conference (UPEC), Glasgow, UK, 1–4 September 2009; pp. 1–5. [Google Scholar]
  42. Blair, N.; DiOrio, N.; Freeman, J.; Gilman, P.; Janzou, S.; Neises, T.; Wagner, M. System Advisor Model (SAM) General Description (Version 2017.9.5); National Renewable EnergyLaboratory Technical Report; National Renewable EnergyLaboratory: Golden, CO, USA, 2018.
  43. Statistics, G.A.F. Housing Bulletin 2018; General Authority for Statistics: Riyadh, Saudi Arabia, 2018.
  44. Felimban, A.; Prieto, A.; Knaack, U.; Klein, T.; Qaffas, Y. Assessment of Current Energy Consumption in Residential Buildings in Jeddah, Saudi Arabia. Buildings 2019, 9, 163. [Google Scholar] [CrossRef] [Green Version]
  45. Taleb, H.M.; Sharples, S. Developing sustainable residential buildings in Saudi Arabia: A case study. Appl. Energy 2011, 88, 383–391. [Google Scholar] [CrossRef]
  46. Dawood, N.; Vukovic, V. Energy Efficiency in Residential Buildings in the Kingdom of Saudi Arabia. In Building Information Modelling, Building Performance, Design and Smart Construction; Springer: Berlin, Germany, 2017; pp. 129–143. [Google Scholar]
  47. Alrashed, F.; Asif, M. Trends in residential energy consumption in Saudi Arabia with particular reference to the Eastern Province. J. Sustain. Dev. Energy Water Environ. Syst. 2014, 2, 376–387. [Google Scholar] [CrossRef] [Green Version]
  48. Al-Ghamdi, S.A.; Alshaibani, K. The potential of solar energy in Saudi Arabia: The residential sector. J. Eng. Archit. 2017, 5, 32. [Google Scholar] [CrossRef] [Green Version]
  49. Matar, W. Modeling Residential Electricity Consumption and Efficiency within an Economic Framework: Insights Gained by Using an Engineering-Based Approach; King Abdullah Petroleum Studies and Research Center: Riyadh, Saudi Arabia, 2015. [Google Scholar]
  50. IRENA, I. Renewable Power Generation Costs in 2018; International Renewable Energy Agency: Abu Dhabi, UAE, 2019. [Google Scholar]
  51. SAMA. Economic Reports and Statistics. Available online: http://sama.gov.sa/ (accessed on 23 April 2019).
  52. KAPSARK. Explore 1258 Datasets. Available online: https://datasource.kapsarc.org/ (accessed on 23 April 2019).
  53. SEC. Tariffs & Connection Fees. Available online: https://se.com.sa/ (accessed on 16 April 2019).
  54. Newsham, G.R.; Bowker, B.G. The effect of utility time-varying pricing and load control strategies on residential summer peak electricity use: A review. Energy Policy 2010, 38, 3289–3296. [Google Scholar] [CrossRef] [Green Version]
  55. Oladigbolu, J.O.; Ramli, M.A.; Al-Turki, Y.A. Techno-Economic and Sensitivity Analyses for an Optimal Hybrid Power System Which Is Adaptable and Effective for Rural Electrification: A Case Study of Nigeria. Sustainability 2019, 11, 4959. [Google Scholar] [CrossRef] [Green Version]
  56. Commission, E. PVGIS-SARAH Rolar Radiation Data. Available online: https://re.jrc.ec.europa.eu/ (accessed on 11 April 2019).
  57. Awan, A.B. Optimization and techno-economic assessment of rooftop photovoltaic system. J. Renew. Sustain. Energy 2019, 11, 033501. [Google Scholar] [CrossRef]
  58. Reich, N.H.; Mueller, B.; Armbruster, A.; Van Sark, W.G.; Kiefer, K.; Reise, C. Performance ratio revisited: Is PR > 90% realistic? Prog. Photovolt. Res. Appl. 2012, 20, 717–726. [Google Scholar] [CrossRef]
  59. Chioncel, C.P.; Kohake, D.; Augustinov, L.; Chioncel, P.; Tirian, G.O. Yield factors of a photovoltaic plant. Acta Tech. Corviniensis Bull. Eng. (Fasc.) 2010, 2, 63–66. [Google Scholar]
  60. Abu-Rumman, A.K.; Muslih, I.; Barghash, M.A. Life Cycle Costing of PV Generation System. J. Appl. Res. Ind. Eng. 2017, 4, 252–258. [Google Scholar] [CrossRef]
  61. Drury, E.; Denholm, P.; Margolis, R. Impact of Different Economic Performance Metrics on the Perceived Value of Solar Photovoltaics; National Renewable Energy Lab. (NREL): Golden, CO, USA, 2011.
  62. Kaddoura, T.O.; Ramli, M.A.; Al-Turki, Y.A. On the estimation of the optimum tilt angle of PV panel in Saudi Arabia. Renew. Sustain. Energy Rev. 2016, 65, 626–634. [Google Scholar] [CrossRef]
  63. Sedraoui, K.; Ramli, M.A.; Mehedi, I.M.; Hasbi, M.; Hiendro, A. Optimum orientation and tilt angle for estimating performance of photovoltaic modules in western region of Saudi Arabia. J. Renew. Sustain. Energy 2017, 9, 023702. [Google Scholar] [CrossRef]
  64. Kazem, H.A.; Khatib, T. Techno-economical assessment of grid connected photovoltaic power systems productivity in Sohar, Oman. Sustain. Energy Technol. Assess. 2013, 3, 61–65. [Google Scholar] [CrossRef]
  65. Hajiah, A.; Khatib, T.; Sopian, K.; Sebzali, M. Performance of grid-connected photovoltaic system in two sites in Kuwait. Int. J. Photoenergy 2012, 2012, 178175. [Google Scholar] [CrossRef] [Green Version]
Figure 1. Solar map of Saudi Arabia [16].
Sustainability 12 00262 g001
Figure 2. Load profile.
Sustainability 12 00262 g002
Figure 3. Schematic diagram of a grid-connected PV system.
Sustainability 12 00262 g003
Figure 4. Time series data of GHI [56].
Sustainability 12 00262 g004
Figure 5. Time series data of ambient temperature [56].
Sustainability 12 00262 g005
Figure 6. Monthly average solar irradiance in Jeddah [56].
Sustainability 12 00262 g006
Figure 7. Monthly optimum tilt angle (a) January–June; (b) July–December.
Sustainability 12 00262 g007
Figure 8. Monthly optimum tilt angle rapprochement.
Sustainability 12 00262 g008
Figure 9. Annual optimum tilt angle.
Sustainability 12 00262 g009
Figure 10. Monthly energy yield.
Sustainability 12 00262 g010
Figure 11. Lifetime energy yield.
Sustainability 12 00262 g011
Figure 12. Monthly production and load demand.
Sustainability 12 00262 g012
Figure 13. Monthly capacity factor.
Sustainability 12 00262 g013
Figure 14. Temperature impact on the PV cell efficiency: (a) Jeddah; (b) Dublin.
Sustainability 12 00262 g014
Figure 15. Annual energy production under different tracking systems.
Sustainability 12 00262 g015
Figure 16. Inflation rate variability.
Sustainability 12 00262 g016
Figure 17. Interest rate variability.
Sustainability 12 00262 g017
Figure 18. Energy from/to the grid.
Sustainability 12 00262 g018
Figure 19. Impact of the TOU billing mechanism.
Sustainability 12 00262 g019
Table 1. Monthly energy consumption in 2018.
MonthConsumption (kWh)
January1958.333
February1770.833
March1958.333
April2687.500
May3125.000
June3104.167
July3625.000
August3062.500
September1583.333
October1500.000
November1395.833
December1416.667
Table 2. Physical characteristics of a typical solar PV module and Inverter [42].
ComponentSpecifications
1. PV module
Nominal efficiency21.49%
Maximum power (Pmp)349.816 Wdc
Maximum power voltage (Vmp)58.4 Vdc
Maximum power current (Imp)6.0 Adc
Open circuit voltage (Voc)68.7 Vdc
Short circuit current (Isc)6.4 Adc
2. Inverter
Efficiency96.318%
Maximum AC power5000 Wac
Maximum DC power 5190.29 Wdc
Power consumption during operation32.0358 Wdc
Power consumption at night 1.5 Wac
Nominal AC voltage240 Vac
Maximum DC voltage480 Vdc
Table 3. Cost estimate and financial parameters.
Cost Estimate [50]
System ComponentsQuantityCost ($)
Module354897.42
Inverter21346.79
Balance of system equipment1958.970
Installation2326.280
Total10,529.46
Financial Parameters [51,52]
ParameterAmount (%)
Inflation rate−1.80
Real discount rate2.50
Nominal discount rate4.57
Income tax rate0.00
Sales tax5.00
Table 4. Electricity tariff structure in Saudi Arabia [53].
Monthly kwhBuy/Sell$/kwh
1–6000buy0.048
sell0.048
More than 6000buy0.080
sell0.048
Table 5. Proposed TOU tariff structure.
TOUBuy ($/kWh)Sell ($/kWh)
5 PM–11 AM0.0480.048
12 PM–4 PM0.0800.080
Table 6. Financial indicators.
IndicatorValue
LCOE (nominal)0.0310 $/kWh
LCOE (real)0.0382 $/kWh
Electricity bill without system (year 1)$1305
Electricity bill with system (year 1)$173
Net saving with system (year 1)$1132
NPV$4378
Simple payback period13.8 years
Discounted payback period14.6 years
Net capital cost$10,529
Equity$0
Loan$10,529
Table 7. Impact of tracking systems on the financial indicators.
Type of Tracking SystemEconomic Indicator
Discounted Payback Period (Year)NPV ($)Nominal LCOE ($/kWh)Real LCOE ($/kWh)
Fixed14.60543780.0310.038
Horizontal-axis monthly adjustmentExceeds the project’s lifetime−22660.0440.054
Horizontal-axis continuous adjustmentExceeds the project’s lifetime−21070.04280.053
Vertical-axis continuous adjustment15.93343670.03230.040
2-axis continuous adjustmentExceeds the project’s lifetime−25890.04330.054