Article

Real Estate Industry as an Urban Growth Machine: A Review of the Political Economy and Political Ecology of Urban Space Production in Mexico City

by
Gian Carlo Delgado Ramos
Center for Interdisciplinary Research in the Sciences and Humanities, National Autonomous University of Mexico, Mexico City 04510, Mexico
Sustainability 2019, 11(7), 1980; https://doi.org/10.3390/su11071980
Submission received: 16 February 2019 / Revised: 25 March 2019 / Accepted: 27 March 2019 / Published: 3 April 2019

Abstract

:
Cities concentrate the means of production, wealth, political power, infrastructure, educational institutions, and a relevant share of our cultural heritage. As such, they are seen as places of opportunities. Contemporary urbanization, however, being central to the accumulation of capital, has also escalated environmental problems that are usually suffered by the urban poor due to an uneven production of urban space. Mexico City is not an exception. It has mainly expanded through a lively auto-construction process and, more recently, under the incentive of a speculative urban development. The first trend reinforces the informal housing sector, in certain cases, involving significant environmental implications such as the degradation of land of ecological value. The second trend responds to capital accumulation dynamics, promoting urban renewal in central areas or where a greater potential rent-gap exists, underpinning the uneven production of urban space, and usually withholding most of its related socioenvironmental impacts. This paper focusses on this second process. It assesses the so-called “urban growth machine” in action, its socioecological impacts, and related contestation processes. With that in mind and after a general introduction and a brief description of urban development in Mexico, the real estate industry in Mexico City is evaluated in terms of the potential ecological implications of the building stock expansion from 2012 to 2018. A spatial distribution analysis of contestation processes, correlated to such urban expansion, is presented as well. The case study confirms what has been learned in other locations of the Global South, where a contradictory and uneven process of urban development has also been experienced under the stimulus of capital speculation. The paper, however, offers a novel approach by bringing together urban political economy, industrial ecology and urban political ecology analytical tools. Such hybridization, it is argued, enables a more comprehensive understanding of contemporary urbanization and its socioenvironmental impacts, which in turn is central to any effort for urban transformation.

1. Introduction

The production of urban space is highly tied to the rationality and stage of development of the means of production and reproduction of life, a logic that certainly shapes land use, economic function and structure, governance systems, and even the configurations and scale of potential urban conflicts. Accordingly, under the current mode of production, land has become a fictitious form of capital that derives from expectations of future rents [1,2,3], a feature that places urban land as an epicenter of capital accumulation. Such a process takes place unevenly in long working periods and turnover times, as not all urban land and its corresponding built environment has the same potential in any given period of time, and because of the different lifetimes of most investments.
Brenner et al [4] have correctly stated that cities are not only arenas in which commodification occurs, “…they are themselves intensively commodified insofar as their constitutive sociospatial forms are sculpted and continually reorganized in order to enhance the profit-making capacities of capital.” Such capacities have in fact reached to a point where the value of all developed real estate worldwide already represents 58% of total global assets, including equities, securitized debt and gold, according to data from 2015 [5]. See Table 1 for additional details.
As property market dynamism increasingly becomes intertwined with speculative financial flows, urban space is thus shaped and reshaped under the stimulus of capital overaccumulation and the need to absorb surplus, a process that ironically can be a source of economic macro crises as much as the share of the property market in the gross domestic product (GDP) increases [3]. The global economic crisis of 2008 was indeed a reminder of this type of outcome, which may occur again as the expansion of urban assets keeps escalating in countries like China [5,6,7].
In this context, Mexico is certainly not excluded from urban development and speculation despite being a highly urbanized country since the 1960s when, for the first time, 50.7% of its population lived in a city (officially defined as a settlement of more than 15 thousand inhabitants). Cities formation in Mexico went from 33 at the beginning of the 1900s to 174 in the 1970s, all the way to 401 cities which comprised the so-called National Urban System in 2018 [8,9]. A similar trend has marked the configuration of metropolitan areas [10], as Table 2 summarizes.
Currently, 92.6 million inhabitants, or 74.2% of Mexico’s total population is urban and estimations suggest that it might reach up to 82% by 2050 and 88% by the year 2100 [11]. Such vibrant urbanization has been encouraged by both economic dynamics (international, national and subnational ones) and a greater infrastructural development and interconnectivity which has been reinforced by the creation, in 2006, of a Metropolitan Federal Fund. Investment in infrastructure through such a fund has increased a thousand percent since its creation, with more than a half of the funding being allocated to Mexico City’s Metropolitan Area [12], by far the largest urban settlement in the country.
With 21.8 million inhabitants, the urban footprint of Mexico City Metropolitan Area, presently reaching 2359 km2 [13], is a consequence of a dual process. First, this process entailed a period of accelerated growth fomented by rural-to-urban migration under an input-substitute trade policy that progressed a convergence of Mexico’s regional economy [14] and, secondly, a phase occurred under the stimulus of neoliberal policies that at the regional level encouraged urban development, mainly in the most dynamic and internationally integrated urban settlements, meaning those that have been able to capture most foreign direct investment (FDI) [15].
In that context, the urban built environment has acutely expanded in cities like Monterrey, Guadalajara, Tijuana, and Querétaro which have been active in capturing national investments and FDI. It has expanded as well in Mexico City—and its metropolitan area—where, despite still being the largest recipient of FDI, its weight at the national level has decreased since the early 2000s. FDI in Mexico City dropped from 49.4 percent in 2000 to 21 percent in 2016, or from about 51% to 26% if accounted for at a metropolitan scale. The correlation between economic dynamics and urban development is in line with the findings of international comparative analyses and Mexican study cases [16,17]. What is noticeable of the Mexico City Metropolitan Area, as well as of other megalopolises, is that the expansion of the built environment has occurred several times faster than population growth: while the population of Mexico City Metropolitan Area grew 33 percent from 1980 to 2017, the built environment increased by 380 percent [13].
Contrary to what would be expected from neoliberal mainstream discourses, the role of the State in favoring such urbanization dynamism has been palpable. On one hand, this occurred through a suitable regulatory framework, from the liberalization of FDI (in 1994) to the reform and expansion of the housing finance system (also starting in the early 1990s). On the other, this process was facilitated through public spending for, either, a diversity of infrastructure projects (like those being sponsored by the National Infrastructure Fund—FONADIN) or provident funds for housing, like FOVISSSTE and INFONAVIT programs.
In fact, public infrastructure spending and public provident funds have been central in the aftermath of the global financial crisis of 2008 [18], which had a significant impact on the housing sector (its value plunged from MX$875,937 million pesos in 2008, to MX$489,837 million pesos in 2009 [19]). Provident funds issued by FOVISSSTE and INFONAVIT, represented 80% of all home loans in 2009 and since then their share in the mortgage market has increased to 83.8%, according to 2018 data [20]. That active role of the State not only cushioned the crisis impacts on the housing sector, but moreover, of the construction sector which, in contrast, found in public spending an opportunity to grow: from 2006 to 2018, it doubled the sector’s total value generation, being the segment of buildings, which includes offices, retail and shopping centers, the most dynamic [21]. See Figure 1 for further details.
The role of private capital in the production of urban space, once the market began to recover, has been improved through, for example, investment and real estate trusts that have paved the way for real estate projects on industrial parks, shopping centers, office and residential buildings. Real estate investment trusts, or “FIBRAs”, have been particularly active besides the more recent evolution of capital development certificates and investment project fiduciary securitization certificates; the latter is an instrument that was only created in 2016. By January 2018, real estate investment trusts listed at the Mexican Stock Exchange reached a total market capitalization of 251 billion pesos or 14% of Mexico’s GDP in 2017, managing more than 21 million square meters of built space [22]. The largest real estate investment trust was FUNO 11 (Deutsche Bank Mexico) which controlled 44% of total market capitalization, followed by DANHOS 13 (Banamex/Citybank) with 16.7% of total market capitalization [22].
It should be noted that, since urban speculation is cyclical, current expansion of the built environment in Mexico has responded to different reasons, not all precisely the same or in the same condition as in the aftermath of the Mexican economic crisis of 1994 [23]. Current urban speculation can be noticed by the fact that price increases have been occurring in a time frame in which regulatory and economic conditions—including public investment and mortgages—have encouraged the construction of new buildings and urban infrastructure quickly [24]; the latter an anticyclical economic measure implemented in the face of the impacts of the 2008 global financial crisis.
Such expansion of the built environment took place not only in certain cities capable of attracting investments, but through two markedly differentiated, but complementary, housing markets that are possible due to a highly uneven distribution of income. On one hand, one market involving low-cost units and mostly depending on the availability of low-cost land and on the prevailing mortgage market structure and dynamism, as it affects the type of housing supply, defines mortgage access, and even delineates the vacancy phenomenon (in the case of Mexico along with migration, drug war and insecurity issues [25]). On the other, a market focused on developing mid- to high cost units that are bought for living and as saving-assets that can be leased. This second type of market is particularly supported by the possibility of increasing housing supply in centric locations, either in current high valued urban areas or those subject to gentrification. For those settlements where land availability is scarce, like in Mexico City, urban speculation has been based on the expectation of a development barrier in the near future, which generates price increases on land [24]; the later encouraging both real estate speculation through vertical urbanization in centric areas, and urban sprawl [26].
While the first type of market responds, among other factors, to the demand for a place to live that in addition can offer low income families certain material stability in the future, the second one, in addition to supplying a home for mid- to high income families, also meets the demand of such social actors for accumulating assets that may generate certain additional earnings by renting “second homes” (which in Mexico City, as described below, are mostly apartments). In that context, location, connectivity, urban amenities, and public security are key aspects for high valued properties and attractive leasing prices (including those of temporary leasing such as the ones promoted by well-known internet web-sites). In addition to the behavior of interest rates and construction costs, other pressures on the real estate market can also derivate from transactions motivated by buying and selling existing properties for short-term gains [27,28], yet further and more detailed studies on this last issue are still needed for the case of Mexico.
In any case, all of the above explains why Mexico City is the most expensive city in the country for both buying and renting, but also why almost two thirds of mortgage loans have been allocated for buying a new home or apartment; instead for auto-construction or improving already owned properties [29], which for the most part are actually occupied by the owners or their families.
Urban speculation may also be explained by the expansion of industrial and office space, which, as stated, responds to the ability of certain cities to capture national and international investments, aside from other issues such as a successful urban branding. Accordingly, an expansion on the surface and number of industrial parks and office space for national and international companies has been verified. While Queretaro is a clear case in point for the former case, Mexico City is for the latter as 60% of Mexico’s 500 largest companies headquarters are located there (both national and international). As in the case of retail space, a sector with a potential to growth in Mexico given its relative low density (per capita retail space in the country is of about 1 m2, of which 0.15 m2 corresponds to shopping center gross leasable area [30]), office space is increasingly built under the expectation of being leased. Capitals dedicated to retail activities, but also multinational companies, are no longer building or buying a fair part of the built space they need as it constrains their mobility (unless when owning means more stability and security for their operations or if such properties play the role of a showcase asset, in which LEED certified properties become the norm). Instead they are leasing, which triggers a speculative market because capitals are focused on property rental, encouraging the expansion of the built environment under the expectation of increasing profits and causing an oversupply. As mentioned, a similar pattern can also be observed for the case of commercial built space.
In short, urban speculation, as understood in this paper, concerns a diversity of built space and market logics and cycles, with perhaps the housing market in Mexico being the one that may differ the most from other cases of the Global North, because of the heavy role of the State in the mortgage market, the prevalence of auto-construction practices, the limited planning practices, the uneven distribution of income and the informality, among other aspects. Accordingly, there are more similarities with Manila’s speculative urbanization [31] or the uneven development based on the financialization of urban redevelopment projects in Brazil [32].
The following section further contextualizes the case of Mexico City, which has played a central role in the national real estate market as it is the major recipient of FDI in the country (as said, 21% of the total); generates an important share of the national GDP (about 17%); and offers among the best paid jobs in the country from a total of 4.1 million formal jobs, or 7.8% of formal employment nationwide. All those aspects, as said, have a relevant influence on the real estate market and speculation practices, meaning those that consider the returns to capital as their primary driving force and metric.

2. Contextualizing the Case Study

Functional regulations, public investments and incentives (that represented about the half of total spending on urban development and housing [33]), but mostly, speculative private investments, have been the backbone of a noticeable formal expansion of the built environment during the previous government administration in Mexico City. The focus of this case study circumscribes to the formal expansion of the built environment from 2012 to 2018.
The well-known peripheral urban expansion, that includes the informal occupation of land of social property and ecological value, has continued despite the implementation of certain measures such as the so-called “Bando 2”, a political measure that was intended to limit urban sprawl in ten of the sixteen municipalities that comprise Mexico City [34,35,36,37]. It is true, though, that due to the low availability of land within Mexico City and its high prices, most of the formal low-cost peripherical urban growth has progressively moved to the metropolitan area borderlines [38,39,40]. Notwithstanding that both the informal expansion and formal peripheral metropolitan expansion of the built environment are relevant for understanding urban space sprawling and its implications [41,42], this paper focuses on the formal expansion of the built environment within the Mexico City administrative boundaries. The purpose of such delimitation: to grasp the emergent logic and dynamic of a more intense speculative urban space production in Mexico City that promotes urban renewal in central areas or where a greater potential rent-gap exists; a process enabled, as it has been pointed out, through profound reforms to the country’s housing finance system that differ from the incremental building traditional process that includes informal auto-construction [43].
Despite the expansion of housing has been fundamentally provided through government provident funds (only available to individuals with a formal job), urban space configuration still is highly unequal. In Mexico City, what Rossi and Vanolo [44] describe as “urban neoliberalism” has encouraged land use changes and strengthen sociospatial inequalities, while increasing current and future vulnerabilities and environmental impacts due to inadequate land planning. It has also fostered the advancement of “urban renewal” policies and programs; endorsed public-private infrastructure projects; and promoted the participation of private consultants in planning and managing the city while eroding its own capacities; actions that occurred in addition to other stances such as the advancement of public space privatization. The latter, for example, through the concession of public space for commercial and advertisement purposes (a case in point is an “urban renewal program” that has privatized, through 10-year concessions, the space under the city’s bridges [45]). Some have pointed out that urban neoliberalism in Mexico has even managed to create a revolving door phenomenon between the real estate industry and Miguel Angel Mancera’s government (2012–2018) [46,47].
During such an administration, in fact the real estate market was particularly active, profiting from local regulations such as the so-called “transfer of urban development potential” which allowed the sector to build beyond the existing norms in certain areas of the city −such as commercial hotspots or corridors, financial districts, etcetera—in exchange for a fee [48]. Other mechanisms used included a (discretionary) delimitation of urban polygons for private-public renewal, or the presently impeded measure “Norma de Ordenación 26” [49] that allowed the sector to bend land use codes in order to foster private investments in low-cost housing (which in several cases resulted in house units that actually were far from being affordable).
Data from the Association of Real Estate Developers (ADI), which have operations all over the country, reveals that in fact Mexico City was an investment hotspot for the urban growth machine during 2012 and 2018. From a total investment value of about 36 billion dollars in 583 projects which totalized 65 million square meters, 42.9% of such value was allocated to 156 projects in Mexico City, adding up 20.4 million square meters [50].
As it is exposed by the findings of this paper, capital accumulation through urbanization in Mexico City, led by ADI’s and other high-return investments, has had a notorious geographical specificity, on one hand, of the production of urban space and its implications, and on the other, of spatial monopolies [3]. The benefits and costs of such processes have been unevenly distributed, and their accumulation has created “durable differences among places” [51] (pp. vii) and their inhabitants. Such durable differences have not been fully studied in the case of Mexico City, particularly those of an ecological kind. Likewise, and equally to other places experiencing intense “implosion-explosion” urbanization processes [6,52,53,54], negative implications and perceptions that have animated a diversity of contestation movements need to be further studied. In that sense, and in order to better appraise the prevailing struggle for a “right” to the city, meaning, the right to decide the function or the purpose of the urban space, including who benefits and who bears its negative effects [2,3,4,55], urban political ecology has been incorporated to the present analysis in order to reveal if there is actually a correlation between urban development and its implications, on one hand, and the liveliness of urban grassroot movements, on the other [56,57].
Considering the above said and with the objective of offering a broader understanding of urban growth implications, but also of assisting evaluation methodologies that can enrich urban socioenvironmental urban policy (and politics), this paper evaluates the intensity of the built environment expansion in Mexico City from 2012 to 2018, exposing its uneven nature. It also assesses the related socioecological impacts in terms of demolition debris and construction waste; the carbon footprint of key construction materials; and the potential consumption of water and energy. Finally, it spatially analyzes contestation processes in terms of public complaints related to alleged land use violations and illegal or inadequate construction activities.

3. Materials and Methods

Data on location and extent (m2 built) of new real estate projects was obtained from local governments using a legal mechanism to access public information. Requests for public information on building permits were carried out for all 16 local governments that comprise Mexico City during August–September, 2016 and April–September, 2018 [58]. Data obtained, sometimes after several requests, varies on quality and detail. As a result, 8.4% of total square meters of new construction authorized (SMCA) is actually a low estimation because such data corresponds only to the surface area of new developments and not to the actual built space. Because of this, difficulties accessing information and its corresponding quality have been evaluated for each municipality by using the following categories: opacity or lack of transparency during the process of accessing to information (LT); difficulty of the process or bureaucratic obstacles (BO); and the deficiency of information delivered by local authorities (DI). See details in Table 3.
Data corresponding to 8131 permits for new buildings, between 2012 and 2018, was analyzed. Real estate projects of more than 4000 m2, which to a greater extent can be associated to the rise of land values, were mapped with the purpose of revealing the (uneven) geographical patterns of urban space production. In addition, a review on land and property prices was spatially correlated to such urban development. Finally, the ecological impacts related to the identified urban expansion were assessed in terms of: (a) generation of construction waste and demolition debris; (b) carbon footprint of three key construction materials: steel, aluminum and concrete; and (c) the potential water and energy consumption related to the operation of such new built-environments.
For (a), waste and debris factors were used for demolition and construction phases based on estimations of COAVN [59]. For (b), average consumption factors for each material according to Mercader et al [60] were used. Embedded carbon emissions of materials were estimated on the basis of average carbon emissions for the production of steel (according to the World Steel Association), aluminum (according to Mexico’s National GHG Inventory 2006), and concrete (according to Cemex data) [61]. For (c), the estimation of potential water consumption was based on the average number of people living per household in each municipality [62], the assumption of an average household surface area of 100 m2, and the average per capita consumption of water at the municipal level [63]. Due to the fact that water supply is decreasing over time and because not all SMCA corresponds to residential use, it is acknowledged that the estimation is not entirely precise, mainly if it is projected in the medium and long term when consumption patterns can also change. In that sense, the potential water consumption could be higher or lower and certainly will depend on the actual SMCA uses. For calculating the potential electricity consumption, official data on average consumption per household was used [62], assuming an average household surface area of 100 m2. An electricity commercial consumption factor was used for 5% of new built space [62]. As in the former case, the estimation is not precise as it will depend on consumption patterns according to different SMCA uses, but also on the type of technologies in place.
Finally, data directly obtained from Mexico City’s Public Prosecutor on Environmental and Land Planning Office on complaints related to urban development and land uses by municipality [58], was employed and spatially analyzed.
The methodology described brings together urban political economy, industrial ecology and urban political ecology analytical tools. Such a hybridized proposal seeks to enable a more comprehensive understanding of contemporary urbanization and its socioenvironmental impacts. It also intends to assist evaluation and monitoring tools whose objective is to inform urban socioenvironmental policies that pursue a more successful, multi-dimensional, multi-scaled, and inclusive urban transformation.

4. Results

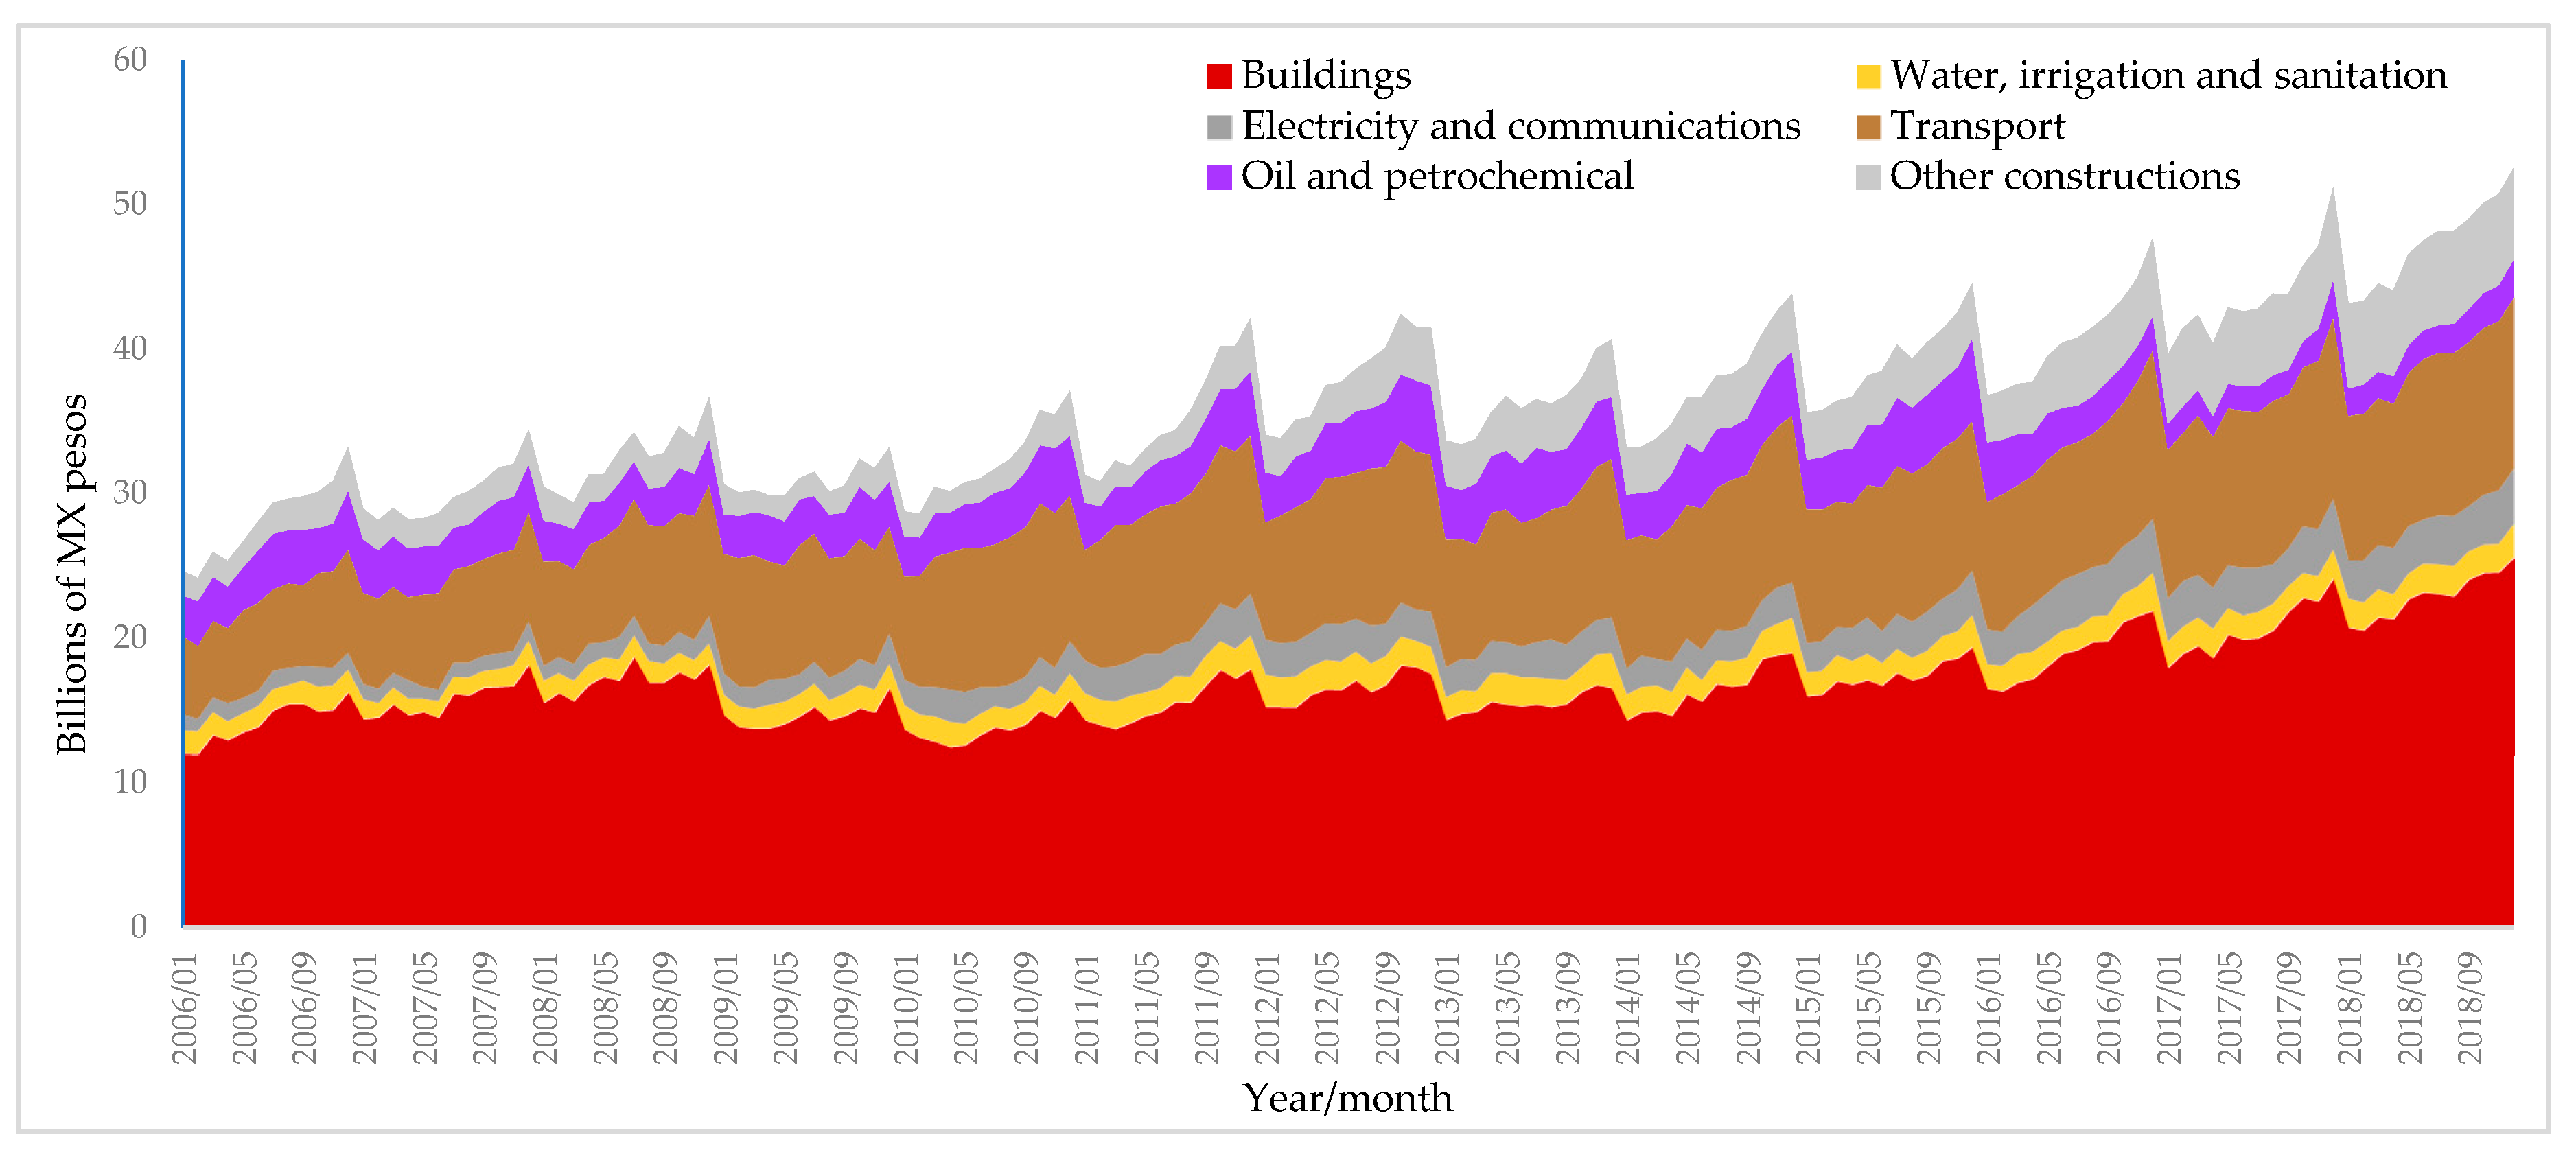
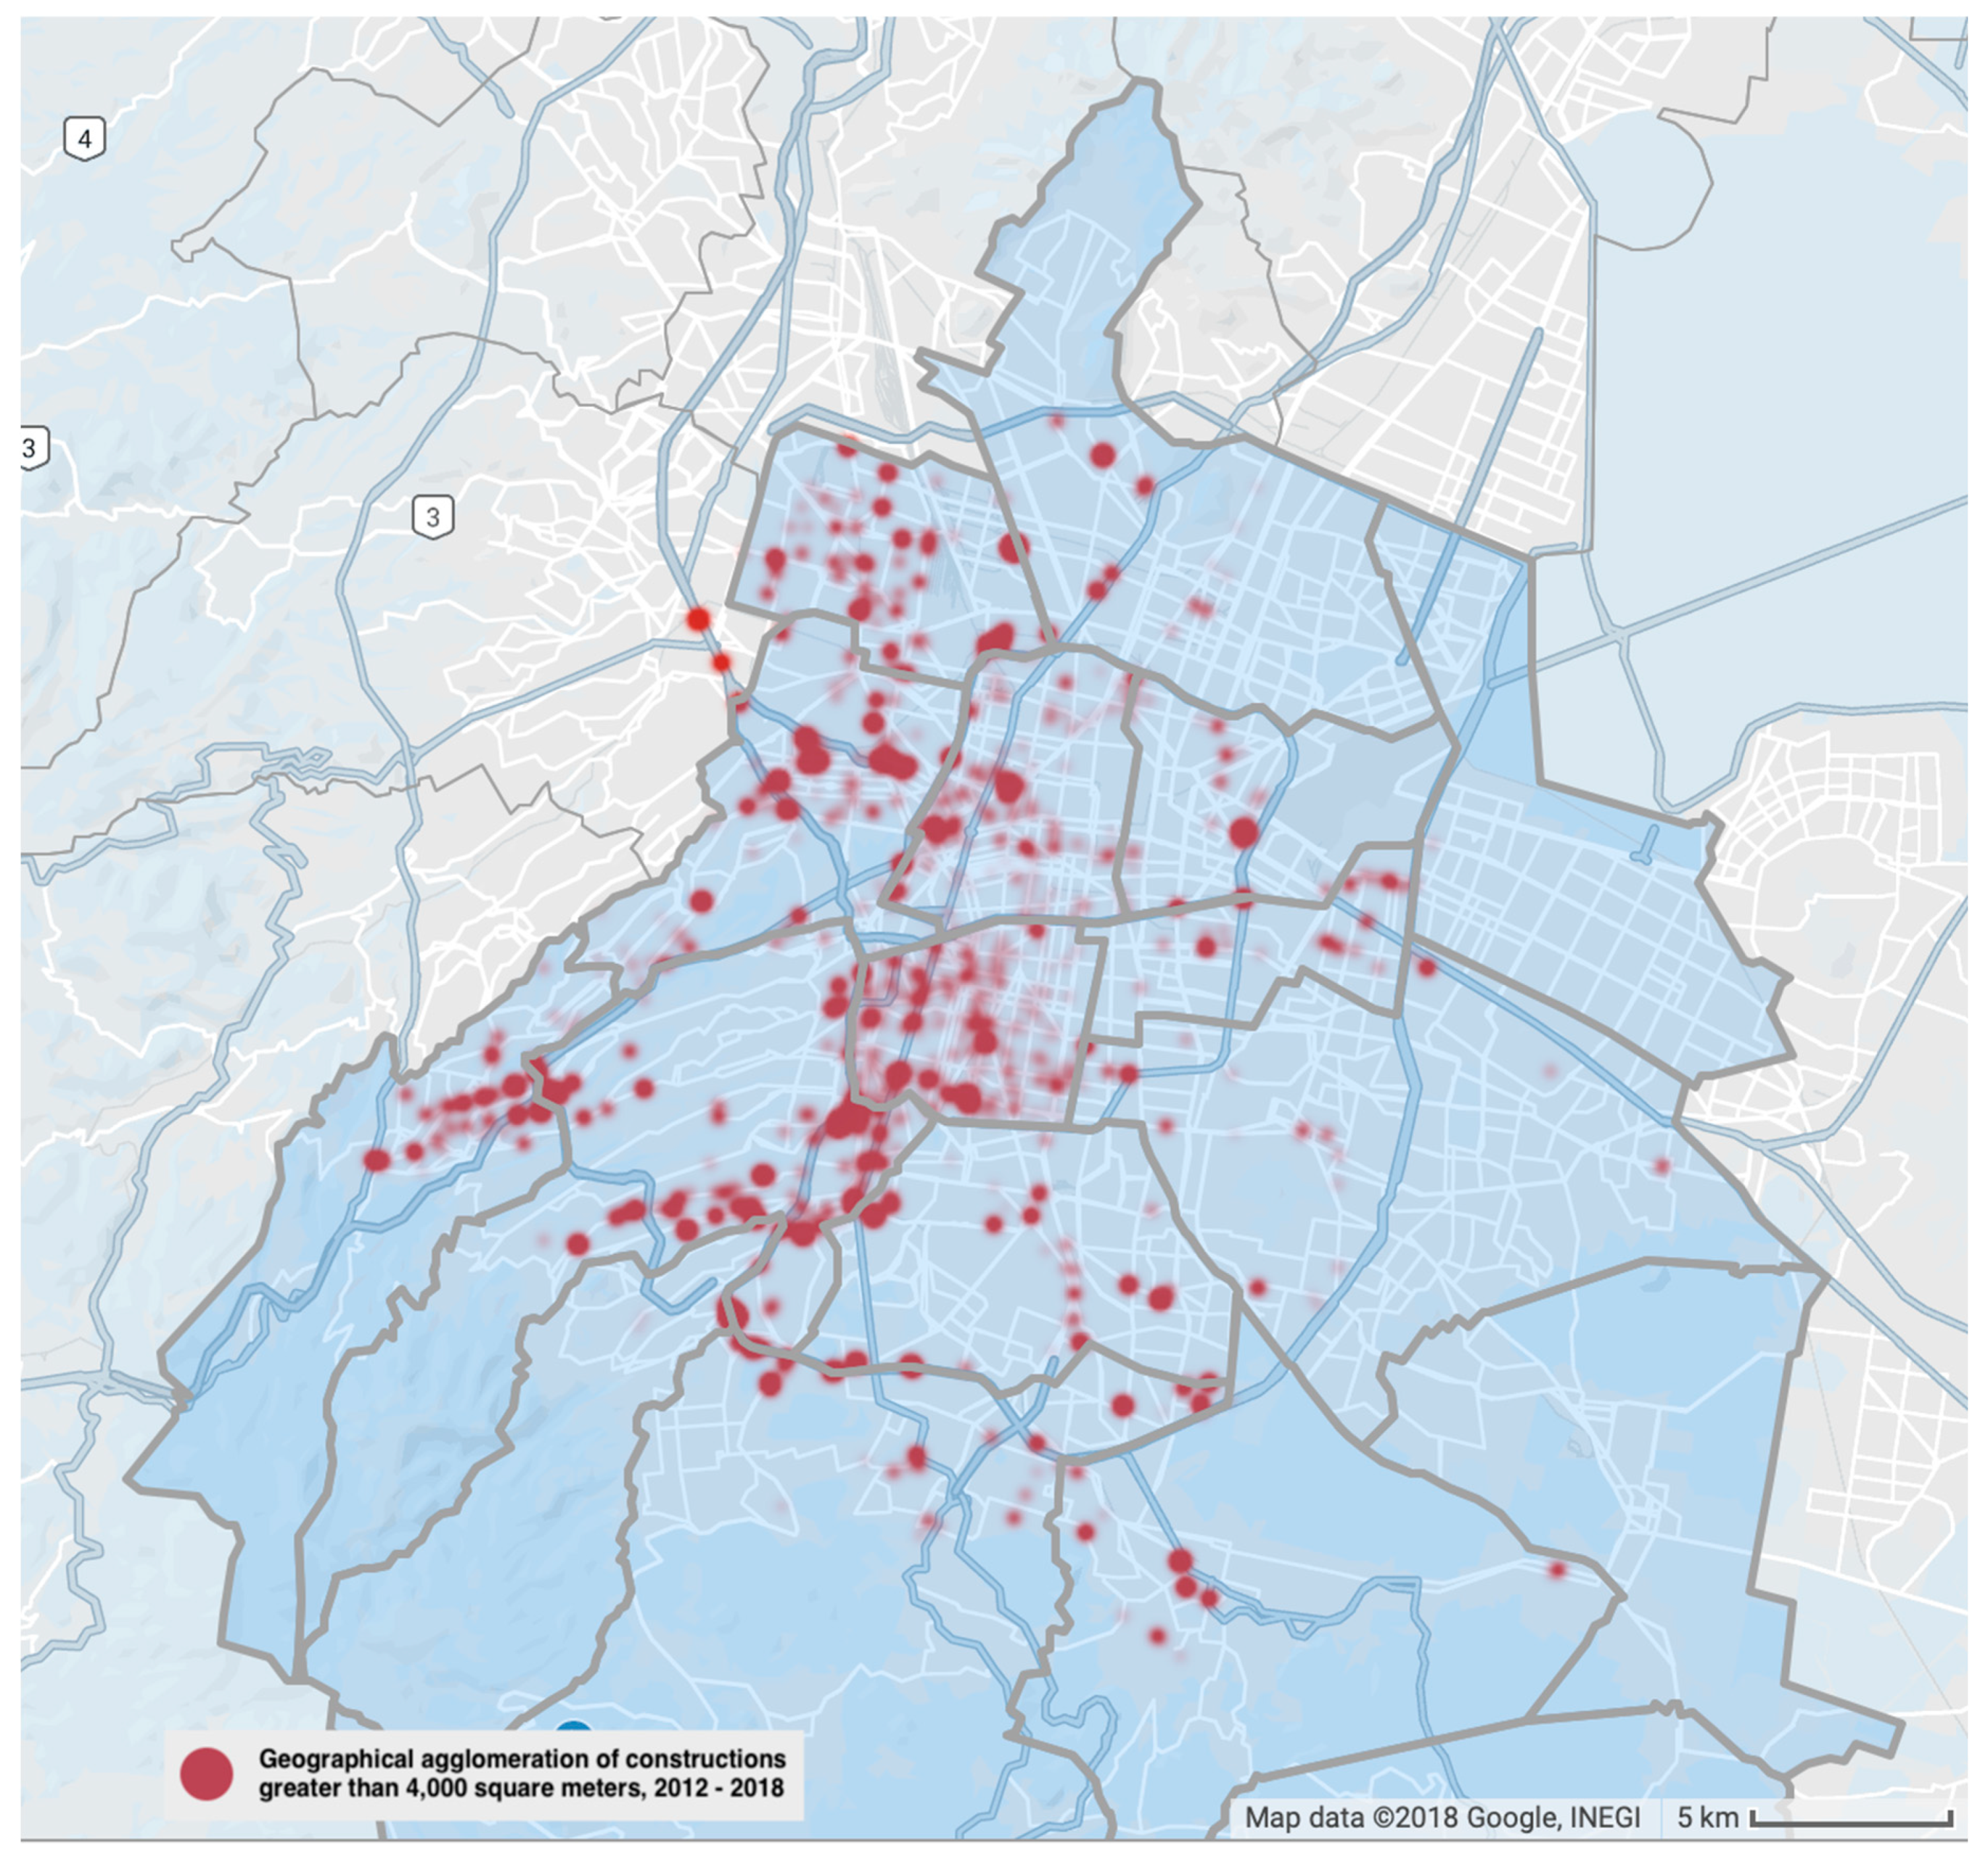
4.1. Urban Expansion

Total expansion of the built environment from 2012 to 2018, as formally recognized by Mexico City’s local municipalities, accounted for no less than 22.7 million square meters. Besides commercial and office buildings, two thirds of housing supply are apartments [33]. This means that most new constructions are vertical.
As presented in Table 3, Benito Juarez municipality had the most real estate speculation in Mexico City with more than two thousand square meters of new buildings developed per day, followed by Miguel Hidalgo, Álvaro Obregón, and Cuauhtémoc municipalities. Together, these four municipalities concentrated 67.3% of the formal building stock expansion between 2012 and 2018 (measured as SMCA by local governments, who have such legal attribution). Benito Juárez, with no vacant land availability, experienced the highest concentration with 1848 m2 per hectare of land. However, adjusting the available surface for new buildings by subtracting surface used for roads, urban infrastructure [61], and green spaces [64], reveals that the built environment expansion in fact reached 3582 m2 per hectare of land during the analyzed period, or 4.6 times Mexico City’s average.
Using this same metric, the case of Cuajimalpa is as well notorious, a municipality that experienced a moderate expansion of the built environment in terms of total SMCA and yet, it faced a profound change in the concentration of new buildings in terms of SMCA per hectare adjusted. Because a considerable part of the municipality surface corresponds to land of ecological value, where construction is prohibited, Cuajimalpa’s values soared from a low concentration of SMCA per hectare, to a high level of SMCA per hectare adjusted. For other municipalities, see Table 3.
The geography of the built environment expansion during the period analyzed reveals a clear spatial segregation. Most of new constructions concentrated on the west part of Mexico City, forming a type of “corridor” precisely where public infrastructure is in better shape, at least in contrast to its east counterpart, where lack of water and other public services is experienced, or more acutely experienced [63]. Financial services, headquarters of national and international companies, and luxury goods marketing are prominently located within such corridor; not to mention the most expensive real estate properties.
The uneven urban space production is even further revealed by taking note of SMCA per capita. While the total population of Mexico City grew about 0.7% since 2012, SMCA per capita increased almost 4.5 times, with manifest asymmetries between the already mentioned “corridor” and the rest of Mexico City. Therefore, it can be argued that despite the corridor is composed, from northeast to southeast, by Miguel Hidalgo, Cuauhtémoc, Benito Juárez, Álvaro Obregón and Cuajimalpa municipalities, those that experienced the highest expansion of the built environment, and thus urban speculation, were Benito Juárez, Miguel Hidalgo and Cuajimalpa. Such municipalities scored an SMCA per capita of 12.8 m2, 9.5 m2 and 8.7 m2, respectively.
Figure 2 shows the location of constructions of more than 4000 m2 from 2012 to 2018. That size of buildings concentrated within the already mentioned corridor which faced considerable increments on land and property values. In that sense, it can be argued that the corridor in question is predominately a real estate speculation corridor as it reinforced an uneven property market. While average market prices for Mexico City increased 63.5% from 2012 to 2018, average prices in Benito Juárez increased by 72.6%, and in Cuauhtémoc they increased by 66.5%. In contrast, average market prices in Iztapalapa only increased 52.7%, or below Mexico City’s average [65].
Urban speculation has been particularly related to vertical construction as the correlation of SMCA per hectare adjusted and market values exposes for the cases of Benito Juárez, Cuajimalpa and Miguel Hidalgo: the higher the market value, the higher the SMCA per hectare adjusted. See market values in Table 4.
In addition to the above, it is to be noticed that the uneven increase in the average market value of properties has not been followed by the values fixed by the government for charging property taxes which instead, from 2012 to 2017, equally increased by 32% in all municipalities [66,67]. This disparity means that there is not an adequate correlation between fiscal and urban development policies, a context that certainly benefits real estate market speculation; restricts local financial capacities to cope with future demand of public services (that is encouraged by urban development); and, consequently, increases the mid and long-term risks associated with debt or a public deficit [17,68,69,70,71]. In fact, Mexico City has already seen its public debt increase 2.5 times from 2002 to 2018, of which 39% corresponded to 2011-2017. By the end of 2018 Mexico City’s public debt reached MX$84.3 billion pesos, the largest debt among the states that comprise the federation [72].

4.2. Socioecological Implications of the Built Environment Expansion

Urban growth, specifically poorly planned densification policies, can be problematic as the expansion of the built environment not only increases but also spatially concentrates resource demands, from construction materials, to energy and water; the latter is a resource that is already scarce in Mexico City [63,73,74]. Urban growth and urban densification can thus lead to a greater pressure on public services such as those related to management and treatment of waste and sewage water, in addition to other challenges, from the loss of green spaces to the reduction of mobility, which is directly linked to air quality and public health [75,76,77,78]. Assessing the process and dimension of urban expansion and its potential implications can indeed enable a better understanding of the relationships, co-benefits and trade-offs between densification strategies, land uses, urban form, urban ecology, and health.
The analysis offered here recognizes the potential for a more comprehensive assessment on the impacts of Mexico City’s most recent (vertical) expansion and, in that sense, offers a first evaluation attempt by considering the following aspects: construction waste and demolition debris generation; carbon footprint of three key construction materials (steel, aluminum and concrete), and the potential water and energy consumption related to the operation of such new built-environments. It also assesses, as indicated before, social contestation by taking note of public complaints related to urban development and land use submitted during the analyzed period to Mexico City’s Public Prosecutor on Environmental and Land Planning Office. See Table 5.

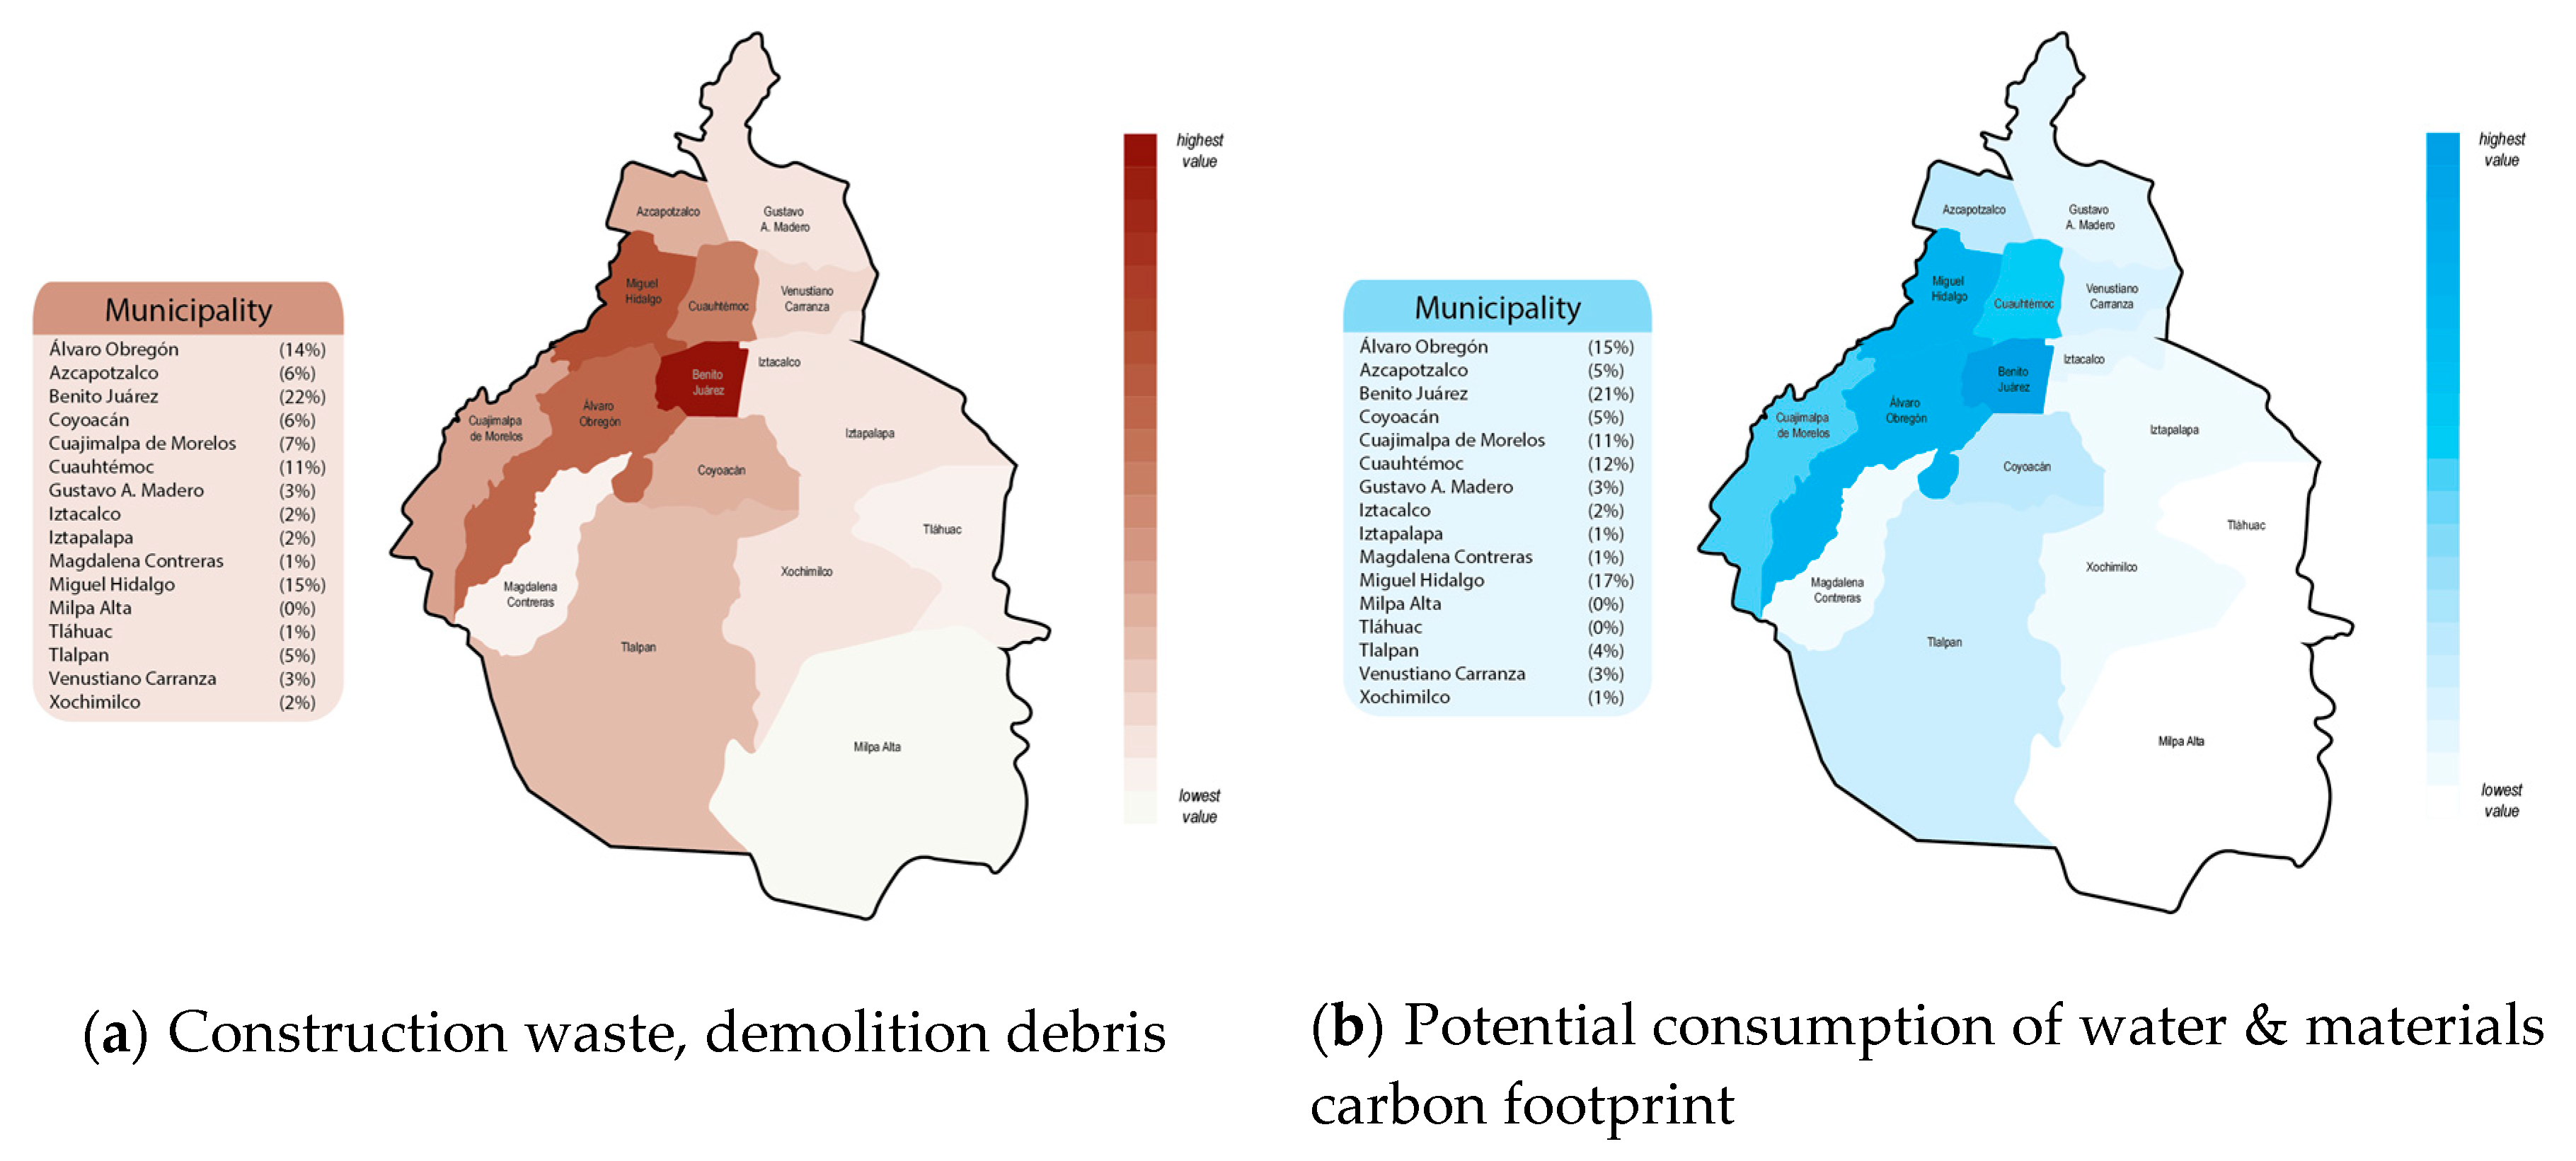
4.2.1. Construction Waste and Demolition Debris

According to the environmental standard NADF-007-RNAT-2013, related to classification and management guidelines for construction waste and demolition debris, about seven thousand tons of construction waste and demolition debris are generated daily in Mexico City, 133% more than what it was estimated in 2004 by the same environmental standard (NADF-0007-RNAT-2004). The 5.4 million tons of construction waste and demolition debris generated by new buildings from 2012 and 2018 represents just 35% of the 15.3 million tons estimated for that same period of time under the above-mentioned environmental standard (See Figure 3a). Without taking into consideration any issue with SMCA data accurateness (data has been used as it was reported by local governments), the remaining 9.9 million tons seems to be derived from formal households’ renovation, auto-construction, and public infrastructure development, all of which have not been included in this study.
Mexico City generates about a quarter of the country’s construction waste and demolition debris but it only has two official sites for transfer and final disposition: on one hand, a concrete recycling plant with a capacity of 2000 tons daily that yet, processes only about 3% of total construction waste and demolition debris because, among other issues, its production is constrained to aggregates; on the other, a transfer site that concentrates the city’s construction waste and demolition debris before sending them to one of the 14 final disposition sites located in the State of Mexico.
Due to the relevance of auto-construction in Mexico City, 168 illegal disposition sites have also been identified, mainly in low-income urban areas and lands of ecological value (where 55% of total irregular sites are located [79]). Such illegal sites hold about 10% of total construction waste and demolition debris generated in Mexico City, a reality that occurs in a context in which only 2% of recycled construction waste is actually used in new buildings [80].
This has implications on an eventual reduction, or continuous increment, of the material intensity associated with the expansion of the built environment, in Mexico City and elsewhere; an issue that has been recognized as a challenge for climate change mitigation at the urban scale [17,36,81]. The carbon footprint of three construction materials used in the expansion of the built environment from 2012 to 2018 (those that are more carbon intensive), has been estimated in 6.4 million tons of CO2e, under an optimistic scenario. That carbon footprint is equivalent to 29% of Mexico City’s total GHG emissions in 2016, which have been estimated at 22 Gt of CO2e [82]. See Figure 3a.

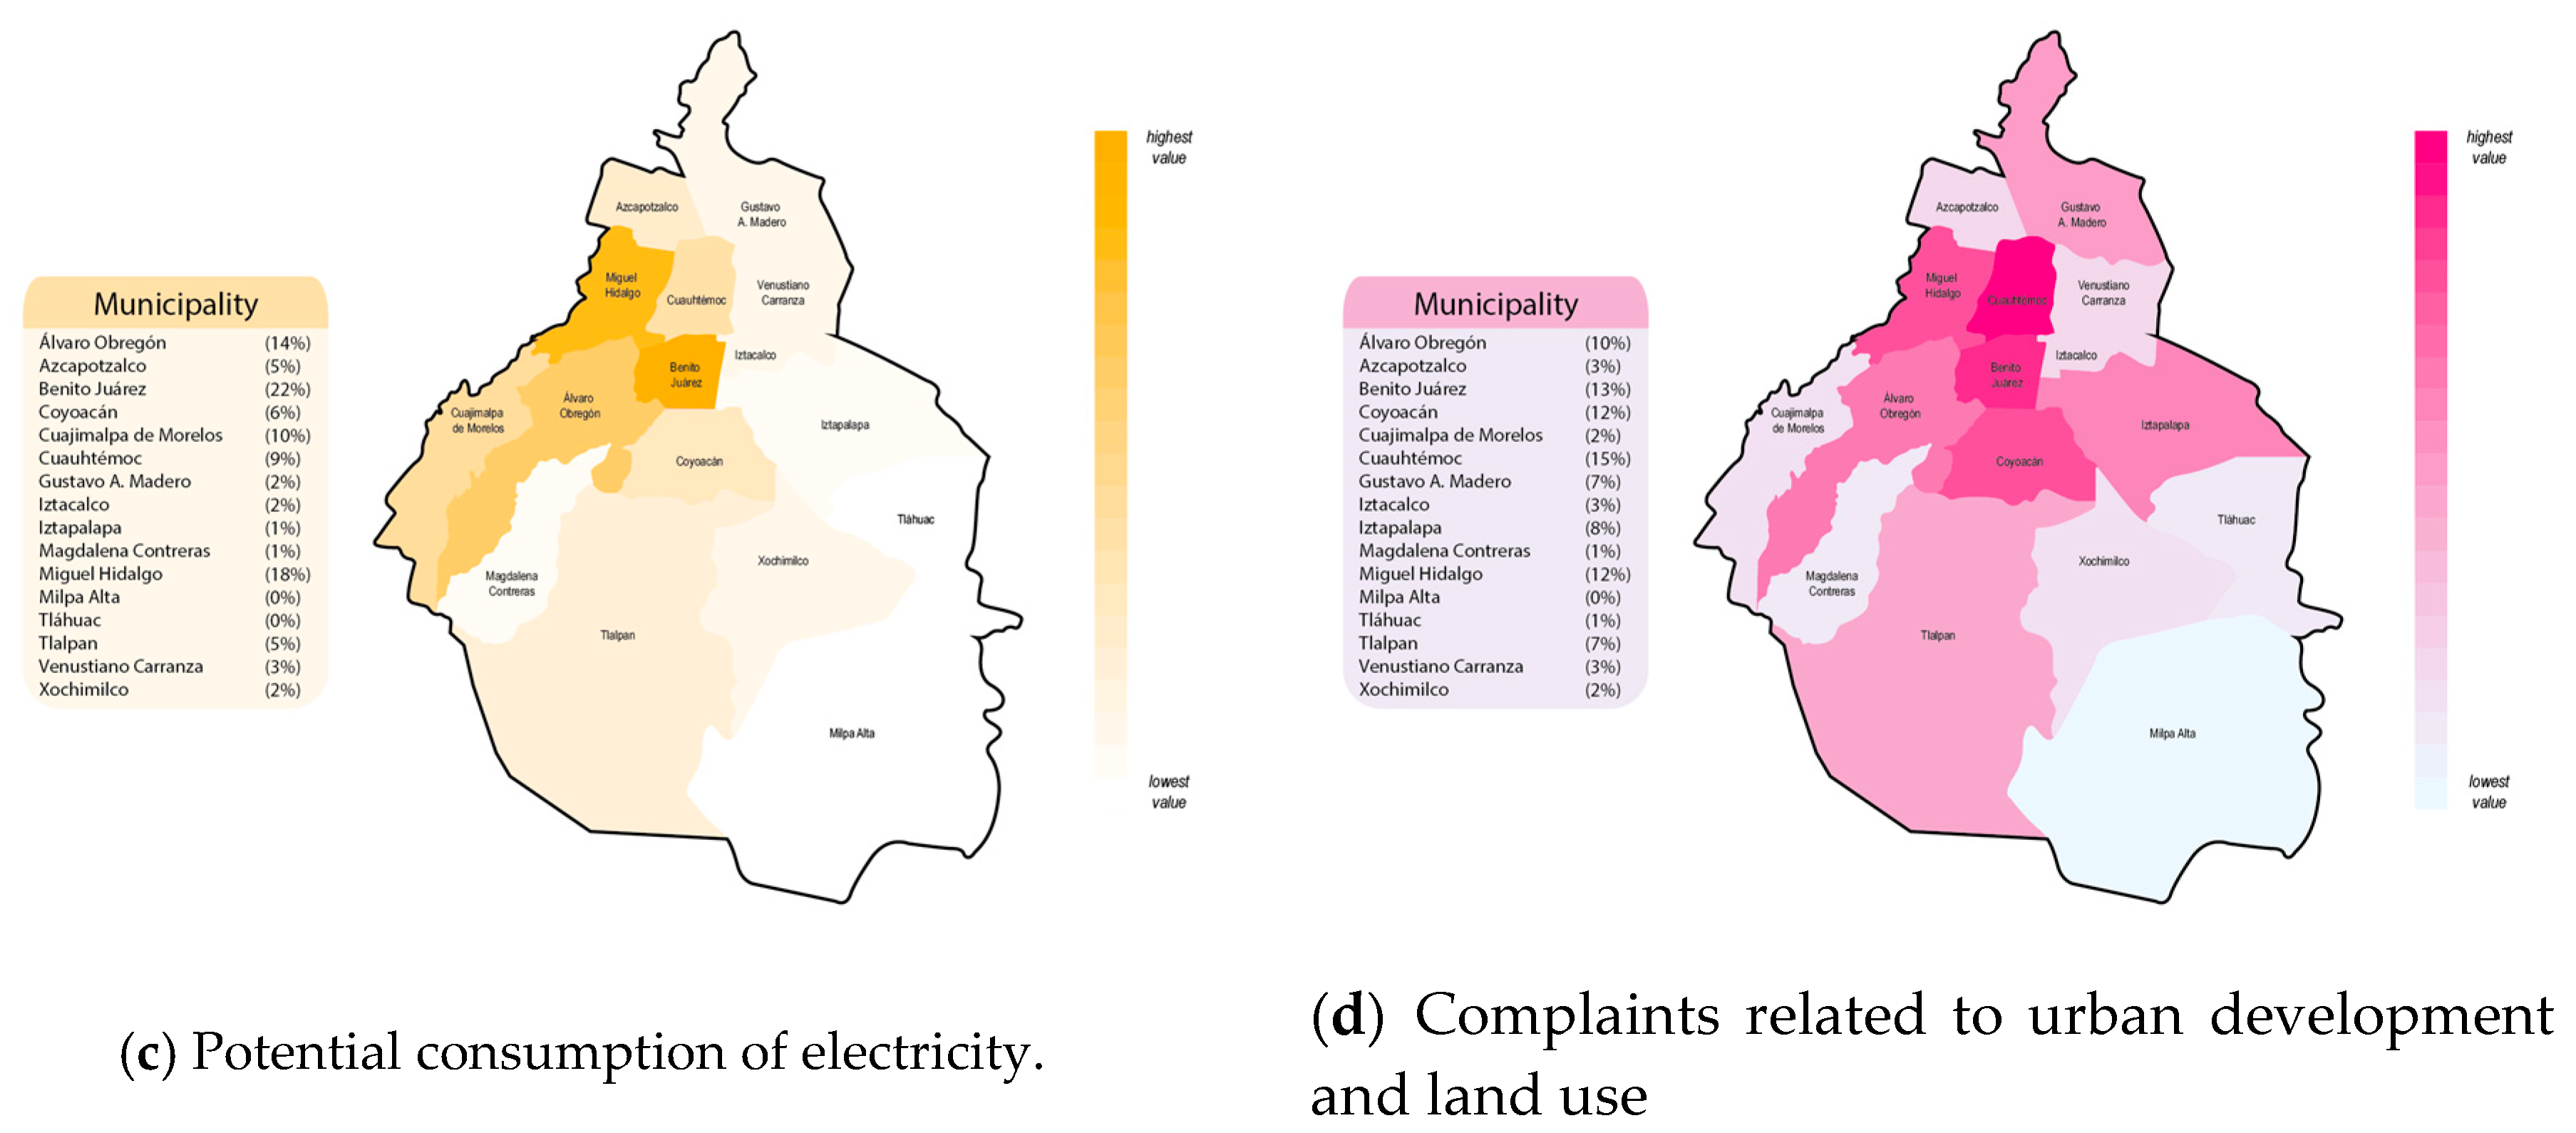
4.2.2. Potential Consumption of Water and Energy

New built space, measured as SMCA, also has repercussions in terms of water and energy consumption. The potential increase in the consumption of said resources may compromise local water and energy security; the latter is certainly the case for Mexico City. Estimates of potential water consumption associated to SMCA during the period of time analyzed, could be of 285,064 m3 daily (see Figure 3b), whereas the potential electricity consumption of about 849 MWh, daily (see Figure 3c). GHG emissions from such energy consumption scenario may add to Mexico City’s emissions profile, 683 tons of CO2e daily or nearly 250,000 tons annually, equivalent to 1.1% of total GHG emissions estimated in 2016 [82] (based on the average carbon emissions of electricity production from gas and oil, which in Mexico are of about 0.42 kg of CO2e/KWh for gas and 0.77 kg of CO2e/KWh for oil, factor used: 0.805 kg of CO2e/KWh).

4.2.3. Other Ecological Impacts and the Prevailing Social Discontent

Noise and air pollution generated by construction are additional ecological impacts to be considered. The latter includes particulate and dust emissions, but also GHG emissions from construction materials, waste and debris transportation. Using an emission factor of 1.125 kg of CO2e per cubic meter of demolition debris and construction waste, GHG emissions related to the formal expansion of the built environment during the period of analysis, have been estimated at 4102 tons of CO2e (assuming an average capacity of trucks of 16 m3 [83], a traveled distance of 20 km, a diesel consumption efficiency of 3 km per liter -based on the average efficiency of a Kenworth T800 truck which is optimistic due to the conditions of trucks and roads in Mexico City-, and a GHG emission factor of 2.7kg per liter of diesel).
Further ecological impacts may arise from an inadequate use of toxic materials but also from a lack or inappropriate management of demolition debris and construction waste as they can obstruct water bodies, impact natural water drainage, increase the risk of flooding, and pollute or erode the physical and biotic space. Most of those impacts usually take place in the urban outskirts of Mexico City, in lands of ecological value (namely, conservation land), or are exported to the State of Mexico or other locations, a dynamic that not only exposes the extension of Mexico City’s ecological footprint, but also the unequal distribution of damages.
A similar argument applies in terms of energy and water access and consumption inequalities that are reinforced by the uneven production of new urban space (for a political ecology analysis of residues see reference [84] and for water see references [74,85]).
As those and other inequalities deepen and injustices take place, either during the construction of the built environment, the access and quality of public services, or the distribution of current and future ecological impacts, contestation processes emerge in parallel. This has been clearly acknowledged during the workshop “La Ciudad de México que queremos” (The Mexico City that We Want), which took place on January 2019 at the National Autonomous University of Mexico (UNAM) with the specific goal of fomenting an open dialogue between academia and the organized civil society (the workshop, sponsored by UNAM, GIZ Mexico and the Platform of Knowledge for Urban Transformation, was organized in alliance with SUMA Urbana and Ruta Cívica, both civil society groups; a report with the main findings will be available by September 2019 [86].
Social discontent, assessed in terms of the spatial correlation of the built environment expansion and the number of complaints presented to the Public Prosecutor on Environmental and Land Planning (see Figure 3d), proves that municipalities with the higher expansion of the built environment accounted for most of the urban development and land use complaints. However, and due to the fact that other municipalities with a minor expansion of the built environment also verified a considerable amount of complaints, it can be acknowledged that the production of urban space and its implications is in general terms uneven. The cases of Gustavo A. Madero, Iztapalapa and Tlalpan municipalities, which show a significant concentration of complaints, reveal that discontent is not only associated with the built environment expansion as such (including the informal expansion which is a pressing issue in the case of Tlalpan), but also with locally unwanted land uses and other issues such as limited access to public amenities, informality, and poverty.

5. Discussion: Regarding the Policy and Political Implications of an Uneven Urban Development

Induced by the economic and policy shifts generated by the North American Free Trade Agreement, but also owing to the drastic devaluation of the Mexican peso and the economic crisis of 1994, a reform and expansion of the housing finance system has been experienced, as said, since the early 1990s. As an outcome, the country has transformed the production of urban housing by moving from a context dominated by auto-construction, to one in which housing is increasingly built on speculation by private-sector homebuilders and purchased with mortgages [43]. Public funding has been progressively operated under bank-like schemes, which has generated a loss of the relative control that government lending institutions used to have on housing supply before the implementation of neoliberal policies. Provident funds, that control the mortgage market, have been progressively managed by financial institutions that are lenders for both housing and pension funds, a situation that has led to regressive cross-subsidization; financial inefficiency; conflicts between the roles of lender, pension fund and subsidy provider [43]; and moreover, to speculation.
This entire situation is in fact changing Mexico’s housing market in terms of who has access to funding (cities with more formal employment are the major recipients), but also regarding the type of housing that can be purchased with it. Highly unequal distribution of income and informality has encouraged, in addition to irregular settlements, low-quality housing developments located in the peripheries of major cities or metropolitan areas where land is less expensive. It has also fostered urban densification, displacement, and in some cases gentrification, as well as overpricing and speculation in centric urban areas, particularly those in major urban settlements such as Mexico City and others that have been able to capture the most national and international investments. The latter has in turn intensified the gap between affordable and unaffordable housing with a markedly geographical component.
Mexico City is undoubtedly not alone. According to Huang et al. [87], the unaffordability of house price and over-development of real estate in China began in 2009, when the government injected fiscal stimulus to markets as a response to the global financial crisis of 2008. As in the case of China, overdevelopment of real estate in central areas of Mexico City where, on one hand, more local amenities are available and, on the other, where land prices are already high or have the potential to increase, is definitely an expression of real estate market speculation profiting densification policies in a context of profound socioeconomic inequalities. As a result, real estate speculation has mainly improved middle to high class boroughs while relegating working class or disadvantaged communities, or even expelling the poor population to the periphery of Mexico City or the periphery of its metropolitan area where, nevertheless, a different type of urban speculation advances: low-cost urban developments that are also generating serious ecological impacts [88].
This dynamic, that reinforces the uneven production of urban space, is in constant conflict with the satisfaction of housing needs, mostly for the poor who need a “home”. This is a reality under capitalism that has been lucidly described by Logan and Molotch [51] (p. 2) as follows: “…the pursuit of exchange values in the city does not necessarily result in the maximization of use values for others. Indeed, the simultaneous push for both goals is inherently contradictory and a continuing source of tension, conflict, and irrational settlements […] In our view, this conflict closely determines the shape of the city, the distribution of people, and the way they live together”.
Vertical urbanization in Mexico City not only impacts market prices and the right to housing (not to any housing, but to “good” housing in terms of quality, durability, and the public amenities that surrounds it). It has also engendered certain socioecological implications -not all positive- that should be considered in any urban agenda for sustainability and resilience with a medium- and long-term vision. This is particularly relevant as cities have become key actors in the local and global efforts to attain sustainability and for coping with climate change [78,89,90,91,92]. Yet, sustainability and climate actions are not implemented in a vacuum. Social and economic goals, as well as cultural practices can support and speed, slow-down and even reverse such actions and their funding. In other words, existing interactions can lead to trade-offs or co-benefits at different spatial and time scales and under a diversity of biophysical realities [84,91,92].
The estimation of current and potential socioecological impacts associated with the expansion of the built environment in Mexico City from 2012 to 2018 positively contributes to the global efforts seeking a more comprehensive understanding of urban development and its implications at multiple scales, which in turn can better inform urban policy. Assessments, similar to the one here offered, are very limited in the literature [93,94,95] and apparently are still absent in Mexico. Unlike the assessments that seek to evaluate the impacts of techno-solutions or novel standards, which usually apply to concrete buildings, public infrastructure, or building practices, but also dissimilar to traditional, top-down and aggregated, urban material and energy flow analyses [96], the methodology used in this paper, based on a bottom-up approach, offers instead a comprehensive overview on the socioecological implications that particularly involve the expansion of the built environment. Its value lies on the fact that it can complement other evaluating and monitoring efforts on urban sustainability and climate change action, particularly in regards to the multiple and frequently hidden impacts associated with urban growth.
In the case of Mexico City, assessing vertical urbanization is certainly of relevance as it represents a challenge for a city that, besides being exposed to the risk of earthquakes, has been built on top of a lake, a feature that increases the risk of flooding and sinking due to the cumulative overexploitation of the local aquifer [63]. Moreover, rapid and poorly planned urban densification can be also a concern in terms of resource security, and because a larger concentration of population may translate into a greater degree of exposure, which in turn may increase population vulnerability to extreme events and other natural or socially induced phenomenon [97,98]. This is tremendously important for Mexico City as, on one hand, official poverty encompasses 27.6% of the population, and on the other, because it has been recognized that 5.6 million inhabitants or 62% of Mexico City’s population is vulnerable to climate change [99]. A continuous uneven production of urban space may for instance aggravate the vulnerability of the poor as they have limited capacities to face it, but it may also impact middle income neighborhoods [100]. In contrast, a well-planned urbanization process, including certain “smart” densification policies, may lead to desirable scale economies, material and energy efficiencies and the economization and improvement of risk prevention, disaster preparedness, and post-disaster responses [92]. Such smart policies, however, have to be tailored case by case due to their biophysical, economic, political, and sociocultural particularities.
The approach and findings of this paper may hopefully assist with moving forward more comprehensive and multiscale assessments of urban development and its multiple critical and interconnected aspects and implications. Such assessments are desirable for improving the science-policy maker-civil society interface, but also for building appropriate local capacities, and informing urban planning and managing, all of which are central for encouraging a sustainable, resilient, inclusive and just urban transformation; as aspired by international agendas such as the Paris Accord, the 2030 Agenda for Sustainable Development, the New Urban Agenda (HABITAT III) and the Sendai Framework.

6. Conclusions

Despite the fact that data used certainly can be improved and that the scope of analysis has been limited to the formal urban development within Mexico City, the main findings of this study seem to be coherent due to the following reasons:
  • The estimation of the expansion of the built environment in Mexico City, based on SMCA, is conservative not only because, as said, 8.4% of SMCA data corresponds to properties surface area (not to the actual built space), but also because there are several construction projects that actually built more than what they were authorized. This phenomenon has become so frequent that a citizen monitoring effort has been watching the so-called “obras chuecas” (constructions that do not comply with building codes and their corresponding permits) [101].
  • Georeferencing the largest edifications has revealed a correlation of these types of buildings with higher land values, which reaffirms the uneven production of urban space and its implications in terms of housing (un)affordability, a phenomenon also known as residential segregation by income.
  • The expansion of the informal built environment within the central urbanized areas of the city is relatively limited and usually corresponds to modest additions or partial renovations to existing buildings. Informal expansion of the built environment mainly takes place in the metropolitan periphery and, in a lower degree, in the southern periphery of Mexico City where, for the most part, the marginalized population occupies land of ecological value. The analysis of such informal expansion is out of the scope of this paper, yet it does not alter the identification of segregation processes by paying attention to the expansion of the built environment under the stimulus of speculative market dynamics. Certainly, for a more comprehensive analysis, a metropolitan assessment that includes both formal and informal expansion of the built environment would be more than desirable. Yet such an effort would be highly complex not only because it would involve three states and 76 municipalities, but also because of the lack of data on informal housing.
In addition, it is also to be highlighted that the estimations presented are based on a plain methodology that is easy to replicate and adjust, either in terms of the case study and the extent of the analyzed area, or to update the factors used in the estimation of construction waste and debris generation, carbon footprint and potential consumption of water and energy. This turns the proposed methodology into a transparent and easily expandable and appropriable evaluation toolbox for informing urban policy and politics.
Estimating the socioecological implications of the current formal expansion of the built-environment, in addition to disclosing the uneven effects of a relevant part of the urban space production in Mexico City, can help to improve both the regulation of the real estate sector and, as already said, urban planning. The latter, normatively speaking, can enable a transition towards low carbon and efficient pathways on the basis of a better understanding of the built environment renovation and expansion. The analyzed urban expansion of the built environment in Mexico City, mostly of the conventional kind, has indeed missed such an opportunity as it has instead generated a lock-in effect for the coming decades, precisely when resource security and ecological conditions may decline if no proper actions are put into motion as soon as possible. With that challenge in mind, coupling the above-mentioned toolbox to property market models may provide refined and plausible future scenarios of the real estate market behavior at different time scales, and thus on the possible expansion of the built environment and its potential environmental impacts. Hopefully this paper may encourage that line of research, which has not been explored here.
Furthermore, since participatory governance will increasingly be needed in order to succeed in moving forward a sustainable, inclusive and more just transformation agenda of the urban built environment, further efforts to monitor and enhance urban governance are indeed desirable. Urban governance, however, did not improve in the case of Mexico City during the analyzed period of time. The dynamism of the urban growth machine reinforced instead several contestation movements that are opposed to the speculative-city in which they believe Mexico City became. Among such grassroot movements are: SUMA Urbana, Ruta Cívica, La Voz de Polanco, Vecino a vecino, Unión de vecinos de San Ángel, Vecinos organizados de la Benito Juárez, and CIUDADania19s.
Those social movements have expressed concern about the access and quality of public services in the face of urban growth given that they may not necessarily be maintained at adequate levels in the future, especially when deficiencies are already being experienced. They reject the expulsion or relocation of the marginalized population, the loss of neighborhood economies, the declining of urban mobility, and damage to the urban ecology (from green spaces to air quality and its implications to health). Such grassroot movements are also concerned about the lack of transparency with which urban space production evolved, most of the time excluding local residents from any relevant decision-making processes and thus undermining their right to the city, or in other words, their right to decide who should define the production of urban space, by which means, for the benefit of whom, and at what costs in both the short and long terms. For these reasons, urban grassroot movements in Mexico City tend to agree on impeding the approval of any additional construction permits until a new comprehensive Urban Development Plan is carried out with the participation of citizens. They are also requesting, on one hand, an update of local urban development programs (at the municipal level) in accordance with the aforementioned plan, and on the other, ending any new construction permits until local residents’ demands are resolved, mainly those related to the quality and frequency of water supply and waste collection services, but also in what respects to public security. Likewise, they demand: respecting current land use codes, particularly those that limit urban densification; an effective control of urban development in the future so as to guarantee compliance with the above-mentioned urban development plan and local development programs, but also with Mexico City’s building codes; among other issues.
Such vibrant grassroot movements, which embrace marginalized but also more and more mid- class individuals that somehow have been affected by the avidness of the urban growth machine in recent years, certainly remind us that the city is a space in constant dispute. The aftermath of such a dialectic and contradictory process may take us to a more livable urban life, or to even stiffer challenges.
The full recognition of urban governance complexity and the specific urban political economy in which the former is imbedded, enables both a more robust analytical approach on the implications of urban development, and the identification of the differential capacities and obstacles for change. One of the main reasons for using a hybridized methodology based on urban political economy, industrial ecology and urban political ecology, has been precisely to advance, at least in certain degree, the production of novel knowledge that may foster dialogue, eventual consensuses and partnerships. Such goal will need to support and nurturing, not only cutting-edge tools and methods, but also the interaction, dialogue and collaboration for planning and decision-making, at least if a deep transformation of cities is actually desired, meaning a transformation that reformulates the function, or the purpose, of urban space production. In that sense, urban transformation may be seen as a change of gear, a process that from the local scale subsidizes the global goal of transforming our world by putting the common well-being at the center stage.

Funding

This research received no external funding.

Acknowledgments

A preliminary estimation of the built space expansion in Mexico City was carried out by the author in the context of the project “Nueva Política de Desarrollo Urbano a Escala Metropolitana”, coordinated by UNAM’s research program on Cities during the second half of 2018. See: https://ces.cdmx.gob.mx/storage/app/media/PUECentregaFinal.pdf.

Conflicts of Interest

The author declares no conflict of interest.

References and Notes

  1. Smith, N. Gentrification and the rent gap. Ann. Assoc. Am. Geogr. 1987, 77, 462–465. [Google Scholar] [CrossRef]
  2. Harvey, D. Social Justice and the City; Revised Edition; The University of Georgia Press: Athens, GA, USA, 2009. [Google Scholar]
  3. Harvey, D. Rebel Cities. From the Right to the City to the Urban Revolution; Verso: London, UK; New York, NY, USA, 2012. [Google Scholar]
  4. Brenner, N.; Marcuse, P.; Mayer, M. Cities for People, Not for Money; Critical Urban Theory and the Right to the City; Routledge: New York, NY, USA, 2012. [Google Scholar]
  5. Savills. Around the World in Dollars and Cents; Savills World Research: London, UK, 2016; Available online: https://pdf.euro.savills.co.uk/global-research/around-the-world-in-dollars-and-cents-2016.pdf (accessed on 14 February 2019).
  6. Lees, L.; Shin, H.B.; López-Morales, E. Planetary Gentrification; Polity Press: Cambridge, UK, 2016. [Google Scholar]
  7. Leung, C.K.; Chow, K.K.; Yiu, M.S.; Tam, D.C. Market in Chinese Cities: Dynamic Modeling, In-Sample Fitting and Out-of-Sample Forecasting. Int. Real Estate Review 2010, 14, 85–117. [Google Scholar] [CrossRef]
  8. SEDATU. Sistema Urbano Nacional 2018; Secretaria de Desarrollo Agrario, Territorial y Urbano: Mexico City, Mexico, 2018; Available online: www.gob.mx/cms/uploads/attachment/file/400771/SUN_2018.pdf (accessed on 14 February 2019).
  9. SEDESOL. Catálogo Sistema Urbano Nacional 2012; Secretaría de Desarrollo Social: Mexico City, Mexico, 2012; Available online: www.conapo.gob.mx/work/models/CONAPO/Resource/1539/1/images/PartesIaV.pdf (accessed on 14 February 2019).
  10. SEDATU. Delimitación de las Zonas Metropolitanas de México; Secretaria de Desarrollo Agrario, Territorial y Urbano: Mexico City, Mexico, 2015; Available online: www.gob.mx/cms/uploads/attachment/file/305634/Delimitacion_Zonas_Metropolitanas_2015.pdf (accessed on 14 February 2019).
  11. CEPAL. Estimaciones y Proyecciones de Población Total, Urbana y Rural, y Económicamente Activa; Mexico’s Data: Santiago de Chile, Chile, 2017; Available online: www.cepal.org/es/temas/proyecciones-demograficas/estimaciones-proyecciones-poblacion-total-urbana-rural-economicamente-activa (accessed on 8 March 2019).
  12. Iracheta Cenecorta, A.; Iracheta Carroll, J. Evaluación de los Fondos Metropolitanos y Regional del Gobierno Federal Mexicano; CIDE: Mexico City, Mexico, 2014; Available online: http://clear-la.cide.edu/sites/default/files/Evaluación%20de%20los%20Fondos%20Metropolitano%20y%20Regional_Iracheta%20e%20Iracheta.pdf (accessed on 14 February 2019).
  13. UN-HABITAT. Superficie de la CDMX Crece a Ritmo tres Veces Superior al de su Población. UN-HABITAT: Mexico. Available online: www.onuhabitat.org.mx/index.php/superficie-de-cdmx-crece-a-ritmo-tres-veces-superior-al-de-su-poblacion (accessed on 14 February 2019).
  14. Krugman, P.; Elizondo, R.L. Trade policy and the Third World metropolis. J. Dev. Econ. 1996, 49, 137–150. [Google Scholar] [CrossRef]
  15. Baylis, K.; Garduño-Rivera, R.; Piras, G. The distributional effects of NAFTA in Mexico: Evidence from a panel of municipalities. Reg. Sci. Urban Econ. 2012, 42, 286–302. [Google Scholar] [CrossRef]
  16. Karayalcin, C.; Yimazkuday, H. Trade and Cities. World Bank Econ. Rev. 2015, 29, 523–549. [Google Scholar] [CrossRef]
  17. Delgado Ramos, G.C. Asentamientos Urbanos Sustentables y Resilientes: Retos y Oportunidades para la Transformación Urbana en California y Baja California; CEIICH-UNAM: Mexico, 2019. [Google Scholar]
  18. Bardhan, A.; Edelstein, R.H.; Kroll, C.A. (Eds.) Global Housing Markets: Crises, Policies and Institutions; Wiley: New York, NY, USA, 2011. [Google Scholar]
  19. INEGI. Sistema de Cuentas Nacionales de Mexico. Cuenta Satélite de Vivienda de México; INEGI: Mexico, 2017. [Google Scholar]
  20. BBVA. Mexico Real Estate Outlook. Second half 2018; BBVA Research: Mexico, 2018; Available online: www.bbvaresearch.com/wp-content/uploads/2018/11/1811_MexicoRealEstateOutlook_2H18.pdf (accessed on 7 March 2019).
  21. Banco de Información Económica. INEGI: Mexico. Available online: https://www.inegi.org.mx/app/tabulados/default.html?nc=100100054 (accessed on 14 February 2019).
  22. Delgado Ramos, G.C. Retos para la Transición Urbana Sostenible y Resiliente en México. La Jornada de Oriente. 11 June 2018. Available online: www.lajornadadeoriente.com.mx/puebla/retos-transicion-urbana-sostenible (accessed on 14 February 2019).
  23. De Luna Guerra, A. La Relevancia Macroeconómica de los Bienes Raíces en México; Working Paper No. 9707; Central Bank of Mexico: Mexico, 1997; Available online: www.anterior.banxico.org.mx/publicaciones-y-discursos/publicaciones/documentos-de-investigacion/banxico/%7B3B901004-B1B6-C1A5-7683-8BF1E8FB6EF5%7D.pdf (accessed on 23 March 2019).
  24. Nathanson, C.G.; Zwick, E. Arrested Development: Therory and Evidence of Supply-Side Speculation in the Housing Market. J. Financ. 2018, 73, 2587–2633. [Google Scholar] [CrossRef]
  25. Monkkonen, P. The Role of Housing Finance in Mexico’s Vacancy Crisis; UCLA Ziman Center Working Paper Series; UCLA: Los Angeles, CA, USA, 2016; p. 28. [Google Scholar] [CrossRef]
  26. Monkkonen, P. La segregación residencial en el México urbano: Niveles y patrones. EURE 2012, 38, 125–146. [Google Scholar] [CrossRef]
  27. Leung, C.K.Y.; Tse, C.Y. Flipping in the housing market. J. Econ. Dyn. Control 2017, 76, 232–263. [Google Scholar] [CrossRef]
  28. Leung, C.K.Y.; Yiu, N.; Joe, C. Macro Aspects of Housing; ISER Discussion Paper; The Institute of Social and Economic Research: Osaka, Japan, 2018; Available online: www.dallasfed.org/~/media/documents/institute/wpapers/2018/0340.pdf (accessed on 23 March 2019). [CrossRef]
  29. Lamudi. Informe del Mercado Inmobiliario 2018; Lamudi: Mexico, 2018; Available online: www.lamudi.com.mx/Informe-del-Mercado-Inmobiliario-2018 (accessed on 23 March 2019).
  30. ICSC. The Socio-Economic Impact of Latin American Retail Real Estate; ICSC Research: New York, NY, USA, 2017; Available online: https://www.icsc.org/uploads/t07-subpage/LatinAmericanImpactStudy2017-HighRes-FINAL.pdf (accessed on 14 March 2019).
  31. Choi, N. Metro Manila through the gentrification lens: Disparities in urban planning and displacement risks. Urban Stud. 2016, 53, 577–592. [Google Scholar] [CrossRef]
  32. Mosciaro, M.; Pereira, A. Reinforcing uneven development: The financialisation of Brazilian urban redevelopment projects. Urban Stud. 2017. [Google Scholar] [CrossRef]
  33. Lamudi. Reporte del Mercado Inmobiliario Residencial CDMX 2018; Lamudi: Mexico, 2018; Available online: www.lamudi.com.mx/Reporte-del-Mercado-Inmobiliario-Residencial-CDMX-2018/ (accessed on 7 March 2019).
  34. Aguilar, A.; Olvera, G. El control de la expansión urbana en la ciudad de México: Conjeturas de un falso planteamiento. Revista Estudios Demográficos y Urbanos 1991, 6, 89–115. [Google Scholar] [CrossRef]
  35. Tamayo, S. Los Desafíos del Bando 2. Evaluación Multidimensional de las Políticas Habitacionales en el D.F., 2000–2006; SEDUVI-INVI-UACM-CAM: Mexico City, Mexico, 2007; Available online: https://sergiotamayo.files.wordpress.com/2018/10/tamayo_bando2_pdf.pdf (accessed on 14 February 2019).
  36. Delgado Ramos, G.C.; De Luca Zuria, A.; Vázquez Zentella, V. Adaptación y Mitigación Urbana del Cambio Climático en México; CEIICH, UNAM: Mexico City, Mexico, 2015. [Google Scholar]
  37. Connolly, P.; Wigle, J. (Re)constructing Informality and ‘Doing Regularization’ in the Conservation Zone of Mexico City. Plan. Theory Pract. 2017, 18, 183–201. [Google Scholar] [CrossRef]
  38. Salinas, A.; Luis, A. Segregación Residencial en la Zona Metropolitana de la Ciudad de México; X Coloquio Internacional de Geocrítica: Barcelona, Spain, 2018; Available online: www.ub.edu/geocrit/-xcol/418.htm (accessed on 7 March 2019).
  39. Delgado, J. La Urbanización Difusa de la Ciudad de México. Otras Miradas Sobre un Espacio Antiguo; IG-UNAM: Mexico, 2008. [Google Scholar]
  40. Álvarez Enríquez, L.; Delgado Ramos, G.C.; Leal Martínez, A. Los Desafíos de la Ciudad del Siglo XXI; UNAM: Mexico, 2016. [Google Scholar]
  41. Garreau, J. Edge City: Life on the New Frontier; Anchor Books: New York, NY, USA, 1992. [Google Scholar]
  42. Bogart, W. Don’t Call It Sprawl. Metropolitan Structure in the 21st Century; Cambridge University Press: New York, NY, USA, 2006. [Google Scholar]
  43. Monkkonen, P. The housing transition in Mexico: Expanding access to housing finance. Urban Aff. Rev. 2011, 47, 672–695. [Google Scholar] [CrossRef]
  44. Rossi, U.; Vanolo, A. Urban Neoliberalism. In International Encyclopedia of the Social & Behavioral Sciences, 2nd ed.; Pergamon: Oxford, UK, 2015; Volume 24, pp. 846–853. [Google Scholar]
  45. Mendoza, E. Bajo Puentes Capitalinos, de la ‘Recuperación a la Privatización’. Contralínea. 2014. No. 417. Available online: www.contralinea.com.mx/archivo-revista/2014/12/23/bajo-puentes-capitalinos-de-la-recuperacion-la-privatizacion/ (accessed on 14 February 2019).
  46. Salazar, A.; Piña, G.; Romandía, S. El ‘Cártel’ Inmobiliario de CDMX; sus Operadores en el Gobierno de Mancera; La Silla Rota. 19 February 2018. Available online: https://lasillarota.com/especialeslsr/el-cartel-inmobiliario-de-cdmx-sus-operadores-en-el-gobierno-de-mancera/206357 (accessed on 14 February 2019).
  47. Salazar, A.; Piña, G.; Romandía, S. Mancera, el Cliente Frecuente del ‘Cartel’ Inmobiliario, La Silla Rota. 21 February 2018. Available online: https://lasillarota.com/especialeslsr/mancera-el-cliente-frecuente-del-cartel-inmobiliario-simon-neumann-la-silla-rota-bim-corrupcion/206753 (accessed on 14 February 2019).
  48. CDMX. Trámites—Aplicación del Sistema de Transferencia de Potencialidades del Desarrollo Urbano (Predio Receptor). Available online: www.tramites.cdmx.gob.mx/ts/501/0 (accessed on 14 February 2019).
  49. GOCM—Gaceta Oficial de la Ciudad de México. Decreto por el que se Reforma, Adiciona y Deroga la Norma de Ordenación Número 26, que Forma Parte de la Ley de Desarrollo Urbano del Distrito Federal y del Programa General de Desarrollo Urbano del Distrito Federal. No. 901. Mexico, 10 August 2010. Available online: https://data.consejeria.cdmx.gob.mx/portal_old/uploads/gacetas/4c61a2e2b4948.pdf (accessed on 14 February 2019).
  50. ADI. ADI Comprometida con Sector Inmobiliario. Inversión Inmobiliaria 2018, 60, 6–10. [Google Scholar]
  51. Logan, J.; Molotch, H. Urban Fortunes. The political Economy of Place; University of California Press: Berkeley, CA, USA, 1987. [Google Scholar]
  52. Brenner, N. (Ed.) Implosions/Explosions. Towards a Study of Planetary Urbanization; Jovis Verlag: Belin, Germany, 2014. [Google Scholar]
  53. Holston, J. Insurgent Citizenship. Disjunctions of Democracy and Modernity in Brazil; Princeton University Press: Princeton, NJ, USA, 2008. [Google Scholar]
  54. Moskowitz, P. How to Kill a City. Gentrification, Inequality and the Fight for the Neighborhood; Nation Books: New York, NY, USA, 2017. [Google Scholar]
  55. Lefebvre, H. Le Droit à la Ville; Anthropos: Paris, France, 1968. [Google Scholar]
  56. Swyngedouw, E.; Heynen, N. Urban Political Ecology, Justice and the Politics of Scale. Antipode 2003, 35, 898–918. [Google Scholar] [CrossRef]
  57. Heynen, N. Urban Political Ecology. In International Encyclopedia of Geography: People, The Earth, Environment and Technology; AAG/Wiley: Hoboken, NJ, USA, 2017. [Google Scholar] [CrossRef]
  58. Instituto de Transparencia. Acceso a la Información Pública, Protección de Datos Personales y Rendición de Cuentas de la Ciudad de México. Information requested thru the website: www.infodf.org.mx, between August–September, 2016, April–September, 2018 and on 4 January 2019
  59. COAVN. Residuos de Construcción y Demolición; Colegio de Arquitectos Vasco-Navarro: San Sebastian, Spain, 2008. Available online: www.coavn.org/coavn/repositorioGC/GestionContenidos/CAT/12-05-2008-11-06-52/CIR105RESIDUOS2.pdf (accessed on 15 February 2019).
  60. Mercader, M.P.; Olivares, M.; Ramírez de Arellano, A. Modelo de cuantificación del consumo energético en edificación. Materiales de Construcción 2012, 62, 567–582. [Google Scholar] [CrossRef] [Green Version]
  61. Delgado Ramos, G.C. Metabolismo urbano y transporte. In Transporte, Ciudad y Cambio Climático; CEIICH/PINCC, UNAM: Mexico City, Mexico, 2012. [Google Scholar]
  62. INEGI-CDMX. Anuario Estadístico y Geográfico de la Ciudad de México; INEGI: Mexico City, Mexico, 2017. Available online: www.datatur.sectur.gob.mx/ITxEF_Docs/CDMX_ANUARIO_PDF.pdf (accessed on 15 February 2019).
  63. González Reynoso, A. Evaluación de la Política de Acceso al Agua Potable en el Distrito Federal; PUEC, UNAM: Mexico City, Mexico, 2011. [Google Scholar]
  64. PAOT. Presente y Futuro de las Áreas Verdes y del Arbolado de la Ciudad de México; PAOT/Grupo Caabsa: Mexico City, Mexico, 2010; Available online: http://centro.paot.org.mx/documentos/paot/libro_areas_verdes.pdf (accessed on 14 February 2019).
  65. SHF—Sociedad Hipotecaria Federal. Índice SHF de Precios de la Vivienda en México. Mexico. Available online: www.gob.mx/cms/uploads/attachment/file/359325/Indice_SHF_2ndo_Trimestre_2018.pdf.pdf (accessed on 14 February 2019).
  66. Gobierno de la Ciudad de México. Decreto por el que se Reforman, Adicionan y Derogan Diversas Disposiciones del Código Fiscal del Distrito Federal; No. 232; Gaceta Oficial de la Ciudad de México: Mexico City, Mexico, 29 December 2016; Volume I, Available online: http://data.consejeria.cdmx.gob.mx/portal_old/uploads/gacetas/f35e9460e477a28b02bc3d4ad7f4cbf5.pdf (accessed on 14 February 2019).
  67. Gobierno del Distrito Federal. Decreto por el que se Reforman, Adicionan y Derogan Diversas Disposiciones del Código Fiscal del Distrito Federal; No. 1257; Gaceta Oficial del Distrito Federal: Mexico City, Mexico, 30 December 2011; Volume II, Available online: http://data.consejeria.cdmx.gob.mx/portal_old/uploads/gacetas/4efd3a5f9b6c1.pdf (accessed on 14 February 2019).
  68. Lin, G.C.S.; Yi, F. Urbanization of Capital or Capitalization on Urban Land? Land Development and Local Public Finance in Urbanizing China. Urban Geogr. 2011, 32, 50–79. [Google Scholar] [CrossRef]
  69. Feng, X. Local Government Debt and Municipal Bonds in China: Problems and a Framework of Rules. Cph. J. Asian Stud. 2014, 31, 23–53. [Google Scholar] [CrossRef]
  70. Liu, T.Y.; Chang, H.L.; Su, C.W.; Jiang, X.Z. China’s Housing Bubble Burst? Econ. Transit. 2016, 24, 361–389. [Google Scholar] [CrossRef]
  71. Davey, K. (Ed.) Local Governments in Critical Times: Policies for Crisis, Recovery and Sustainable Future; Council of Europe: Strasbourg, France, 2011; Available online: https://rm.coe.int/16807472af (accessed on 9 March 2019).
  72. Secretaría de Finanzas de la CDMX. Available online: https://data.finanzas.cdmx.gob.mx/inv/DeudaPublica.html (accessed on 9 March 2019).
  73. CONAGUA. Atlas del Agua en México; National Water Commission: Mexico City, Mexico, 2016; Available online: http://201.116.60.25/publicaciones/AAM_2016.pdf (accessed on 14 February 2019).
  74. Delgado-Ramos, G.C. Water and the political ecology of urban metabolism: The case of Mexico City. J. Political Ecol. 2015, 22, 98–114. [Google Scholar] [CrossRef]
  75. Fertner, C.; Grobe, J. Compact and resource efficient cities? Synergies and trade-offs in European cities. Eur. Spat. Res. Policy 2016, 23, 65–79. [Google Scholar] [CrossRef]
  76. Fatone, S.; Conticelli, E.; Tondelli, S. Environmental sustainability and urban densification. WIT Trans. Ecol. Environ. 2012, 155, 217–228. [Google Scholar] [CrossRef]
  77. PAOT. Usos del Suelo Urbano e Impactos de la Densificación en la Ciudad de México; PAOT: Mexico City, Mexico, 2006; Available online: http://paot.org.mx/centro/paot/usosdesuelo06.pdf (accessed on 14 February 2019).
  78. Delgado Ramos, G.C.; van Staden, M.; Villaseñor Franco, E. Mexican Talanoa Dialogue; CEIICH, UNAM/ICLEI International Secretariat: Mexico City, Mexico, 2018. [Google Scholar] [CrossRef]
  79. PAOT. Estudio de Zonas Impactadas por Tiraderos Clandestinos de Residuos de la Construcción; PAOT: Mexico City, Mexico, 2010; Available online: http://centro.paot.org.mx/documentos/paot/estudios/EOT-02-2010.pdf (accessed on 15 February 2019).
  80. CMIC. Plan de Manejo de Residuos de la Construcción y la Demolición. Mexico. Available online: www.cmic.org.mx/comisiones/Sectoriales/medioambiente/Flayer/PM%20RCD%20Completo.pdf (accessed on 15 February 2019).
  81. Bai, X.; Dawson, R.; Ürge-Vorsatz, D.; Delgado, G.; Salisu Barau, A.; Dhakal, S.; Dodman, D.; Leonardsen, L.; Masson-Delmotte, V.; Roberts, D.; et al. Six priorities for cities and climate change. Nature 2018, 555, 23–25. [Google Scholar] [CrossRef]
  82. SEDEMA. Inventario de Emisiones de la Ciudad de México; SEDEMA: Mexico City, Mexico, 2018; Available online: www.aire.cdmx.gob.mx/descargas/publicaciones/flippingbook/inventario-emisiones-2016/mobile/#p=2 (accessed on 12 February 2019).
  83. PAOT. Generación, Manejo y Disposición Final de Residuos de la Construcción en el Distrito Federal. Comité Técnico Asesor; PAOT: Mexico City, Mexico, 2019; Available online: http://www.paot.org.mx/contenidos/paot_docs/pdf/OPINION4_comite_tecnico.pdf (accessed on 15 February 2019).
  84. Delgado Ramos, G.C.; Guibrunet, L. Assessing the ecological dimension of urban resilience and sustainability. Int. J. Urban Sustain. Dev. 2017, 9, 151–169. [Google Scholar] [CrossRef]
  85. Delgado Ramos, G.C.; Blanco, H. Transforming urban water infrastructure for a changing climate context in Los Angles and Mexico City. In Climate Change Sensitive Cities. Building Capacities for Urban Resilience, Sustainability and Equity; Delgado, G.C., Ed.; PINCC-UNAM: Mexico City, Mexico, 2017; Available online: www.pincc.unam.mx/IMG/ccsc/CCSC.pdf (accessed on 7 March 2019).
  86. Delgado Ramos, G.C.; Mac Gregor Anciola, J.; Moreno Sandoval, R.; Zambrano González, L. La Ciudad de México que queremos; CEIICH-IB, UNAM, SUMA Urbana, Ruta Cívica, GIZ-México, Plataforma de Conocimiento para la Transformación Urbana: Mexico City, Mexico, 2019. [Google Scholar]
  87. Huang, D.; Leung, C.; Qu, B. Do bank loans and local amenities explain Chinese urban house prices? China Econ. Rev. 2015, 34, 19–38. [Google Scholar] [CrossRef] [Green Version]
  88. Isunza Vizuet, G. Efectos urbano-ambientales de la política de vivienda en la Ciudad de México. Espiral 2009, 17, 129–159. [Google Scholar]
  89. Cities IPCC. Global Research and Action Agenda on Cities and Climate Change Science; Cities IPCC: Geneve, Switzerland, 2018; Available online: https://citiesipcc.org/beyond/global-research-and-action-agenda-on-cities-and-climate-change-science/ (accessed on 14 March 2019).
  90. IPCC. Global Warming of 1.5 °C; IPCC: Geneve, Switzerland, 2019; Available online: https://www.ipcc.ch/sr15 (accessed on 14 March 2019).
  91. Seto, K.C.; Dhakal, S.; Bigio, A.; Blanco, H.; Delgado, G.C.; Dewar, D.; Huang, L.; Inaba, A.; Kansal, A.; Lwasa, S.; et al. Human Settlements, Infrastructure, and Spatial Planning. In Climate Change 2014: Mitigation of Climate Change. Contribution of Working Group III to the Fifth Assessment Report of the Intergovernmental Panel on Climate Change; IPCC: Cambridge, UK; New York, NY, USA, 2014. [Google Scholar]
  92. Satterthwaite, D.E.; Revi, A.; Aragón-Durand, F.; Corfee-Morlot, J.; Kiunsi, R.; Pelling, M.; Roberts, D.C.; Solecki, W.; da Silva, J.; Dodman, D.; et al. Urban Areas. In Climate Change 2014: Impacts, Adaptation, and Vulnerability. Part A: Global and Sectoral Aspects. Contribution of Working Group II to the Fifth Assessment Report of the Intergovernmental Panel on Climate Change; IPCC: Cambridge, UK; New York, NY, USA, 2014. [Google Scholar]
  93. Cheshmehzangi, A.; Butters, C. Sustainable living and urban density: The choices are wide open. Energy Procedia 2016, 88, 63–70. [Google Scholar] [CrossRef]
  94. Beattie, C.; Bunning, J.; Stewart, J.; Newman, P.; Anda, M. Measuring Carbon for Urban Development Planning. Int. J. Clim. Chang. Impacts Responses 2012, 3, 35–49. [Google Scholar] [CrossRef]
  95. Ahmad, M.; Zhao, Z.Y.; Li, H. Revealing stylized empirical interactions among construction sector, urbanization, energy consumption, economic growth and CO2 emissions in China. Sci. Total Environ. 2018, 657, 1085–1098. [Google Scholar] [CrossRef]
  96. Brunner, P.H.; Rechberger, H. Practical Handbook of Material Flow Analysis; Lewis Publishers: New York, NY, USA, 2004. [Google Scholar]
  97. EEA—European Environment Agency. Urban Adaptation to Climate Change in Europe—Challenges and Opportunities for Cities Together with Supportive National and European Policies; EEA Report No. 2/2012; Publications Office of the European Union: Luxemburg, 2012; Available online: www.eea.europa.eu/publications/urban-adaptation-to-climate-change/at_download/file (accessed on 12 March 2019).
  98. Friend, R.; Moench, M. What is the purpose of urban climate resilience? Implications for addressing poverty and vulnerability. Urban Clim. 2013, 6, 98–113. [Google Scholar] [CrossRef]
  99. CDMX. Plan de Acción Climática. Ciudad de México 2014–2020; SEDEMA: Mexico City, Mexico, 2014; Available online: www.gob.mx/cms/uploads/attachment/file/164914/PACCM-2014-2020completo.pdf (accessed on 14 February 2019).
  100. Romero-Lankao, P.; Hughes, S.; Qin, H.; Hardoy, J.; Rosas-Huerta, A.; Borquez, R.; Lampis, A. Scale, urban risk and adaptation capacity in neighborhoods of Latin American cities. Habitat Int. 2014, 42, 224–235. [Google Scholar] [CrossRef]
  101. Obra Chueca Monitoring. Available online: https://obrachueca.com/ (accessed on 14 March 2019).
Figure 1. Mexico’s total construction value generated from 2006 and 2018. Ups and downs during the period analyzed responded to market dynamics in the private building sector and the variable allocation of public spending which, in addition slows down at the end and the beginning of each fiscal year. These figures are also an effect of increasing prices of construction materials and rental of equipment (which is usually fixed in US dollars), the loss of purchasing power, and the contraction of mortgage credits (in 2010 mortgage credits added-up 637,700 but by 2018 those were only 550,300 credits; most of them, in terms of value, were originated in Mexico City, followed by Nuevo León, Jalisco and the State of Mexico) [20]. Source: author’s own elaboration based on reference [21].
Sustainability 11 01980 g001
Figure 2. Intensity of the built environment expansion in Mexico City from 2012 to 2018. Source: author’s own elaboration.
Sustainability 11 01980 g002
Figure 3. Urban development and land use complaints in Mexico City, 2012–2018. Source: author’s own elaboration.
Sustainability 11 01980 g003aSustainability 11 01980 g003b
Table 1. Global asset universe according to Savills (US$ trillions, 2015).
AssetInvestableNon-InvestableAll
All real estate$81$136$217
Residential$54$108$162
High quality, global, commercial$19$10$29
Agricultural land$8$18$26
Other investments--$155
Equities$55-$55
Outstanding securitized debt$94-$94
All gold ever mined--$6
Global mainstream asset universe--$372
Note: Source: [5].
Table 2. Growth trends of metropolitan areas, population and urban footprint.
YearMetro AreasMetropolitan Combined Population (Million Inhabitants)Metropolitan Administrative Territorial Extension (km2)
1960129-
19802626.1-
20005551.5142,377
20157475.1323,030
Note: Source: author’s own elaboration based on references [8,9,10].
Table 3. Expansion of the built-environment in Mexico City, 2012–2018.
MunicipalitySquare Meters of Construction Authorized (SMCA)aSMCA per CapitahSquare Meters of New Buildings DailySMCA/Municipality SurfaceSMCA/Municipality Surface AdjustediNumber of new BuildingsDegree of Opacity and Deficiency of Informationj
Álvaro Obregón 3,097,749.44 b4.11341382.71072.6615
Azcapotzalco1,427,658.79 b3.5618425.2845.4259
Benito Juárez4,948,286.31 c12.820361848.43582.12824LT, BO*
Coyoacán 1,435,155.18 b2.3621265.6632.2665
Cuajimalpa de Morelos1,636,652.70 b8.7708219.51167.4327DI
Cuauhtémoc2,452,493.97 b4.61061754.81466.8683
Gustavo A. Madero583,860.72d0.548066.5146.9230LT, DI
Iztacalco564,523.77d1.4464244.5481.996DI
Iztapalapa417,593.48 b0.218036.876.0202DI
Magdalena Contreras204,263.48 b0.88827.0196.1132DI
Miguel Hidalgo3,476,988 b9.51505497.91855.01107
Milpa Alta459.38 e0.0030.20.0160.0742DI
Tláhuac129,000 f0.37015.0629.875LT, DI
Tlalpan1,204,903 b1.752139.14148.9583
Venustiano Carranza 769,166.08 g1.7333226.9476.2170LT, DI
Xochimilco444,999.97 b1.019235.183.7161
Mexico City22,793,754.33.3
(average)
638.6
(average)
317.8
(average)
766.3
(average)
8131------
Sustainability 11 01980 i001a Based on the following periods of time: 2430 days (2012 to September of 2018); 2310 days (2012 to April 2018); 1945 days (2013 to 2018); 1825 days (2012 – 2016); and 1215 days (2015 – 2018).
b Data corresponds to the period of January 2012 to April 2018.
c Data corresponds to the period of January 2012 to August 2018.
d Data refers to the surface of the property and corresponds to the period of January 2015 – to May 2018.
e Reported by the local government: during 2012 – 2018 there were only two new (formal) edifications.
f Data period is from January 2012 to December 2016.
g SMCA data corresponds to the period of January 2012 to September of 2016. Data from September 2016 to April 2018 refers only to the surface of the property.
h Based on population data from March 2015.
i SMCA/total municipality surface minus green spaces, conservation land and roads surface (based on [61,64]).
j Degree of opacity or lack of transparency during the process of accessing to information [LT], the difficulty of the process (bureaucratic obstacles) [BO], and the deficiency of information delivered by local authorities [DI].
* Despite the high BO and LT, the information delivered after 3 years of unsuccessful solicitations was of good quality.Fuente: author’s own elaboration based on information delivered by local authorities.
Table 4. Disparities between the average residential property values and cadastral land values in Mexico City 2017.
MunicipalityReal Estate Property Values
(Thousands of MX$/m2)
Highest Property Value Range for Taxation (MX$/m2)Disparity (%)
20172017
HouseApartmentAverage
Álvaro Obregón49.337.743.59688–13,279440–327
Azcapotzalco3412.1234692491
Benito Juárez43.233.738.410,562–11,452364–335
Coyoacán42.927.735.36575–7992536–441
Cuajimalpa52.437.74511,643386
Cuauhtémoc55.233.144.110,207–11,554432–382
Gustavo A. Madero3015.422.74483–4516506–502
Iztacalco1611.913.93170440
Iztapalapa14.910.612.73845–3934331–324
Magdalena Contreras41.122.231.65531572
Miguel Hidalgo51.735.143.416,306–17,529266–247
Milpa Altan.a.740–800n.a.
Tláhuac14.58.411.41641697
Tlalpan20.28.414.310,248139
Venustiano Carranza22.611.316.95132330
Xochimilco49.39.429.33446851
Note: divergencies between the average value of houses and apartments increases in areas were the value of land is lower and decreases in areas were value of land is higher. This is due to both a pro-poor fiscal policy in the former and a higher taxation level for valuable properties, yet without either closing the gap between market value and taxation value. Source: author’s own elaboration based on the average price per square meter of houses and apartments according to reference [33] and the cadastral land values of 2017 [66].
Table 5. Ecological impacts of vertical urban expansion in Mexico City, 2012–2018.
MunicipalityTotal Construction Waste and Demolition Debris (tons) aCarbon Footprint of Construction Materials b (tons of CO2e)Potential Consumption of Water c (m3, daily)Potential Consumption of Electricity d (MWh, daily)Complaints Related to urban Development and Land Use e
SteelAluminumCement & ConcreteTotal
Álvaro Obregón 743,460276,62912,391589,551878,57142,150117956
Azcapotzalco342,638127,4895710271,706404,90615,59146322
Benito Juárez1,187,588441,88119,793941,7381,403,41358,5381831298
Coyoacán 344,437128,1595740273,132407,03214,328531195
Cuajimalpa de Morelos392,796146,1536546311,481464,18030,07382235
Cuauhtémoc588,598219,0079810466,748695,56632,961771465
Gustavo A. Madero140,12652,1382335111,118165,107716917742
Iztacalco135,48550,4112258107,437160,107633517341
Iztapalapa100,22237,291167079,474118,436365712842
Magdalena Contreras49,02318,24081738,87457,93230867142
Miguel Hidalgo834,477310,49513,907661,726986,12947,2001561169
Milpa Alta110411.848713040.0118
Tláhuac30,96011,51951624,55036,5868703119
Tlalpan289,176107,5974819229,312341,72910,65041674
Venustiano Carranza 184,60068,6863076146,384218,147876123317
Xochimilco106,80039,738178084,690126,209368513200
Mexico City5,470,5012,035,48291,1754,338,0166,464,673285,06484910,035
Sustainability 11 01980 i002a Estimation based on a construction waste and demolition debris generation factor per square meter of 240 kilograms. It assumes a ratio of waste and debris generation, associated to new building construction, of 0.16 m3 per square meter (the average between 0.12 – 0.2 m3 per square meter estimated by COAVN [59]). The weight density factor used was 1.5 tons per cubic meter (based on [59]).
b Average consumption factors of construction materials per square meter used: 47 kg of steel per m2 of new construction, 0.5 kg for aluminum, 44 kg for cement, and 1027 kg of concrete (based on reference [60]). Material emissions used: 1.9 kg of GHG per kg of steel, 8 kg of GHG per kg of aluminum, and 180 gr of GHG per kg of concrete (based on reference [61]).
c Considering the average number of people per household for each municipality in 2015 [62] and an average surface of household of 100 m2 (about the double of low-cost housing in Mexico), the potential average water consumption associated with SMCA has been estimated for each municipality. SMCA has been divided by 100, then multiplied by the average people per household and, finally, multiplied by the average per capita consumption of water for each municipality (data corresponds to 2007 [63]).
d Based on average consumption of electricity per household by the end of 2016 (residential consumption [62]) and assuming an average size of household unit of 100 m2. An electricity commercial consumption factor has been used for 5% of SMCA (based on reference [62]). It assumes an average size of commercial units of 2000 m2, which is then multiplied by the average commercial consumption of electricity in each municipality (MWh consumption per commercial unit in 2016; based on [62]).
e Based on data from Mexico City’s Public Prosecutor on Environmental and Land Planning Office (Procuraduría Ambiental y del Ordenamiento Territorial, PAOT). Requisition No. 0313500001019, 4 January 2019 [58]
Source: author’s own elaboration.

