Abstract
The adoption of Building Information Modeling (BIM) will definitely improve the efficiency and quality of the AEC (architecture, engineering and construction) industry. However, many factors need to be improved before BIM adoption. Based on the interaction between institutions and technology, factors affecting BIM adoption in AEC organizations, within the context of China, are identified and analyzed. Firstly, 21 factors are identified by literature research. Then, an interpretive structural model (ISM) technique is used to establish a hierarchical structure, and matrix impacts cross-reference multiplication applied to a classification (MICMAC) is used for factor classification. The results indicate that corporate/project leadership and software functionality are the two fundamental factors. What’s more, the dynamic mechanism has gradually changed from top-down to a combination of top-down and bottom-up.
1. Introduction
BIM is a digital representation of physical and functional characteristics and a shared knowledge resource for information about a facility, forming a reliable basis for making decisions during its life cycle [1]. Because BIM realizes the integration and sharing of building life-cycle information [2], it will fundamentally fill in the information gap between different stages [3]. In addition, BIM enables the resolution of traditional project performance issues such as cost overruns, schedule delays and quality defects [4], which is of great significance to improve production efficiency in the construction industry. Therefore, BIM will gradually become an essential element rather than a choice [5].
Despite the advantages of BIM in many aspects, the breadth and depth of applying BIM in practice are not satisfactory [6,7,8]. Many scholars have carried out research on BIM. Succar et al. conducted a comparative analysis for the BIM proliferation policies adopted by different countries. From the national level, suggestions were recommended for BIM adoption [9,10]. Son et al. [11], Lee et al. [2], and Gurevich et al. [12] discussed how to promote BIM adoption in design organization, construction organization and public facility institution respectively. From the personal level, Ding et al. [13] and Aibinu et al. [14] studied the key factors that affected the adoption of BIM by designers and cost consultants. Mamter et al. [15] and Grit et al. [16] constructed system dynamics models to find out the root cause of the realization of BIM adoption-affecting factors such as BIM awareness.
It can be found that, regardless of the level of BIM adoption research, influencing factors or key success factors are applied in most studies. However, previous research has seldom systematically focused on the interactive relationships between these factors. It will be of great difficulty for managers to figure out which factors are more important. For this reason, managers in AEC organizations tend to have no idea how to adopt BIM on a step by step basis. Therefore, identifying interactive relationships among these factors is necessary. On this basis, fundamental factors can be found, together with interactive relationships, in order to develop a practical strategy.
Orlikowski et al. [17] studied how information technology spreads under the co-evolution system of institutions and technology, which is an inspiration for the research angle of this paper. Therefore, from the AEC organization level, this study attempts to study the factors affecting BIM adoption from the perspective of interaction between institutions and technology. ISM is a good method to find out fundamental factors and direct factors. Further, the hierarchical model indicates the dynamic process of improving factors. On this basis, this paper aims to uncover the dynamic mechanism of BIM adoption by clarifying the interaction between institutional and technological factors with the ISM method and MICMAC technique.
2. Literature Review
BIM Adoption
Many scholars have spared no effort to enhance the adoption of BIM. According to different objects, based on their respective research perspectives or theories, they adopted different research methods and discussed this issue separately.
Critical success factors (CSFs) have been always a hot topic. Researchers from different countries tend to study domestic CSFs for BIM adoption. Ding et al. [12] and Tsai et al. [18,19] conducted questionnaire surveys in Shenzhen and Taiwan respectively. However, their conclusions seem to be contradictory. Tsai et al. concluded that support from top management is the most important factor by ranking analysis, and Ding et al. concluded that management support is not the statistically significant factor within the structural equation model (SEM) [20]. Attarzadeh et al. [21] studied CSFs for BIM adoption in building projects and government agencies in Singapore; Ozorhon and Karahan [22] surveyed in Turkey. Sixteen CSFs were identified and the relative importance of them was also examined. Won et al. [23] conducted an international survey with leading BIM experts and quantitative data analysis to derive a manageable number of CSFs.
Some researchers regard BIM as a technology. Research from a technology acceptance perspective has been conducted. Lee et al. [2] employed technology acceptance behavioral related theory, including the theory of planned behavior (TPB) and task-technology fit model, to conduct a BIM acceptance model for construction organizations. Hypothesis testing was performed with SEM. Son et al. [11] studied critical factors affecting architects’ behavioral intentions to adopt BIM with extended the technology acceptance model (TAM); Lee & Yu [5] and Juan [24] realized that the ratio of users who abandoned BIM is rather high, which resulted from organizations not being ready for various elements required to utilize BIM. A discriminant model of BIM acceptance readiness, and an organizational readiness and technology acceptance assessment model with ANN were developed to determine firms to adopt BIM respectively. Lee and Yu [25] compared different influences of the same factor on BIM adoption in the United States and South Korea. On this basis, a BIM acceptance strategy suitable for the South Korea was proposed. On the individual level, Unified theory of acceptance and use of technology (UTAUT) is usually employed for BIM adoption. Addy et al. [26] studied factors affecting BIM adoption for quantity surveyors in Ghana with UTAUT; Howard et al. [27] added the variable of attitude and employs moderators of experience and voluntariness to UTAUT. Empirical study indicated that BIM was perceived as an unrewarded addition to existing work processes.
However, the research above focuses more on factors affecting BIM adoption and ignores the BIM effect in turn, which attracts the attention of scholars. Arayici et al. [28] incorporated technology implementation in socio-cultural environment. A case study demonstrated a guideline at the operational level. Sackey et al. [29] used the Leavitt sociotechnical model to analyze the alignment process of multiple interest groups in a BIM-enabled intra-organizational construction context. Ahuja et al. [30] adopted the framework of technology-organization-environment (TOE) to analyze barriers of low adoption in India and concluded that India was in experimentation stage. According to case studies of five large UK government facility agencies, Gurevich et al. [12] proposed a BIM adoption impact map, within which social impacts and outcomes were emphasized.
Taking BIM as an innovation is also an important perspective. Singh and Holmstrom [31] employed innovation diffusion theory (IDT) and Maslow’s motivational theory on a hierarchy of needs to explore psychological processes behind the motivation. They found that organizations also demonstrated a hierarchical ordering of innovation-related needs as well as individuals. Similar to Singh and Holmstrom’s research, Hosseini et al. [32] divided BIM adoption into three levels. The conclusions indicated that only 5% smart medium-sized enterprises (SMEs) had tried Level 3 and an uncertain return on investment (ROI) is the main barrier. From a broad perspective, namely market scale, Succar and Kassem [9,10] introduced five new conceptual constructs for assessing macro-BIM adoption and informing the development of market scale BIM diffusion policies. On the consideration of the dynamic nature of technology evolution, Lu et al. [33] used activity theory to establish an analytical activity system model (ASM) to analyze the BIM use in building Operation & Maintenance in a dynamic way. Innovation-oriented and demand-oriented drivers were identified with the context of social, political and technical influences. According to three case studies with a theoretical lens of loosely coupled systems, Papadonikolaki [34] connected intro and inter-organizational levels of BIM implementation and figured out the mechanism within the process. Ahmed and Kassem [35] constructed a unified BIM adoption taxonomy to classify adoption drivers and factors in different stages of the BIM adoption process.
Some other perspectives are employed for BIM adoption research. Mamter et al. [15] adopted system dynamics modelling approach to develop casual loop diagram which presented the relationship between the perceived variables in Malaysia; Ngowtanasuwan and Hadikusumo [16] also employed system dynamics to find the root cause of BIM adoption in Thai. They found that BIM training was the best choice to optimize company performance. Base on institutional theory, Cao et al. [36] studied the impacts of isomorphic pressure on BIM adoption in construction projects. Empirical study indicated that coercive and mimetic pressures both significantly influenced the extent of project-level BIM adoption. Cao et al. [37] also linked the motivations and practices of design organizations to implement BIM. Zhao et al. [38] considered that BIM implementation involved various risks and modelled the paths of these risks.
From a review of the literature above, several conclusions can be drawn: (1) The technology acceptance model, innovation diffusion theory and key success factors are the three main theoretical bases for research perspectives of BIM adoption; (2) Although there are differences in theoretical bases of research perspectives, the structural equation model (SEM) is the mainstream analytical method; (3) The main object covers individuals, projects, organizations, industries and countries. More detailed studies have been carried out within each object, for example, the organizational level includes design organization, construction organization and small and medium-sized company; (4) The results of previous studies are mainly validated models, factors or frameworks.
It can be seen that most of the research has studied the factors affecting BIM adoption through questionnaires or literature as the basis for further analysis. However, the identification of these factors mostly lacked a unified perspective. In addition, the structural equation model, statistical analysis and other methods can’t figure out the interactive relationships among these factors. Therefore, from the perspective of the interaction between institutions and technology, this study attempts to figure out interactive relationships among these factors and find fundamental factors.
3. Research Methods
A hybrid method is employed to achieve this study (Figure 1). Firstly, critical factors affecting BIM adoption are identified by literature studies. Next, a questionnaire survey by E-mail and face-to face interview is used to collect expert opinion on the contextual relationship between these factors. We could get the initial reachable matrix by aggregating their opinion. This is followed by an ISM analysis, including power analysis and hierarchical analysis, to calculate the final reachable matrix and depict the hierarchical structure. Finally, MICMAC technique is used to classify these factors as a supplement.
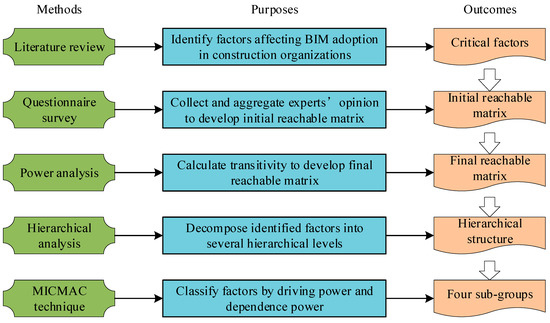
Figure 1.
Research process.
3.1. ISM
Interpretive structural modeling (ISM) was first proposed by Warfield in 1973 [39]. The main idea of this method is to decompose a complex system into multiple subsystems (elements) by way of the expert’s practical experience and knowledge, and to construct a multi-level structural model [40] which helps to clarify the complex relationship between system elements [41]. The ISM technique demands a small, but high-quality sample of questionnaire surveys. Because of its high efficiency, the ISM technique has been widely used in the energy industry, knowledge management, and construction management etc. [42,43,44,45].
3.2. MICMAC
Dependency power and driving power are two key concepts of MICMAC. The driving power and dependence power can be calculated by adding together all the entry values of the row and the column respectively, corresponding to the concerned factor in the final reachable matrix [45]. As a result, the influencing factors can be divided into four categories: autonomous group, dependent group, linkage group and independent group.
3.3. Questionnaire Survey
Before conducting questionnaires, we organized several workshops to discuss and modify the preliminary questionnaire for easy understanding and convenient completion. What’s more, we investigated design companies, construction organizations and government agencies etc. to further understand what the industry cares about. After that, a snowball sampling technique was applied to recruit experts with rich knowledge and expertise on BIM adoption. Twenty experts from different kinds of organizations were contacted by telephone, WeChat, and e-mails. Five of them agreed to participate in this research.
BIM has been implemented for several years in China. However, the promulgation of “Outline of Informatization Development in the Construction Industry from 2011 to 2015” marks the beginning of BIM implementation at the government level. In the construction industry of China, the policy issued by the government has major effects on practice, such as the supervision system, Public-Private Partnership and Engineering Procurement Construction. Nevertheless, the implementations of PPP and EPC, as well as BIM, are not satisfactory. At present, BIM policy doesn’t induce deep BIM adoption. BIM application is also fragmented without a unified system. The twenty experts we contacted are knowledgeable in BIM. The five experts who participated in our research are also experienced in BIM. According to their BIM-related experiences, they are pioneers for BIM adoption in China. What’s more, we found that quite a few BIM practitioners could not understand what these factors mean. To acquire relative real data, we didn’t send the questionnaire to those who were unfamiliar with the factors. On the considerations above, the selection of experts was difficult. Finally, only five experts completed our questionnaire. We should clarify that the selection criteria are well developed. Besides, the five experts come from different construction organizations, and included an owner, a designer, a contractor and a researcher. Therefore, their aggregated opinion on BIM adoption is representative for the construction industry in China.
Although the number of samples is relatively small, no previous references suggested the required minimum number of experts for ISM [45]. According to references [46,47], this is common and acceptable in construction research, and meaningful results can be obtained when well-developed selection criteria are used for sampling. However, the experts’ subjectivity is indeed unavoidable. Therefore, consensus analysis, a technique for structured interview data analysis, was used to validate the data in our survey. In summary, ISM is pertinent for this research. Profiles of the five experts are shown in Table 1.

Table 1.
Profiles of the five experts.
A structured questionnaire is designed for the acquisition of the experts’ opinion. The five experts conducted a pairwise comparison of 21 factors by answering the questions “Do you think factor i directly affect factor j?”. Explanations of 21 factors are attached to the questionnaire to ensure precise and consistent understanding. Previous studies [43,45] suggested the principle “the minority gives way to the majority” for the integration of different opinions. However, with the consideration of a small number of experts, the conceptual relationship is confirmed when five experts share the same opinion. Therefore, we may omit some direct relationships. However, the identified conceptual relationships exist to a great degree, which give more inspiration for future research.
4. Literature Studies on the Factors Affecting BIM Adoption of the AEC Organization
Before identifying factors from the perspective of interaction between institution and technology, it is necessary to clarify the essence of these concepts, including formal institution, informal institution and technology. Institutions are the human-devised constraints that shape human interactions [48]. An important difference between formal and informal institutions is the speed at which they can evolve: while a determined policy-maker (legislator, reformer) can change formal institutions overnight, informal institutions cannot but evolve relatively slowly and are more difficult to influence by policy [49]. Technology in this paper refers to technology related to BIM, especially collaboration with BIM.
The formal institutional factors, informal institutional factors and technological factors of BIM adoption are identified by literature research. It should be pointed out that all the factors here are intra-organizational, and factors of this paper focus on how to enhance BIM adoption in the AEC organization. External factors such as government policies [9,10] are not within the scope of the study.
4.1. Identification of Formal Institutional Factors
Through literature research, we have refined the following eight formal institutional factors: recruitment policy, BIM training system, financial support, standardized work procedures for BIM, BIM effectiveness evaluation criteria, formal incentive programs for using BIM, new or amended forms of construction contracts, and R&D plan. For their respective explanations, see Table 2.
Table 2.
Formal institutional factors and their explanations.
4.2. Identification of Informal Institutional Factors
The following eight informal institutional factors are obtained with the same approach as the previous section. The eight factors are awareness of BIM and its benefits, organizational innovation and learning, information and knowledge sharing, effective cooperation among project participants, corporate/project leadership style, early involvement, willingness to change the way of thinking and working, and trust and respect. The respective explanations of these factors are shown in Table 3.
Table 3.
Informal institutional factors and their explanations.
4.3. Identification of Technological Factors
Five technological factors can be obtained in the same way. These factors are simplicity, interoperability and compatibility, cooperative management platform, standards to guide specific implementation, and functionality. The respective explanations of these factors are shown in Table 4.
Table 4.
Technological factors and their explanations.
5. ISM Based Analysis on Representative Factors
5.1. Establishment of Initial Reachable Matrix (IRM)
Four symbols are usually used to express the relationship among factors in ISM method:
- V indicates that factor i directly affects factor j;
- A indicates that factor j directly affects factor i;
- X indicates that factor i and factor j interact with each other;
- O indicates that factor i has nothing to do with factor j.
A structured questionnaire is designed based on the above symbols. Consensus analysis was used to validate the data from experts with UCINET 6 for Windows (Version 6.232). Specifically, the largest eigenvalue is 0.562, the 2nd largest eigenvalue is 0.160, then the ration of largest to next is 3.50, which is greater than 3. This supports the assumption that the overall relationship between these factors is single. In sequence, the structural self-intersection matrix (SSIM) of influencing factors can be obtained, as is shown in Table 5.
Table 5.
Structural self-intersection matrix.
By transforming the SSIM of the aforementioned factors into the IRM, symbols like V, A, X and O can be replaced by 0 or 1 according to Equation (1). The IRM is shown in Table 6.
Table 6.
Initial reachable matrix.
5.2. Establishment of Final Reachable Matrix (FRM)
A basic assumption of ISM method is transitivity. If factor i affects factor j, factor j affects factor k, then factor i will definitely affect k. The FRM can reveal whether there is a path connecting one factor to another. If the cell (i, j) in the final reachable matrix is equal to 0, then there is no direct or indirect relationship from factor i to factor j. According to this principle, the final reachable matrix can be computed according to the following Boolean rules:
In Equation (2), is the initial reachable matrix, is the unit matrix, and is the final reachable matrix. According to Equation (2), the final reachability matrix is obtained with MATLAB 2018a by loop statement, as shown in Table 7.
Table 7.
Final reachable matrix.
5.3. Hierarchical Analysis
In order to understand the hierarchical relationship of influencing factors, the reachable set R (Fi) and the antecedent set A (Fi) of each factor are listed. The reachable set R (Fi) represents that Fi can influence elements whose corresponding value is 1 on line i. The antecedent set A (Fi) represents that elements whose corresponding value is 1 on column i. C (Fi) contains elements that can affect Fi and also be affected by Fi. If R (Fi) is a complete subset of A (Fi), the element will be picked out and assigned with a specific level [62]. Specifically, this paper finds out the elements in which C (Fi) is equal to R (Fi) as the first level. Then the rows and columns of the first layer elements will be deleted, and the remaining elements form a new reachable matrix. Then the authors will find out the elements in which C (Fi) is equal to R (Fi) as the second layer. Likewise, the authors can find out the factors contained in each level. The hierarchical division of factors is shown in Table 8.
Table 8.
Hierarchical division of factors.
To make the hierarchical structure clearer, the interpretive structural model for AEC organizations’ BIM adoption shown in Figure 2 is constructed. In Figure 2, factors at the same level in previous analysis are placed in the same layer.
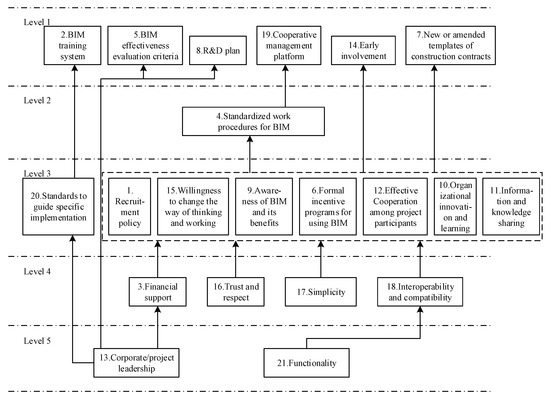
Figure 2.
Hierarchical structure of factors affecting BIM adoption.
Corporate/project leadership and software functionality are two fundamental factors affecting BIM adoption in AEC organizations. They influence the other factors directly or through transmission. This conclusion is consistent with Dossick’s [63] conclusion that information technology adoption in the construction industry depends on personal leadership. Further, Won [26] concluded that the interest and willingness of project managers are the most important success factors in BIM adoption. Especially in AEC organizations in China, a leader always has administrative power. Without leaders’ authorization, the organization can’t promote BIM adoption from bottom to top. The importance of leadership determines that BIM adoption must be from top to bottom. In addition, BIM technology is a powerful tool to solve the problems associated with an information island. Accordingly, BIM-related software should be able to realize the integration and customization of lifecycle information. This is also the reason why software functionality is another fundamental factor.
The factors including training system, BIM effectiveness evaluation criteria, R&D plan, cooperative management platform, early involvement, and contract templates are at the top of the model. These factors are the most related to BIM adoption. It can be concluded that most of these factors belong to the formal institution. Hence, the establishment of BIM-related formal institution can directly enhance BIM adoption in AEC organizations.
The factors in the middle layer are the indirect factors affecting BIM adoption. They transfer the improvement of the underlying factors to the top level. However, it is worth noting that trust and respect, as well as the simplicity of software are two relatively independent factors. They are not affected by the underlying factors and should be improved independently. This is another key point for organizations to enhance BIM adoption.
An overview of the interpretive structural model shows that the improvement of leadership style and software functionality are the most fundamental for BIM adoption. Then, a series of financial support is formed based on the leaders’ support for BIM implementation. In this background, the informal institutional factors such as awareness of BIM, way of thinking and willingness to change have gradually improved. It is shown that the dynamic mechanism for BIM adoption has gradually changed from top-down to combination of top-down and bottom-up after the previous improvement. This also confirms that BIM adoption is promoted by the co-evolution of formal institution, informal institution and technology.
5.4. MICMAC Analysis
In order to clearly describe the strength relationship among the influencing factors and further explore the characteristics of the influencing factors, this paper applies MICMAC to supplement the interpretive structural model. Dependency power is obtained by summing the columns of elements in the final reachable matrix, and driving power is obtained by summing the rows of elements in the final reachable matrix. Based on dependency and driving power, the influencing factors can be divided into four categories: autonomous group, dependent group, linkage group and independent group. The final classification is shown in Figure 3.
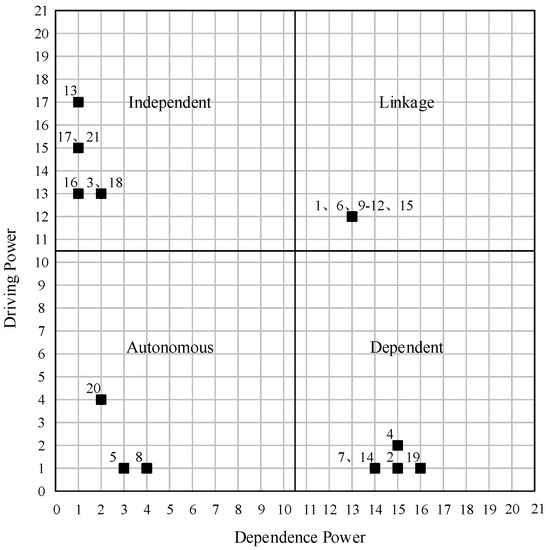
Figure 3.
Factor classification by dependence and driving power.
According to the results achieved by MICMAC analysis, we can draw the following four conclusions:
- (1)
- The influencing factors of autonomous group are 5, 8 and 20. For weak dependence and force, they are not closely related to other elements in the system. Therefore, these factors are not the focus of attention.
- (2)
- The influencing factors of the dependent group are 2, 4, 7, 14 and 19. These factors have the characteristic of strong dependence and weak force, and their improvement mainly depends on the improvement of other elements in the system. For example, the most dependent factor 19 (cooperative management platform) is affected directly or indirectly by other factors inevitably, except for the rest of the five factors on the same top level. The BIM cooperative management platform integrates all the project information and process. Therefore, only if the institutional and technological factors are improved, a BIM cooperative management platform can be built in the organization. Usually, most of these factors belong to the formal institution, which indicates that the formation of a formal institution related to BIM depends more on the improvement of other factors. In addition, these factors are mostly at the top of the model, so we should pay attention to whether these factors have been improved in time.
- (3)
- The influencing factors of the linkage group are 1, 6, 9, 12 and 15. The characteristics of the group are that they are all highly dependent and motived, so they are susceptible to other factors and generate self-feedback. For instance, only when the members have a full understanding of BIM and its benefits can they try this new way of working. Besides, their thinking mode will be gradually influenced in the process. As the members are able to cooperate effectively based on BIM, BIM and its benefits will be deepened in their mind and again drive the transformation of their thinking patterns. Considering that most of the factors belong to the informal institution, it is necessary for managers to establish reasonable standards to measure these factors.
- (4)
- The influencing factors of the independent group are 3, 13, 16, 17, 18 and 21, which have strong driving power but weak dependence. The improvement of these factors often promotes the improvement of other factors, which are the key factors of BIM adoption. These six factors involve three aspects: formal institution, informal institution and technology, indicating that BIM adoption needs coordination among these three aspects. In addition, BIM traits including the simplicity, interoperability and compatibility, and software functionality belong to an independent group. These technological factors are essentially required to reduce the time and monetary cost of BIM adoption for organizations. If an organization can’t complete the transformation in a relatively fast and low-cost way, the transformation process may have a bad effect on the organization causing irreversible damage. Therefore, the key for an organization to enhance BIM adoption is to reduce the cost of technology transformation.
6. Conclusions, Shortcomings and Prospects
This paper mainly studies how BIM adoption can be enhanced in AEC organizations. Starting from research on the interaction between institutions and technology, this paper firstly identifies the factors affecting BIM adoption through literature research. Then, the ISM and MICMAC method are used for empirical analysis. Several conclusions can be drawn as follows. First, the corporate/project leadership and software functionality are two fundamental factors. Second, solving the related technological factors to reduce the cost of transformation is the key to further enhance BIM adoption. In addition, the dynamic mechanism has gradually changed from top-down to a combination of top-down and bottom-up, which is manifested in informal institutions promoting the formation of formal institutions and improving technological factors. These conclusions will provide innovative guidance for AEC organizations in technological change and depict a roadmap for enhancing BIM adoption.
Compared with previous studies, the main contribution of this paper is to conduct a systematic study of the relationships among these factors. We not only find out the two fundamental factors, but also figure out the conceptual relationships among them. In addition, there is also a preliminary quantitative understanding of the driving power and dependency power of each factor. For managers in AEC organizations, the fundamental factors are the beginning of BIM adoption and the source of power for continuous enhancement; factors characterized with high driving power are the key for BIM adoption; the direct factors, namely factors at the top level, are important indicators to reflect the level of BIM adoption. In summary, effective guidance for AEC organization lies in clear casual relationships and exterior-interior relationships among these factors.
However, there remain some shortcomings in this study. Although the ISM method adopted in this study can find out the fundamental factors affecting BIM adoption, it is difficult to quantify the relationships among them. In addition, this study adopts the perspective of AEC organizations. In fact, the adoption of BIM requires the joint promotion of countries, associations, organizations and individuals, which is also the point for further study. Further, the number of consulted experts is small, and the research context is in China. Different conclusions may be drawn with a large number of experts from different countries. With deeper BIM implementation and the improvement of BIM awareness in China, an extensive investigation will overcome these shortcomings. In the future, we can also employ structural equation modeling (SEM) to test the conceptual relationships established in this study.
Author Contributions
Conceptualization, G.M. and J.J.; Methodology, J.J. and S.J.; Formal Analysis, J.J. and G.M.; Investigation, J.D., and S.S.; Writing—Original Draft Preparation, J.J. and J.D.; Writing—Review and Editing, S.S. and G.M.; Supervision, G.M.; Funding Acquisition, M.G.
Funding
This research was funded by the National Natural Science Foundation of China (grant number 71671128).
Acknowledgments
The authors wish to acknowledge the supports from the responders of the questionnaires.
Conflicts of Interest
The authors declare no conflict of interest.
References
- AIA (American Institute of Architects). Integrated Project Delivery: A Guide; Version 1; American Institute of Architects: Washington, DC, USA, 2017; Available online: http://www.aia.org/ipdg (accessed on 20 July 2018).
- Lee, S.; Yu, J.; Jeong, D. BIM Acceptance Model in Construction Organizations. J. Manag. Eng. 2015, 31, 04014048. [Google Scholar] [CrossRef]
- Le, Y.; Zheng, X.; Li, Y.; Lu, Y.; Bai, J. Study on the value flows and driver paths of BIM technology application based on SVN. J. Eng. Manag. 2018, 32, 71–78. [Google Scholar]
- Chen, L.; Luo, H. A BIM-based construction quality management model and its applications. Autom. Constr. 2014, 46, 64–73. [Google Scholar] [CrossRef]
- Lee, S.; Yu, J. Discriminant model of BIM acceptance readiness in a construction organization. KSCE J. Civ. Eng. 2017, 21, 555–564. [Google Scholar] [CrossRef]
- Jensen, P.A.; Jóhannesson, E.I. Building information modelling in Denmark and Iceland. Eng. Constr. Archit. Manag. 2013, 20, 99–110. [Google Scholar] [CrossRef]
- Cao, D.; Wang, G.; Li, H.; Skitmore, M.; Huang, T.; Zhang, W. Practices and effectiveness of building information modelling in construction projects in China. Autom. Constr. 2015, 49, 113–122. [Google Scholar] [CrossRef]
- Juszczyk, M.; Vyskala, M.; Zima, K. Prospects for the use of BIM in Poland and the Czech Republic—Preliminary Research Results. Procedia Eng. 2015, 123, 250–259. [Google Scholar] [CrossRef]
- Succar, B.; Kassem, M. Macro-BIM adoption: Conceptual structures. Autom. Constr. 2015, 57, 64–79. [Google Scholar] [CrossRef]
- Kassem, M.; Succar, B. Macro BIM adoption: Comparative market analysis. Autom. Constr. 2017, 81, 286–299. [Google Scholar] [CrossRef]
- Son, H.; Lee, S.; Kim, C. What drives the adoption of building information modeling in design organizations? An empirical investigation of the antecedents affecting architects’ behavioral intentions. Autom. Constr. 2015, 49, 92–99. [Google Scholar] [CrossRef]
- Gurevich, U.; Sacks, R.; Shrestha, P. BIM adoption by public facility agencies: Impacts on occupant value. Build. Res. Inf. 2017, 45, 610–630. [Google Scholar] [CrossRef]
- Ding, Z.; Zuo, J.; Wu, J.; Wang, J.Y. Key factors for the BIM adoption by architects: A China study. Eng. Constr. Archit. Manag. 2015, 22, 732–748. [Google Scholar] [CrossRef]
- Aibinu, A.; Venkatesh, S. Status of BIM Adoption and the BIM Experience of Cost Consultants in Australia. J. Prof. Issues Eng. Educ. Pract. 2014, 140, 04013021. [Google Scholar] [CrossRef]
- Mamter, S.; Aziz, A.R.A.; Zulkepli, J. Root Causes Occurrence of Low BIM Adoption in Malaysia: System Dynamics Modelling Approach. AIP Conf. Proc. 2017, 1903, 080011. [Google Scholar]
- Grit, N.; Bonaventura, H.W.H. System dynamics modelling for BIM adoption in Thai architectural and engineering design industry. Constr. Innov. 2017, 17, 457–474. [Google Scholar]
- Orlikowsk, W.J.; Barley, S.R. Technology and institutions: What can research on information technology and research on organizations learn from each other? MIS Q. 2001, 25, 145–165. [Google Scholar] [CrossRef]
- Tsai, M.H.; Mom, M.; Hsieh, S.H. Developing critical success factors for the assessment of BIM technology adoption: Part I. Methodology and survey. J. Chin. Inst. Eng. 2014, 37, 845–858. [Google Scholar] [CrossRef]
- Tsai, M.H.; Mom, M.; Hsieh, S.H. Developing critical success factors for the assessment of BIM technology adoption: Part II. Analysis and results. J. Chin. Inst. Eng. 2014, 37, 859–868. [Google Scholar] [CrossRef]
- Liao, L.; Teo, E.A.L. Critical Success Factors For Enhancing the Building Information Modelling Implementation in Building Projects in Singapore. J. Civ. Eng. Manag. 2017, 23, 1029–1044. [Google Scholar] [CrossRef]
- Attarzadeh, M.; Nath, T.; Tiong, R.L.K. Identifying key factors for building information modelling adoption in Singapore. Proc. Inst. Civ. Eng.-Manag. Procure. Law 2015, 168, 150030. [Google Scholar]
- Ozorhon, B.; Karahan, U. Critical Success Factors of Building Information Modeling Implementation. J. Manag. Eng. 2017, 33, 04016054. [Google Scholar] [CrossRef]
- Won, J.; Lee, G.; Dossick, C. Where to Focus for Successful Adoption of Building Information Modeling within Organization. J. Constr. Eng. Manag. 2013, 139, 04013014. [Google Scholar] [CrossRef]
- Juan, Y.K.; Lai, W.Y.; Shih, S.G. Building Information Modeling Acceptance and Readiness Assessment in Taiwanese Architectural Firms. J. Civ. Eng. Manag. 2017, 23, 356–367. [Google Scholar] [CrossRef]
- Lee, S.; Yu, J. Comparative Study of BIM Acceptance between Korea and the United States. J. Constr. Eng. Manag. 2016, 142, 05015016. [Google Scholar] [CrossRef]
- Addy, M.; Adinyira, E.; Ayarkwa, A. Antecedents of building information modelling adoption among quantity surveyors in Ghana: An application of a technology acceptance model. J. Eng. Des. Technol. 2018, 16, 313–325. [Google Scholar] [CrossRef]
- Howard, R.; Restrepo, L.; Chang, C.Y. Addressing individual perceptions: An application of the unified theory of acceptance and use of technology to building information modelling. Int. J. Proj. Manag. 2017, 3, 107–120. [Google Scholar] [CrossRef]
- Arayici, Y.; Coates, P.; Koskela, L.; Kagioglou, M.; Usher, C.; O’reilly, K. Technology adoption in the BIM implementation for lean architectural practice. Autom. Constr. 2011, 20, 189–195. [Google Scholar] [CrossRef]
- Sackey, E.; Tuuli, M.; Dainty, A. Sociotechnological Systems Approach to BIM Implementation in a Multidisciplinary Construction Context. J. Manag. Eng. 2015, 31, A4014005. [Google Scholar] [CrossRef]
- Ahuja, R.; Jain, M.; Sawhney, A.; Arif, M. Adoption of BIM by architectural firms in India: Technology-organization-environment perspective. Archit. Eng. Des. Manag. 2016, 12, 311–330. [Google Scholar] [CrossRef]
- Singh, V.; Holmström, J. Needs and technology adoption: Observation from BIM experience. Eng. Constr. Archit. Manag. 2015, 22, 128–150. [Google Scholar] [CrossRef]
- Hosseini, M.R.; Banihashemi, S.; Chileshe, N.; Namzadi, M.O.; Udeaja, C.E.; Rameezdeen, R.; McCuen, T. BIM adoption within Australian Small and Medium-sized Enterprises (SMEs): An innovation diffusion model. Constr. Econ. Build. 2016, 16, 71–86. [Google Scholar] [CrossRef]
- Lu, Q.; Chen, L.; Lee, S.; Zhao, X. Activity theory-based analysis of BIM implementation in building O&M and first response. Autom. Constr. 2018, 85, 317–332. [Google Scholar]
- Papadonikolaki, E. Loosely coupled systems of innovation: Aligning BIM adoption with implementation in Dutch construction. J. Manag. Eng. 2018, 34, 05018009. [Google Scholar] [CrossRef]
- Ahmed, A.L.; Kassem, M. A unified BIM adoption taxonomy: Conceptual development, empirical validation and application. Autom. Constr. 2018, 96, 103–127. [Google Scholar] [CrossRef]
- Cao, D.; Li, H.; Wang, G. Impacts of Isomorphic Pressures on BIM Adoption in Construction Projects. J. Constr. Eng. Manag. 2014, 140, 04014056. [Google Scholar] [CrossRef]
- Cao, D.; Li, H.; Wang, G.; Zhang, W. Linking the Motivations and Practices of Design Organizations to Implement Building Information Modeling in Construction Projects: Empirical Study in China. J. Manag. Eng. 2016, 32, 04016013. [Google Scholar] [CrossRef]
- Zhao, X.; Feng, Y.; Pienaar, J.; O’Brien, D. Modelling paths of risks associated with BIM implementation in architectural, engineering and construction projects. Archit. Sci. Rev. 2017, 60, 472–482. [Google Scholar] [CrossRef]
- Liu, H.; Wang, M.J.; Miroslaw, J.S. Analysis on the Critical Success Factors of Construction Innovation Based on Integrated Structural Modeling. Sci. Technol. Manag. Res. 2016, 36, 20–26. [Google Scholar]
- Mathiyazhagan, K.; Govindan, K.; Noorul-Haq, A.; Geng, Y. An ISM approach for the barrier analysis in implementing green supply chain management. J. Clean. Prod. 2013, 47, 283–297. [Google Scholar] [CrossRef]
- Warfield, J.W. Developing interconnected matrices in structural modeling. IEEE Trans. Syst. Men Cybern. 1974, 4, 51–81. [Google Scholar]
- Ansari, M.F.; Kharb, R.K.; Luthra, S.; Shimmi, S.L.; Chatterji, S. Analysis of barriers to implement solar power installations in India using interpretive structural modeling technique. Renew. Sustain. Energy Rev. 2013, 27, 163–174. [Google Scholar] [CrossRef]
- Shen, L.; Song, X.; Wu, Y.; Liao, S.; Zhang, X. Interpretive Structural Modeling based factor analysis on the implementation of Emission Trading System in the Chinese building sector. J. Clean. Prod. 2016, 127, 214–227. [Google Scholar] [CrossRef]
- Lim, M.K.; Tseng, M.L.; Tan, K.H.; Bui, T.D. Knowledge management in sustainable supply chain management: Improving performance through an interpretive structural modelling approach. J. Clean. Prod. 2017, 162, 106–116. [Google Scholar] [CrossRef]
- Gan, X.; Chang, R.; Zuo, J.; Wen, T.; Zillante, G. Barriers to the transition towards off-site construction in China: An Interpretive structural modeling approach. J. Clean. Prod. 2018, 197, 8–18. [Google Scholar] [CrossRef]
- Liu, G.; Li, K.; Zhao, D.; Mao, C. Business model innovation and its drivers in the Chinese construction industry during the shift to modular prefabrication. J. Manag. Eng. 2016, 33, 04016051. [Google Scholar] [CrossRef]
- Liu, H.; Skibniewski, M.J.; Wang, M. Identification and hierarchical structure of critical success factors for innovation in construction projects: Chinese perspective. J. Civ. Eng. Manag. 2016, 22, 401–416. [Google Scholar] [CrossRef]
- North, D.C. Institution, Institutional Change and Economic Performance; Joint Publishing Company, Shanghai People’s Publishing House: Shanghai, China, 1994. [Google Scholar]
- Pelikan, P. Bringing institutions into evolutionary economics: Another view with links to changes in physical and social technologies. J. Evol. Econ. 2003, 13, 237–258. [Google Scholar] [CrossRef]
- Memon, A.H.; Rahman, I.A.; Memon, I.; Azman, N.I. BIM in Malaysian construction industry: Status, advantages, barriers and strategies to enhance the implementation level. Res. J. Appl. Sci. Eng. Technol. 2014, 8, 606–614. [Google Scholar] [CrossRef]
- Kiani, I.; Sadeghifam, A.N.; Ghomi, S.K.; Marsono, A.K. Barriers to implementation of building information modeling in scheduling and planning phase in Iran. Aust. J. Basic Appl. Sci. 2015, 9, 91–97. [Google Scholar]
- Chan, C.T.W. Barriers of implementing BIM in construction industry from the designers’ perspective: A Hong Kong experience. J. Syst. Manag. Sci. 2014, 4, 24–40. [Google Scholar]
- Azhar, S.; Khalfan, M.; Maqsood, T. Building information modelling (BIM): Now and beyond. Constr. Econ. Build. 2015, 12, 15–28. [Google Scholar] [CrossRef]
- Morlhon, R.; Pellerin, R.; Bourgault, M. Building Information Modeling implementation through maturity evaluation and Critical Success Factors management. Procedia Technol. 2014, 16, 1126–1134. [Google Scholar] [CrossRef]
- Newton, K.; Chileshe, N. Enablers and Barriers of Building Information Modelling (BIM) Within South Australian Construction Organisations. Ph.D. Thesis, University of New South Wales, Sydney, Australia, 2012. [Google Scholar]
- Stanley, R.; Thurnell, D. The benefits of, and barriers to, implementation of 5D BIM for quantity surveying in New Zealand. Aust. J. Constr. Econ. Build. 2014, 14, 105–117. [Google Scholar] [CrossRef]
- Abubakar, M.; Ibrahim, Y.; Kado, D.; Bala, K. Contractors’ perception of the factors affecting building information modelling (BIM) adoption in the Nigerian construction industry. In Proceedings of the 2014 International Conference on Computing in Civil and Building Engineering, Orlando, FL, USA, 23–25 June 2014; pp. 167–178. [Google Scholar]
- Jin, R.; Hancock, C.; Tang, L.; Chen, C.; Wanatowski, D.; Yang, L. Empirical Study of BIM Implementation–Based Perceptions among Chinese Practitioners. J. Manag. Eng. 2017, 33, 04017025. [Google Scholar] [CrossRef]
- Li, H.; Ng, S.T.; Skitmore, M.; Zhang, X.; Jin, Z. Barriers to building information modelling in the Chinese construction industry. Proc. Inst. Civ. Eng.-Munic. Eng. 2017, 170, 105–115. [Google Scholar] [CrossRef]
- Bin Zakaria, Z.; Mohamed Ali, N.; Tarmizi Haron, A.; Marshall-Ponting, A.; Abd Hamid, Z. Exploring the adoption of Building Information Modelling (BIM) in the Malaysian construction industry: A qualitative approach. Int. J. Res. Eng. Technol. 2013, 2, 384–395. [Google Scholar]
- Khosrowshahi, F.; Arayici, Y. Roadmap for implementation of BIM in the UK construction industry. Eng. Constr. Archit. Manag. 2012, 19, 610–635. [Google Scholar] [CrossRef]
- Iyer, K.C.; Sagheer, M. Hierarchical Structuring of PPP Risks Using Interpretative Structural Modeling. J. Constr. Eng. Manag.-ASCE 2010, 136, 151–159. [Google Scholar] [CrossRef]
- Dossick, C.S.; Neff, G. Organizational divisions in BIM enabled commercial construction. J. Constr. Eng. Manag. 2010, 136, 459–467. [Google Scholar] [CrossRef]
© 2019 by the authors. Licensee MDPI, Basel, Switzerland. This article is an open access article distributed under the terms and conditions of the Creative Commons Attribution (CC BY) license (http://creativecommons.org/licenses/by/4.0/).