Abstract
Urban agriculture in Global North cities is strongly promoted as a sustainable solution to achieve different goals, such as food production, quality of life, and well-being. Although several attempts have been made to evaluate urban agriculture production, few studies have investigated food production in a multitemporal geospatial way and considered per capita population needs, gender, and age strata consumption. This study presents a spatiotemporal quantification of urban agriculture in the city of Milan (Italy) for assessing food self-provisioning potential. We utilized high-resolution Google Earth images and ancillary data to create a detailed cadaster of urban agriculture for the years 2007 and 2014. Based on four scenarios of food production and statistical data on vegetables and cereals consumption, we estimated current total production and requirements for the city dwellers. Our results showed that the actual extension of vegetable gardens (98 ha) and arable land (2539 ha) in the best scenario could satisfy approximately 63,700 and 321,000 consumers of vegetables and cereal products, respectively. Overall, current urban agriculture production is not able to meet vegetables and cereal consumption for more than 1.3 million city residents. Scenario estimates suggest rethinking land use promoting horticultural production to achieve more sustainable food systems.
1. Introduction
Over the past decade, urban agriculture (UA) in Northern cities has spurred renewed interest in the scientific literature, urban planners, and city managers as a sustainable, nature-based, and smart solution for a plethora of city-wide issues. Positive impacts were recognized for resilience, self-reliance, and social, economic, and environmental sustainability [1]. Central for modern cities is the role of UA toward social-related aspects and pressing issues, such as food security, community capacity, and equitable food systems [2,3]. In addition, involvement in growing practices and food production can contribute to community services and charity, education and social inclusion, as well as a tool for nonprofit organizations and food planners to achieve their missions with disadvantaged communities [4,5].
Urban spaces where food production takes place can be framed within urban green infrastructures, namely, multifunctional ecological areas (e.g., backyard, rooftop gardens, public gardens, and open spaces) that provide ecosystem services and benefits for human well-being (i.e., regulating, provisioning, supporting, cultural) [6,7]. Apart from food supply and nutrition issues, opportunities and benefits include the positive potentials for climate regulation [8], greenhouse gas emissions [9], air quality [10], biodiversity [11], storm-water runoff [12], rainwater harvesting [13], cultural and health issues [14], while controversies are reported for water resources [15,16]. Furthermore, UA can represent an interesting way of saving money reducing the budget earmarked for the purchase of fresh food [17]. Overall, recent systematic literature reviews summarized an interesting analysis of provisioning ecosystem services and disservices [18] and the main benefits provided by UA [19].
Within a variety of forms, scales, and locations [20,21], the main dimension of UA is undoubtedly related to management of spaces, agricultural techniques (i.e., fertilizers, irrigation, plant protection), collection and distribution of food produced. As suggested by many scholars, UA has great potential to produce food for city dweller’s diet [22], although other pointed out that self-reliance in food would require a significant expansion of the cultivated areas [23,24]. As recently stated by Richardson and Moskal [23], sustainable food production in cities is affected by many factors, ranging from available areas to dimension, climate, topography, spatial pattern, water availability, soil quality, and finally motivations that drive city gardeners [25].
To date, several cross-sectional studies in the Global North have investigated food crop production in cities in connection with land use/cover analyses for assessing UA self-reliance and self-provisioning within managed parcels, as well as the potential for vegetable production on unmanaged and vacant areas. For instance, UA in New York (USA) and Osaka (Japan) has been explored by Hara et al. [26] in a study mapping land use and comparatively evaluating the current and potential scenario of vegetable production. A GIS-based inventory approach has been used by McClintock et al. [27] to extract vacant lots in Oakland (USA) for assessing the potential contribution of these areas to the inhabitants’ vegetation needs. Similarly, Richardson and Mokal [23] utilized Object-Based Image Analysis to estimating food production capacity in Seattle (USA) and the city’s food needs. In a comprehensive study of UA in Boston (USA), Saha and Eckelman [28] reported on the geospatial assessment of the ground level and rooftop potential to supply citizen’s fruit and vegetable demand. While vein Kremer and DeLiberty [29] used remote sensing and GIS techniques to explore UA production and growth potential in Philadelphia’s (USA) residential yards.
Previous research studies on geospatial analysis of UA potential seem to be mainly focused on North American cities. In turn, these studies mainly considered vegetable consumptions, paying too little attention to dietary diversity, such as cereals consumptions. On the contrary, only a few studies have investigated and mapped food system scenarios and self-sufficiency in European metropolitan cities [30], differentiating between land uses, food crops, crops yields, and per capita requirements.
Within this framework, the goal of this case study is threefold: (i) creating a geospatial cadaster of UA in Milan (Italy) using web-mapping tools and GIS with very high-resolution satellite and aerial imagery; (ii) assessing the current UA food self-provisioning within the municipality by considering different food scenarios regarding vegetables and cereal consumption; (iii) examining future implications to optimize the potential of available land for food provisioning. This study makes an original contribution to advance the understanding of UA dynamics in the study area and provides some important insights and recommendations for sustainable food systems.
2. Materials and Methods
2.1. Study Site
The study was conducted within the administrative boundaries of the municipality of Milan, Northern Italy (Figure 1). It is the second largest city of the country and capital of the Lombardy region, covers an area of 182 km2, and has a population of 1.352 million inhabitants [31]. Milan has a warm temperate climate with cold, foggy winters and warm, sultry summers. The study area has a flat relief with an average altitude of 100 m above sea level. According to the land use dataset of Lombardy region [32], the area is mainly covered by artificial surfaces (79%), followed by agriculture (17.8%), forests (2.2%), and water bodies (1%). Over the past century and early years of 21st century, the heavy urbanization process has led to the intensive land use change dynamics in this area, resulting in the degradation of ecosystems and landscape and determining a progressive erosion of agricultural land. The urban region has suffered land take processes during the last decade (1999–2012) with about 30,000 ha converted predominantly to productive, commercial, and residential areas [33]. Today, the remnant farming spaces and agricultural activities are confined to the edges of municipality boundary, juxtaposed with urban settlements of surrounding municipalities. In this sense, those can be all defined as UA surfaces, constantly threatened by soil sealing and poorly planned urbanization processes affecting peripheries and the hinterland area. Despite being a post-industrial city, Milan has a long history of UA activities dating back to the inception of the industrial period; nowadays they play a key role in feeding the city and in helping to maintain resilient, equitable, culturally appropriate food systems [34]. Urban food production and food themes are being perceived as relevant by citizens and policymakers. Milan is one of the first Italian cities that has defined a successful food policy recognized with an international prize. The city has fostered the adoption of the Milan Urban Food Policy Pact on the occasion of the Milan Expo 2015 “Feeding the Planet, Energy for Life” signed by 180 cities all over the world interested to achieve more sustainable food systems [34].
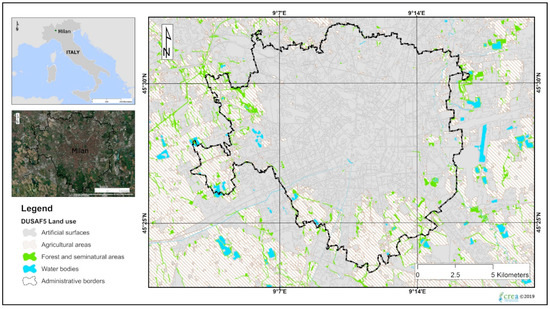
Figure 1.
The city of Milan with its administrative boundaries with the five land use classes from the lasts land use map of the Lombardy region [32]. Background images are obtained from Esri’s ArcGIS Online Basemaps.
2.2. Mapping Approach
Geospatial evaluation of UA areas was based on a multitemporal and iterative process throughout the photointerpretation of Google Earth (GE) images and ancillary data (Figure 2). The mapping approach follows the methodology recently proposed by Pulighe and Lupia [35] for the city of Rome, where the visual interpretation of candidate parcels allows to define a detailed UA dataset. In the past, the potential for spatial inventories using GE has been demonstrated in other metropolitan areas, such as the seminal study by Taylor and Lovell [36] on mapping public and private spaces of UA in Chicago.
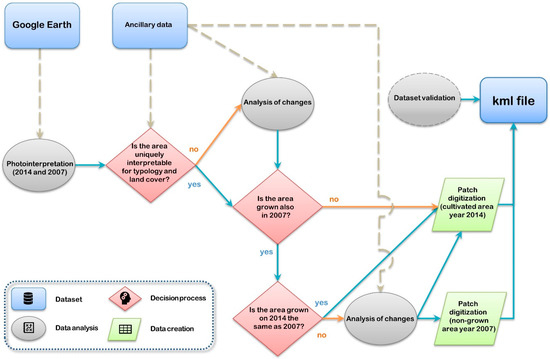
Figure 2.
The mapping process for the multitemporal (2014 and 2007) identification and digitization of UA parcels by using web-mapping tools and ancillary data proposed by Pulighe and Lupia [35].
Six typologies of UA (Table 1), community gardens, residential gardens, urban farms, institutional gardens, illegal gardens, and nurseries, and five agricultural land uses, arable crops, horticulture, vineyard, orchards, and mixed crops, were detected. Regarding rooftop farming, considering that it is in an early stage of development, it is not considered in this investigation.

Table 1.
Typologies, description and identification profile of urban agriculture plots identified in Milan. Reprinted and modified from Pulighe and Lupia [35].
Photointerpretation was carried out using a reference square grid of 1 km size superimposed over the whole municipality area to facilitate the visual analysis and UA patches digitization. Very high-resolution images, dated 15 September 2007 and 10 April 2014 in GE, were used. The chosen images are free of clouds and guarantee detection, recognition, and classification of farmed areas, typically in spring and summer. These images, at the scale of photointerpretation, corresponds to a specific acquisition of very high-resolution commercial satellites.
In addition, GE images in cities have generally an overall horizontal accuracy close to 1 m [37], suitable for recognizing small cultivated parcels and for creating a detailed UA maps with a scale close to 1:2500. The digitization process was guided by a photointerpretation profile to recognize typologies, year, land use, and cover, by using a system of numeric codes to record the information of each UA parcel. The study area was visually scanned in search for cultivated patches with images acquired in different dates for recognizing changes of land cover. Firstly, photointerpretation started using the image of 2014 to detect unique typologies, land cover pattern, texture, color, shape, and size of objects, following the fundamentals of air-photo interpretation [38]. Secondly, the image of 2007 was analyzed to detect any change in the cultivation pattern. The use of ancillary data (e.g., street images on Google Street View, perspective view, and image rotation on Bing Maps) facilitated the interpretation to discover features not previously detected due to the presence of shadows, trees or buildings. Finally, following the analysis of the parcels and possible changes, a digitization process was carried out on the image of the year 2014 for cultivated parcels and on the image of the year 2007 for non-grown areas. At the end of the digitization, a validation process was carried out to improve the reliability of the final map using an independent UA dataset of and by leading a double-check on randomly selected cells from the reference square grid. For a detailed description of the mapping procedure and further explanations about the classification process using GE tools and web-mapping services, see the cited study [35].
2.3. Productivity Scenarios and Food Consumption
To estimate the total food production potential for the city of Milan, the UA area mapped for the year 2014 was aggregated in two distinct land uses, namely, vegetable gardens and arable land. This choice was based on the fact that the garden typologies identified can be reconducted to a single typology (i.e., vegetable gardens with horticultural production), while urban farms mapped are essentially arable land with cereal production. This aggregation was adopted to obtain conventional and comparable yields, according to the available literature that measured food production with field surveys or averaged values for a unit area (square meter or hectare). A recent study by Sanyé-Mengual et al. [39] evaluated home gardens productivity in Padua (Italy) using life cycle assessment considering 21 crop cycles and agronomic practices, reporting an average vegetable production of 6.47 kg/m2/year. Similarly, McDougall et al. [40] investigated gardens yields in Sydney and Wollongong (Australia), including 62 varieties of vegetables, fruits, and herbs, reporting a mean output of 5.94 kg/m2/year. In the same study, the authors highlighted that the average mean yield figure from 15 field-scale studies around the world is 6.19 kg/m2/year. Similar findings were obtained by Algert et al. [41], where the yield of vegetables harvested from 10 community gardens in San Jose (California, USA) is 3.66 kg/m2/year.
In contrast, other authors simply refer to average yield values taken from the bibliography. In a study which set out to determine UA potential in Boston (USA), McClintock et al. [27] based their calculations on three potential average yields, namely, 2.24 kg/m2/year (conventional), 3.36 kg/m2/year (low-biointensive), and 5.6 kg/m2/year (medium-biointensive). In another recent study, Hara et al. [26] considered vegetable productivity up to 5.12 kg/m2/year, calculated on statistics for assessing UA potential in Osaka (Japan). Taken together, these cases support the view that documented crop yields vary across countries, crop variety, soil conditions, weather, and gardeners’ motivations. In summary, it is reasonable to assume that the observed differences vary in a range close to a medium production value near 5 kg/m2/year.
Following these premises, in this paper, the total productivity for vegetable gardens was calculated by multiplying the total area available with two potential yield representing scenarios for conventional (2.5 kg/m2/year) and medium management (5 kg/m2/year). Regarding arable land, considering that these are intensive areas managed by agricultural holdings generally cultivated with cereals, the productivity was calculated by multiplying the total area available with crop yields for wheat (5.72 t/ha/year) and maize (11.94 t/ha/year), representing two realistic alternative productivity scenarios. Yield data for wheat and maize was derived from crop production statistics of the Lombardy region for the year 2014 provided by the Italian National Institute of Statistics [42].
Moving on now to consider food consumption, food self-provisioning potential was calculated considering daily per capita average consumption of vegetables and cereals for the whole population and productivity scenarios. More specifically, the average Italian consumption of vegetables for all ages, males, and females is equal to 211.2 g/day, while the average Italian consumption of cereals for all ages, males, and females is equal to 258.4 g/day [43]. Feeding population was calculated by dividing total yields for the whole study area with per capita consumption. Population consumption for the food scenarios with vegetables and cereals by age groups, gender, and inhabitants’ strata was also computed. More specifically, individual consumptions were expressed as kg/day and MJ/day for vegetables and cereals, respectively. Energy content for cereals was taken from the Food Composition Databases, United States Department of Agriculture [44]. For a more detailed understanding of food self-provisioning potential and population that could be feed, consumption of vegetables and cereals, based on potential yield produced, was expressed as percentage rate that meets the needs of the population strata. In the case of vegetable production, in comparison with the two productivity scenarios, a potential consumption scenario based on the whole area converted on gardens production was proposed.
3. Results and Discussion
3.1. Multitemporal Mapping of Urban Agriculture
Summary statistics of spatiotemporal characteristics of UA parcels are reported in Table 2, while spatial distribution across the city is depicted in Figure 3. A total area of 2847 ha (2117 polygons) and 2660 (1921 polygons) was cultivated in 2007 and 2014, respectively, with a clear decreasing trend of cultivated area that affects almost all typologies. Urban farms decreased from 2713.89 to 2539.2 ha (−174.69 ha), followed by community gardens (−11.554 ha), residential gardens (−1.98 ha), while institutional gardens grew up to 3.9 ha and nurseries remained substantially stable. Similarly, to the UA area, the number of cultivated polygons showed a decrease between 2007 and 2014. Residential gardens had a steady decline from 828 to 753, urban farms from 797 to 701, community gardens from 380 to 346, while illegal gardens had a slight fall from 45 to 36. In contrast, the number of institutional gardens gradually increased up to 65, while nurseries remained stable with 20 polygons.
Table 2.
Statistics of urban agriculture area in the city of Milan.

Figure 3.
Polygons of urban agriculture identified in Milan with a superimposed square grid of 1 km size used as a reference during photointerpretation (left). Example of cultivated parcels classified as community garden (top-right) and arable land (bottom-right). Background images are obtained from Google Earth.
As suggested by Pulighe and Lupia [35] for the city of Rome, the size range of polygons is strictly related to UA typologies and land use. For instance, urban farms have, as expected, the largest parcels, ranging from 160.43 to 282,981 m2, while the smallest parcels belong to residential gardens, ranging from 13.09 m2 (i.e., the minimum mapping unit) to 2,426.43 m2. Regarding the estimation of agricultural land uses, arable crops are clearly the largest class considering that urban farms are the most representative in terms of area. Further details on the evolution of land use classes in the period 2007–2014 are provided in Annex Table S1.
The results of this study confirms a constant erosion of UA areas (mainly arable lands) in the city of Milan that is likely to be related to soil sealing and urbanization process. A recent study on land-take by the Italian Environmental Agency [45] reported an increase of 19 ha urbanized in the year 2017 in the city of Milan, with about 10,500 ha of sealed soil in the whole municipality. Consistent with the literature about UA in ancient cities with densely and compacted urbanized patterns [17,46], most of the cultivated polygons are generally concentrated on the edge of the municipality and belong to arable land. In the peri-urban zone, isolated cultivated polygons belong mostly to residential gardens, where front and backyard gardens are in connection to detached houses. Community gardens and illegal gardens are generally located without a specific urban pattern, generally located near public green areas, parks or nearby roadsides and railways.
3.2. Food Production and Consumption
Table 3 reports the summary statistics for vegetable gardens and arable land with regard to the current UA area available by considering four productivity scenarios. The total amount of vegetables that can be produced with the productivity scenario of 2.5 kg/m2/year is equal to 2456.75 t/year over 98 ha available. Considering that the average Italian per capita consumption of vegetables equal to 77.09 kg/year [43], it was estimated that Milan’s vegetable gardens area could feed a population equal to 31,869 inhabitants. When the productivity scenario of 5 kg/m2/year is considered, the vegetable yield is equal to 4913.5 t/year that can potentially satisfy a population of 63,738 inhabitants. In the first scenario, approximately 2.4% of the city dwellers can be fed considering that in 2014, Milan’s inhabitants were equal to 1,324,169. Assuming more efficient productivity by doubling the yields as in the second scenario, approximately 4.8% of the city dwellers can be fed. As shown in Table 3, the feeding population for 1 ha of vegetables is equal to 324 and 648 inhabitants for the first and second productivity scenario, respectively.
Table 3.
Urban agriculture productivity scenarios and feeding population potential.
As far as the arable lands and cereal yields are concerned, the productivity scenario of common wheat with a yield of 5.72 t/ha/year is equal to 14,524.22 t/year over 2539 ha available. Assuming an average Italian per capita consumption of cereals equal to 94.32 kg/year [43], it was estimated that arable land cultivated with common wheat could feed a population equal to 153,983 inhabitants. Estimated yields for the scenario of maize crop with a yield of 11.94 t/ha/year is equal to 30,318.05 t/year over 2539 ha available, with a feed population potential equal to 321,413 inhabitants. As mentioned in the paragraph on productivity scenarios, cereals yield is derived from statistical data for the study area, while population intake was assumed as whole meal flour, not considering yield and grain processing losses (e.g., the rate of sifting or grinding yield).
Figure 4 depicts the projection straight-lines of feeding population potential with respect to the UA hectares available (green dashed line) and Milan inhabitants (black dashed line) for (a) vegetable gardens and (b) arable land, respectively. The continuous line indicates the current production, while the dotted line indicates the potential production until the needs of the city’s inhabitants are met.

Figure 4.
The projections of vegetable (a) and cereal production (b) on arable land in relation to population and hectares available.
As shown, vegetable gardens and arable lands can feed only a small part of the current population for all four scenarios (see the black cross in the Figure 4a,b, while to reach all the needs of the population (black square), a larger cultivated area is required. With regard to vegetable gardens production, it is interesting to note that all the vegetable demand of the city’s inhabitants could be reached with about 2000 ha with a productivity scenario of 5 kg/m2. On the contrary, with the lower productivity scenario of 2.5 kg/m2, a breakeven point with the UA available area (green dashed line) is reached with food self-provisioning for about 860,000 inhabitants. Practically, the area enclosed by the straight lines of the population and productivity, to the right of the vertical line of UA available hectares, is a non-sustainable area of food provisioning for the city. In this case, assuming constant productivity and the total area available, city needs could be achieved only by importing vegetable production outside of the municipality.
On comparing arable lands production with cereals, it is found that the non-sustainable food self-provisioning on these areas is more evident. In fact, considering a productivity scenario of common wheat with 2539 ha available, only slightly more than 11% of the population needs could be reached; while the more intensive productivity scenario of maize would allow achieving more than 24% of the population needs. Considering the projected figures for arable land, sustainable cereals self-provisioning in Milan could be reached only with nearly 21,000 ha and 10,000 ha for common wheat and maize, respectively.
To gain a deeper insight into UA potentials and food needs, Milan population consumption of vegetables products and cereals were distinguished based on population age strata and gender. Table 4 provides the summary statistics for individual and aggregated vegetable consumption (t/year—fresh and processed) expressed as a percentage of self-sufficiency, based on productivity scenarios and yields reported in Table 3 and considering a potential conversion of the whole available area into vegetable gardens. Similarly, Table 5 presents the summary statistics for individual and aggregated cereals consumption (MJ/year—cereals products and substitutes) expressed as a percentage of self-sufficiency based on productivity scenarios and yields reported in Table 3. What is striking about the figures in Table 4 is that current vegetable production on both scenarios can satisfy only a limited population strata consumption (whole city 101,429 t/year). For instance, males in the age strata 0–2.9 years consumes 17% of vegetable production (scenario 2.5 kg/m2), while considering the age strata 3–9.9 years, the aggregate consumption rises to 107% of current production. As graphically explained above in Figure 3a, one interesting finding that can be seen in Table 4 is that 77% of the whole population consumption could be satisfied converting the available area for vegetable production. About the energy consumption of wheat and corn production (energy values MJ for 1000g), data reported in Table 5 indicates that both scenarios are unable to satisfy Milan population strata consumption (whole city 1,797,889,847 MJ/year). For instance, males in the age strata 1–17 years (103,420 inhabitants) consumes 74% of energy derived from wheat production or 33% derived from maize. Overall, the whole energy value derived from common wheat and maize is equal to 206,753,724 MJ/year and 456,968,808 MJ/year, respectively (see yields in Table 3). Considering that the whole population requirement is equal to 1,797,889,847 MJ/year, consequently, the population consumption is equal to 870% and 393% of energy derived from wheat and maize, respectively.
Table 4.
Milan population consumption of vegetable products based on population age strata and gender.
Table 5.
Milan population consumption of cereals products based on population age strata and gender.
3.3. Practical Implications
The results of this study seem to be consistent with a recent review which found critical issues of sustainability for UA, especially for cereals and calories provisioning potentials [47]. This view is supported by Martellozzo et al. [48] who carried out a global analysis of the spatial constraint to meet the vegetable consumption on urban areas, asserting that UA cannot satisfy food self-provisioning, especially for densely populated cities. In the same vein, some authors argue that UA has limited potential to ensure urban food security and needs of urban inhabitants [22,23,27,49]. As suggested by Horts et al. [21], currently, it is unreasonable that urban agriculture becomes a solution for disadvantaged populations who lack access to land or for unskilled people to cultivate their own food and increase food security.
The reported figures show clearly that during the last years the available areas for growing food in Milan, apart from potential limitations and uncertainty of the spatial inventory [35], are shrinking reducing the food self-provisioning potential that will be exacerbated in the upcoming years if land use policies will not limit land-take. As noted by Badami and Ramankutty [49], land availability is a major limiting factor for UA in achieving urban food security. Additionally, this involves well-known environmental and societal sustainability challenges, such as ecosystem services loss, gentrification, and human health issues [50,51]. As depicted in Figure 5, expected future population growth might exacerbate Milan’s dependence on external resources assuming aforesaid food productivity rates and current soil consumption. Milan population projections were estimated from population prospects for Lombardy region elaborated by the Italian National Institute of Statistics for the period 2017–2066 [52]. We downscaled population figures to city level by considering the ratio of regional and city population registered in 2014.

Figure 5.
Estimated Milan population prospects for the years 2017–2066 through downscaling of regional estimates.
Our estimations on food production and consumption may be somewhat limited by assuming constant productivity and consumption of vegetable crops and cereals, neglecting real losses of harvest, processing or storage, and overlooking dietary differences between social status and groups. These limitations (over- or underestimated values) should be considered in conjunction with the fact that Milan lies at the center of densely populated area (around 4 million) and is an attractive hub for thousands of people. Thus, these findings might be underestimated considering daily city dwellers instead only the resident population.
Overall, these findings raise intriguing questions regarding the role and extent of urban agriculture and its contribution to reduce food miles and increase food resilience. To scale up food supplies, future growing activities should take into account the suitability of sites, exploitation of greenhouses and rooftops, soil type capability, climate and garden design practices, such as optimal crop rotations and harvesting cycles to maximize yields for square meter [39]. Translating into action the strategic options of the Urban Food Policy Pact to achieve more sustainable food systems [34], the municipality, policymakers, and entrepreneurs should strive for a new agriculture policy, with regulation of vacant lots and allocation models to foster farmers toward the cultivation of vegetables crops by reducing the extent of arable crops. The municipality of Milan supports UA with a plan that fosters agriculture practices for non-commercial purposes on public areas encouraging forms of aggregation between citizens and leisure opportunities. Allocation criteria, agronomic, and administrative management, as well as the fees for land rent and water use, are defined by municipal regulations [53]. As highlighted by many scholars, UA is still rather unknown among city dwellers [51] or treated as a temporary or pastime activity [5]. More should be done to reinforce and better guide the inclusion on planning activities. For instance, with clear land use plans and regulations framework, by engaging urban gardeners on long-term strategies and projects for green infrastructures and connecting training activities, grant programs and incentives in synergy with the municipality goals. In this sense, the availability of spatial dataset, realized with freely available data and tools as done with this study, are cornerstones for city administrations and planners.
As highlighted in Table 4, an increase of vegetable gardens and yields could satisfy vegetable consumption of some population strata with fresh, micronutrient-rich, and healthy products [54], simultaneously reducing transportation costs and emissions [55]. Strong evidence of vertical farming potential was recently reported by Sanjuan-Delmás et al. [56] in a feasibility study, reporting productivity of 19.6 kg/m2/year of tomato simultaneously reducing CO2 emissions and using rainwater collected from buildings. Promoting conversion to vegetable production could open new pathways for innovative growing practices (e.g., aquaponics, hydroponics, rooftop greenhouses, micro-scale anaerobic digestion) [47], upgrading resource-use efficiency and circularity by integrating composting and organic waste flows, as well as biodiversity enhancement and habitat conservation [57].
Conversely, the decline of arable land at the boundary of the city would be compensated by the higher economic return of competitive horticultural crops on short supply-chains [58] in contrast to the volatility of commodities prices in the markets. Thus, it might be a win-win strategy for the Milan municipality, improving dietary diversity, increasing locally grown fresh products and, at the same time, enabling environmental, social, and economic benefits.
The generalizability of these results is subject to certain limitations. First, the proposed mapping approach is time-consuming and can be improved with different geospatial technologies and methodologies for a semi-automatic detection of the whole universe of growing areas with high levels of accuracy. Second, uncertainties on vegetable yields can be substantially improved with field survey collecting detailed data on typologies and growers’ skills, use of agronomic inputs, soil capability and seasonal potentialities. Finally, figures on food consumption can significantly improve if up-to-date per capita consumptions of fruits and vegetables in the whole study area collected for age strata and by census and population density. Notwithstanding these limitations, we believe that the adopted methodology and the key insights of the study can be easily transferred in other contexts for analyzing urban food system sustainability.
4. Conclusions
This study sets out to determine the extension of UA in Milan for assessing food self-sufficiency potential for city inhabitants. Photointerpretation of GE images enabled to create a detailed database for the period 2007–2014 distinguishing five land use classes. Food production was evaluated considering four scenarios of productivity for vegetables and cereals production, thus differentiating the needs for recommended per capita consumption, gender, and age strata. Findings confirm those of earlier studies that suggest the low potential of UA to provide food for ensuring self-provisioning and food security for city dwellers. Currently, food needs in Milan depend on external suppliers and considering the best productivity scenarios, only 4.8% and 24% of the population needs of vegetables and cereals, respectively, can be satisfied. Expanding the area for horticultural crops through the planning process and land rearrangement for more equitable UA projects and inclusive typologies might sustain the future’s large population strata consumption, ensuring food security, sustainability, and new opportunities for local community food systems.
Supplementary Materials
The following are available online at https://www.mdpi.com/2071-1050/11/7/1846/s1, Supplemental Table S1: Summary of cases.
Author Contributions
G.P. and F.L. conceived and designed the project idea; created the data, tables, and figures, and wrote the manuscript. All authors read and approved the final manuscript.
Funding
This research received no external funding.
Conflicts of Interest
The authors declare no conflict of interest.
References
- FAO. Urban and Peri-Urban Horticulture. Available online: www.fao.org/ag/agp/greenercities/en/whyuph/index.html (accessed on 2 January 2019).
- Meenar, M.; Hoover, B. Community Food Security via Urban Agriculture: Understanding People, Place, Economy, and Accessibility from a Food Justice Perspective. J. Agric. Food Syst. Community Dev. 2012, 3, 143–160. [Google Scholar] [CrossRef]
- Meenar, M. Nonprofit-Driven Community Capacity-Building Efforts in Community Food Systems. J. Agric. Food Syst. Community Dev. 2015, 6, 77–94. [Google Scholar] [CrossRef]
- Beckie, M.; Bogdan, E. Planting roots: Urban agriculture for senior immigrants. J. Agric. Food Syst. Community Dev. 2010, 1, 77–89. [Google Scholar] [CrossRef]
- Meenar, M.R. Assessing the Spatial Connection between Urban Agriculture and Equity. Built Environ. 2017, 43, 364–375. [Google Scholar] [CrossRef]
- Tzoulas, K.; Korpela, K.; Venn, S.; Yli-Pelkonen, V.; Kaźmierczak, A.; Niemela, J.; James, P. Promoting ecosystem and human health in urban areas using Green Infrastructure: A literature review. Landsc. Urban Plan. 2007, 81, 167–178. [Google Scholar] [CrossRef]
- Pulighe, G.; Fava, F.; Lupia, F. Insights and opportunities from mapping ecosystem services of urban green spaces and potentials in planning. Ecosyst. Serv. 2016, 22, 1–10. [Google Scholar] [CrossRef]
- Di Leo, N.; Escobedo, F.J.; Dubbeling, M. The role of urban green infrastructure in mitigating land surface temperature in Bobo-Dioulasso, Burkina Faso. Environ. Dev. Sustain. 2015, 18, 373–392. [Google Scholar] [CrossRef]
- Cleveland, D.A.; Phares, N.; Nightingale, K.D.; Weatherby, R.L.; Radis, W.; Ballard, J.; Campagna, M.; Kurtz, D.; Livingston, K.; Riechers, G.; et al. The potential for urban household vegetable gardens to reduce greenhouse gas emissions. Landsc. Urban Plan. 2017, 157, 365–374. [Google Scholar] [CrossRef]
- Ercilla-Montserrat, M.; Muñoz, P.; Montero, J.I.; Gabarrell, X.; Rieradevall, J. A study on air quality and heavy metals content of urban food produced in a Mediterranean city (Barcelona). J. Clean. Prod. 2018, 195, 385–395. [Google Scholar] [CrossRef]
- Clarke, L.W.; Li, L.; Jenerette, G.D.; Yu, Z. Drivers of plant biodiversity and ecosystem service production in home gardens across the Beijing Municipality of China. Urban Ecosyst. 2014, 17, 741–760. [Google Scholar] [CrossRef]
- Gittleman, M.; Farmer, C.J.Q.; Kremer, P.; McPhearson, T. Estimating stormwater runoff for community gardens in New York City. Urban Ecosyst. 2017, 20, 129–139. [Google Scholar] [CrossRef]
- Lupia, F.; Baiocchi, V.; Lelo, K.; Pulighe, G. Exploring rooftop rainwater harvesting potential for food production in urban areas. Agriculture 2017, 7, 46. [Google Scholar] [CrossRef]
- Nahuelhual, L.; Carmona, A.; Laterra, P.; Barrena, J.; Aguayo, M. A mapping approach to assess intangible cultural ecosystem services: The case of agriculture heritage in Southern Chile. Ecol. Indic. 2014, 40, 90–101. [Google Scholar] [CrossRef]
- Dalla Marta, A.; Baldi, A.; Lenzi, A.; Lupia, F.; Pulighe, G.; Santini, E.; Orlandini, S.; Altobelli, F. A methodological approach for assessing the impact of urban agriculture on water resources: A case study for community gardens in Rome (Italy). Agroecol. Sustain. Food Syst. 2018, 43, 228–240. [Google Scholar] [CrossRef]
- Lupia, F.; Pulighe, G. Water Use and Urban Agriculture: Estimation and Water Saving Scenarios for Residential Kitchen Gardens. Agric. Agric. Sci. Procedia 2015, 4, 50–58. [Google Scholar] [CrossRef]
- Glavan, M.; Schmutz, U.; Williams, S.; Corsi, S.; Monaco, F.; Kneafsey, M.; Guzman Rodriguez, P.A.; Čenič-Istenič, M.; Pintar, M. The economic performance of urban gardening in three European cities—Examples from Ljubljana, Milan and London. Urban For. Urban Green. 2018, 36, 100–122. [Google Scholar] [CrossRef]
- Russo, A.; Escobedo, F.J.; Cirella, G.T.; Zerbe, S. Edible green infrastructure: An approach and review of provisioning ecosystem services and disservices in urban environments. Agric. Ecosyst. Environ. 2017, 242, 53–66. [Google Scholar] [CrossRef]
- Goldstein, B.; Hauschild, M.; Fernández, J.; Birkved, M. Urban versus conventional agriculture, taxonomy of resource profiles: A review. Agron. Sustain. Dev. 2016, 36, 9. [Google Scholar] [CrossRef]
- Opitz, I.; Berges, R.; Piorr, A.; Krikser, T. Contributing to food security in urban areas: Differences between urban agriculture and peri-urban agriculture in the Global North. Agric. Hum. Values 2016, 33, 341–358. [Google Scholar] [CrossRef]
- Horst, M.; McClintock, N.; Hoey, L. The Intersection of Planning, Urban Agriculture, and Food Justice: A Review of the Literature. J. Am. Plan. Assoc. 2017, 83, 277–295. [Google Scholar] [CrossRef]
- Grewal, S.S.; Grewal, P.S. Can cities become self-reliant in food? Cities 2012, 29, 1–11. [Google Scholar] [CrossRef]
- Richardson, J.J.; Moskal, L.M. Urban food crop production capacity and competition with the urban forest. Urban For. Urban Green. 2016, 15, 58–64. [Google Scholar] [CrossRef]
- Wang, H.; Qiu, F.; Swallow, B. Can community gardens and farmers’ markets relieve food desert problems? A study of Edmonton, Canada. Appl. Geogr. 2014, 55, 127–137. [Google Scholar] [CrossRef]
- Ruggeri, G.; Mazzocchi, C.; Corsi, S. Urban gardeners’ motivations in a Metropolitan city: The case of Milan. Sustainability 2016, 8, 1099. [Google Scholar] [CrossRef]
- Hara, Y.; McPhearson, T.; Sampei, Y.; McGrath, B. Assessing urban agriculture potential: A comparative study of Osaka, Japan and New York city, United States. Sustain. Sci. 2018, 13, 937–952. [Google Scholar] [CrossRef]
- McClintock, N.; Cooper, J.; Khandeshi, S. Assessing the potential contribution of vacant land to urban vegetable production and consumption in Oakland, California. Landsc. Urban Plan. 2013, 111, 46–58. [Google Scholar] [CrossRef]
- Saha, M.; Eckelman, M.J. Growing fresh fruits and vegetables in an urban landscape: A geospatial assessment of ground level and rooftop urban agriculture potential in Boston, USA. Landsc. Urban Plan. 2017, 165, 130–141. [Google Scholar] [CrossRef]
- Kremer, P.; DeLiberty, T.L. Local food practices and growing potential: Mapping the case of Philadelphia. Appl. Geogr. 2011, 31, 1252–1261. [Google Scholar] [CrossRef]
- Zasada, I.; Schmutz, U.; Wascher, D.; Kneafsey, M.; Corsi, S.; Mazzocchi, C.; Monaco, F.; Boyce, P.; Doernberg, A.; Sali, G.; et al. Food beyond the city—Analysing foodsheds and self-sufficiency for different food system scenarios in European metropolitan regions. City Cult. Soc. 2017. [Google Scholar] [CrossRef]
- Population Resident in Milan—Municipality of Milan. Available online: http://www.comune.milano.it/wps/portal/ist/it/amministrazione/datistatistici/Popolazione_residente_a_Milano (accessed on 10 January 2019).
- GeoPortal—Region Lombardy. Available online: http://www.geoportale.regione.lombardia.it/en/home (accessed on 9 January 2019).
- Salata, S. Land use change analysis in the urban region of Milan. Manag. Environ. Qual. Int. J. 2017, 28, 879–901. [Google Scholar] [CrossRef]
- Milan Urban Food Policy Pacts. Available online: http://www.milanurbanfoodpolicypact.org/ (accessed on 10 January 2019).
- Pulighe, G.; Lupia, F. Mapping spatial patterns of urban agriculture in Rome (Italy) using Google Earth and web-mapping services. Land Use Policy 2016, 59, 49–58. [Google Scholar] [CrossRef]
- Taylor, J.R.; Lovell, S.T. Mapping public and private spaces of urban agriculture in Chicago through the analysis of high-resolution aerial images in Google Earth. Landsc. Urban Plan. 2012, 108, 57–70. [Google Scholar] [CrossRef]
- Pulighe, G.; Baiocchi, V.; Lupia, F. Horizontal accuracy assessment of very high resolution Google Earth images in the city of Rome, Italy. Int. J. Digit. Earth 2016, 9, 342–362. [Google Scholar] [CrossRef]
- Jensen, J.R. Remote Sensing of the Environment: An Earth Resource Perspective, 2nd ed.; Pearson Prentice Hall: Upper Saddle River, NJ, USA, 2007; ISBN 9780131889507. [Google Scholar]
- Sanyé-Mengual, E.; Gasperi, D.; Michelon, N.; Orsini, F.; Ponchia, G.; Gianquinto, G. Eco-Efficiency Assessment and Food Security Potential of Home Gardening: A Case Study in Padua, Italy. Sustainability 2018, 10, 2124. [Google Scholar] [CrossRef]
- Mcdougall, R.; Kristiansen, P.; Rader, R. Small-scale urban agriculture results in high yields but requires judicious management of inputs to achieve sustainability. Proc. Natl. Acad. Sci. USA 2019, 116, 129–134. [Google Scholar] [CrossRef] [PubMed]
- Algert, S.J.; Baameur, A.; Renvall, M.J. Vegetable Output and Cost Savings of Community Gardens in San Jose, California. J. Acad. Nutr. Diet. 2014, 114, 1072–1076. [Google Scholar] [CrossRef]
- ISTAT Stima Delle Superfici e Produzioni Delle Coltivazioni Agrarie. Available online: http://agri.istat.it/jsp/dawinci.jsp?q=plC010000010000012000&an=2014&ig=1&ct=243&id=15A%7C18A%7C25A (accessed on 30 July 2018).
- Leclercq, C.; Arcella, D.; Piccinelli, R.; Sette, S.; Le Donne, C. The Italian National Food Consumption Survey INRAN-SCAI 2005-06: Main Results: In terms of food consumption. Public Health Nutr. 2009, 12, 2504–2532. [Google Scholar] [CrossRef] [PubMed]
- USDA United States Department of Agriculture, Agricultural Research Service—Food Composition Databases. Available online: https://ndb.nal.usda.gov/ndb/search/list?home=true (accessed on 10 December 2018).
- ISPRA. Il Consumo di Suolo in Italia—Edizione 2015; ISPRA: Rome, Italy, 2015; ISBN 9788844807030. [Google Scholar]
- Cameron, R.W.F.; Blanuša, T.; Taylor, J.E.; Salisbury, A.; Halstead, A.J.; Henricot, B.; Thompson, K. The domestic garden—Its contribution to urban green infrastructure. Urban For. Urban Green. 2012, 11, 129–137. [Google Scholar] [CrossRef]
- Weidner, T.; Yang, A.; Hamm, M.W. Consolidating the current knowledge on urban agriculture in productive urban food systems: Learnings, gaps and outlook. J. Clean. Prod. 2019, 209, 1637–1655. [Google Scholar] [CrossRef]
- Martellozzo, F.; Landry, J.S.; Plouffe, D.; Seufert, V.; Rowhani, P.; Ramankutty, N. Urban agriculture: A global analysis of the space constraint to meet urban vegetable demand. Environ. Res. Lett. 2014, 9, 064025. [Google Scholar] [CrossRef]
- Badami, M.G.; Ramankutty, N. Urban agriculture and food security: A critique based on an assessment of urban land constraints. Glob. Food Secur. 2015, 4, 8–15. [Google Scholar] [CrossRef]
- Tornaghi, C. Critical Geography of Urban Agriculture. Prog. Hum. Geogr. 2014, 38, 551–567. [Google Scholar] [CrossRef]
- Sanyé-Mengual, E.; Specht, K.; Krikser, T.; Vanni, C.; Pennisi, G.; Orsini, F.; Gianquinto, G.P. Social acceptance and perceived ecosystem services of urban agriculture in Southern Europe: The case of Bologna, Italy. PLoS ONE 2018, 13, e0200993. [Google Scholar] [CrossRef] [PubMed]
- ISTAT Previsioni Della Popolazione—Anni 2017–2065. Available online: http://dati.istat.it/Index.aspx?DataSetCode=DCIS_PREVDEM1 (accessed on 10 January 2019).
- Comune di Milano Concessione di Orti Urbani—Municipio 2. Available online: http://www.comune.milano.it/wps/portal/ist/it/amministrazione/governo/municipi/municipio_2/servizi_municipio/concessione_di_orti_urbani (accessed on 13 January 2019).
- Burchi, F.; Fanzo, J.; Frison, E. The Role of Food and Nutrition System Approaches in Tackling Hidden Hunger. Int. J. Environ. Res. Public Health 2011, 8, 358–373. [Google Scholar] [CrossRef]
- Lee, G.-G.; Lee, H.-W.; Lee, J.-H. Greenhouse gas emission reduction effect in the transportation sector by urban agriculture in Seoul, Korea. Landsc. Urban Plan. 2015, 140, 1–7. [Google Scholar] [CrossRef]
- Sanjuan-Delmás, D.; Llorach-Massana, P.; Nadal, A.; Ercilla-Montserrat, M.; Muñoz, P.; Montero, J.I.; Josa, A.; Gabarrell, X.; Rieradevall, J. Environmental assessment of an integrated rooftop greenhouse for food production in cities. J. Clean. Prod. 2018, 177, 326–337. [Google Scholar] [CrossRef]
- Goddard, M.A.; Dougill, A.J.; Benton, T.G. Scaling up from gardens: Biodiversity conservation in urban environments. Trends Ecol. Evol. 2010, 25, 90–98. [Google Scholar] [CrossRef] [PubMed]
- Nsamzinshuti, A.; Janjevic, M.; Rigo, N.; Ndiaye, A.B. Short Supply Chains as a Viable Alternative for the Distribution of Food in Urban Areas? Investigation of the Performance of Several Distribution Schemes. In Sustainable Freight Transport; Springer: Cham, Switzerland, 2018; pp. 99–119. [Google Scholar]
© 2019 by the authors. Licensee MDPI, Basel, Switzerland. This article is an open access article distributed under the terms and conditions of the Creative Commons Attribution (CC BY) license (http://creativecommons.org/licenses/by/4.0/).