Evaluating the Efficacy of Zero-Emission Vehicle Deployment Strategies: The Maryland Case


Abstract
:1. Introduction
2. Method
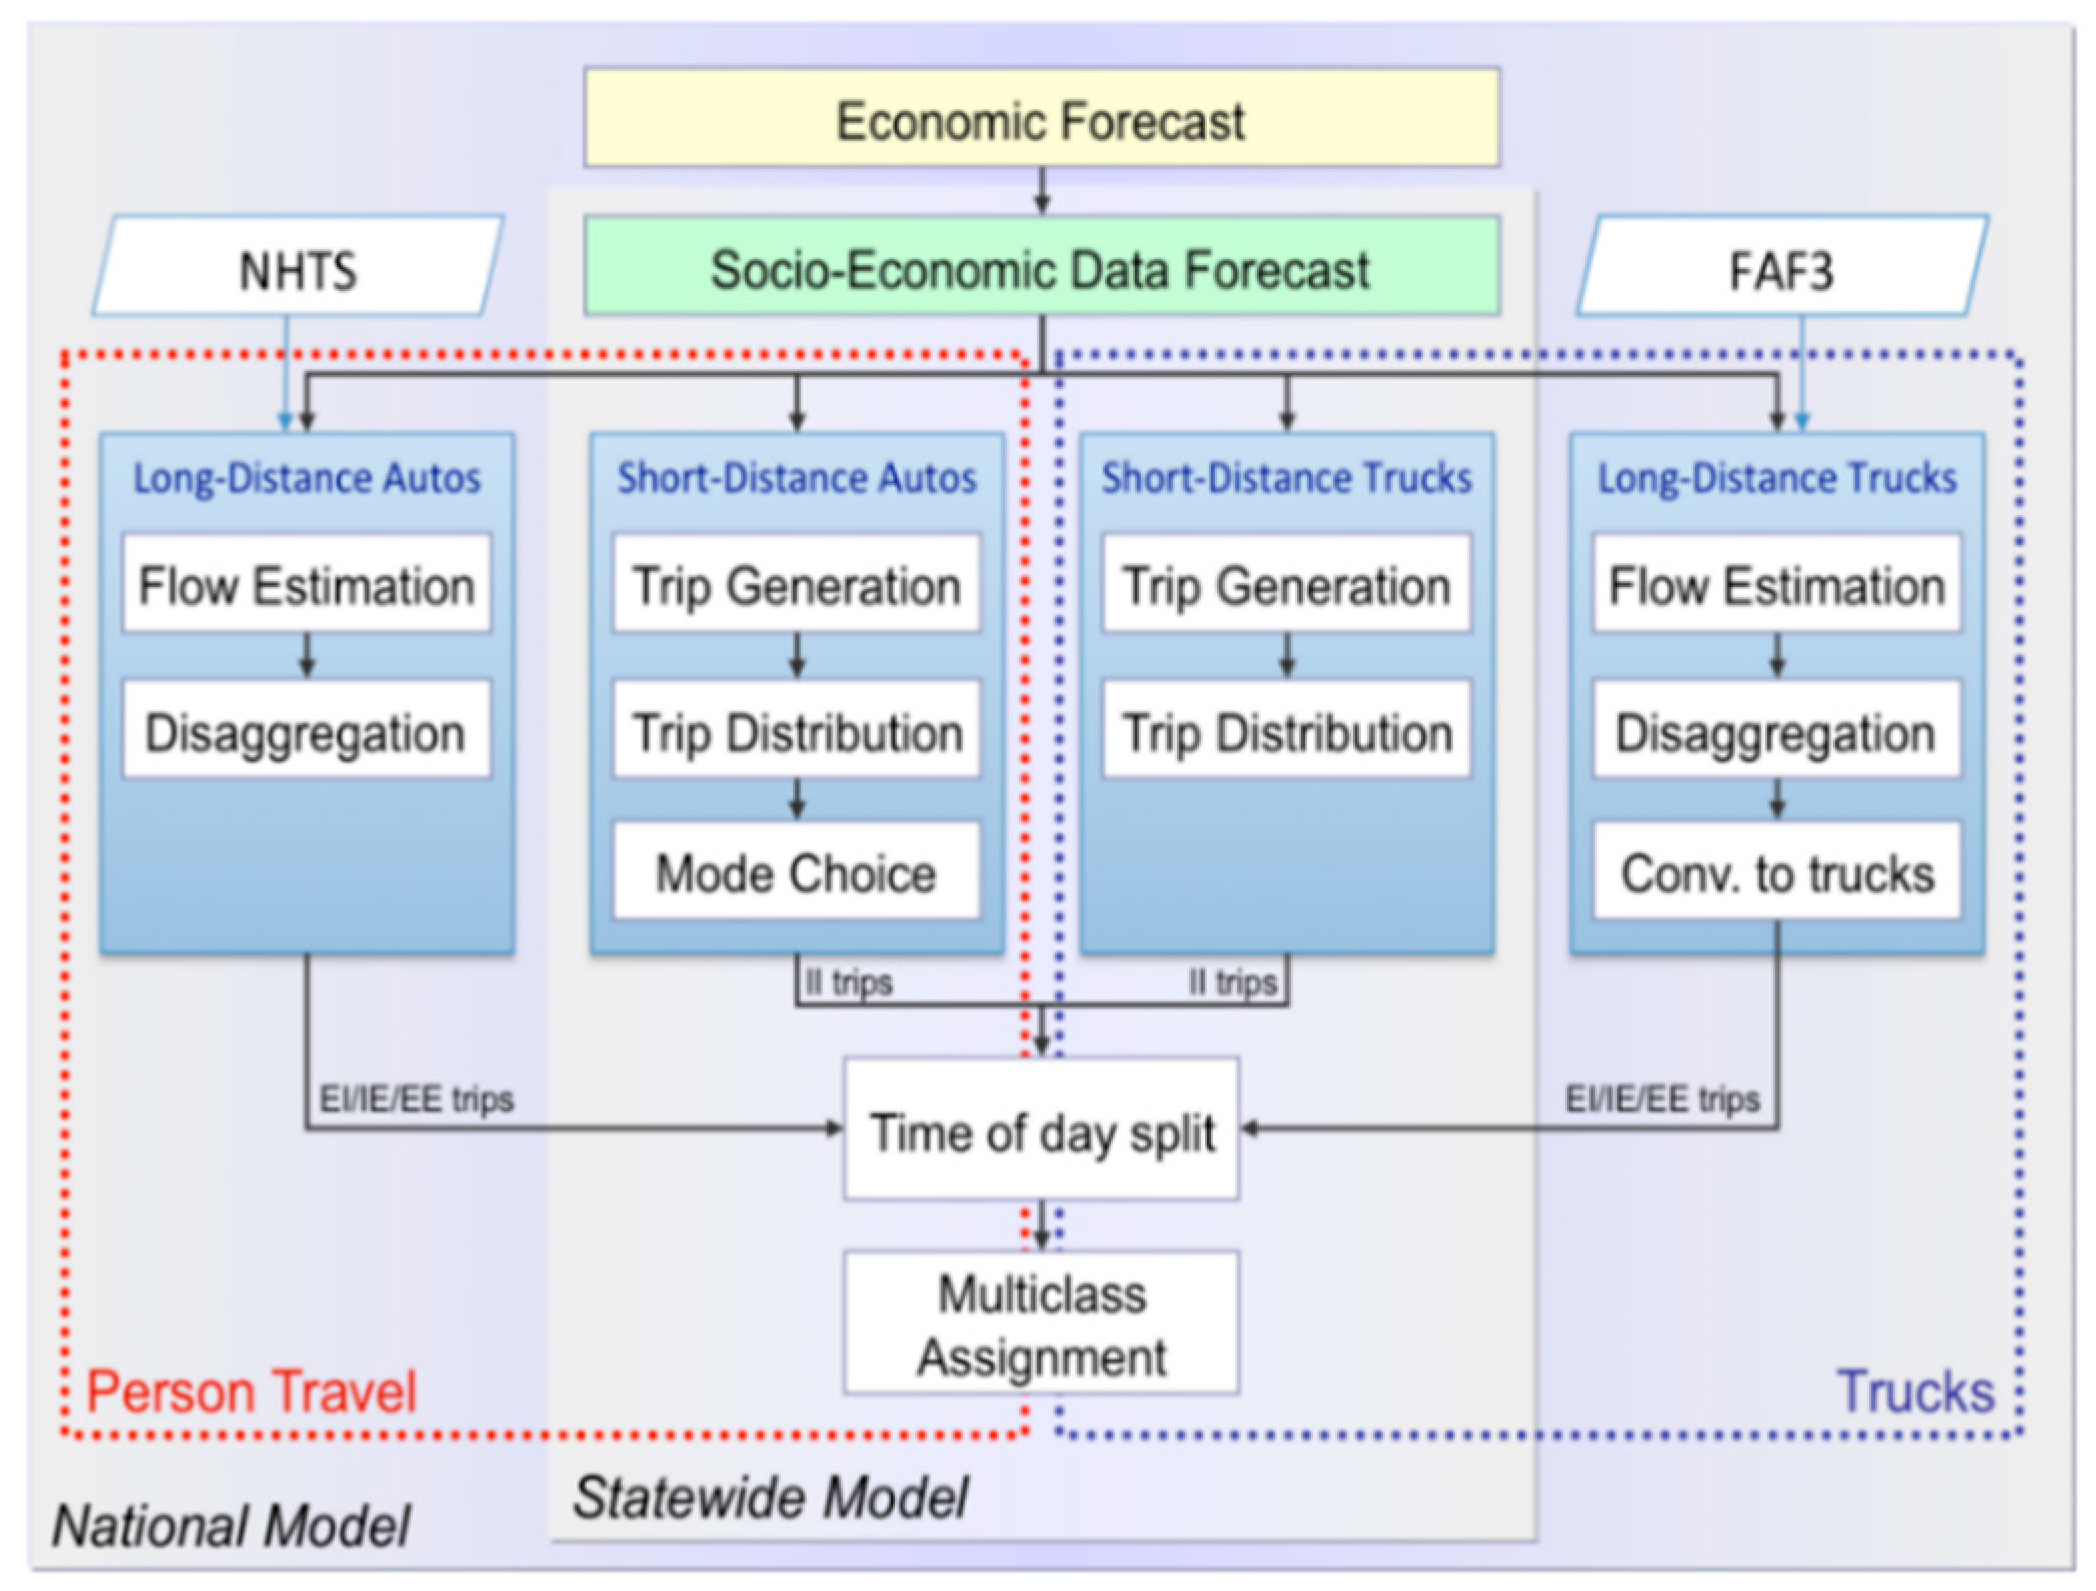
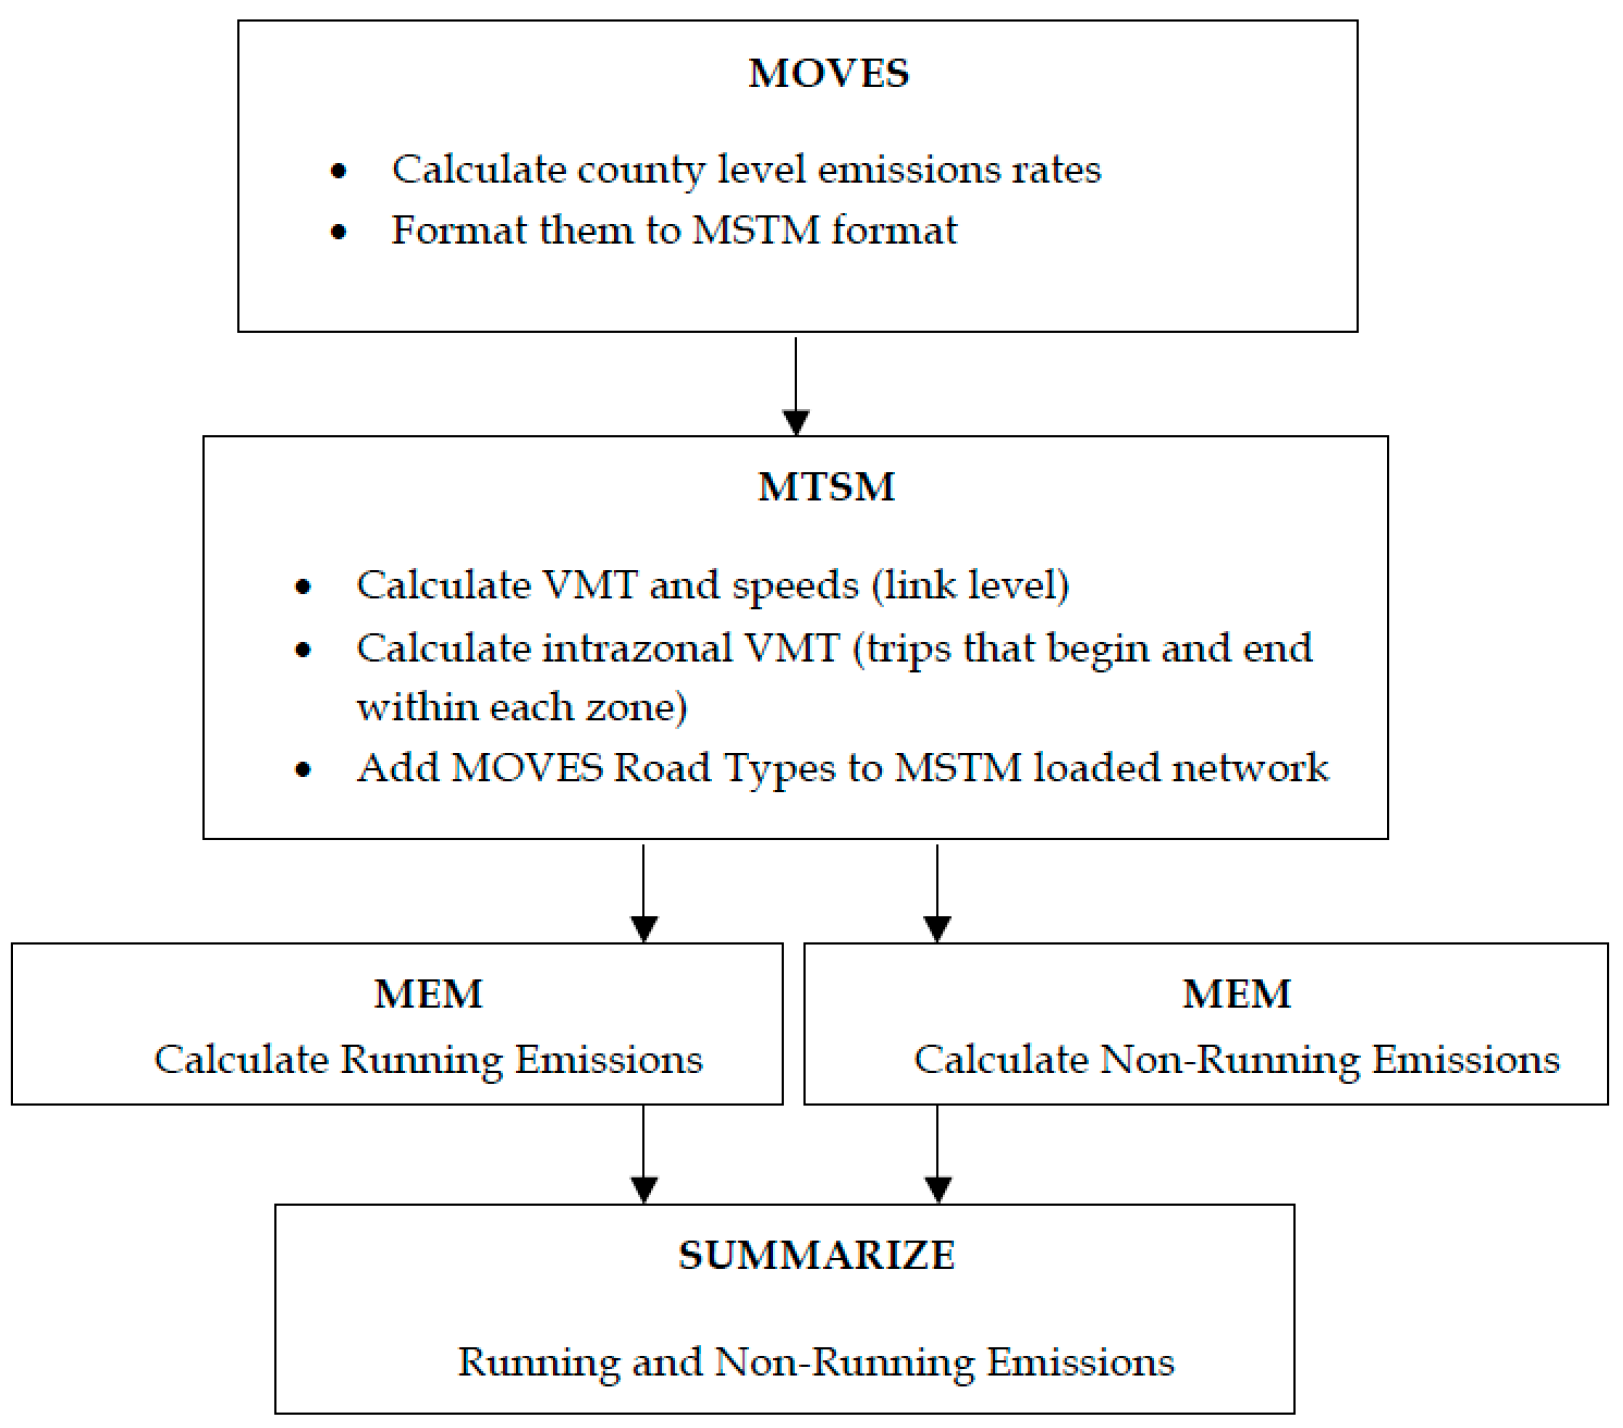
2.1. Modeling Platform
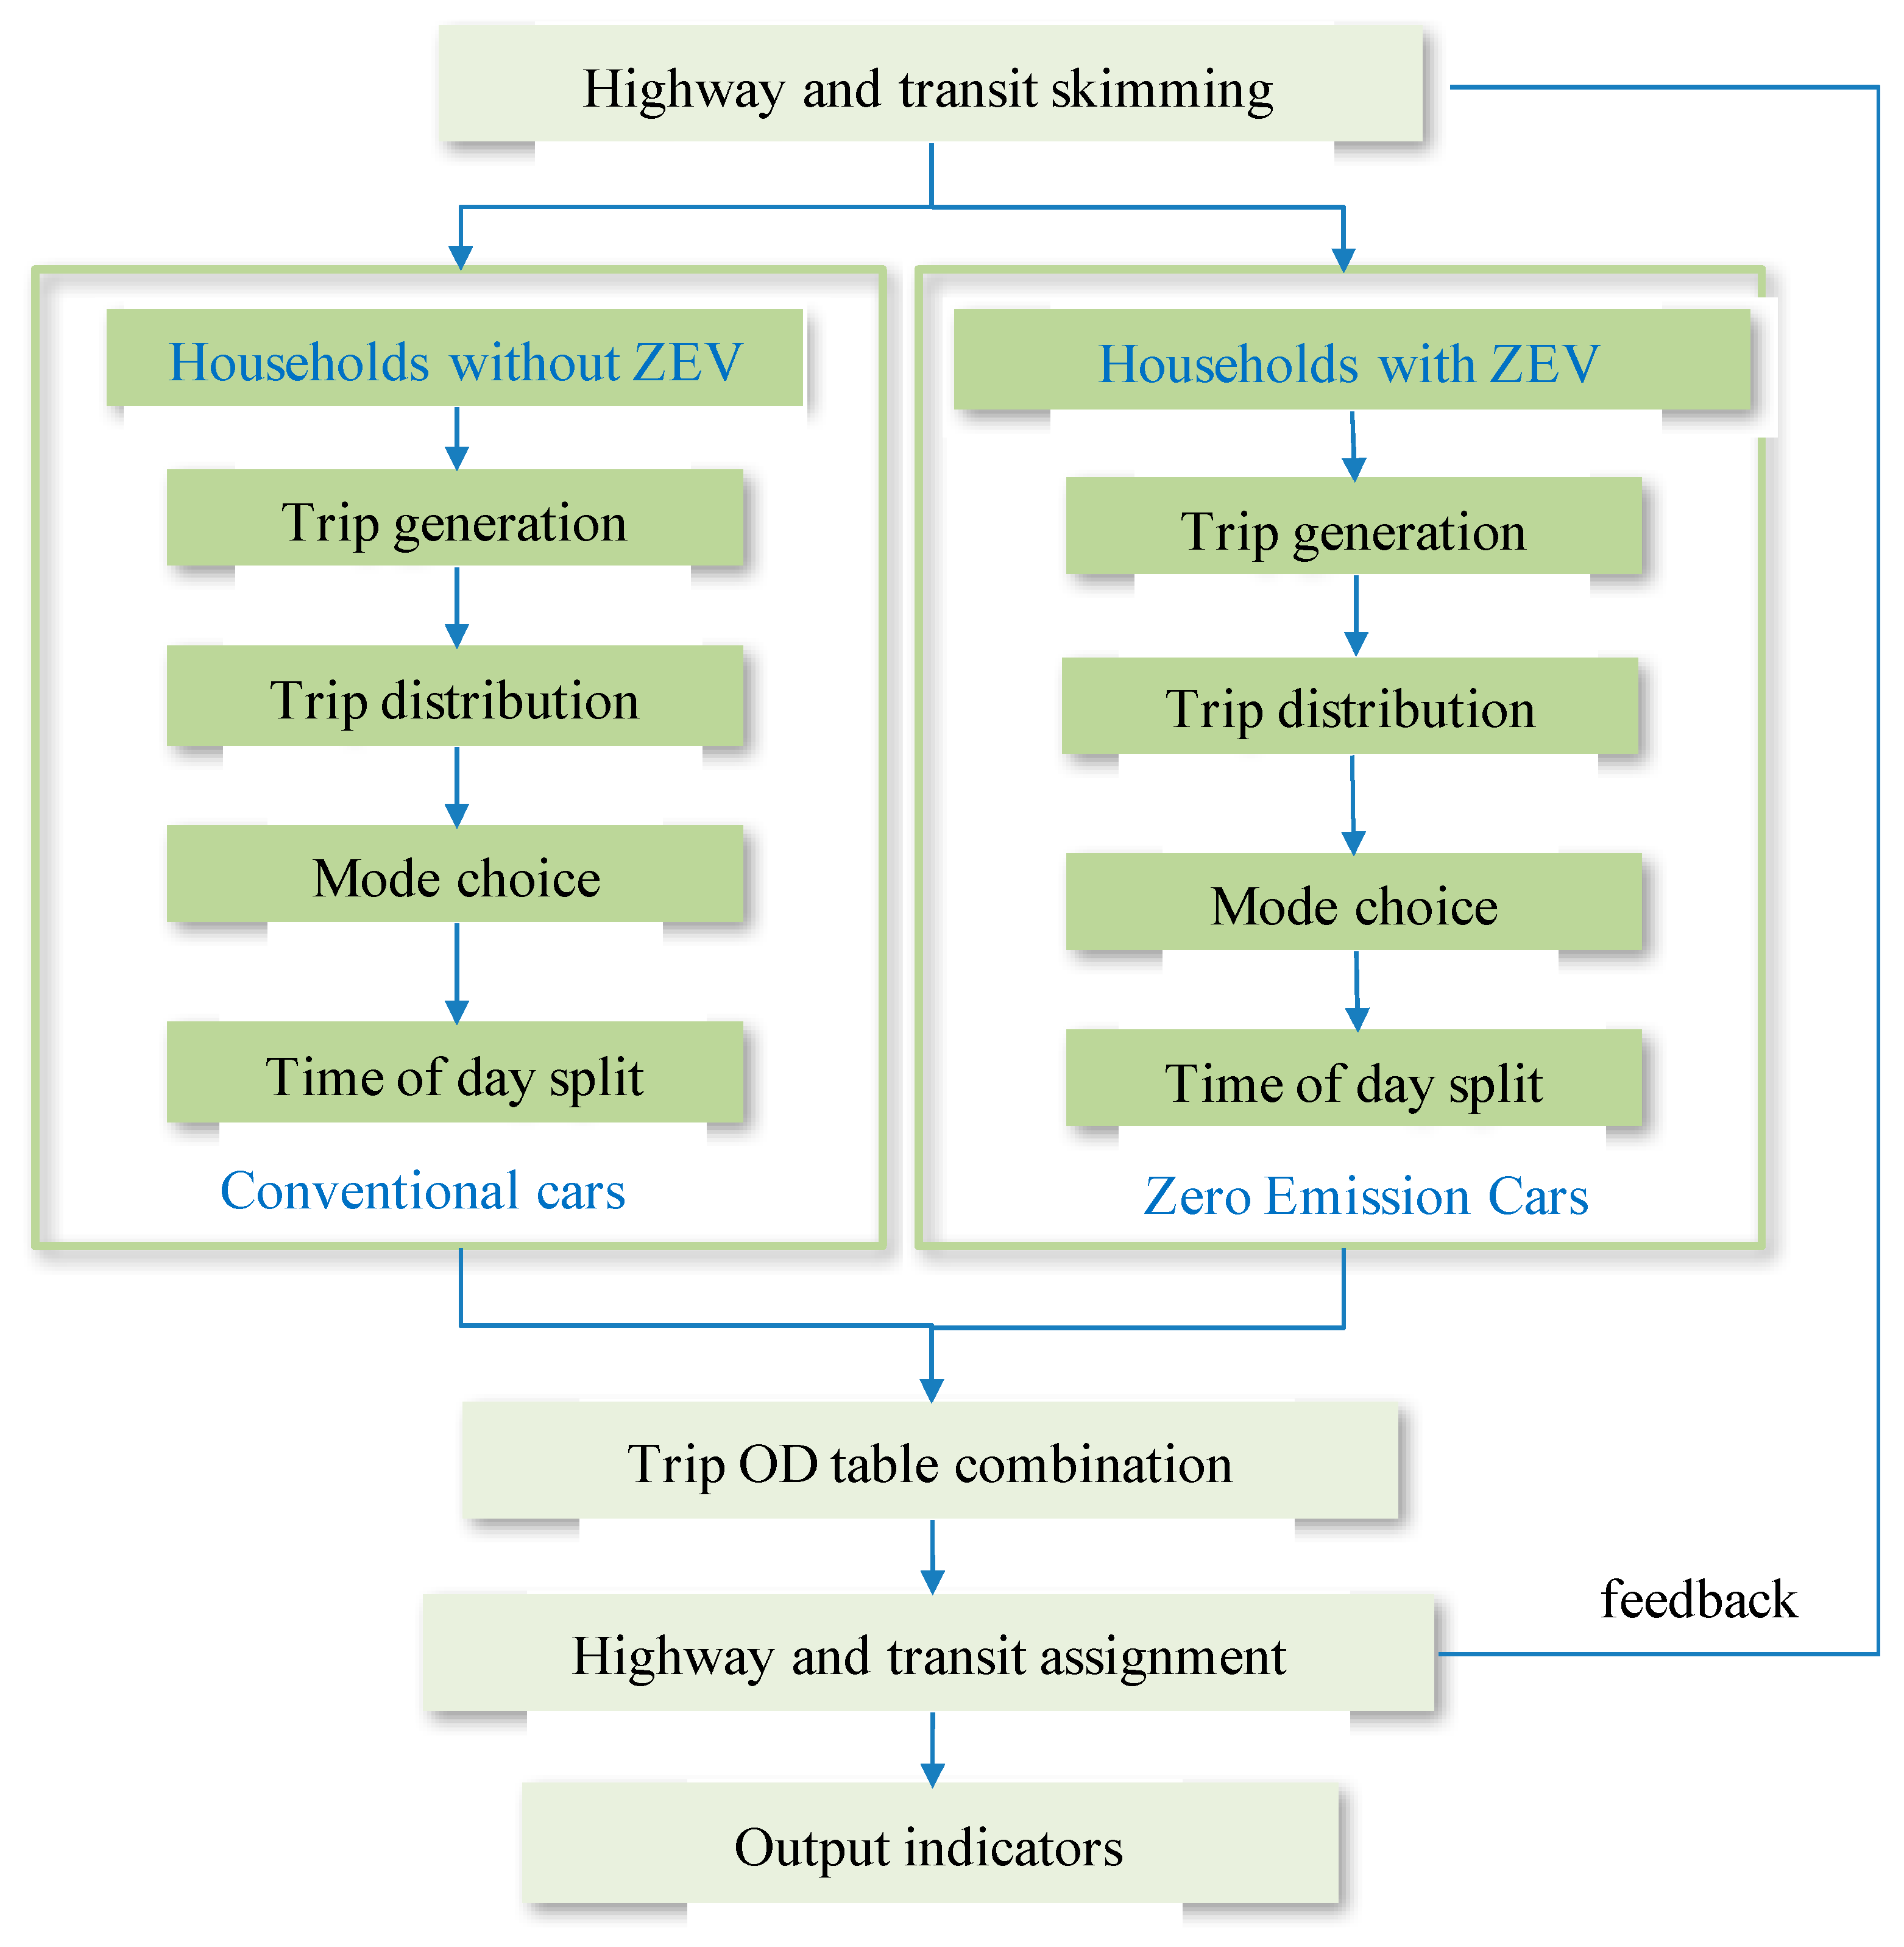
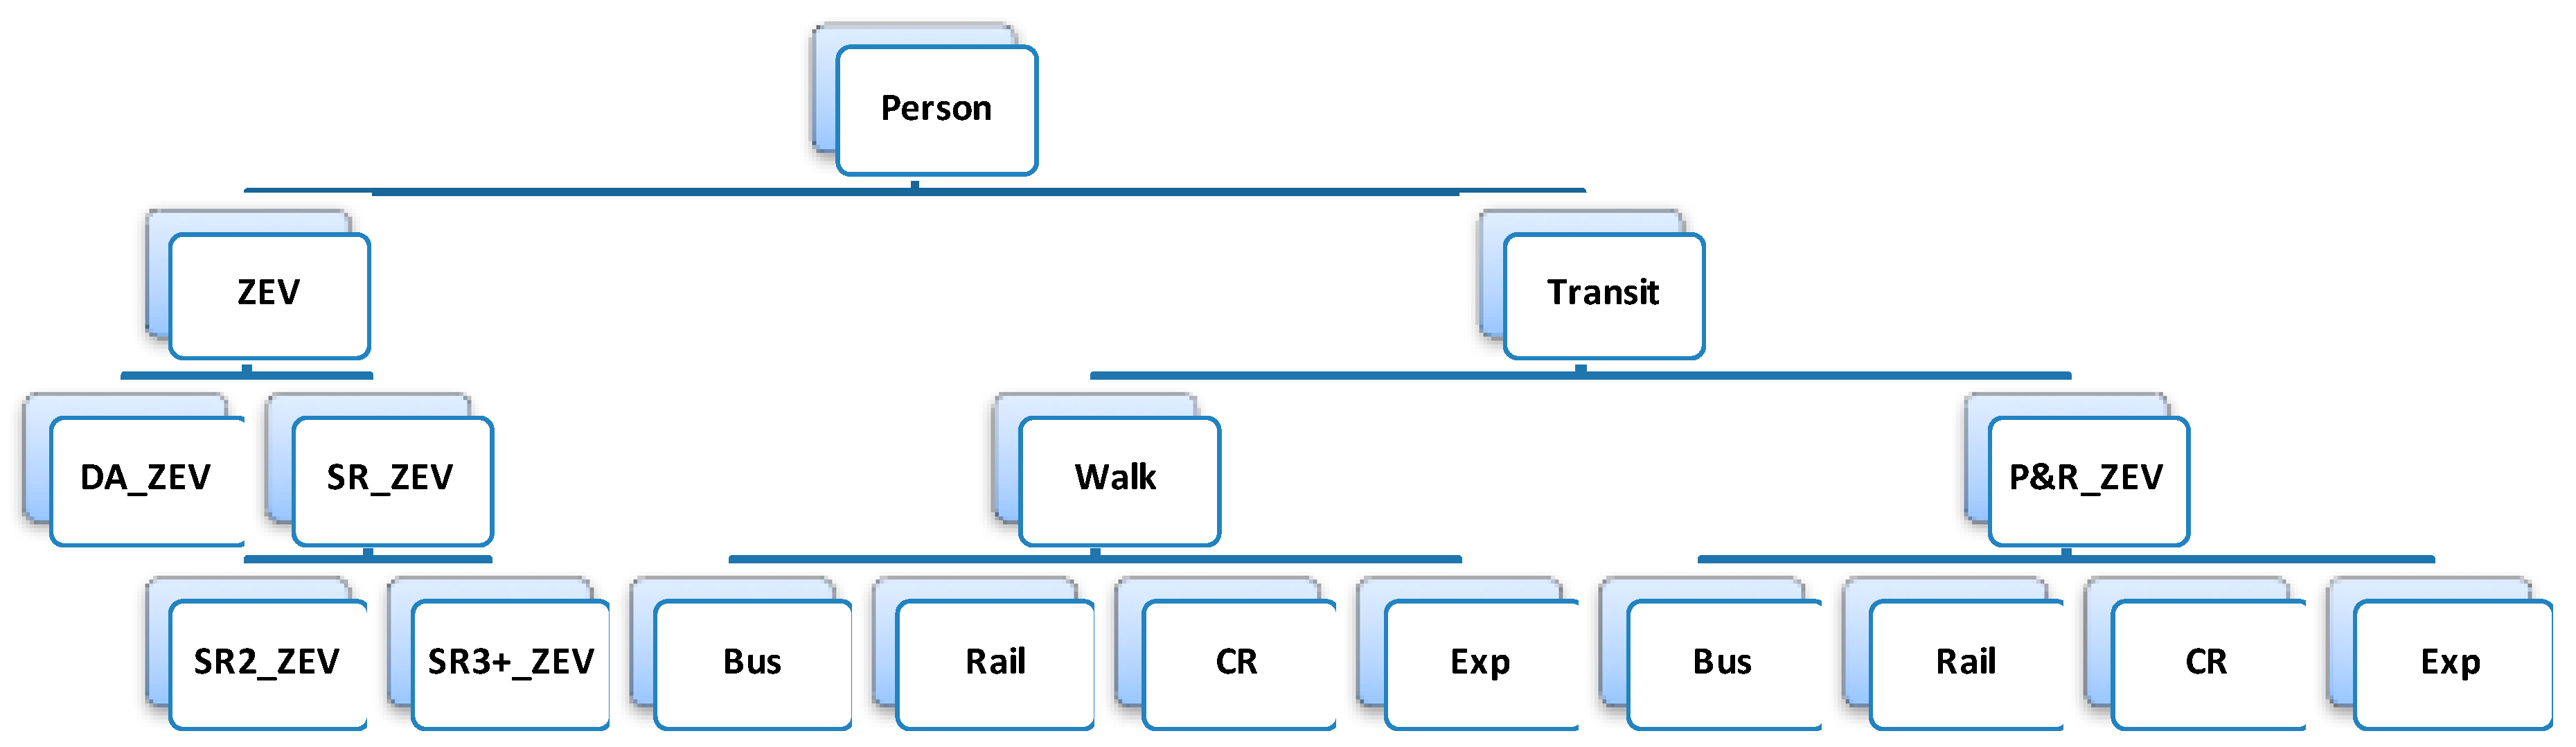
2.2. Demand Forecasting Model
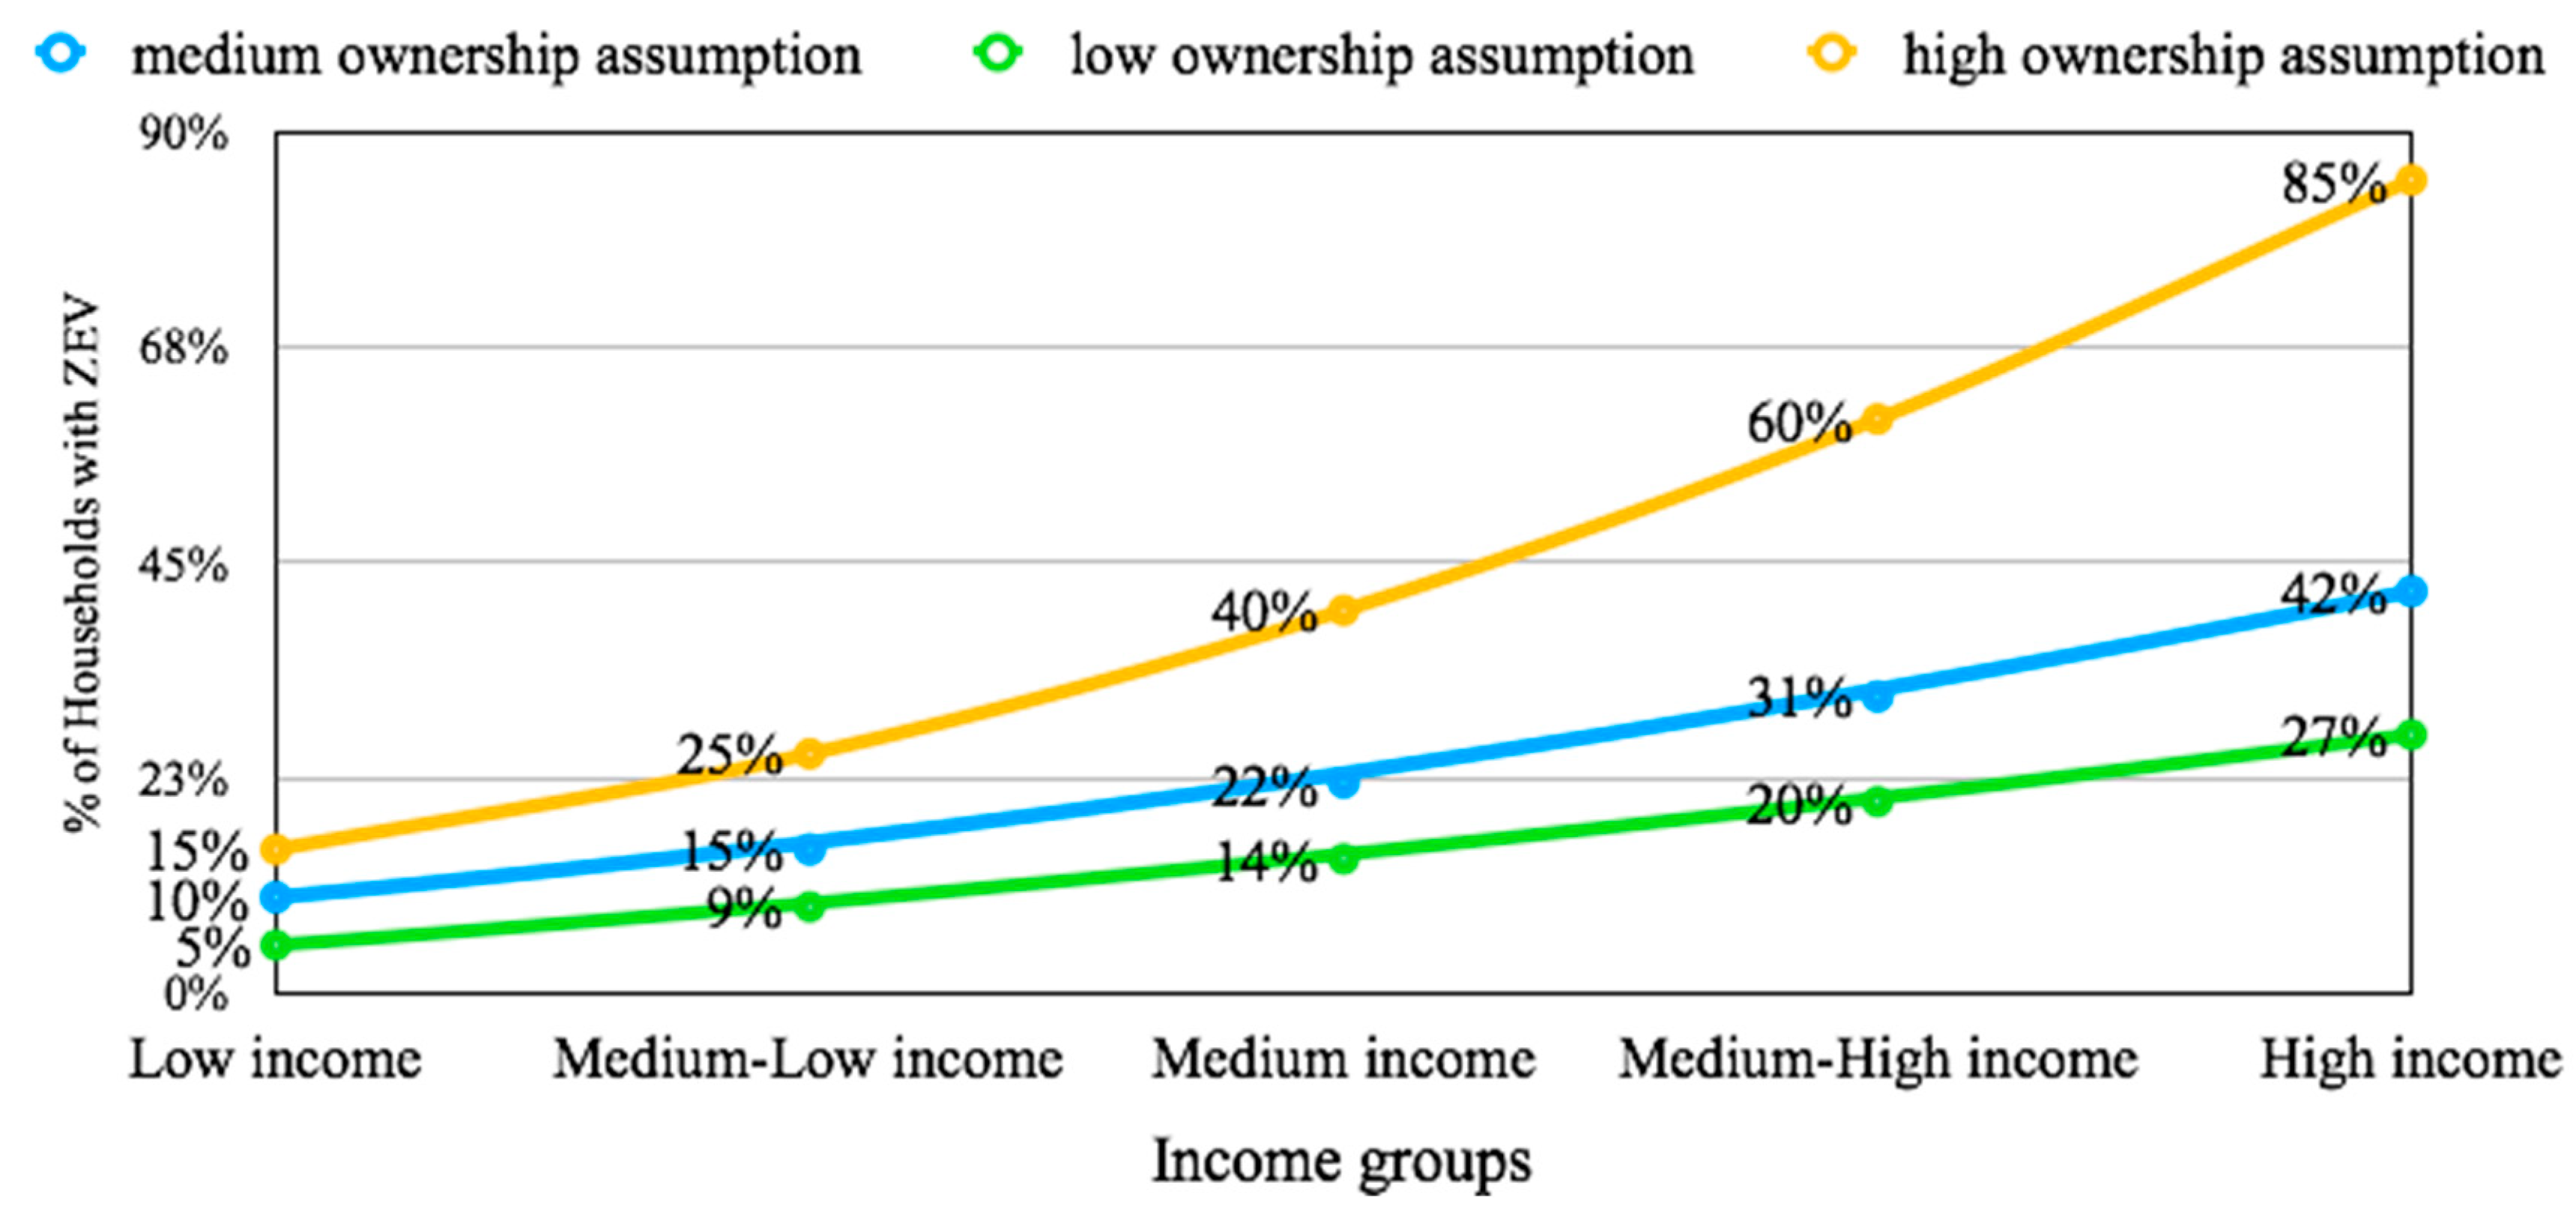
2.3. ZEV Scenarios
3. Results
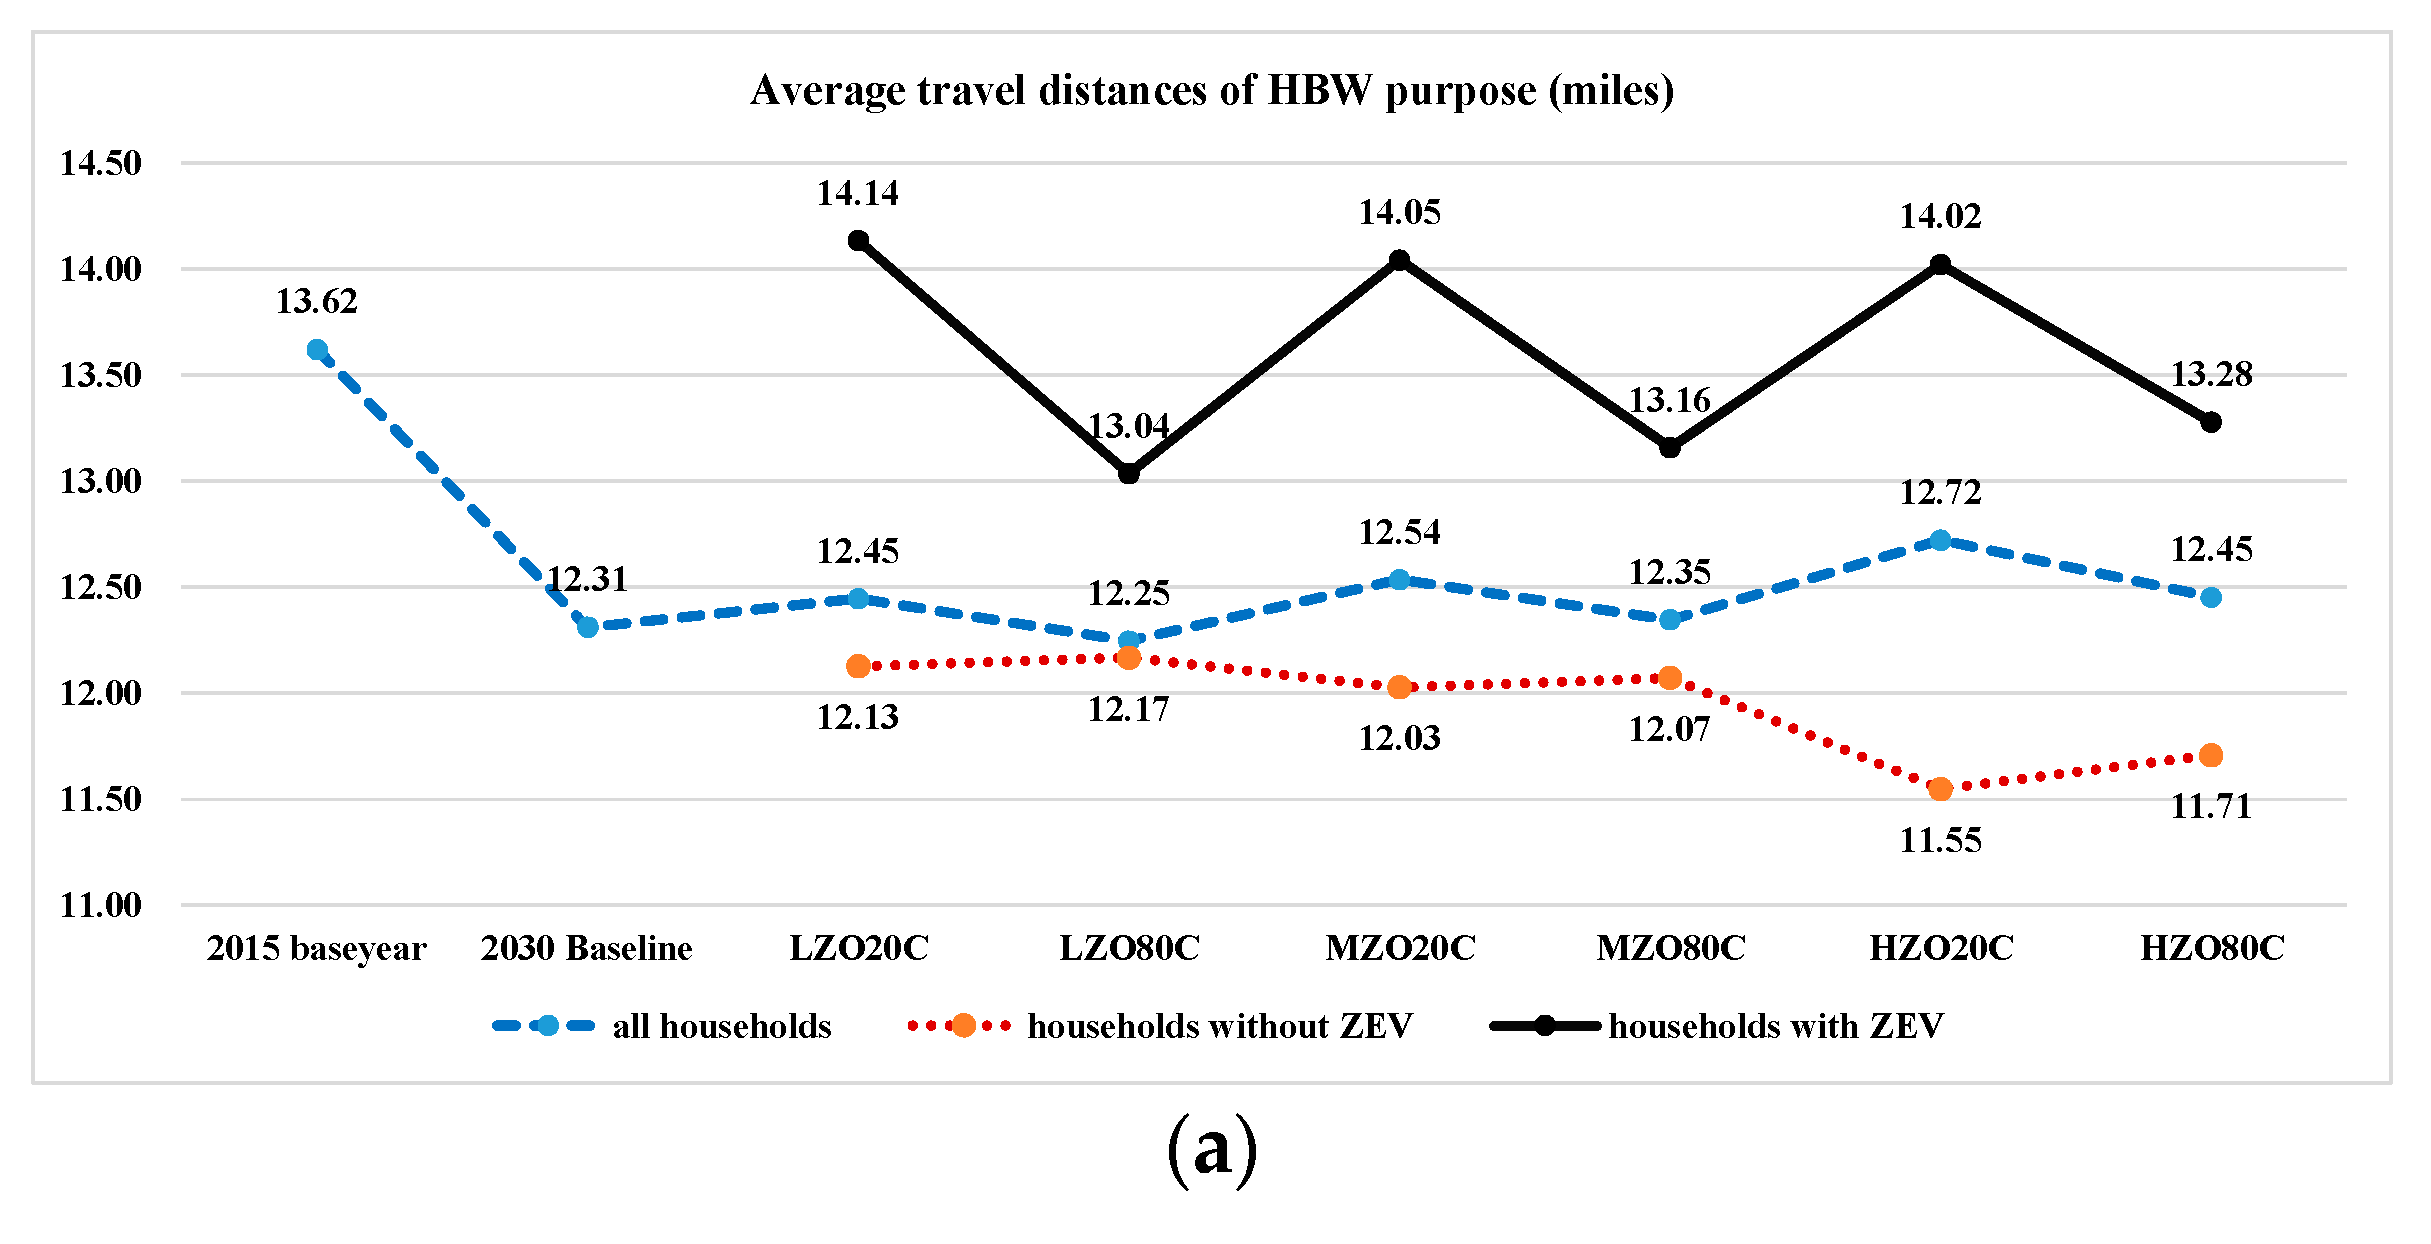
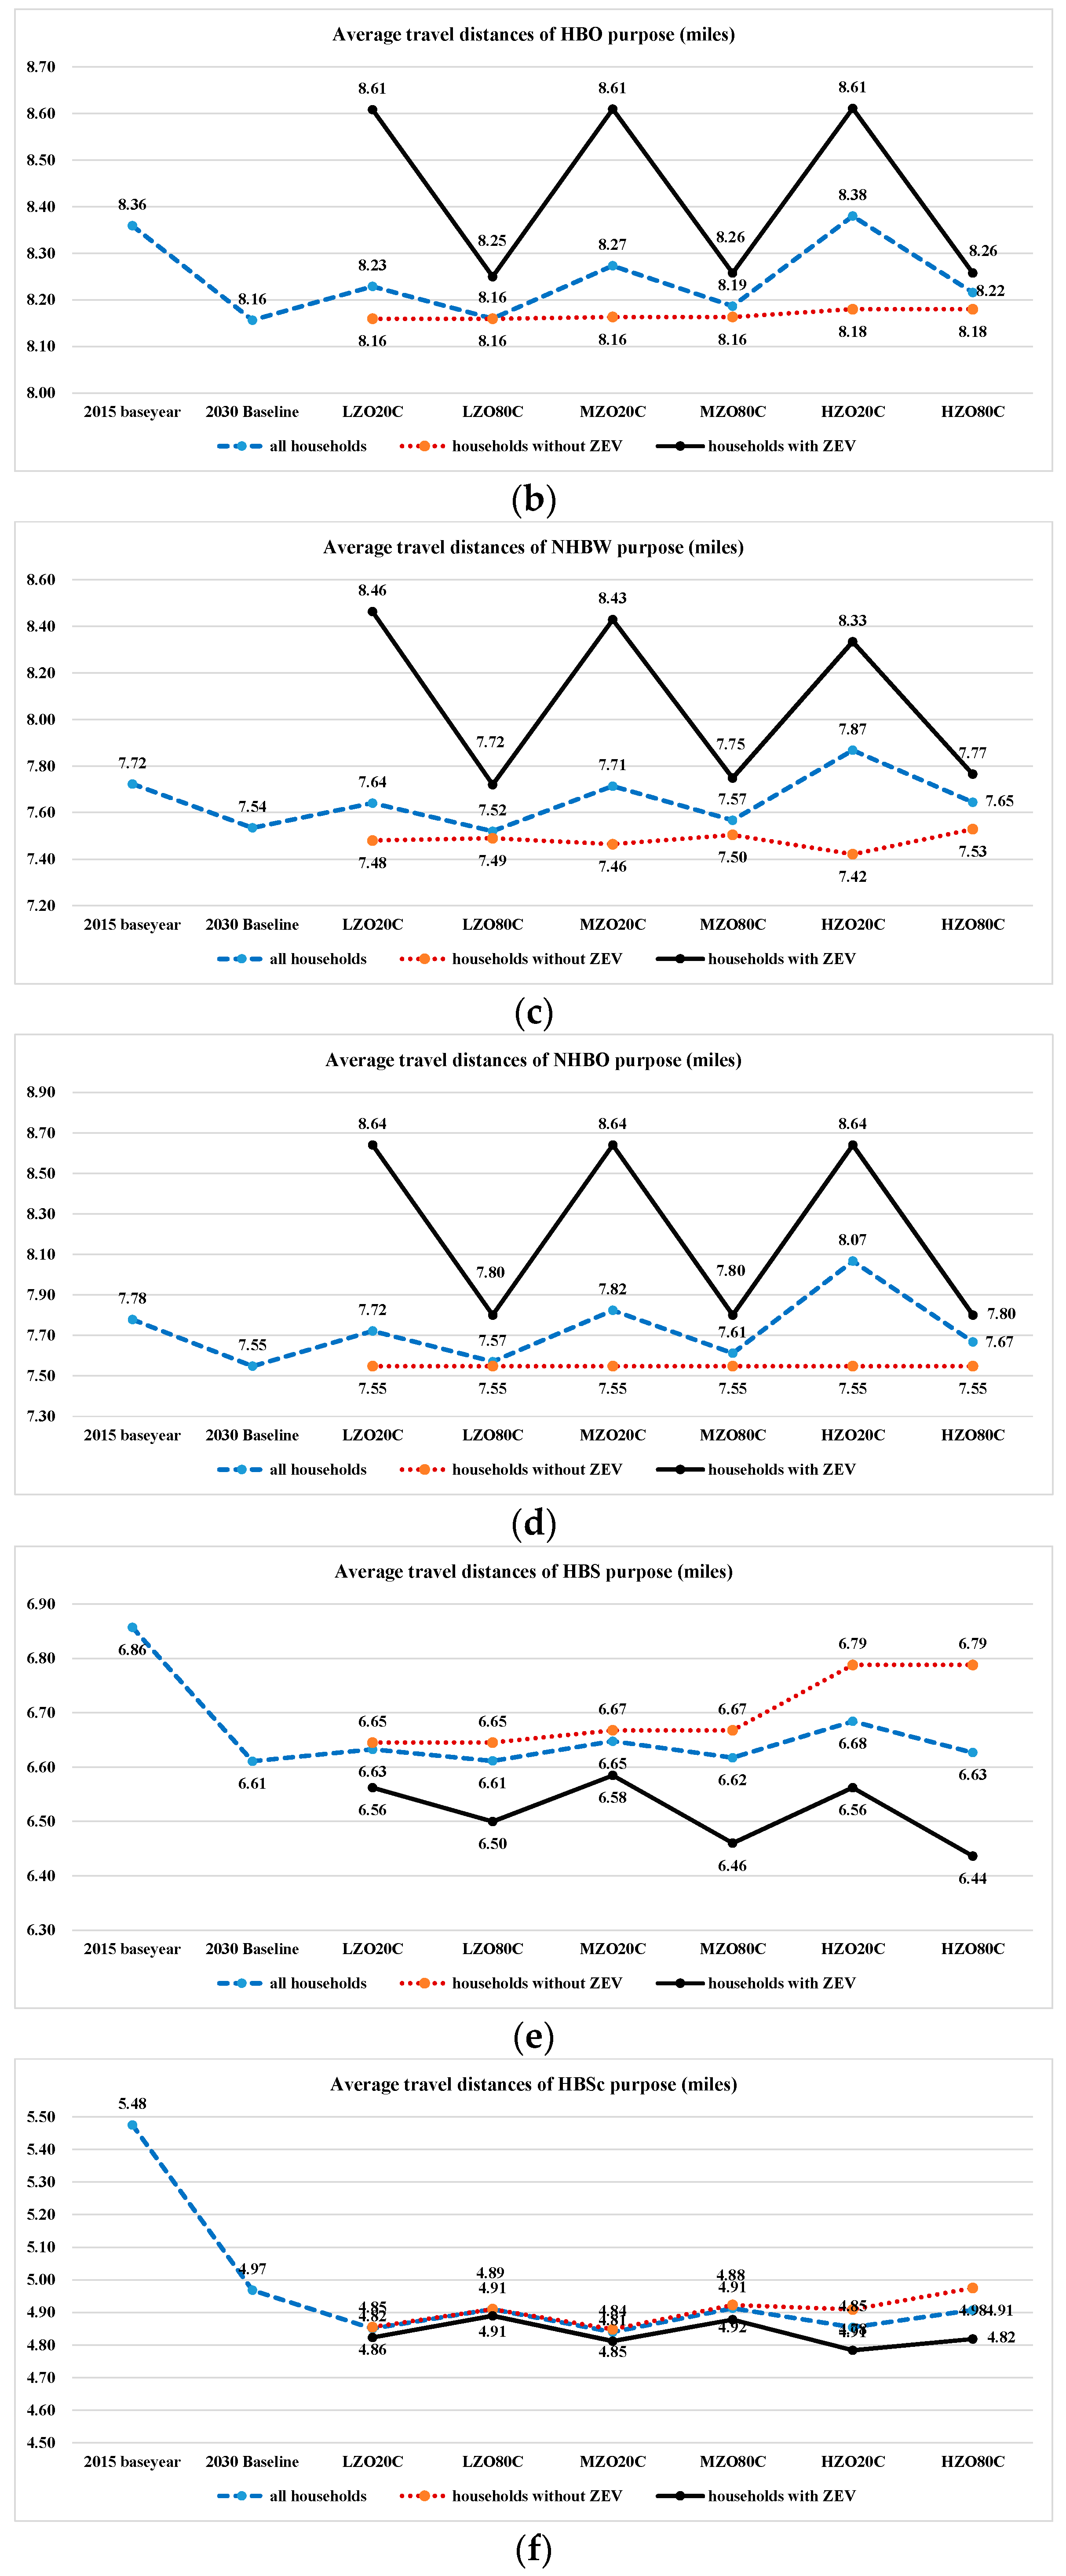
3.1. Changes in Travel Distance and Mode Choice
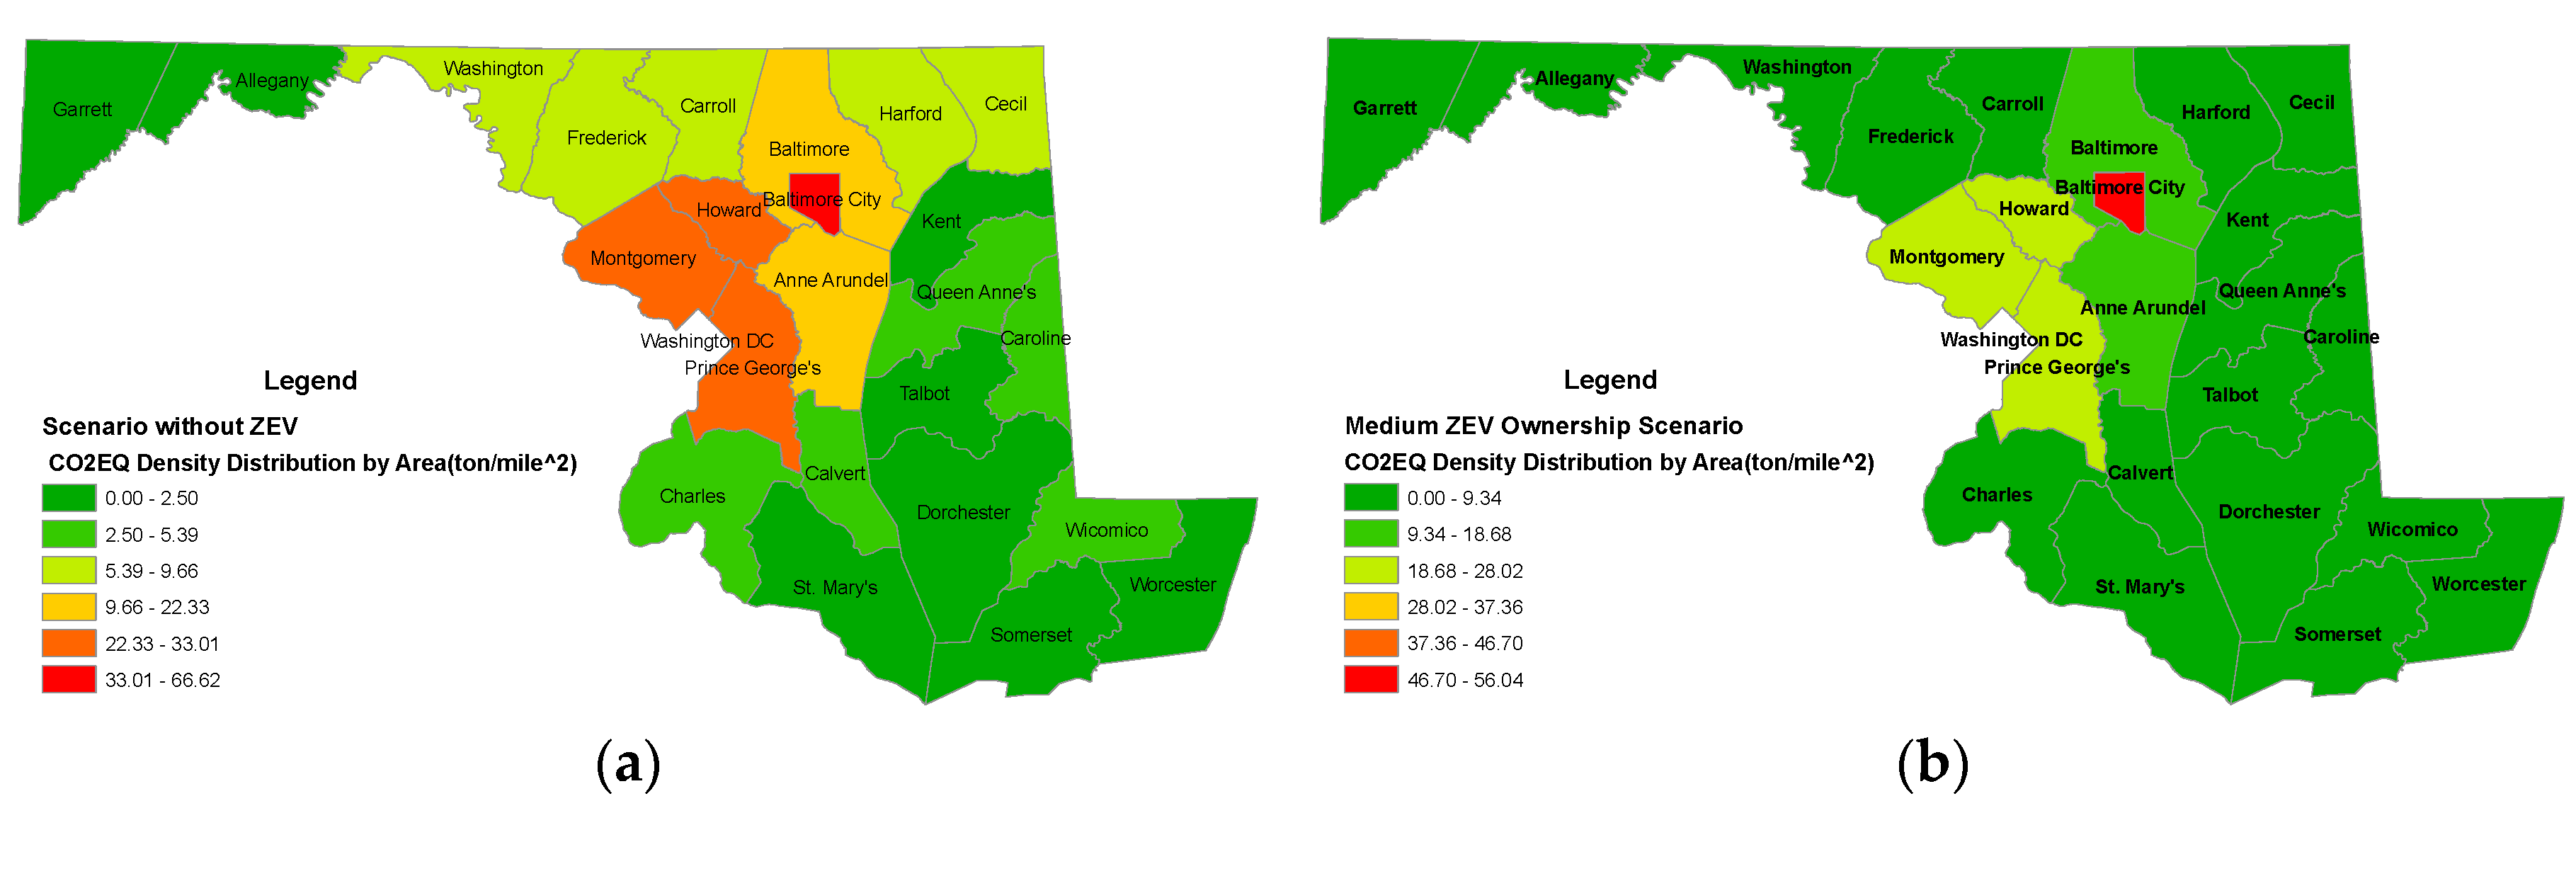
3.2. Spatial Analysis: Regional Level
3.3. Spatial Analysis: Local Level
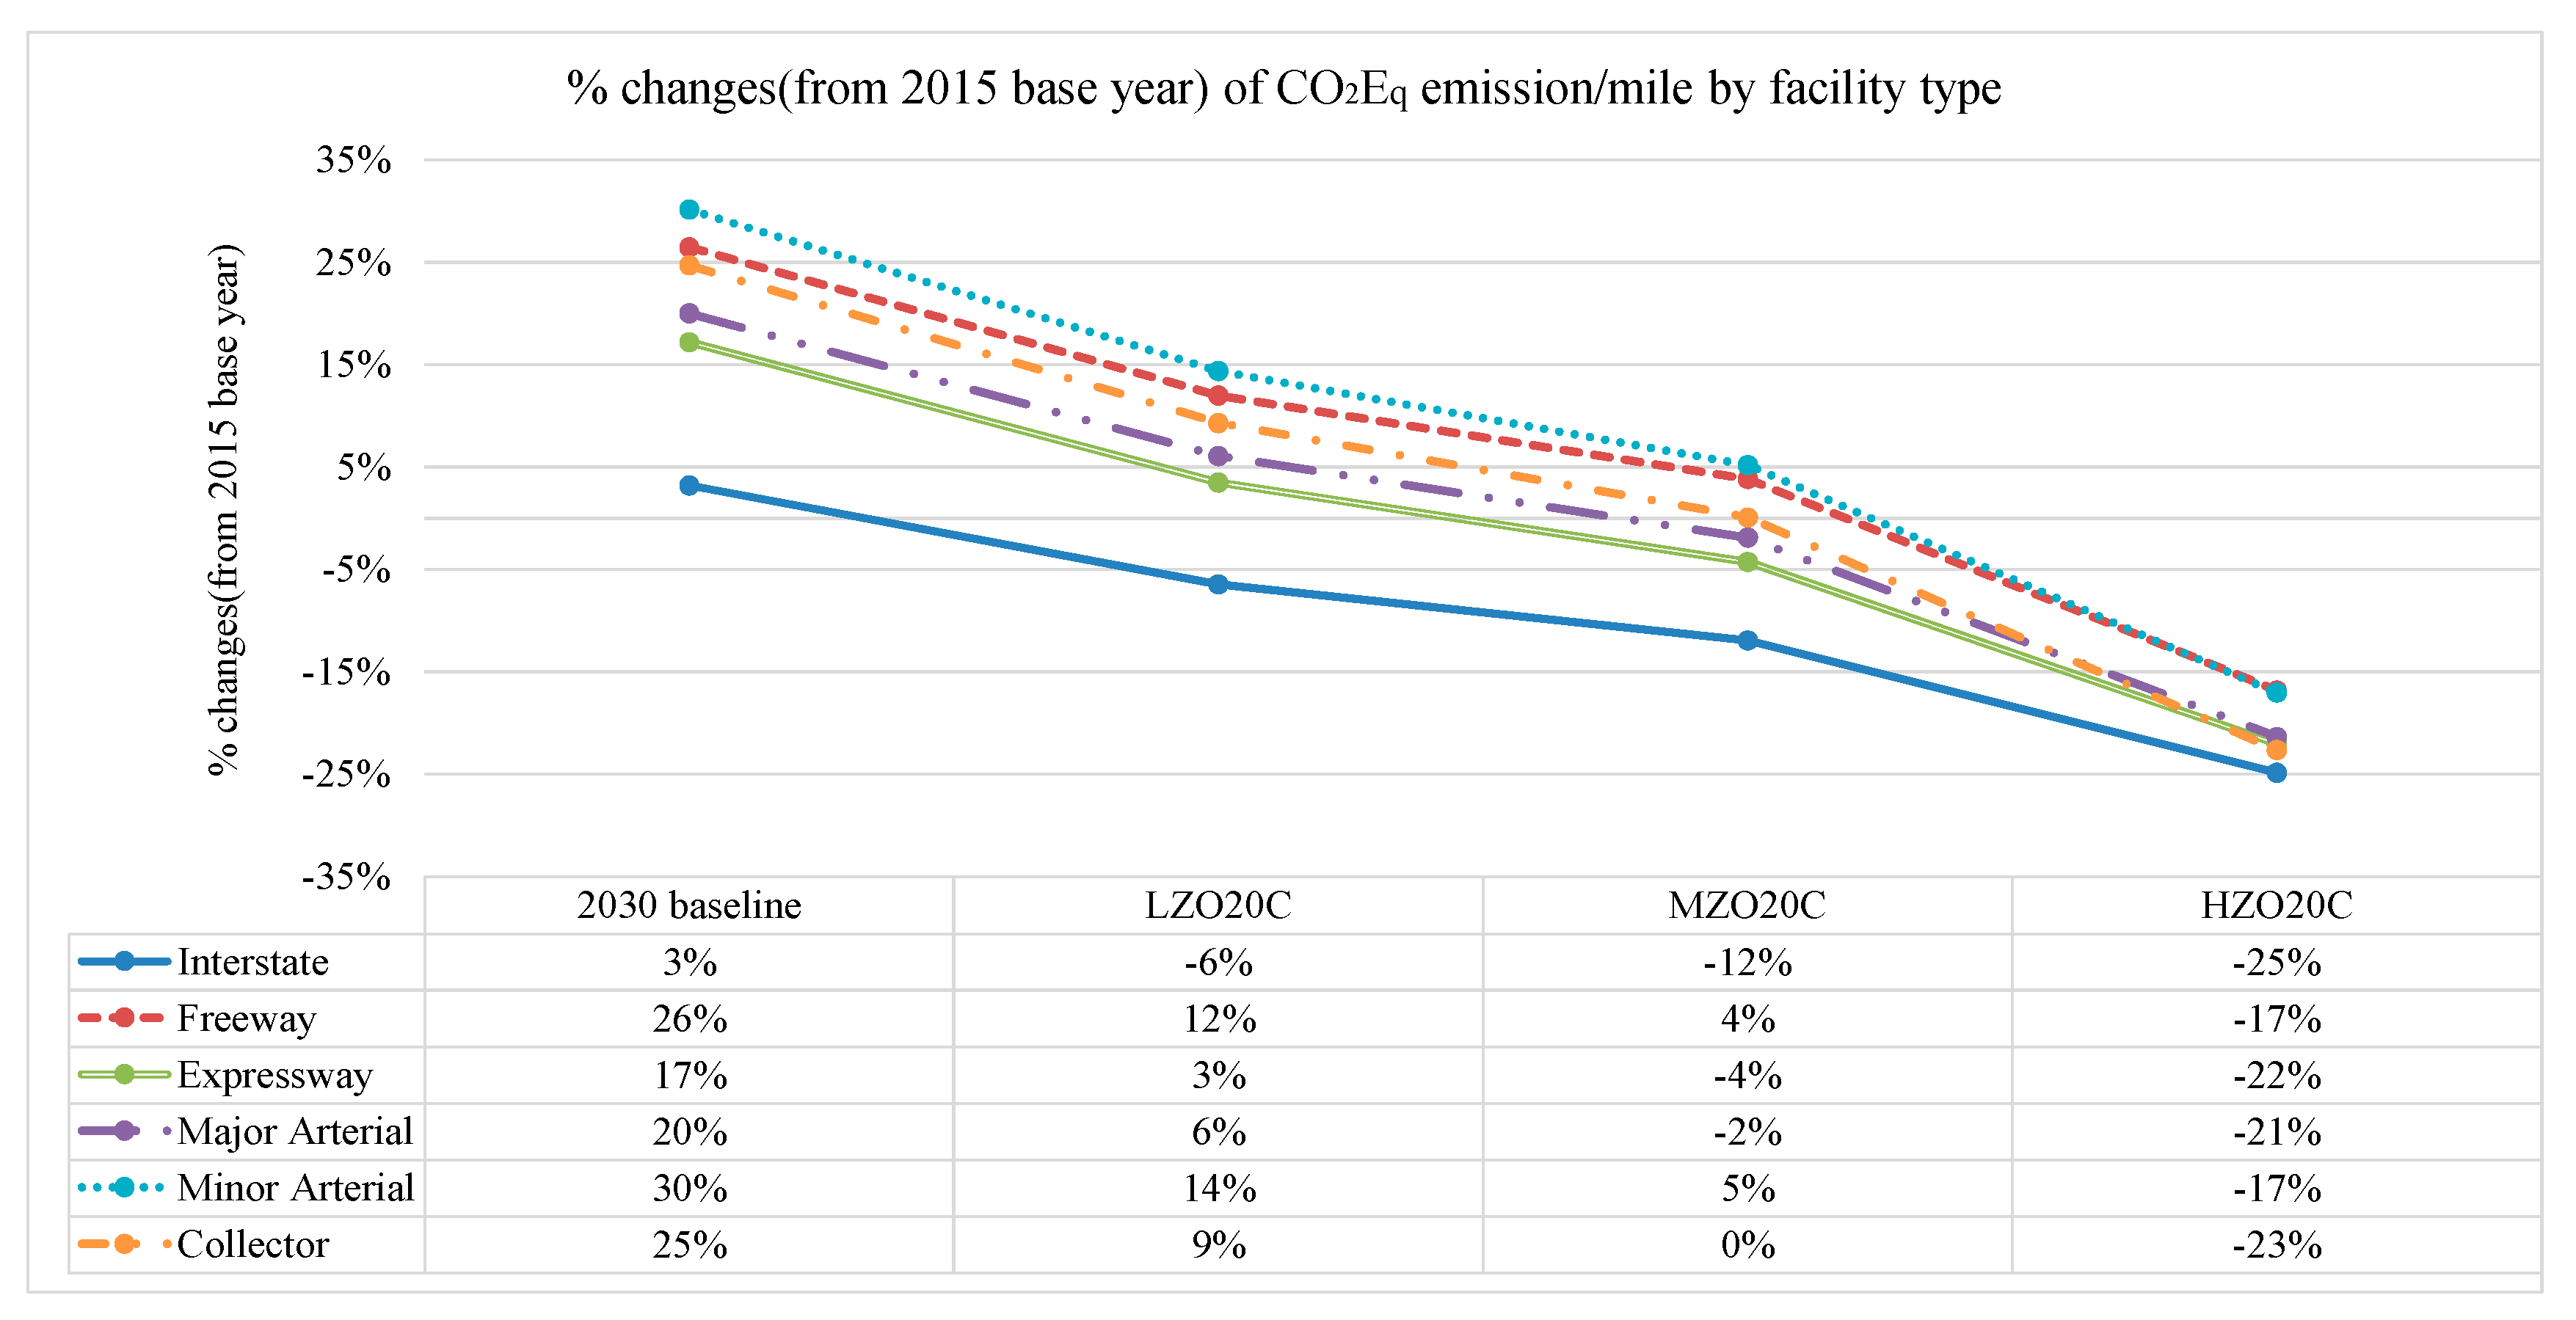
3.4. Spatial Analysis: Roadway Level
4. Discussion and Conclusions
Author Contributions
Funding
Acknowledgments
Conflicts of Interest
Abbreviations
| ZEV | Zero-emission Vehicles |
| GHG | Greenhouse Gas |
| MSTM | Maryland Statewide Transportation Model |
| EV | Electric Vehicles |
| HEV | Hybrid Electric Vehicles |
| MEM | Mobile Emissions Model |
| MOVES | Motor Vehicle Emissions Simulator |
| NOx | Oxides of Nitrogen |
| VOC | Volatile Organic Compounds |
| CO2Eq | Carbon Dioxide Equivalents |
| VHT | Vehicle Hours Traveled |
| VMT | Vehicle Miles Traveled |
| SMZ | Statewide Modeling Zone |
| ICEV | Internal Combustion Engine Vehicles |
| HBW | Home-Based Work |
| HBO | Home-Based Other |
| NHBW | Non-Home-Based Work |
| NHBO | Non-Home-Based Other |
| HBS | Home-Based Shop |
| HBSc | Home-Based School |
| CLRP | Constrained Long-Range Plan |
| LZO20C | Low-ZEV ownership with a 20% cost level of ICEVs |
| LZO80C | Low-ZEV ownership with an 80% cost level of ICEVs |
| MZO20C | Medium-ZEV ownership with a 20% cost level of ICEVs |
| MZO80C | Medium-ZEV ownership with an 80% cost level of ICEVs |
| HZO20C | High-ZEV ownership with a 20% cost level of ICEVs |
| HZO80C | High-ZEV ownership with an 80% cost level of ICEVs |
References
- Wang, Z.; Chen, F.; Fujiyama, T. Carbon emission from urban passenger transportation in Beijing. Transp. Res. Part D Transp. Environ. 2015, 41, 217–227. [Google Scholar] [CrossRef]
- World Bank Open Data. 2015. Available online: https://data.worldbank.org/indicator/EN.CO2.TRAN.ZS?display=default&end=2014&start=1960 (accessed on 28 January 2019).
- European Union. EU Transport in Figures, Statistical Pocketbook; European Union: Luxembourg, 2014. [Google Scholar]
- EPA. US Transportation Sector Greenhouse Gas Emissions 1990–2014. Available online: https://nepis.epa.gov/Exe/ZyPDF.cgi?Dockey=P100ONBL.pdf (accessed on 22 December 2017).
- Lopes Toledo, A.L.; Lèbre La Rovere, E. Urban Mobility and Greenhouse Gas Emissions: Status, Public Policies, and Scenarios in a Developing Economy City, Natal, Brazil. Sustainability 2018, 10, 3995. [Google Scholar] [CrossRef]
- Vierth, I.; Lindgren, S.; Lindgren, H. Vehicle Weight, Modal Split, and Emissions—An Ex-Post Analysis for Sweden. Sustainability 2018, 10, 1731. [Google Scholar] [CrossRef]
- Langbroek, J.H.M.; Franklin, J.P.; Susilo, Y.O. Electric vehicle users and their travel patterns in Greater Stockholm. Transp. Res. Part D Transp. Environ. 2017, 52, 98–111. [Google Scholar] [CrossRef]
- NRDC. Environmental Assessment of Plug-In Hybrid Electric Vehicles, Volume 1: Nationwide Greenhouse Gas Emissions. 2007. Available online: https://www.energy.gov/sites/prod/files/oeprod/DocumentsandMedia/EPRI-NRDC_PHEV_GHG_report.pdf (accessed on 28 January 2019).
- Velázquez-Martínez, J.C.; Fransoo, J.C.; Blanco, E.E.; Valenzuela-Ocaña, K.B. A new statistical method of assigning vehicles to delivery areas for CO2 emissions reduction. Transp. Res. Part D Transp. Environ. 2016, 43, 133–144. [Google Scholar] [CrossRef]
- ICF Incorporated, L.L.C. Assessment of Greenhouse Gas Analysis Techniques for Transportation Projects 2006. Available online: http://apps.trb.org/cmsfeed/TRBNetProjectDisplay.asp?ProjectID=1549 (accessed on 28 January 2019).
- Li, P.; Jones, S. Vehicle Restrictions and CO2 Emissions in Beijing—A Simple Projection Using Available Data. Transp. Res. Part D Transp. Environ. 2015, 41, 467–476. [Google Scholar] [CrossRef]
- Liu, Y.; Cirillo, C. Evaluating Policies to Reduce Greenhouse Gas Emissions from Private Transportation. Transp. Res. Part D Transp. Environ. 2016, 44, 219–233. [Google Scholar] [CrossRef]
- Cen, X.; Lo, H.K.; Li, L. A Framework for Estimating Traffic Emissions: The Development of Passenger Car Emission Unit. Transp. Res. Part D Transp. Environ. 2016, 44, 78–92. [Google Scholar] [CrossRef]
- Tan, X.; Zeng, Y.; Gu, B.; Wang, Y.; Xu, B. Scenario Analysis of Urban Road Transportation Energy Demand and GHG Emissions in China—A Case Study for Chongqing. Sustainability 2018, 10, 2033. [Google Scholar] [CrossRef]
- Schipper, L. Automobile Use, Fuel Economy and CO2 Emissions in Industrialized Countries: Encouraging Trends Through 2008? Transp. Policy 2011, 18, 358–372. [Google Scholar] [CrossRef]
- Gerard, D.; Fischbeck, P.; Mathews, H. Diesel and Hybrids Don’t Mix: Perceptions of the Interested Public and Actual Driving Behavior of New Car Owners. Transp. Res. Rec. J. Transp. Res. Board 2007, 2017, 33–40. [Google Scholar] [CrossRef]
- Akar, G.; Guldmann, J.M. Another Look at Vehicle Miles Traveled. Transp. Res. Rec. J. Transp. Res. Board 2012, 2322, 110–118. [Google Scholar] [CrossRef]
- Yu, B.; Zhang, J.; Fujiwara, A. Rebound Effects Caused by The Improvement of Vehicle Energy Efficiency: An Analysis Based on a SP-off-RP Survey. Transp. Res. Part D Transp. Environ. 2013, 24, 62–68. [Google Scholar] [CrossRef]
- Mishina, Y.; Muromachi, Y. Are Potential Reductions in CO2 Emissions via Hybrid Electric Vehicles Actualized in Real Traffic? The Case of Japan. Transp. Res. Part D Transp. Environ. 2017, 50, 372–384. [Google Scholar] [CrossRef]
- 2016 Annual Report: Maryland Commission on Climate Change. 2016. Available online: https://mde.maryland.gov/programs/Air/ClimateChange/MCCC/Publications/MCCC2016Report.pdf (accessed on 28 January 2019).
- Welch, T.F. Climate Action Plans—Fact or Fiction? Evidence from Maryland. Ph.D. Thesis, University of Maryland, College Park, MD, USA, 2013. [Google Scholar]
- Donnelly, R.; Huntsinger, L.; Sarvepalli, A.; Ducca, F.; Moeckel, R.; Mishra, S.; Welch, T. The Maryland Statewide Transportation Model Documentation (version 1.0); Maryland Department of Transportation State Highway Administration: Baltimore, MD, USA, 2013.
- Mishra, S.; Welch, T. Joint Travel Demand and Environmental Model to Incorporate Emission Pricing for Large Transportation Networks. Transp. Res. Rec. J. Transp. Res. Board 2012, 2302, 29–41. [Google Scholar] [CrossRef]
- Erdogan, S.; Fan, W.; Ducca, F.W. Modeling Support for Local Jurisdictions and The Impact of Zero Emission Vehicles on Air Quality; The National Center for Smart Growth Research and Education at the University of Maryland: College Park, MD, USA, 2015. [Google Scholar]
- Waygood, E.O.D.; Sun, Y.; Susilo, Y.O. Transportation Carbon Dioxide Emissions by Built Environment and Family Lifecycle: Case Study of The Osaka Metropolitan Area. Transp. Res. Part D Transp. Environ. 2014, 31, 176–188. [Google Scholar] [CrossRef]
- Farkas, Z.A.; Shin, H.S.; Dadvar, S.; Molina, J. Electric Vehicle Ownership Factors, Preferred Safety Technologies and Commuting Behavior in the United States; Morgan State University: Baltimore, MD, USA, 2017. [Google Scholar]
- Lane, B.W.; Sherman, C.P.; Sperl, J.; Krause, R.M.; Carley, S.; Graham, J.D. Beyond Early Adopters of Plug-in Electric Vehicles? Evidence from Fleet and Household Users in Indianapolis. In Proceedings of the Transportation Research Board 93rd Annual Meeting, Washington, DC, USA, 12–16 January 2014. [Google Scholar]
- MDOT. Maryland’s Electric Vehicle Infrastructure Council Interim Report. 2017. Available online: http://evadc.org/2017/03/12/report-of-the-maryland-electric-vehicle-infrastructure-council/ (accessed on 28 January 2019).
- Pearre, N.S.; Kempton, W.; Guensler, R.L.; Elango, V.V. Electric Vehicles: How Much Range is Required for A Day’s Driving? Transp. Res. Part C Emerg. Technol. 2011, 19, 1171–1184. [Google Scholar] [CrossRef]
- Fan, W.; Erdogan, S.; Welch, T.F.; Ducca, F. Use of Statewide Models as a Decision Tool for Zero-Emission Vehicles Deployment. Transp. Res. Rec. J. Transp. Res. Board 2017, 2628, 78–86. [Google Scholar] [CrossRef]
- Ducca, F.W.; Erdogan, S.; Gallivan, P.; Knaap, G.J.; Mishra, S.; Petto, G.; Wang, Y.; Welch, T.F. Maryland Scenarios Project Draft Final Year 3 Report. Prepared for Maryland Dept. of Transportation, National Center for Smart Growth Research and Education (NSCG), Transportation Policy Research Group (TPRG) Report, August 2012. Available online: http://www.umdsmartgrowth.org/wp-content/uploads/2017/05/msp_final_app_b3_20120823.pdf (accessed on 28 January 2019).
- Zero-Emission Vehicles in California: Community Readiness Guidebook. 2013. Available online: http://opr.ca.gov/docs/ZEV_Guidebook.pdf (accessed on 28 January 2019).
- Wu, K.; Chen, Y.; Ma, J.; Bai, S.; Tang, X. Traffic and Emissions Impact of Congestion Charging in The Central Beijing Urban Area: A Simulation Analysis. Transp. Res. Part D Transp. Environ. 2017, 51, 203–215. [Google Scholar] [CrossRef]
- Cheng, H.; Madanat, S.; Horvath, A. Planning Hierarchical Urban Transit Systems for Reductions in Greenhouse Gas Emissions. Transp. Res. Part D Transp. Environ. 2016, 49, 44–58. [Google Scholar] [CrossRef]

| Number of Scenarios | Scenarios * | ZEV Ownership Level | ZEV Cost (Percentage of ICEV’ Cost) |
|---|---|---|---|
| (1) | LZO20C | low | 20% |
| (2) | LZO80C | low | 80% |
| (3) | MZO20C | medium | 20% |
| (4) | MZO80C | medium | 80% |
| (5) | HZO20C | high | 20% |
| (6) | HZO80C | high | 80% |
| Scenarios | Households | DA | SR2 | SR3+ | Total ZEV or ICEV Share |
|---|---|---|---|---|---|
| 2015 base year | all households | 53.53% | 38.89% | 2.69% | 95.10% |
| 2030 baseline | all households | 53.87% | 37.53% | 2.61% | 94.01% |
| LZO20C | households without ZEV | 53.74% | 37.66% | 2.61% | 94.01% |
| households with ZEV | 58.65% | 34.13% | 2.00% | 94.79% | |
| LZO80C | households without ZEV | 53.92% | 37.76% | 2.61% | 94.29% |
| households with ZEV | 55.35% | 36.85% | 2.35% | 94.56% | |
| MZO20C | households without ZEV | 53.67% | 37.74% | 2.62% | 94.02% |
| households with ZEV | 58.53% | 34.20% | 2.02% | 94.76% | |
| MZO80C | households without ZEV | 53.70% | 37.75% | 2.62% | 94.08% |
| households with ZEV | 55.39% | 36.29% | 2.36% | 94.04% | |
| HZO20C | households without ZEV | 53.30% | 38.18% | 2.65% | 94.13% |
| households with ZEV | 58.47% | 34.10% | 2.03% | 94.59% | |
| HZO80C | households without ZEV | 53.39% | 38.21% | 2.65% | 94.25% |
| households with ZEV | 55.41% | 36.17% | 2.37% | 93.95% |
| Measures | 2015 Base Year | 2030 Baseline | LZO20C | LZO80C | MZO20C | MZO80C | HZO20C | HZO80C |
|---|---|---|---|---|---|---|---|---|
| VMTs (millions) | 168.16 | 204.66 | 210.21 | 205.63 | 213.55 | 206.85 | 221.16 | 208.92 |
| VMT % changes from 2015 base year | - | 21.71 | 25.00 | 22.28 | 26.99 | 23.01 | 31.52 | 24.24 |
| VMT % changes from 2030 baseline | - | - | 2.71 | 0.47 | 4.34 | 1.07 | 8.06 | 2.08 |
| CO2Eqs (tons/day) | 85,889 | 106,450 | 94,766 | 94,826 | 88,059 | 88,384 | 71,850 | 72,397 |
| CO2Eq % changes from 2015 base year | - | 23.94% | 10.33 | 10.41 | 2.53 | 2.90 | −16.35 | −15.80 |
| CO2Eq % changes from 2030 baseline | - | - | -10.98 | −10.92 | −17.28 | −16.97 | −32.50 | −32.07 |
| Counties | % Changes (from 2015 Base Year) | % Changes (from 2030 Baseline) | |||||
|---|---|---|---|---|---|---|---|
| 2030 Baseline | LZO20C | MZO20C | HZO20C | LZO20C | MZO20C | HZO20C | |
| Allegany | −10.02% | −16.00% | −19.55% | −27.51% | −6.64% | −10.58% | −19.43% |
| Anne Arundel | 16.87% | 3.10% | −4.65% | −24.20% | −11.78% | −18.41% | −35.14% |
| Baltimore | 10.63% | −1.58% | −8.55% | −25.43% | −11.04% | −17.34% | −32.60% |
| Calvert | 18.74% | 4.76% | −3.35% | −22.73% | −11.77% | −18.60% | −34.92% |
| Caroline | 38.55% | 23.28% | 14.34% | −6.38% | −11.02% | −17.48% | −32.43% |
| Carroll | 8.16% | −3.98% | −10.83% | −28.44% | −11.22% | −17.55% | −33.84% |
| Cecil | 38.47% | 25.54% | 18.09% | 0.03% | −9.34% | −14.72% | −27.76% |
| Charles | 3.29% | −8.52% | −15.53% | −31.54% | −11.43% | −18.22% | −33.73% |
| Dorchester | 43.20% | 27.03% | 17.39% | −4.27% | −11.29% | −18.02% | −33.15% |
| Frederick | 34.36% | 22.44% | 15.35% | −1.53% | −8.88% | −14.15% | −26.72% |
| Garrett | −20.90% | −26.95% | −30.46% | −38.32% | −7.65% | −12.08% | −22.02% |
| Harford | 16.35% | 5.01% | −1.46% | −17.08% | −9.74% | −15.31% | −28.73% |
| Howard | 25.84% | 11.69% | 3.41% | −16.76% | −11.24% | −17.83% | −33.85% |
| Kent | 26.73% | 10.67% | 2.10% | −18.78% | −12.67% | −19.43% | −35.91% |
| Montgomery | 38.83% | 22.35% | 12.97% | −10.02% | −11.87% | −18.62% | −35.19% |
| Prince George’s | 49.50% | 31.24% | 20.98% | −4.09% | −12.21% | −19.08% | −35.84% |
| Queen Anne’s | 32.52% | 19.36% | 12.84% | −4.82% | −9.93% | −14.85% | −28.18% |
| Saint Mary’s | −38.62% | −46.33% | −50.82% | −61.70% | −12.56% | −19.87% | −37.59% |
| Somerset | 73.14% | 52.96% | 41.04% | 14.11% | −11.65% | −18.54% | −34.09% |
| Talbot | 21.96% | 8.83% | 1.66% | −16.45% | −10.77% | −16.65% | −31.50% |
| Washington | 17.05% | 8.85% | 4.09% | −7.02% | −7.01% | −11.08% | −20.57% |
| Wicomico | 30.39% | 14.80% | 5.18% | −15.23% | −11.95% | −19.33% | −34.99% |
| Worcester | 22.96% | 8.88% | 0.11% | −18.47% | −11.45% | −18.58% | −33.70% |
| Baltimore City | 19.41% | 7.64% | 0.44% | −15.85% | −9.85% | −15.88% | −29.53% |
| Counties | CO2Eq Emissions by Area (Tons/Day/Square Miles) | CO2Eq Emissions by VMT (g/VMT) | ||||||
|---|---|---|---|---|---|---|---|---|
| 2030 Baseline | LZO20C | MZO20C | HZO20C | 2030 Baseline | LZO20C | MZO20C | HZO20C | |
| Allegany | 2.39 | 2.23 | 2.14 | 1.93 | 0.49 | 0.45 | 0.43 | 0.38 |
| Anne Arundel | 15.43 | 13.61 | 12.59 | 10.01 | 0.44 | 0.38 | 0.35 | 0.26 |
| Baltimore | 22.33 | 19.87 | 18.46 | 15.05 | 0.53 | 0.46 | 0.42 | 0.33 |
| Calvert | 3.92 | 3.46 | 3.19 | 2.55 | 0.64 | 0.55 | 0.50 | 0.38 |
| Caroline | 3.41 | 3.04 | 2.82 | 2.31 | 0.62 | 0.54 | 0.49 | 0.39 |
| Carroll | 7.35 | 6.52 | 6.06 | 4.86 | 0.55 | 0.47 | 0.43 | 0.33 |
| Cecil | 8.52 | 7.73 | 7.27 | 6.16 | 0.47 | 0.42 | 0.39 | 0.32 |
| Charles | 3.01 | 2.66 | 2.46 | 1.99 | 0.54 | 0.46 | 0.42 | 0.33 |
| Dorchester | 0.99 | 0.88 | 0.81 | 0.66 | 0.59 | 0.51 | 0.46 | 0.36 |
| Frederick | 9.07 | 8.27 | 7.79 | 6.65 | 0.53 | 0.47 | 0.44 | 0.36 |
| Garrett | 1.04 | 0.96 | 0.91 | 0.81 | 0.46 | 0.42 | 0.39 | 0.34 |
| Harford | 9.66 | 8.71 | 8.18 | 6.88 | 0.48 | 0.43 | 0.40 | 0.32 |
| Howard | 28.25 | 25.07 | 23.21 | 18.68 | 0.47 | 0.41 | 0.37 | 0.29 |
| Kent | 1.44 | 1.26 | 1.16 | 0.92 | 0.56 | 0.48 | 0.43 | 0.33 |
| Montgomery | 28.92 | 25.49 | 23.53 | 18.74 | 0.55 | 0.47 | 0.43 | 0.33 |
| Prince George’s | 33.01 | 28.98 | 26.71 | 21.18 | 0.54 | 0.46 | 0.42 | 0.32 |
| Queen Anne’s | 3.90 | 3.51 | 3.32 | 2.80 | 0.62 | 0.55 | 0.50 | 0.41 |
| Saint Mary’s | 1.56 | 1.37 | 1.25 | 0.98 | 0.60 | 0.51 | 0.46 | 0.35 |
| Somerset | 1.53 | 1.35 | 1.25 | 1.01 | 0.65 | 0.56 | 0.50 | 0.39 |
| Talbot | 2.50 | 2.23 | 2.08 | 1.71 | 0.57 | 0.49 | 0.45 | 0.36 |
| Washington | 6.64 | 6.18 | 5.91 | 5.28 | 0.47 | 0.44 | 0.41 | 0.36 |
| Wicomico | 5.39 | 4.75 | 4.35 | 3.51 | 0.53 | 0.46 | 0.42 | 0.32 |
| Worcester | 2.17 | 1.92 | 1.77 | 1.44 | 0.59 | 0.50 | 0.46 | 0.35 |
| Baltimore City | 66.62 | 60.06 | 56.04 | 46.95 | 0.50 | 0.44 | 0.41 | 0.33 |
© 2019 by the authors. Licensee MDPI, Basel, Switzerland. This article is an open access article distributed under the terms and conditions of the Creative Commons Attribution (CC BY) license (http://creativecommons.org/licenses/by/4.0/).
Share and Cite
Wang, Z.; Erdogan, S.; W. Ducca, F. Evaluating the Efficacy of Zero-Emission Vehicle Deployment Strategies: The Maryland Case. Sustainability 2019, 11, 1750. https://doi.org/10.3390/su11061750
Wang Z, Erdogan S, W. Ducca F. Evaluating the Efficacy of Zero-Emission Vehicle Deployment Strategies: The Maryland Case. Sustainability. 2019; 11(6):1750. https://doi.org/10.3390/su11061750
Chicago/Turabian StyleWang, Zhenbao, Sevgi Erdogan, and Frederick W. Ducca. 2019. "Evaluating the Efficacy of Zero-Emission Vehicle Deployment Strategies: The Maryland Case" Sustainability 11, no. 6: 1750. https://doi.org/10.3390/su11061750
APA StyleWang, Z., Erdogan, S., & W. Ducca, F. (2019). Evaluating the Efficacy of Zero-Emission Vehicle Deployment Strategies: The Maryland Case. Sustainability, 11(6), 1750. https://doi.org/10.3390/su11061750