Article

Game Modelling and Strategy Research on the System Dynamics–Based Quadruplicate Evolution for High–Speed Railway Operational Safety Supervision System

1
School of Information Science and Technology, Southwest Jiaotong University, Chengdu 610031, China
2
Business School, Sichuan Normal University, Chengdu 610064, China
3
Scientific Research Department, Sichuan Normal University, Chengdu 610064, China
*
Author to whom correspondence should be addressed.
Sustainability 2019, 11(5), 1300; https://doi.org/10.3390/su11051300
Submission received: 14 January 2019 / Revised: 5 February 2019 / Accepted: 24 February 2019 / Published: 1 March 2019
(This article belongs to the Special Issue Sustainable Transport Safety)

Abstract

:
In view of the entrusted transportation management model (ETMM) of China’s high–speed railway (HSR), the supervision strategy of an HSR company for its multiple agents plays a very important role in ensuring the safety and sustainable development of HSR. Due to the existence of multiple agents in ETMM, the supervision strategy for these agents is usually difficult to formulate. In this study, a quadruplicate HSR safety supervision system evolutionary game model composed of an HSR company and three agents was established through the analysis of the complex game relationship existing in the system. The behavioral characteristics and the steady state of decision–making of all stakeholders involved in the system are proved by evolutionary game theory and system dynamics simulation. The results show that there will be long–term fluctuations in the strategies selected by the four stakeholders in the static reward–penalty control scenario (RPCS), which indicates that an evolutionary stable strategy does not exist. With increases in the reward–penalty coefficient, the fluctuations are intensified. Therefore, the dynamic RPCS was proposed to control the fluctuations, and the simulation was repeated. The results show that the fluctuations can be effectively restrained by adopting the dynamic RPCS, but if the coefficients are the same, the static RPCS is better than the dynamic RPCS for increasing the safety investment rate of the three agents. This demonstrates that the HSR company should apply these two control scenarios flexibly according to the actual situation when formulating a supervision strategy in order to effectively control and enhance the safety level of HSR operations when multiple agents are involved.

1. Introduction

Along the continued development of global economy, infrastructures have to be continuously upgraded to improve the living environment of its citizens. Therefore, gas pipelines, high–speed railways (HSR), subways, airports, tunnels, bridges are constructed and brought into service constantly [1,2]. In recent years, the development of HSR as one of the main initiatives, regarding transport infrastructure, pursued by many countries due to its advantages of high punctuality rate, safety, comfort, little environmental impact, less economic investments required, low energy consumption, and high speed [3,4,5]. HSR around the world have been continuously carrying out the innovation of technological, management and institutional [6,7,8,9]. Governments and relevant departments in many countries have revised and formulated new transportation development strategies to promote the sustainable development of HSR [10,11,12].
Due to the comprehensive efforts of the China Railway Corporation (CRC) and all of the employees in the railway industry, China now has the largest number of HSR with construction and in operation (in terms of mileage) in the world [13]. However, some serious HSR accidents have happened and caused a lot of injuries, fatalities as well as economic losses. For instance, On 23 July 2011, the train D301 from Beijing South Station to Fuzhou Station rear–ended with the train D3115 from Hangzhou to Fuzhou South Station, 40 people were killed, 172 injured and 193.7165 million yuan direct economic loss on the Yong–Wen HSR line, which is considered to be the most serious accident in Chinese railway history [14,15,16,17]. Therefore, ensuring the safety of HSR has become an important task of the government, the CRC, and any other relevant entity or individual.
As an outcome of the leapfrogging railway development in China, the HSR management system is still in an exploratory stage. A new model of HSR management have been proposed, called the entrusted transportation management model (ETMM) [18]. In the ETMM, an HSR company separates the responsibility of transportation asset management from transportation production management. That is, the HSR company is responsible for the specialized management of the transportation assets, and the transportation production business is entrusted to other agents (e.g., a railways bureau–RB). According to the CRC–issued regulations in “Guiding Opinions on Commissioning Transportation Management by New Joint–Venture Railway” [19], the ETMM has been adopted for the operation and management of HSR due to its advantages of conducive to the centralized command of transportation dispatch, rational allocation and utilization of railway transportation network resources, strengthen professional management; this is an innovative reform to the HSR management system in China [18]. ETMM specifies the safety management responsibilities of all stakeholders, such as the operational management responsibility of multiple RBs, and that the HSR company should pay relevant management fees to them for these services. Furthermore, the HSR company’s safety supervision of these agents is essential, so the system is called an HSR Operational Safety Supervision System. In this system, the behavior of these agents should be managed and controlled through effective reward and penalty measures, thus enabling achievement of the goal of improving the safety management levels of the HSR.
From the principles of the market economy and the view of game theory [20,21,22,23], each stakeholder in an HSR Operational Safety Supervision System may have different business goals and economic interests. They could formulate different strategies to concurrently maximize their respective profits and ensure the safety of the HSR transportation management. The effectiveness of HSR safety supervision and inspection depends on the different strategy selections made by the HSR company and its agents using the information they have observed over a long period of time; thus, a game relationship exists between them. As the railway management system is still being reformed in China, the ETMM is not perfect. A number of problems have arisen due to the ambiguous lines of responsibility and rights in the safety management process, and the assessment system of rewards and penalties to control the safety investment behavior of these agents does not exist. These problems could increase the ambiguity of the rules of the game and deepen the hidden conflicts of interest between different stakeholders. Furthermore, the long–term effectiveness of HSR supervision and inspection will be directly affected, and it also has a potential impact on the operational safety of the HSR. A scientific method is needed for HSR company to formulate effective measures of rewards and penalties, the ETMM can then be refined.
Game theory can study the mathematical models of conflict and interactions among multiple participants. However, it also has its limitations [21]. The key assumptions of traditional game theory are that the participants are intelligent, rational beings, which is inconsistent with the actual situation [22,23]. Evolutionary game theory is an extension of traditional game theory; it was developed to overcome the disadvantages of traditional game theory when analyzing the bounded rationality of participants and considering the dynamic process of game playing [24,25,26]. For these reasons, evolutionary game theory was widely used to study various safety measures that prevail in many areas. For example, Li et al. [27] established a game model of over–speed–limit driving behavior using evolutionary game theory. They analyzed the steady state of evolution through the Jacobian matrix and proposed a rewards and penalties measure to standardize the behavior of traffic managers and drivers. Cai [28,29] used game theory and system dynamics (SD) simulation to study the governance of environmental pollution and analyzed the evolutionary game process of the system between the government and the two companies using different strategies. Wang et al. [30] proposed an SD model for studying a mixed–strategy evolutionary game between the firm and the government about the environmental pollution problem; they suggested using dynamic penalties for equilibrium stabilization and improvement. Zhu et al. [31] used evolutionary game theory to analyze the game relationship between local governments and manufacturing companies under a carbon emission reduction policy; they introduced government dynamic compensation strategies to analyze the interaction mechanism between the government and business. Zhang et al. [32] used evolutionary game theory to analyze the issue of supervising inspectors and toll collectors who choose complicity with drivers seeking to escape charges. They concluded that strengthening supervision of and penalties for inspectors can effectively improve this situation. Tian et al. [33] used system dynamic simulations and evolutionary game theory to guide the subsidy policies that promote the diffusion of green supply chain management in China. The relationships of stakeholders such as government, enterprises and consumers were analyzed in that study. Liu et al. [34] used evolutionary game theory and system dynamic simulations to analyze the stability of stakeholder interactions and to identify equilibrium solutions in China’s coal mining safety inspection system. Zhang [35] studied the stability of the equilibrium in the game between commercial banks and closed–loop supply chain enterprises by using evolutionary game theory combined with SD simulations. Duan et al. [36] built two SD–based tripartite evolutionary game models to study the relationship between government, business, and the overall interests of society. Guo et al. [37] proposed an SD model based on evolutionary game theory to describe the complex and dynamic interactions among tripartite stakeholders during construction quality supervision.
Many studies on problems existing in the HSR operational safety supervision system have achieved some results. For example, Peng et al. [38] think that an effective incentive compatibility mechanism should be designed and established to resolve the different interests between the HSR company and the commissioned RB, to achieve a ‘win–win’ situation for the two sides. Han [39] believed that the incentive and regulation mechanism should be revised and improved to strengthen the entrusted transportation management of the HSR. Ji et al. [40] used game theory to study the behavior between railway enterprises and railway regulatory agencies to improve the efficiency of supervision. However, to date, those researchers have focused on qualitative analysis without in–depth theoretical research [38,39], or they only used traditional game theory to analyze the game between two stakeholders [40]. Li et al. [41] established a static evolutionary game model that is composed of HSR company, the State Railway Administration (SRA) and the commissioned Railways Bureau (RB) on a macro level. They summarizes the differences between safety supervision/inspection of HSR company and safety supervision/management of SRA by analyzing the current status of HSR operational safety supervision system. In the actual supervision process, a HSR line often involves multiple commissioned RBs (agents), for example, the HSR line between Beijing and Shanghai in China involves three agents, the Jinan RB, the Shanghai RB and the Beijing RB. On the one hand, the HSR company has commissioned transportation management agreements with three agents separately, but on the other hand, uncooperative relationships have been formed among its three agents due to the lack of clear agreement between them. The existing work does not consider the existence of multiple agents in the system, the problem of systemic dynamic interactions that can occur between the HSR company and its three agents has still not been modeled. Therefore, a scientific method to guide decision making is non–existent. Research is still needed to address this issue so that control scenarios can be put forward for controlling the stability of the interactions; this can help the HSR company to effectively develop and implement the supervision strategies, also can perfect the assessment system of rewards and penalties. Therefore, based on the results of academic research in relevant fields and the laws and regulations on the operational safety supervision of the HSR, this paper further narrows the scope of the study, the quadruplicate dynamic evolutionary game process between the HSR company and its three agents (with uncooperative relationships) is modeled and analyzed.
The remainder of this paper is organized as follows. In Section 2, the evolutionary game model of these actors in a static reward–penalty control scenario (RPCS) is established and simulated using an SD model. In Section 3, the model is optimized and established in a dynamic RPCS. Finally, by comparing and analyzing the influence of different reward–penalty coefficients to the model in these two scenarios, some reasonable suggestions are proposed for the development of policies on the HSR operational safety supervision system with multiple agents in Section 4.

2. Analysis of an HSR Operational Safety Supervision Evolutionary Game Model with Multiple Agents in a Static RPCS

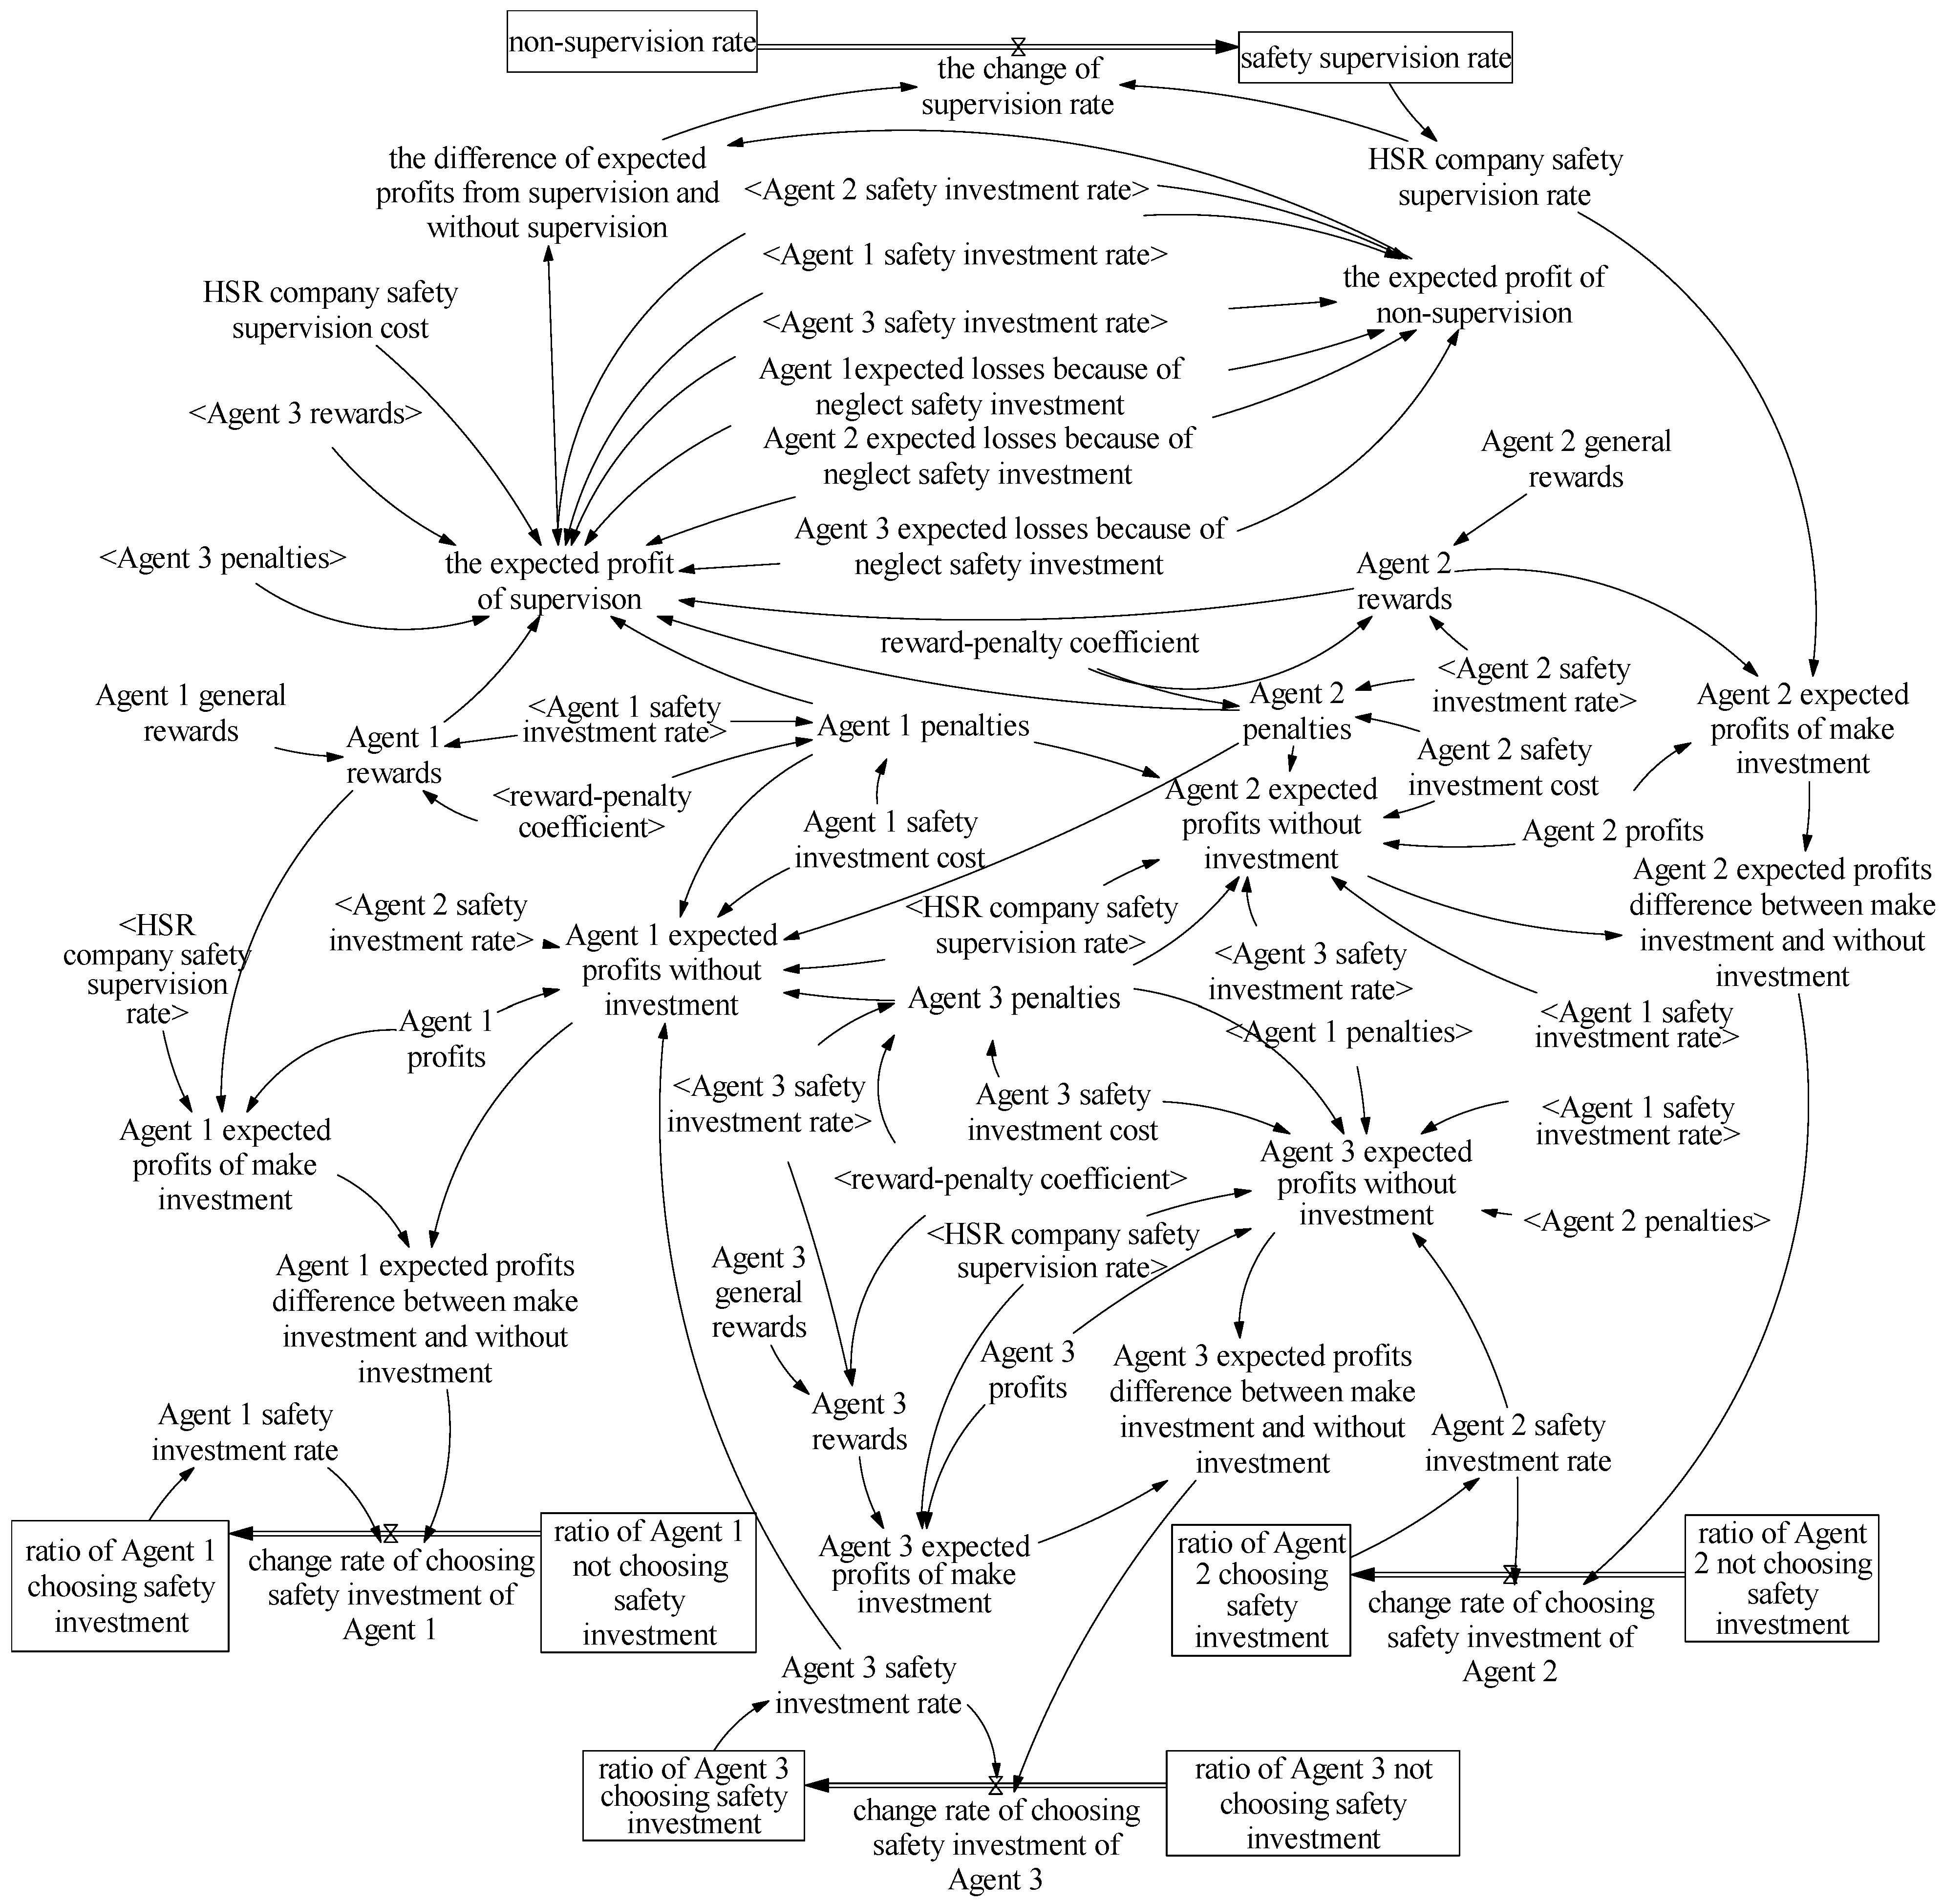
2.1. Model Description and Establishment

As the HSR ETMM is established in the background of the marketization operating mechanism, there is an uncooperative and competitive relationship among the multiple agents in the HSR operation safety supervision system. Based on the “Regulation on the Administration of Railway Safety (No.639)” [42], the “Safety Management Regulations” [43], and the management delegation agreement signed by the HSR company and its agents, the evolutionary game model of the HSR safety operations supervision system with three agents has been described as follows.
The HSR company is responsible for supervising its three agents. Assume that the strategy for the HSR company is to supervise at a ratio of X (0 ≤ X ≤ 1). Suppose that the average cost of agent supervision is CS. If there is no supervision, the three agents may violate the HSR rules and regulations and neglect safety investment. That is when accident rates start to rise and the HSR company will bear the cost of the latter part of the asset and reputation losses, represented as L j ( j = 1 , 2 , 3 ) . The strategy for the three agents to make safety investments occurs at a ratio of Yj (0 ≤ Yj ≤ 1, j = 1, 2, 3). Suppose that the normal safety production profits of three agents are π j ( j = 1 , 2 , 3 ) and their safety investment costs are C j ( j = 1 , 2 , 3 ) . If these agents will be punished or rewarded according to the results of supervision by the HSR company, they will be rewarded with B j ( j = 1 , 2 , 3 ) or punished with P j ( j = 1 , 2 , 3 ) , as they comply with or violate the regulations.
B j = β A j ( j = 1 , 2 , 3 )
P j = β C j ( j = 1 , 2 , 3 )
In Equations (1) and (2), β is the reward–penalty coefficient, and A j ( j = 1 , 2 , 3 ) is the general reward for three agents. When only one agent is found to have violated the agreement, the penalty is P j ; when two or three agents concurrently violate the agreement, the penalty is P j ( j = 1 , 2 j = 1 , 3 j = 2 , 3 j = 1 , 2 , 3 ) .
From the above basic assumptions and descriptions, the game payoff of the three agents with uncooperative relationship under eight different strategy combinations can be obtained. For example, when Agent 2 makes safety investment, Agent 1 and Agent 3 neglects safety investment, the payoff of Agent 2 is π 2 + X B 2 , i.e., the sum of the normal safety production profits of Agent 2 and the rewards of HSR company at supervision rate X; the payoff of Agent 1 is π 1 + C 1 X ( P 1 + P 3 ) , i.e., the sum of the normal safety production profits of Agent 1, the safety investment costs saved during the neglects safety investment and the negative of rewards of HSR company at supervision rate X when Agent 1 and Agent 3 concurrently violate the agreement. The payoff of Agent 3 is π 3 + C 3 X ( P 1 + P 3 ) , i.e., the sum of the normal safety production profits of Agent 3, the safety investment costs saved during the neglects safety investment and the negative of rewards of HSR company at supervision rate X when Agent 1 and Agent 3 concurrently violate the agreement. In the same way, the game payoff of the three agents under the other seven strategy combinations can be obtained. Overall, the payoff matrix of the three agents can be summarized as presented in Table 1.
Table 1 shows that the expected profits of Agent 1 for selecting to make a safety investment or not are L Y 1 ,   L 1 Y 1 , respectively.
L Y 1 = π 1 + X B 1
L 1 Y 1 = Y 2 Y 3 ( π 1 + C 1 X P 1 ) + ( 1 Y 2 ) Y 3 ( π 1 + C 1 X ( P 1 + P 2 ) ) + ( 1 Y 3 ) Y 2 ( π 1 + C 1 X ( P 1 + P 3 ) ) + ( 1 Y 3 ) ( 1 Y 2 ) ( π 1 + C 1 X ( P 1 + P 2 + P 3 ) )
Therefore, the average expected profit of Agent 1 is,
L 1 ¯ = Y 1 L Y 1 + ( 1 Y 1 ) L 1 Y 1
Similarly, the average expected profits of Agent 2 and Agent 3 are L 2 ¯ , L 3 ¯ .
When the HSR company is playing a game with the three agents. The payoff matrix is shown in Table 2.
Based on Table 2, the expected profits of the HSR company when choosing to perform the duty of supervision or not are LX and L1−X, respectively.
L X = Y 1 Y 2 Y 3 ( C S B 1 B 2 B 3 ) + Y 1 ( 1 Y 2 ) ( 1 Y 3 ) ( C S + P 2 + P 3   L 2   L 3 B 1 ) + Y 2 ( 1 Y 1 ) ( 1 Y 3 ) ( C S + P 1 + P 3 L 1   L 3 B 2 ) + Y 3 ( 1 Y 1 ) ( 1 Y 2 ) ( C S + P 1 + P 2 L 1 L 2 B 3 ) + Y 1 Y 2 ( 1 Y 3 ) ( C S + P 3 L 3 B 1 B 2 ) Y 1 Y 3 ( 1 Y 2 ) ( C S + P 2 L 2 B 1 B 3 ) + Y 2 Y 3 ( 1 Y 1 ) ( C S + P 1   L 1 B 2 B 3 ) + ( 1 Y 1 ) ( 1 Y 2 ) ( 1 Y 3 ) ( C S + P 1 + P 2 + P 3 L 1 L 2 L 3 )
L 1 X = Y 1 ( 1 Y 2 ) ( 1 Y 3 ) ( L 2 L 3 ) + Y 2 ( 1 Y 1 ) ( 1 Y 3 ) ( L 1 L 3 ) + Y 3 ( 1 Y 1 ) ( 1 Y 2 ) ( L 1 L 2 ) + Y 1 Y 2 ( 1 Y 3 ) ( L 3 ) + Y 1 Y 3 ( 1 Y 2 ) ( L 2 ) + Y 3 Y 2 ( 1 Y 1 ) ( L 1 ) + ( 1 Y 1 ) ( 1 Y 2 ) ( 1 Y 3 ) ( L 1 L 2 L 3 )
Therefore, the average expected profit of the HSR company is,
L ¯ = X L X + ( 1 X ) L 1 X

2.2. Replicator Dynamics of a Multiple Agent Supervision System

Based on evolutionary game theory and Equations (1)–(8), the replicator dynamics (RD) equation [44] reflects the speed and direction of the strategy adjustment for safety supervision by the HSR company and the safety investment by three agents, as shown in equation set (9).
{ H ( X , Y 1 , Y 2 , Y 3 ) = d X / d t = X ( L X L ¯ ) = X ( 1 X ) ( L X L 1 X ) I 1 ( X , Y 1 , Y 2 , Y 3 ) = d Y 1 / d t   =   Y 1   ( 1 Y 1 ) (   L Y 1   L 1 Y 1 ) I 2 ( X , Y 1 , Y 2 , Y 3 ) = d Y 2 / d t   =   Y 2   ( 1 Y 2 ) (   L Y 2   L 1 Y 2 ) I 3 ( X , Y 1 , Y 2 , Y 3 ) = d Y 3 / d t   =   Y 3   ( 1 Y 3 ) (   L Y 3   L 1 Y 3 )
From equation set (9), the Jacobian determinant is shown in Equation (10).
J = | ( 2 X 1 ) H ( X , Y 1 , Y 2 , Y 3 ) X ( X 1 ) H ( X , Y 1 , Y 2 , Y 3 ) Y 1 X ( X 1 ) H ( X , Y 1 , Y 2 , Y 3 ) Y 2 X ( X 1 ) H ( X , Y 1 , Y 2 , Y 3 ) Y 3 Y 1 ( 1 Y 1 ) I 1 ( X , Y 1 , Y 2 , Y 3 ) X ( 1 2 Y 1 ) I 1 ( X , Y 1 , Y 2 , Y 3 ) Y 1 Y 1 ( 1 Y 1 ) I 1 ( X , Y 1 , Y 2 , Y 3 ) Y 2 Y 1 ( 1 Y 1 ) I 1 ( X , Y 1 , Y 2 , Y 3 ) Y 3 Y 2 ( 1 Y 2 ) I 2 ( X , Y 1 , Y 2 , Y 3 ) X Y 2 ( 1 Y 2 ) I 2 ( X , Y 1 , Y 2 , Y 3 ) Y 1 ( 1 2 Y 2 ) I 2 ( X , Y 1 , Y 2 , Y 3 ) Y 2 Y 2 ( 1 Y 2 ) I 2 ( X , Y 1 , Y 2 , Y 3 ) Y 3 Y 3 ( 1 Y 3 ) I 3 ( X , Y 1 , Y 2 , Y 3 ) X Y 3 ( 1 Y 3 ) I 2 ( X , Y 1 , Y 2 , Y 3 ) Y 1 Y 3 ( 1 Y 3 ) I 2 ( X , Y 1 , Y 2 , Y 3 ) Y 2 ( 1 2 Y 3 ) I 3 ( X , Y 1 , Y 2 , Y 3 ) Y 3 |
where,
H ( X , Y 1 , Y 2 , Y 3 ) = X ( X 1 ) ( C S P 1 P 2 P 3 + Y 1 P 1 + Y 2 P 2 + Y 3 P 3 + Y 1 B 1 + Y 2 B 2 + Y 3 B 3 ) I 1 ( X , Y 1 , Y 2 , Y 3 ) = ( X ( P 1 + P 2 + P 3 ) C 1 + X B 1 X Y 2 P 2 + X Y 3 P 3 ) I 2 ( X , Y 1 , Y 2 , Y 3 ) = ( X ( P 1 + P 2 + P 3 ) C 2 + X B 2 X Y 1 P 1 + X Y 3 P 3 ) I 3 ( X , Y 1 , Y 2 , Y 3 ) = ( X ( P 1 + P 2 + P 3 ) C 3 + X B 3 X Y 2 P 2 + X Y 1 P 1 )
Because the mathematical expression of the model is relatively complicated, and in order to facilitate the solution analysis, the relative variables should first be assigned values so that the equilibrium solutions of the RD equation set (10) can be calculated. Then, the stability of all equilibrium solutions can be analyzed through theoretical derivation and SD simulation. According to the investigations by related experts in the HSR industry [41], the specific parameters are obtained as shown in Table 3 after pretreatment.

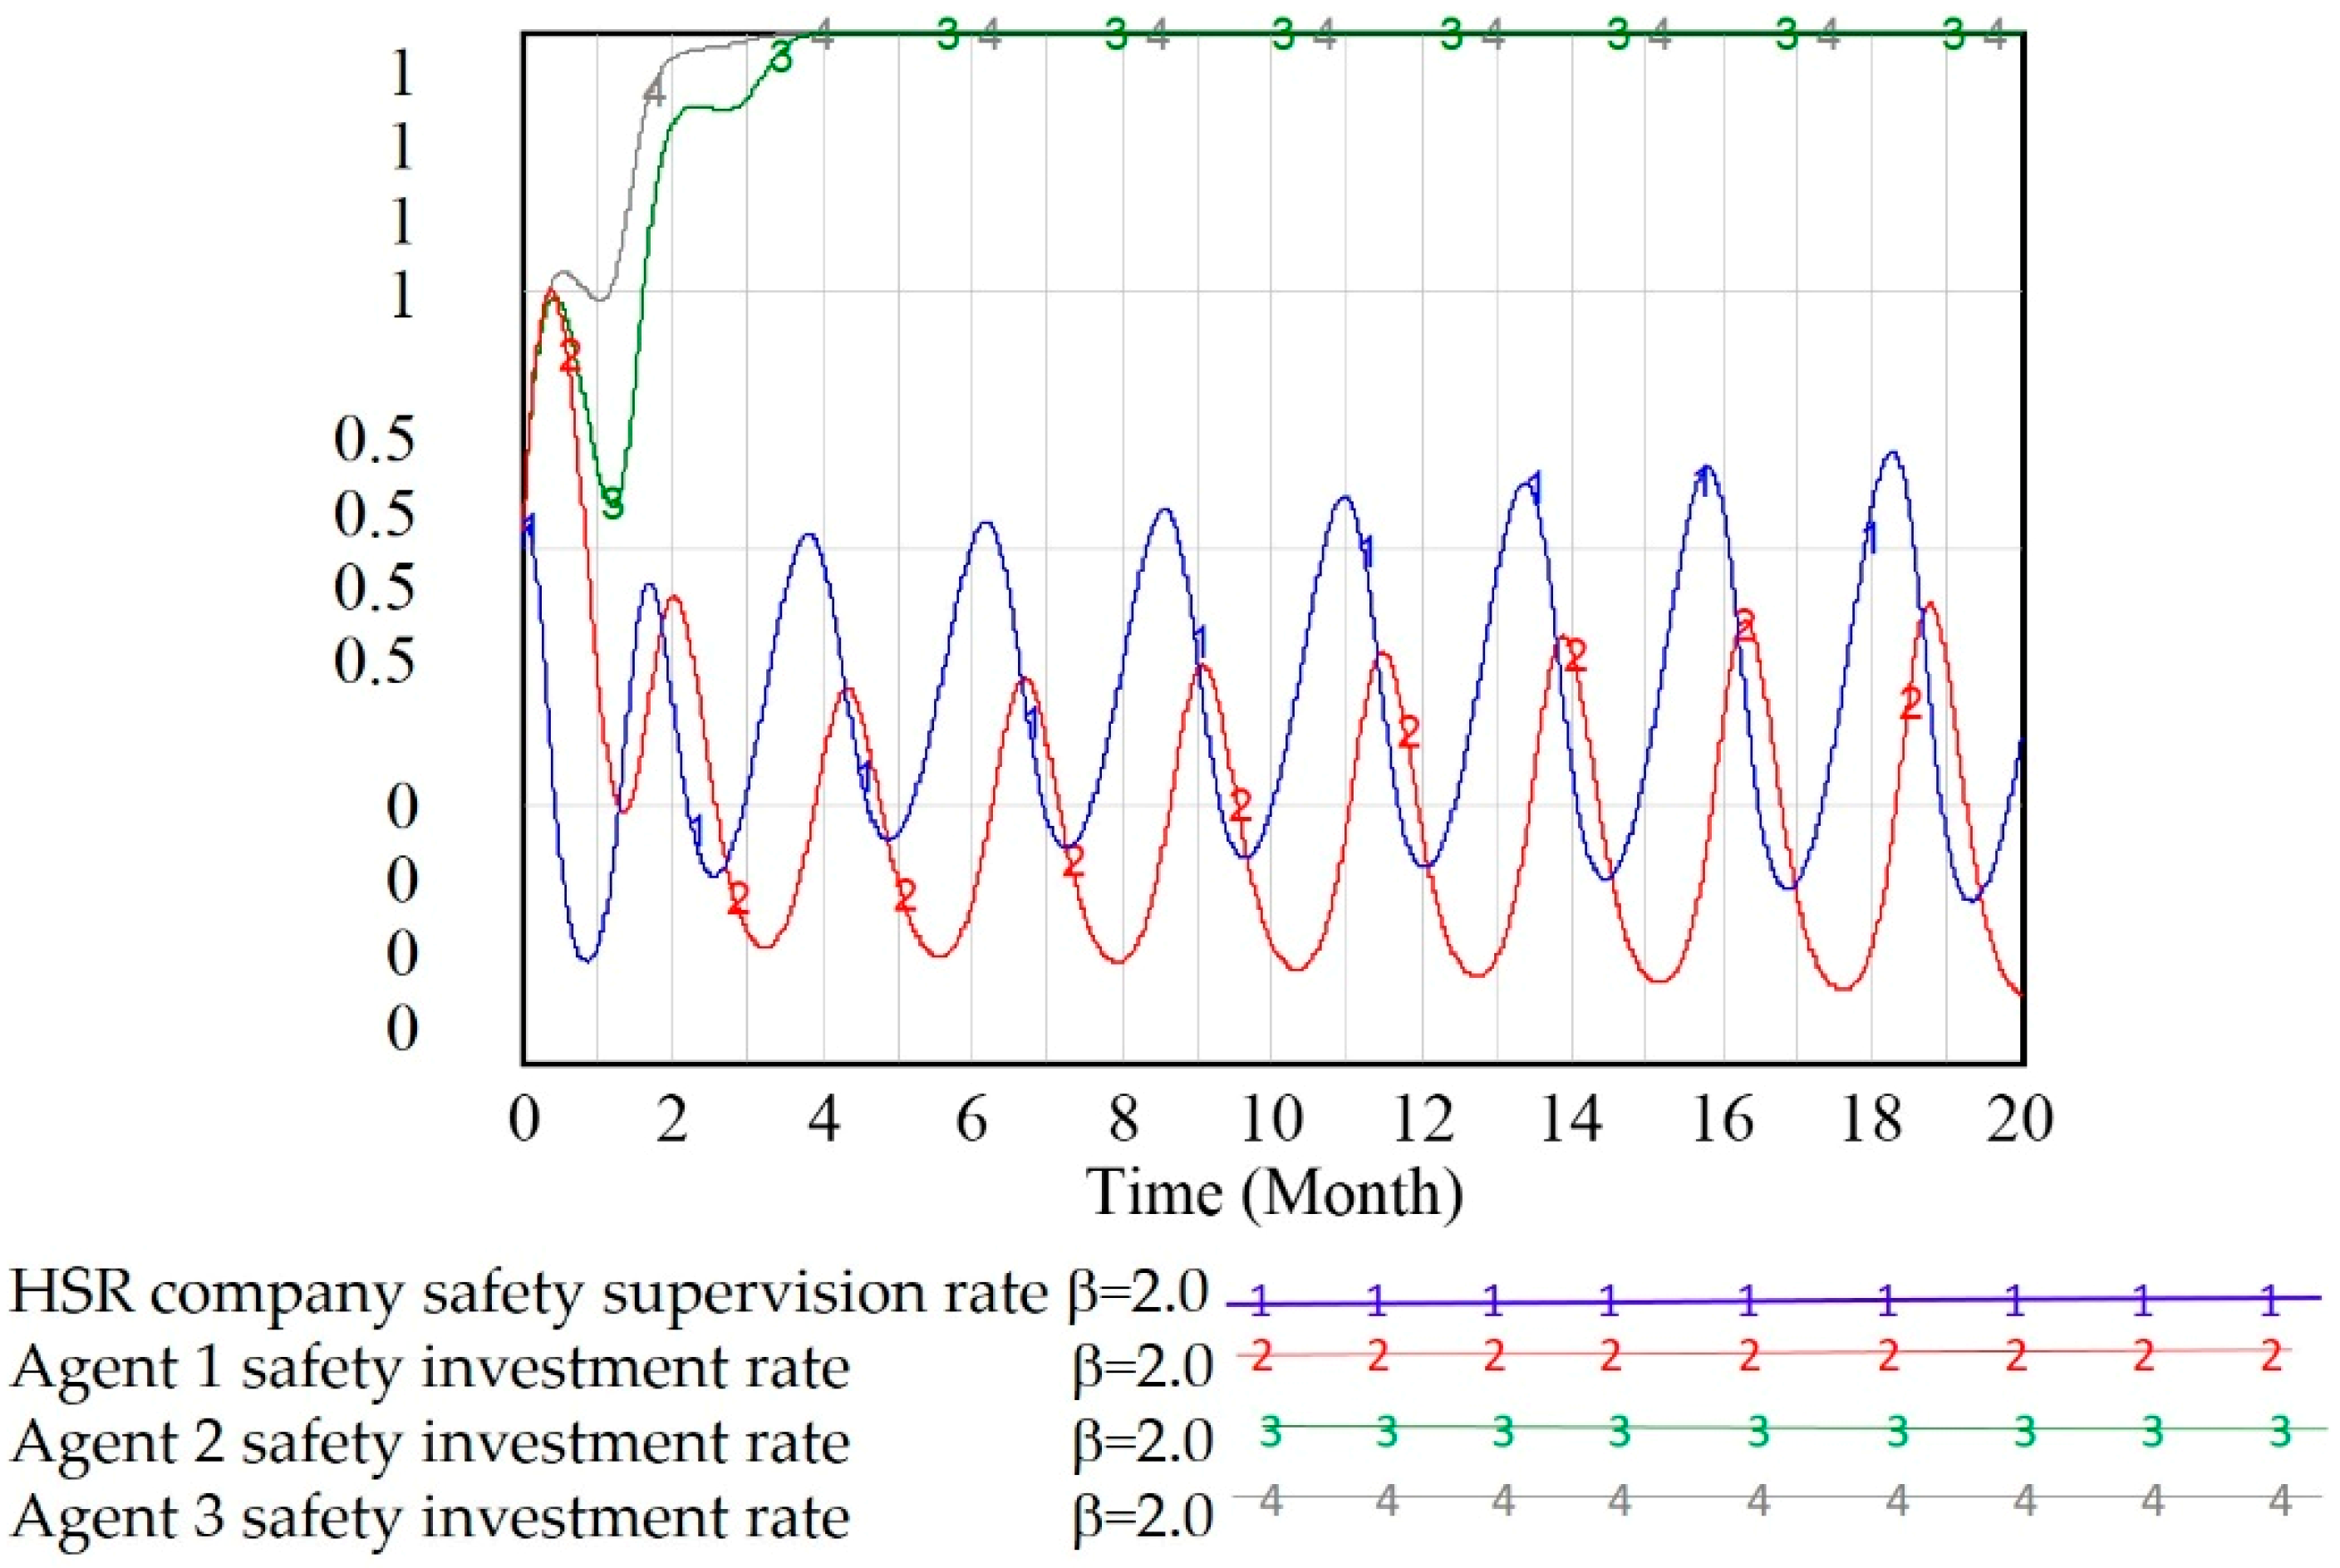
2.3. Results of the Stability Analysis of a Multiple–Agent Supervision System

Friedman proposed a method to obtain the stability of the equilibrium solution of the system’s RD equations by analyzing the Jacobian matrix and the characteristic values of the game model [45,46]. According to the Lyapunov stability theory, if all characteristic values have nonpositive real parts, the system is stable; otherwise, the system is unstable. Substitute these specific numerical values from Table 3 into Equations (9) and (10) to calculate the corresponding characteristic values and the steady state of each equilibrium solution of the model, as shown in Table 4. From Table 4, we can see that no evolutionary stable strategy (ESS) exists in this model.

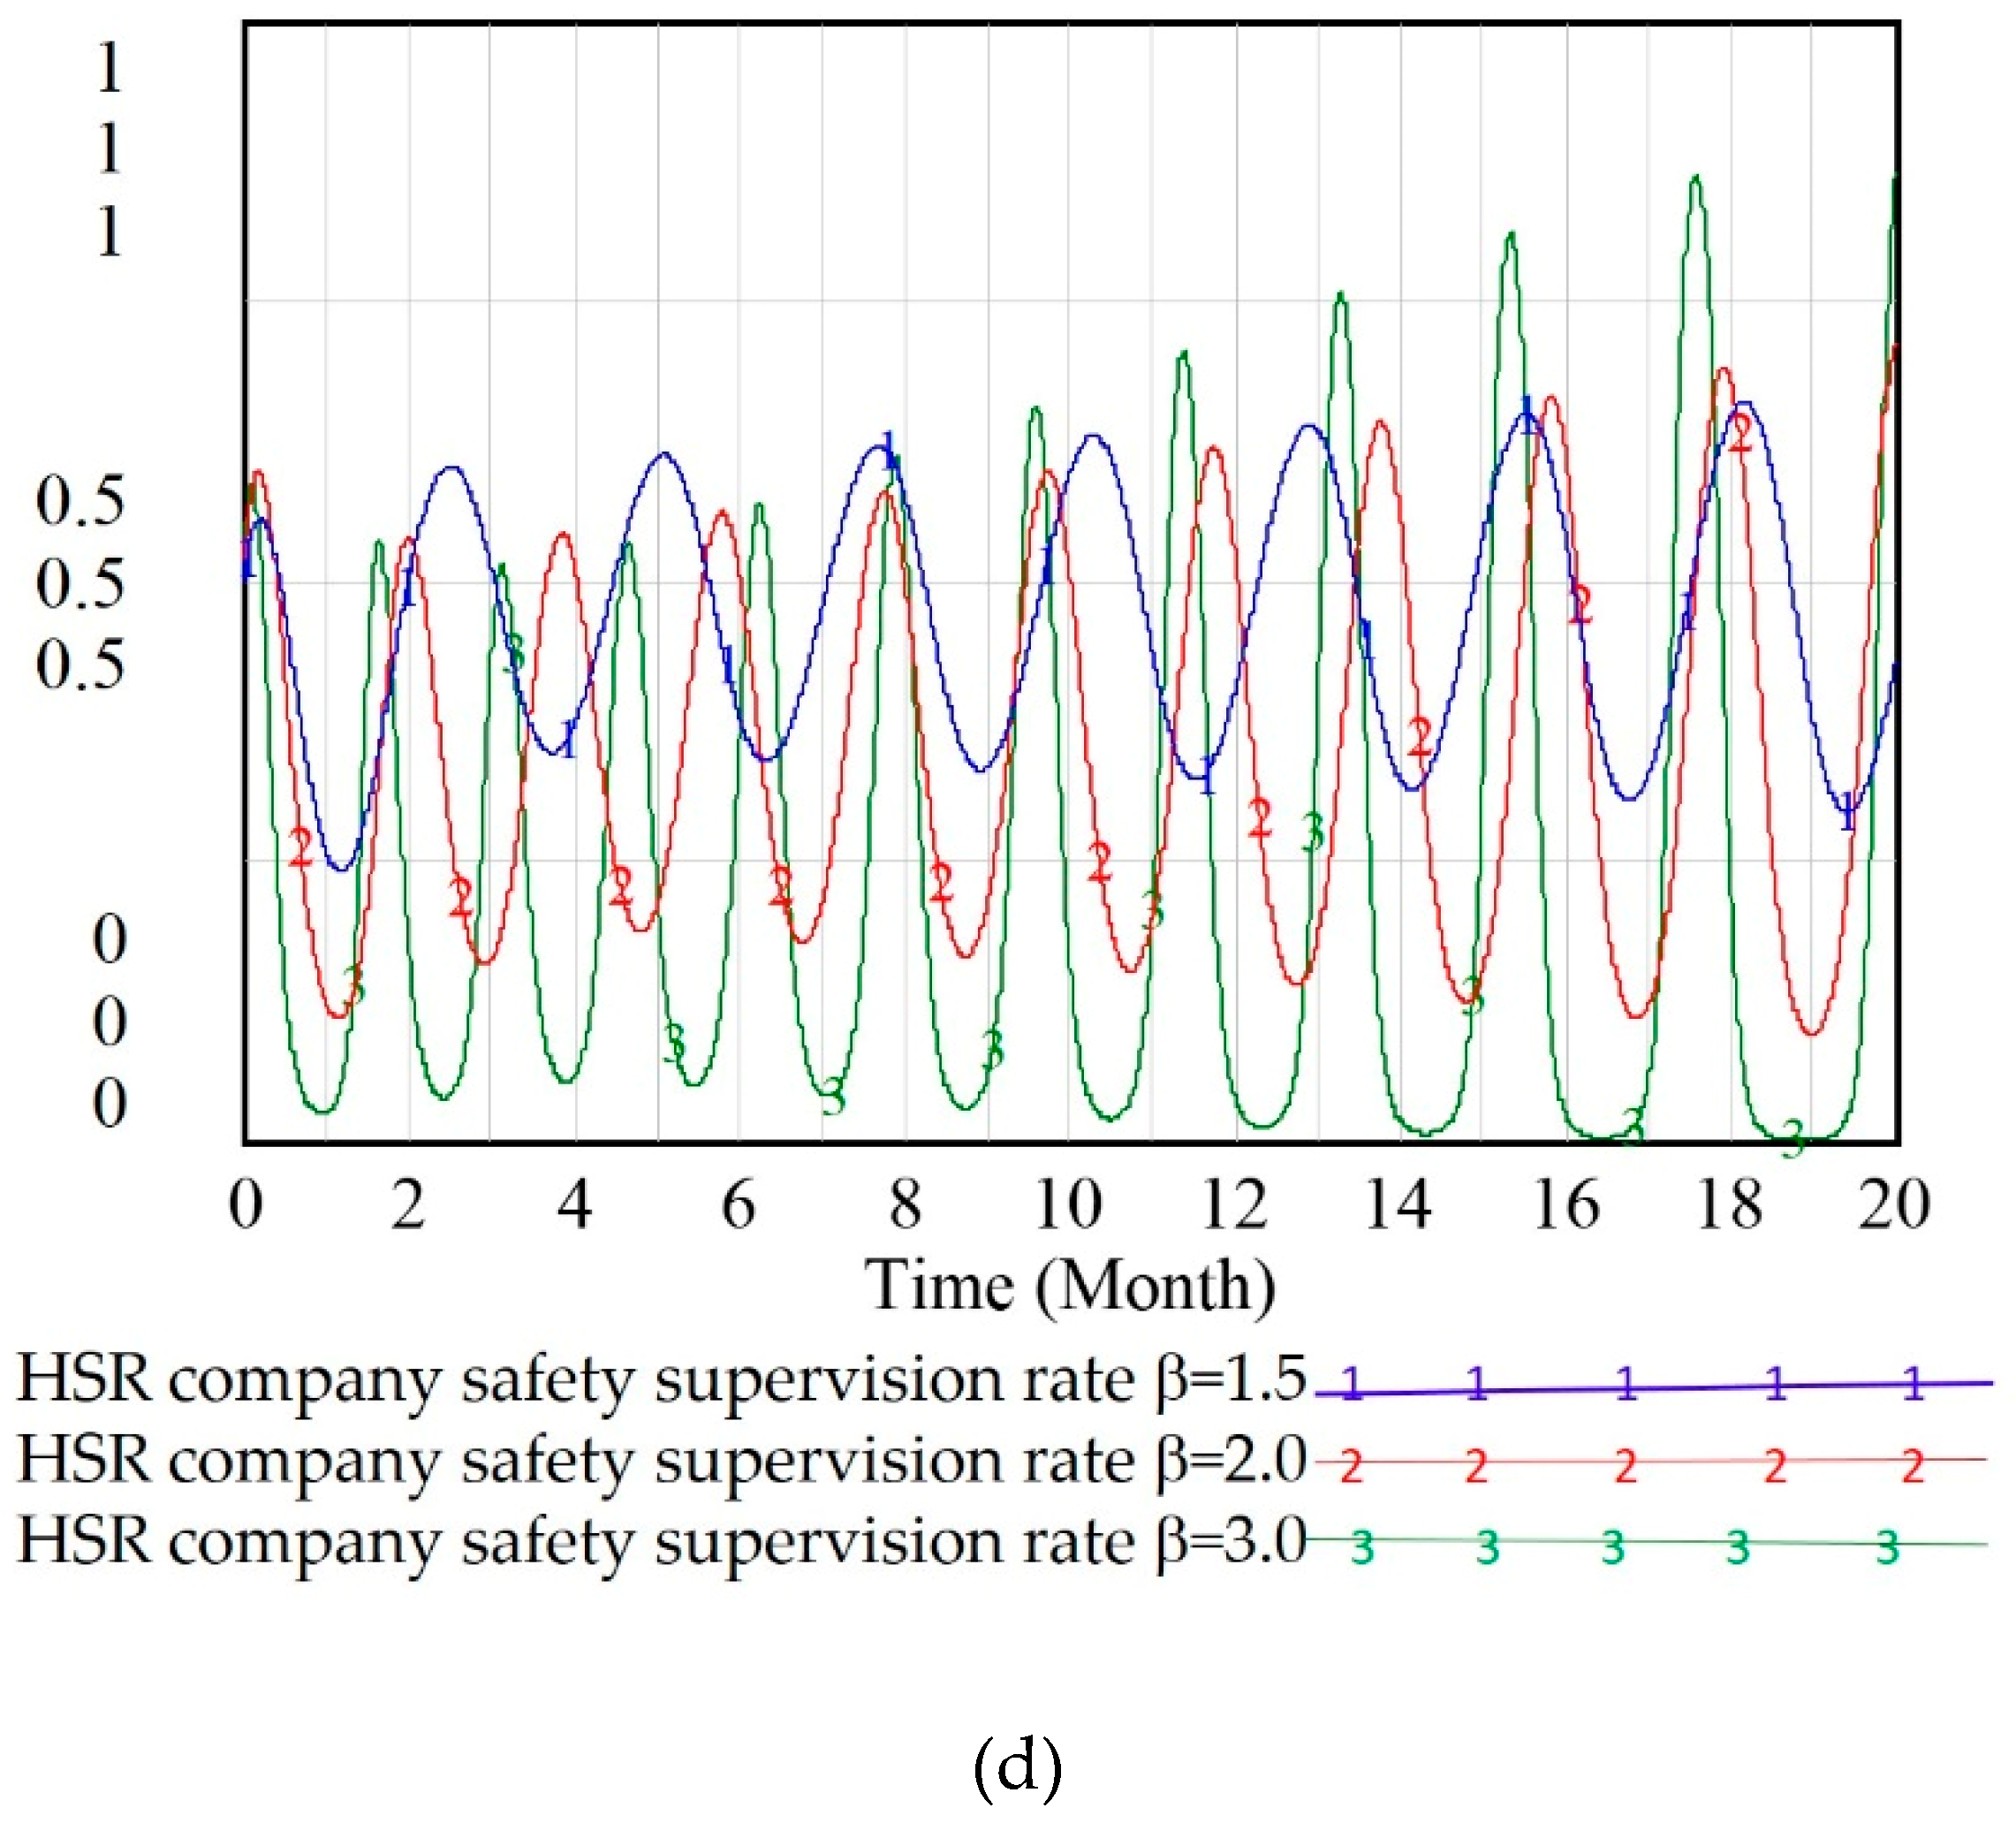
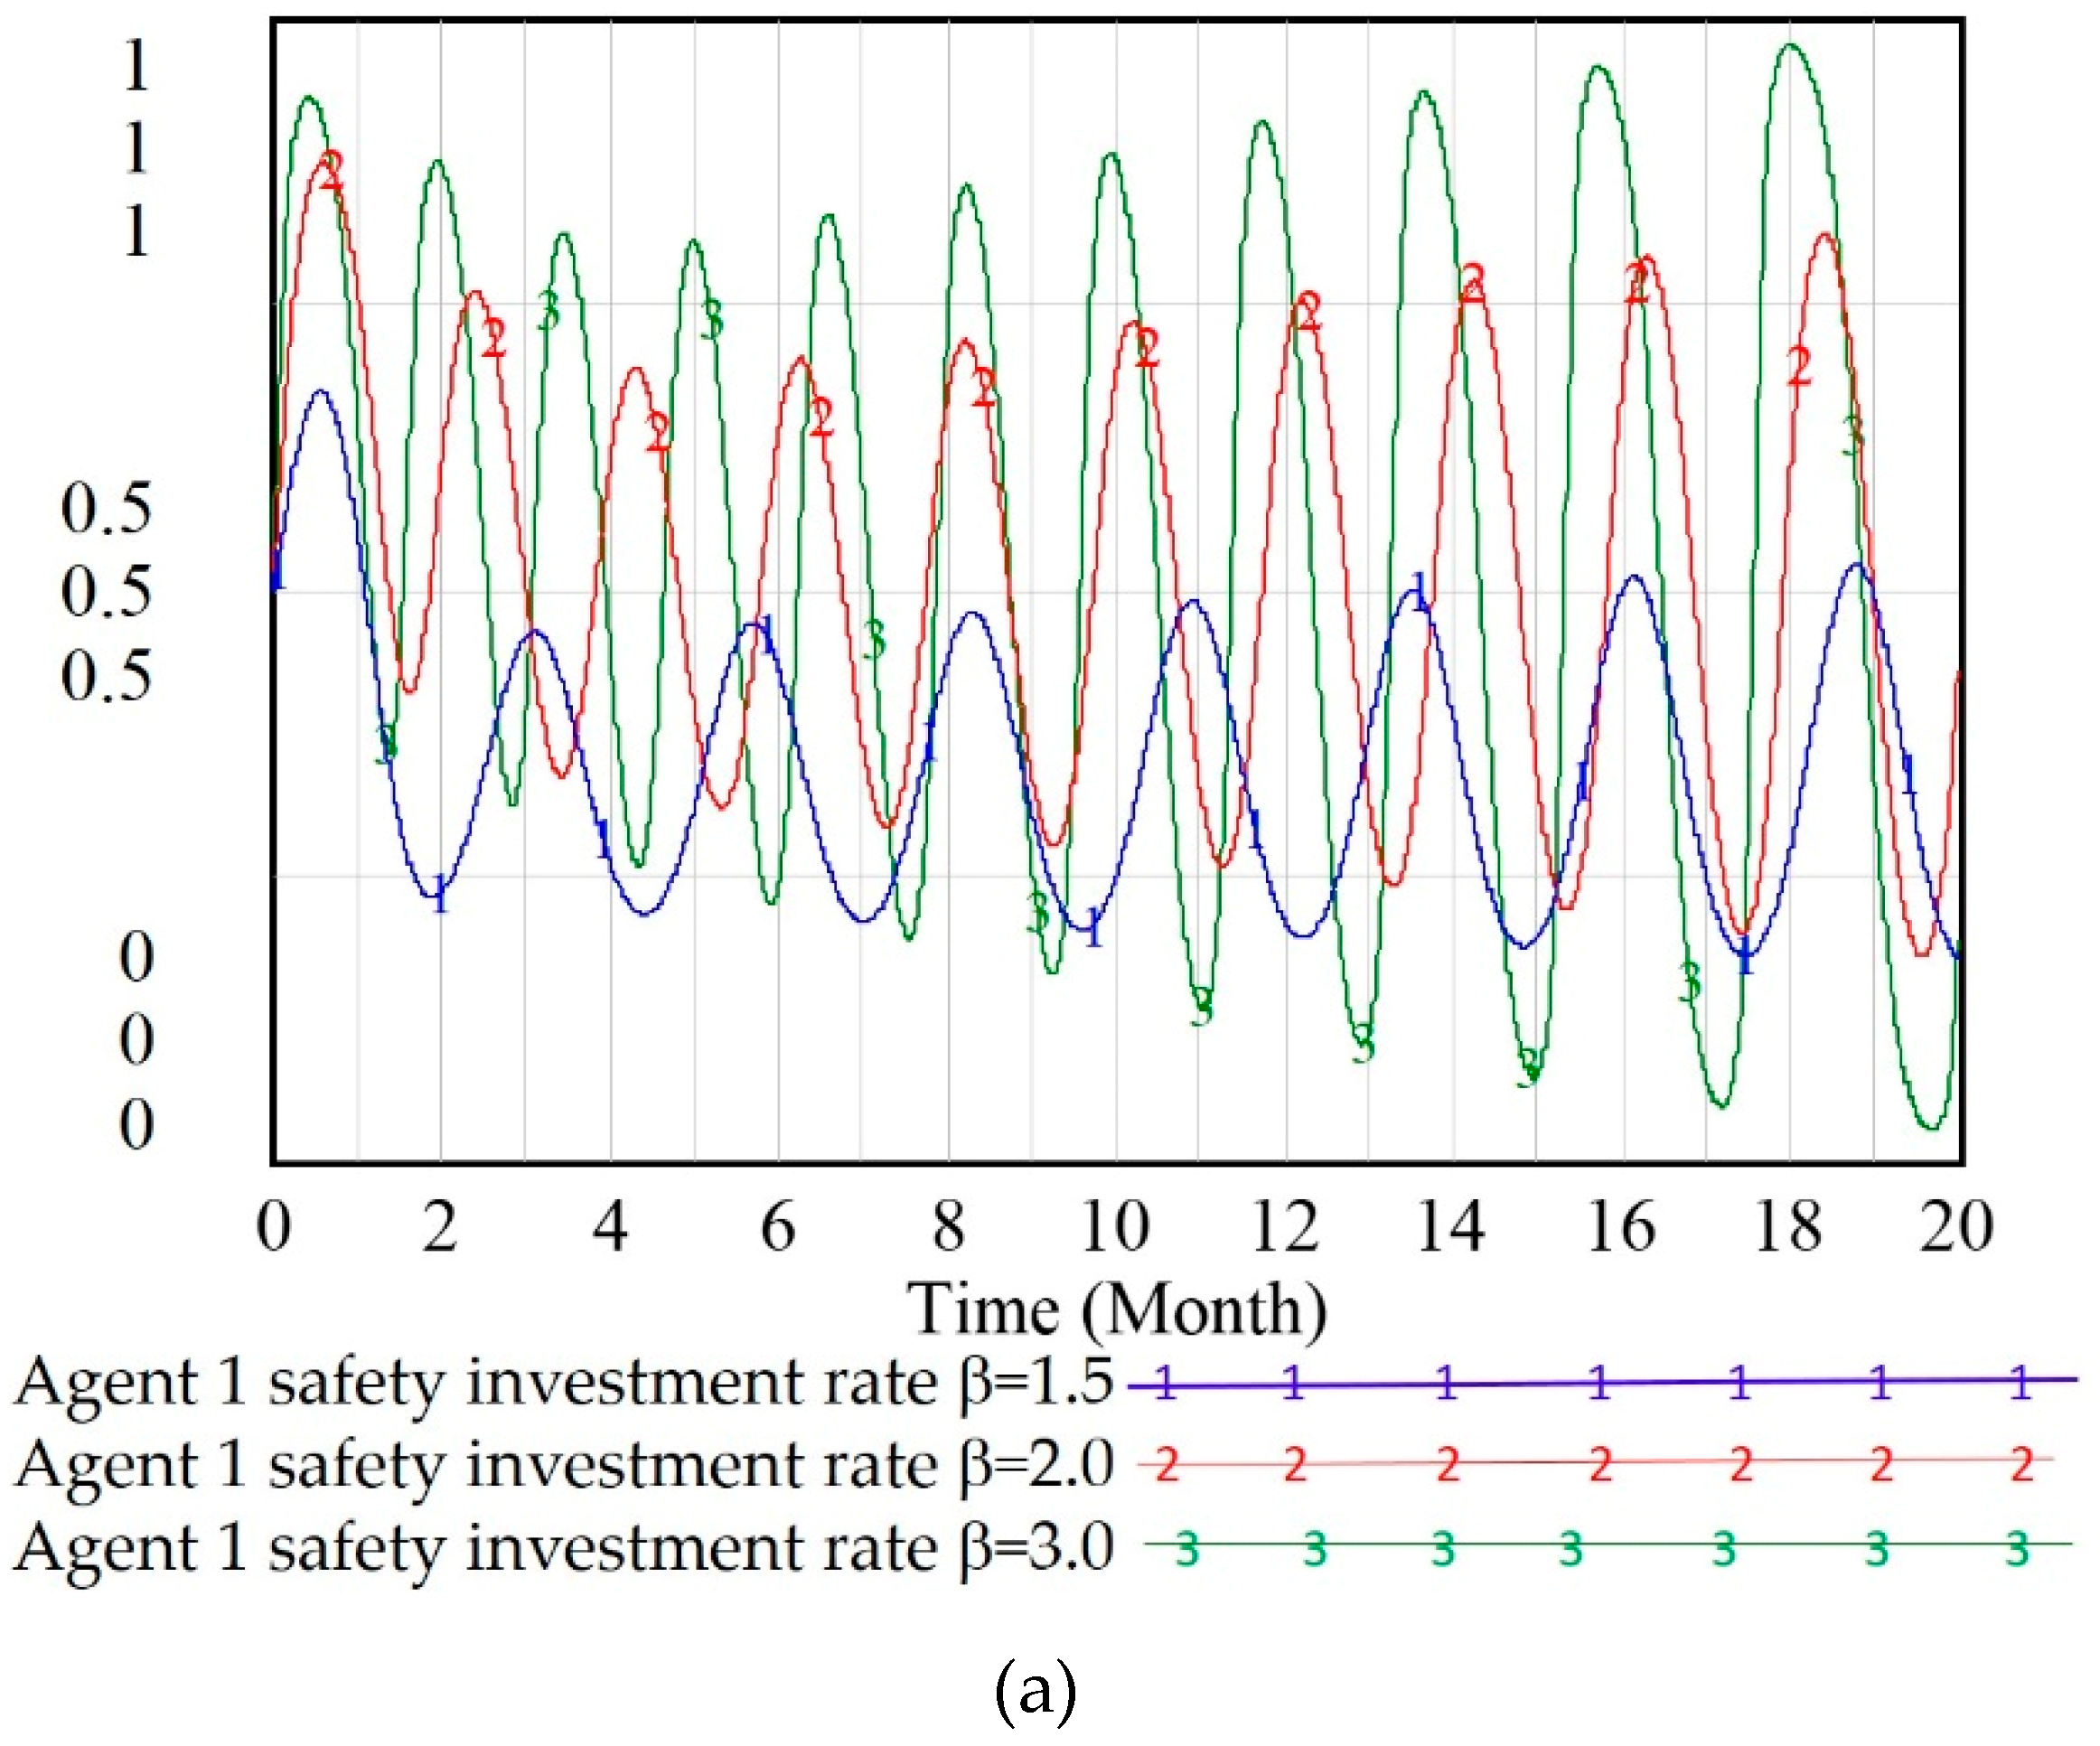
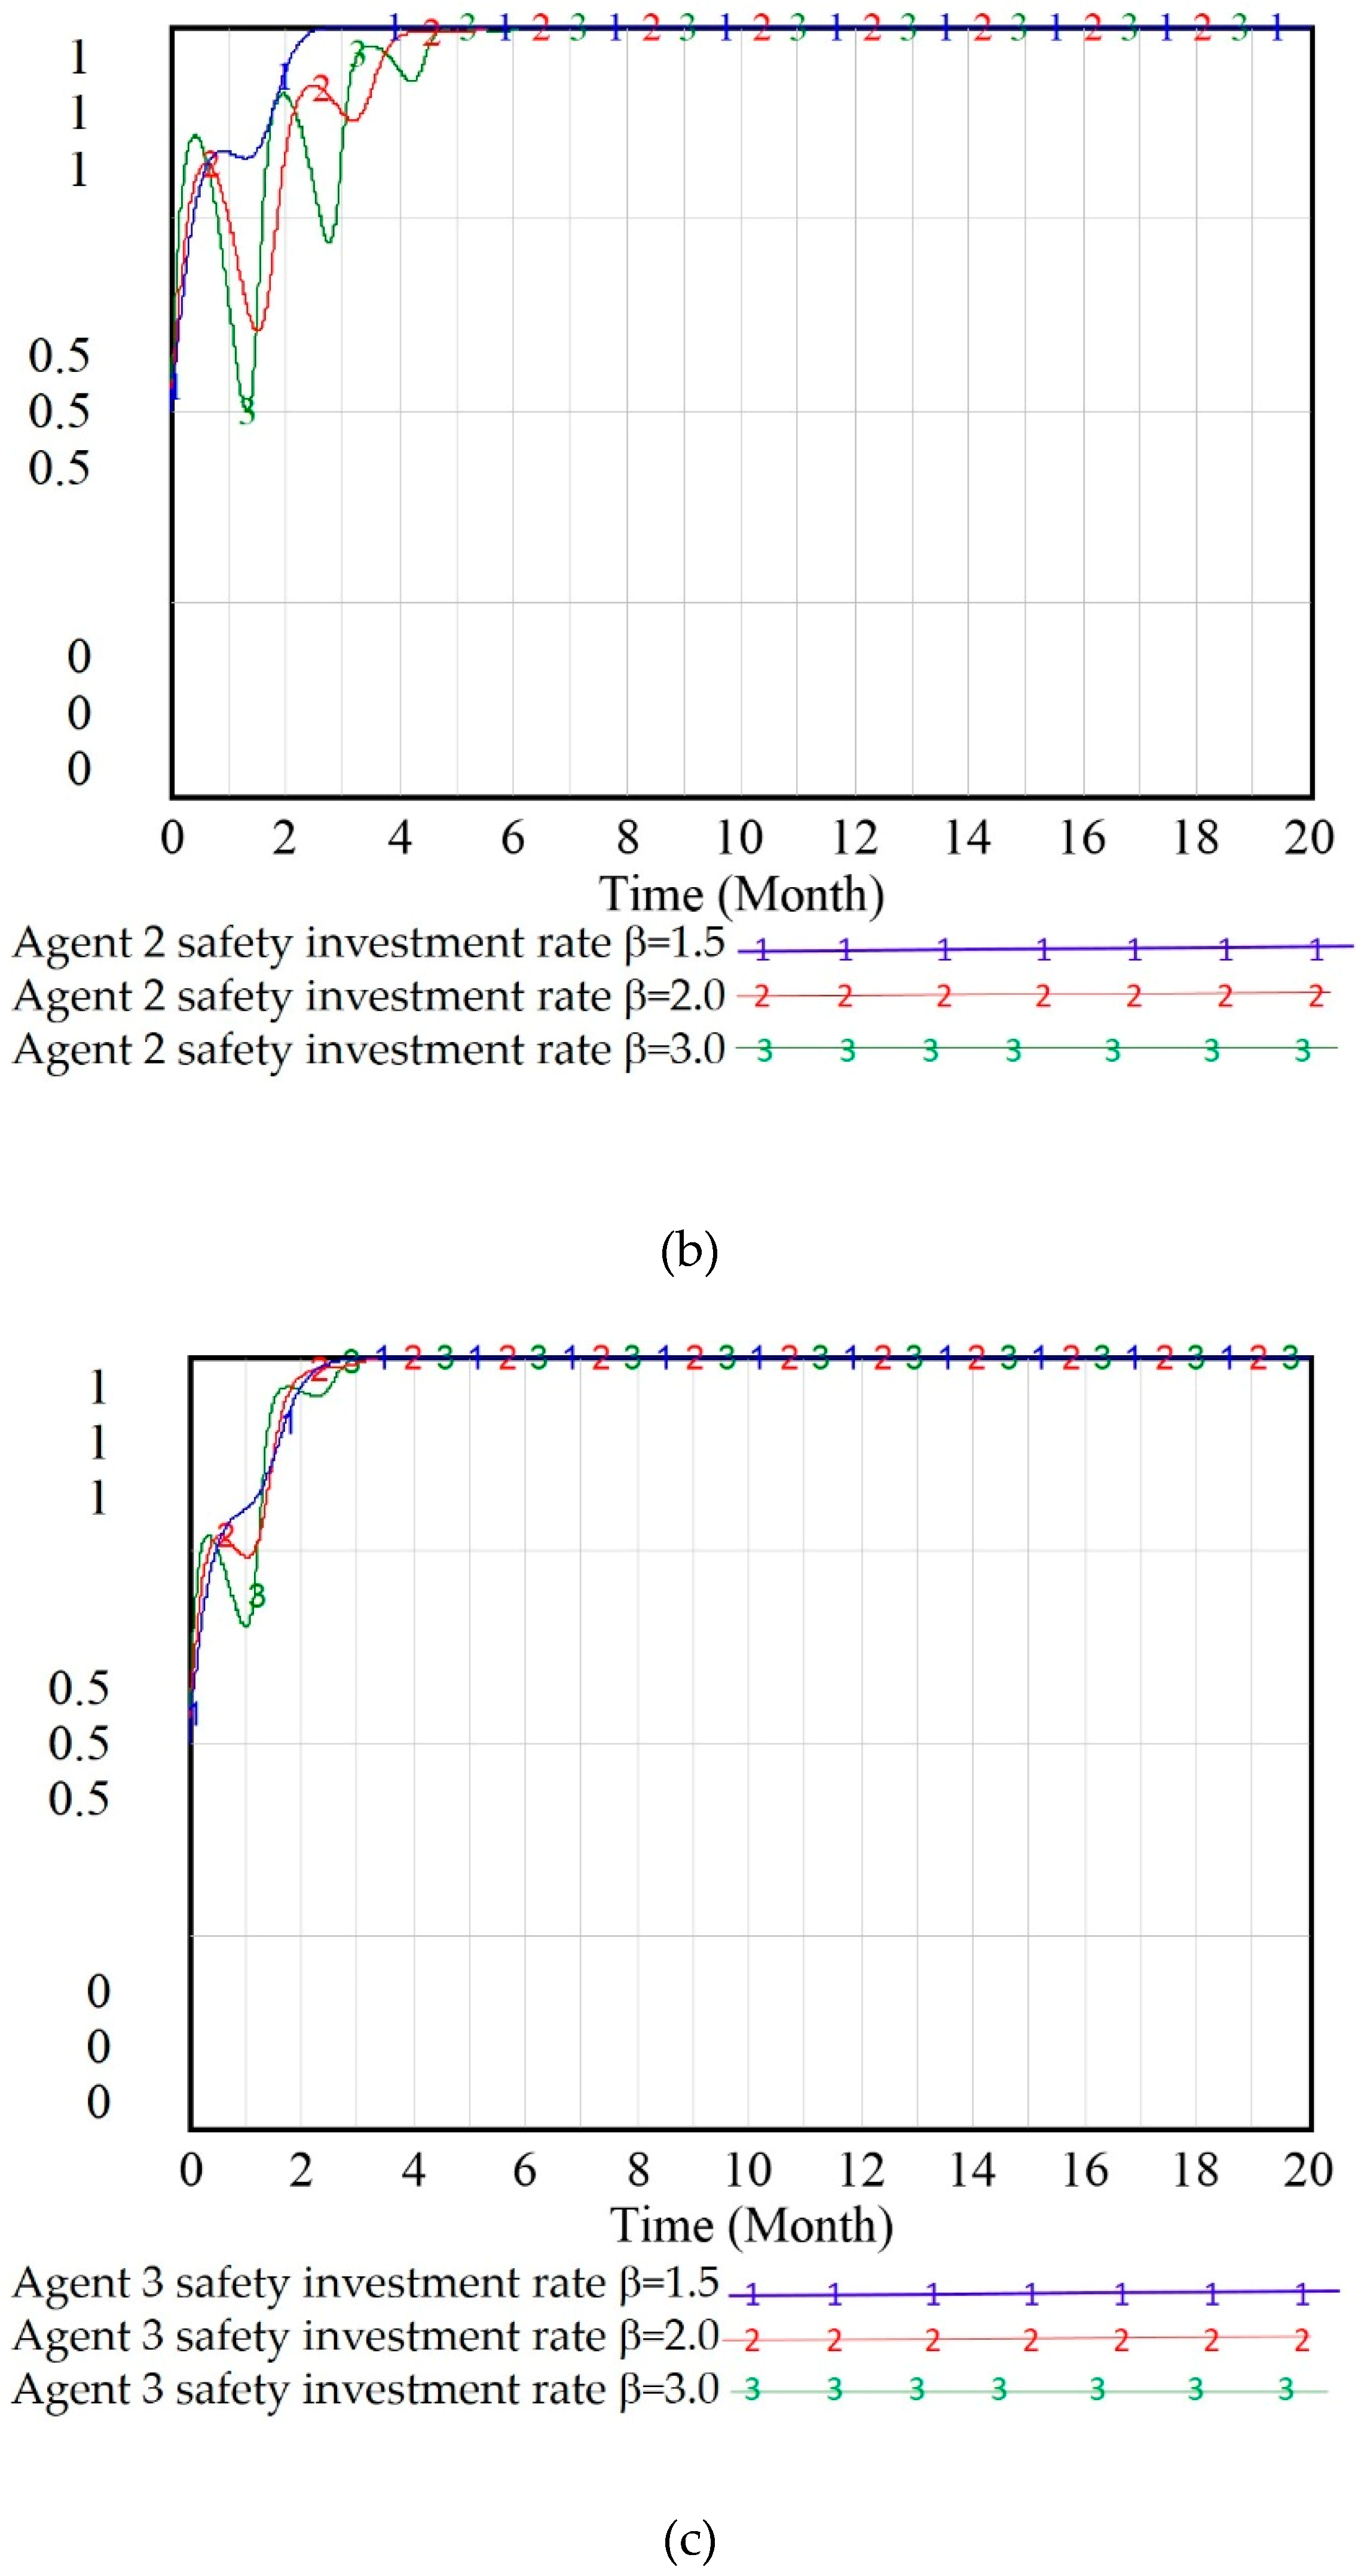
2.4. Stability Analysis of a Multiple–Agent Supervision System Based on SD

To analyze the behavior and the influence of different factors on the multiple agents supervision system more intuitively, the evolutionary game process of the system has been modeled using SD simulation, and the theoretical analysis results from the previous section have also been verified. The established evolutionary game model for the HSR operational safety supervision system with multiple agents using Vensim PLE 5.6a [47] is shown in Figure 1. The initial values of the relevant variables and the relationships between them can be obtained from Table 3 and Equations (1)–(10).
When the HSR company supervises three agents, the randomly selected initial strategies of the four stakeholders in the game are X = 0.5 , Y 1 = 0.5 , Y 2 = 0.5 , Y 3 = 0.5 , and the reward–penalty coefficient is β = 2 . The evolutionary game process of the four stakeholders of the system is shown in Figure 2. This figure shows that the strategy selection of all these four stakeholders fluctuates repeatedly in a static RPCS and the game results are difficult to predict. No ESS exists, which was consistent with the theoretical analysis results in Table 4. The safety supervision rate of the HSR company has shown a tendency to fluctuate upwards, and the amplitude increases. The safety investment rate of Agent 1 has fluctuated downward and the amplitude increases, while the safety investment rates of Agents 2 and 3 have gradually evolved to states Y 2 = 1 and Y 3 = 1 , respectively. This phenomenon is caused by the competing relationships among the HSR company’s three agents. When the strategy of Agent 1 gradually selects the neglecting of safety investment, the best strategy selection for the remaining two agents is to gradually make safety investments.
In a static RPCS, by changing the reward–penalty coefficient β to observe the impact of HSR company supervision on the strategy selection of the agents, the simulation results are as shown in Figure 3.
Figure 3a–d represent the evolutionary game process among three agents and the HSR company when the reward–penalty coefficient is β = 1.5 , β = 2 and β = 3 , respectively. From the above simulation results, it can be seen that with the increase in the coefficient, the amplitude and frequency of fluctuations in the supervision rate of the HSR company and the safety investment rate of Agent 1 have gradually increased. The strategy selection of the HSR company has shown a tendency to fluctuate upward, and Agent 1 has fluctuated downward, while Agents 2 and 3 evolved gradually toward the highest state ( Y 2 = Y 3 = 1 ) . This phenomenon can be explained as follows, in the process of HSR operational safety supervision, if an accident occurs, the HSR company will immediately apply stricter supervision and inspection measures to cope with emergencies, such as frequent supervision and inspection of the safety investments of these agents. Based on the results of this supervision, the HSR will then allocate rewards and penalties. All these measures were being taken to improve the safety investment rates of the three agents and to control the safety conditions of the HSR. Because the safety investment cost of Agents 2 and 3 are lower than those of Agent 1, they tend to make more safety investments in accordance with the agreement and rules. As the HSR company’s supervision and inspections have improved its operational safety and, at the same time, resulted in higher safety supervision costs, the standards for the implementation of supervision measures will be gradually reduced, and the supervision of these agents will be relaxed. Then, the safety investment rate of these agents will decline, which could lead to new accidents. Therefore, HSR operations will actually experience repeated fluctuations in the long–term game process.

3. Analysis of the Optimized HSR Operational Safety Supervision Evolutionary Game Model with Multiple Agents in a Dynamic RPCS

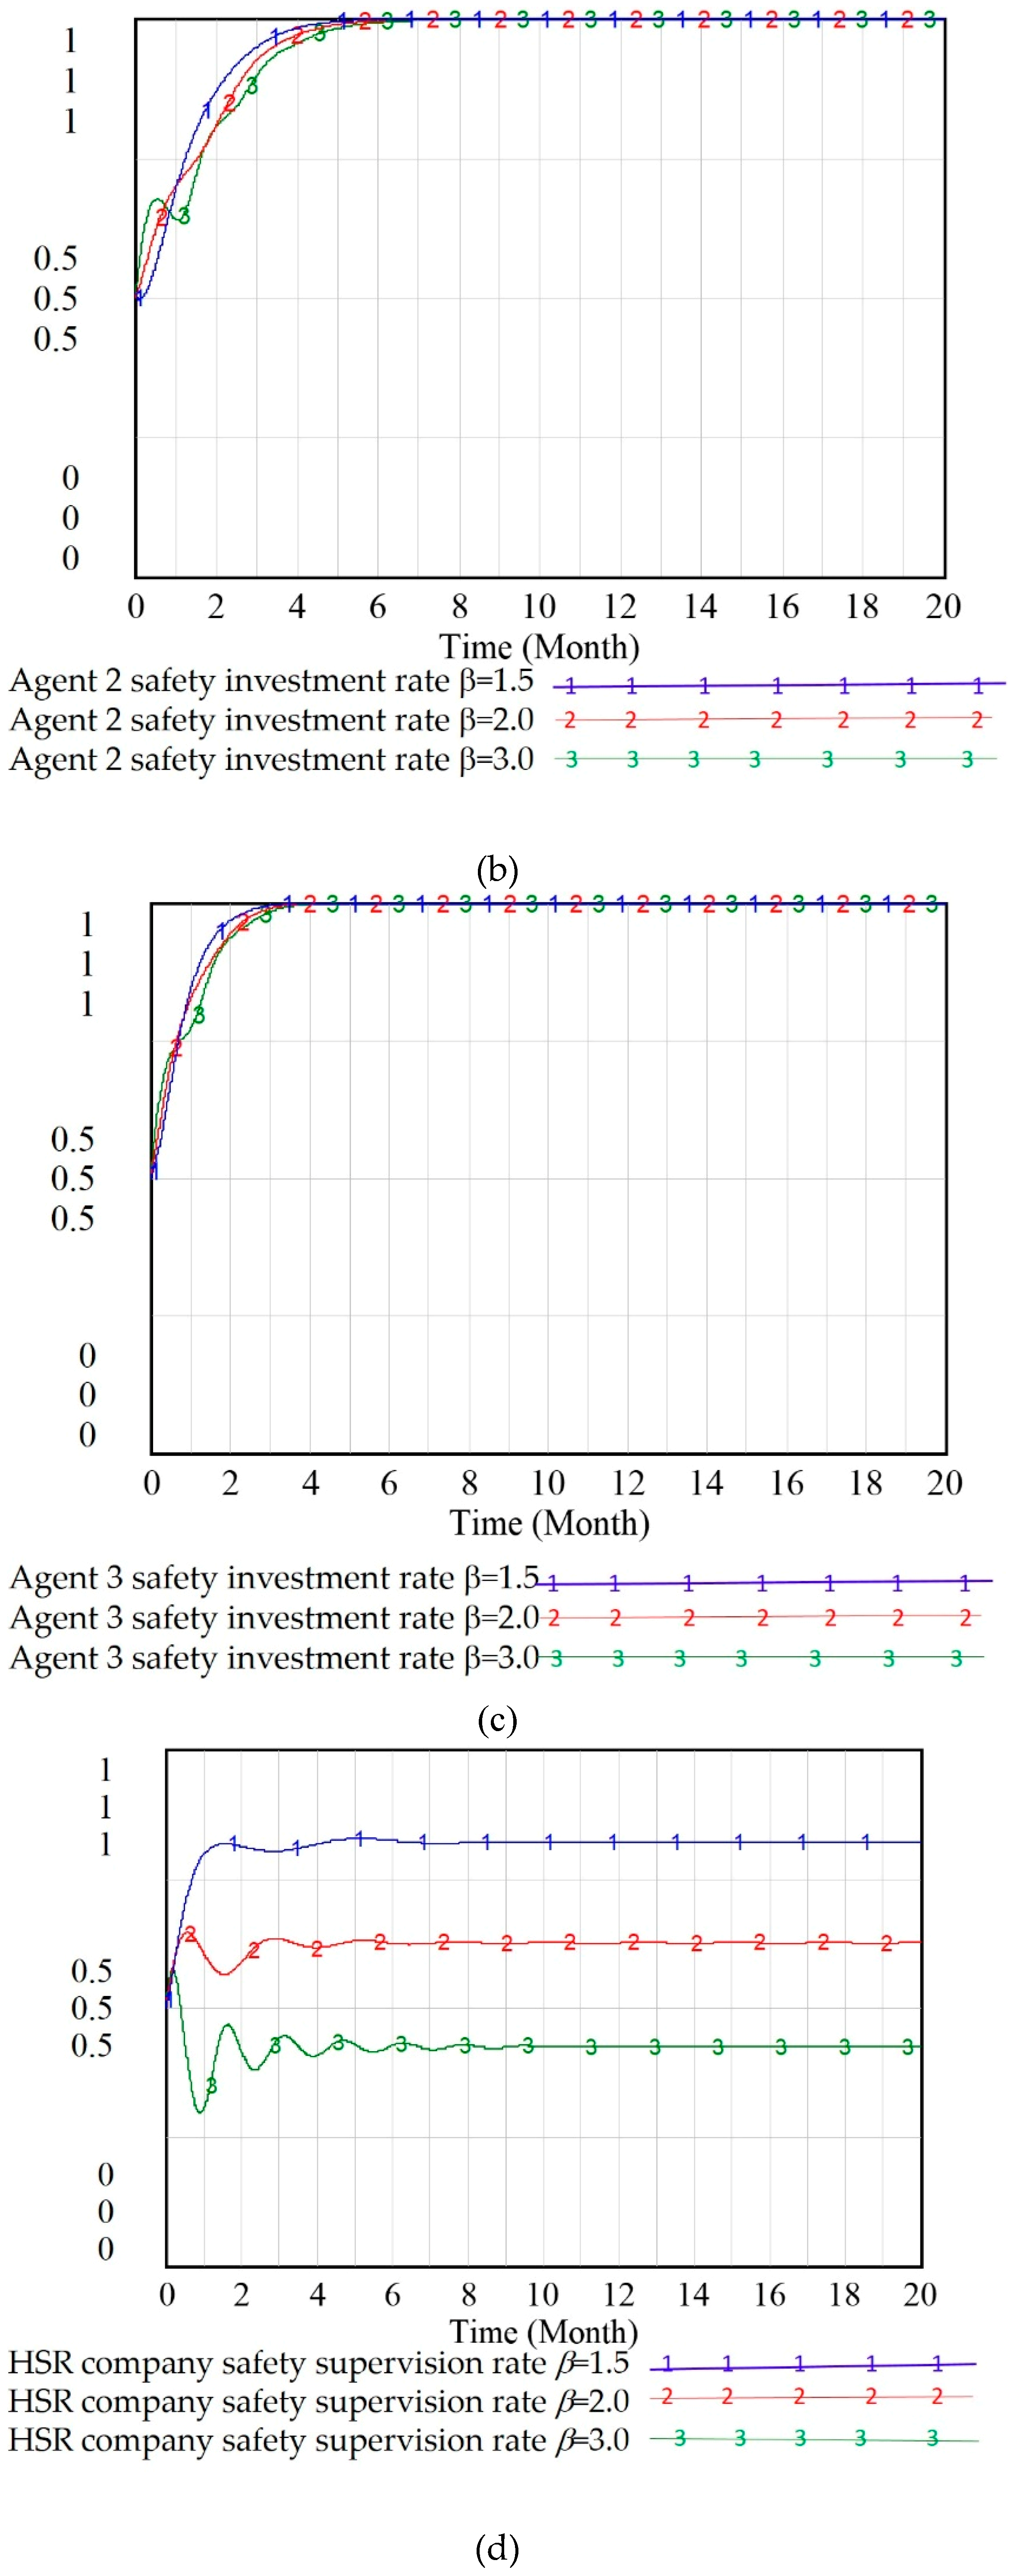
3.1. Results and Stability Analysis of an Optimized Multiple–Agent Supervision System

In a static RPCS, the fluctuations of the HSR multiple–agents safety supervision game process do not benefit the strategy selection of all the stakeholders. In studies to control fluctuations with a game process, the method of dynamic reward or penalty has been proposed in the literature [28,29,30,31]. This paper presents a new RPCS that combines these two methods and applies it to the HSR multiple–agents safety supervision system. In other words, based on the static RPCS, the HSR company links rewards and penalties to the safety investment rates (Yj) and the rate of violation of the agreed rules (1 − Yj) of the three agents. When considering the existence of three agents for the HSR company, the HSR operational safety supervision evolutionary game model in a dynamic RPCS is as follows. The penalties P j ( j = 1 , 2 , 3 ) and rewards B j ( j = 1 , 2 , 3 ) for the three agents are,
P j   = P j ( 1 Y j ) ( j = 1 , 2 , 3 )
B j = Y j B j ( j = 1 , 2 , 3 )
In Equations (12) and (13), P j and B j are the penalties and rewards in a static RPCS. Substituting these specific numerical values from Table 3 into Equations (9)–(12), the equilibrium solution, the corresponding characteristic values, and the steady state of each equilibrium solution of the evolutionary game system can be obtained, as shown in Table 5.
From Table 5, we can see that only the characteristic values of equilibrium solution E 21 have four negative real parts, which satisfies the stability condition of the Lyapunov stability theory, so equilibrium solution E 21 is the ESS in this model.

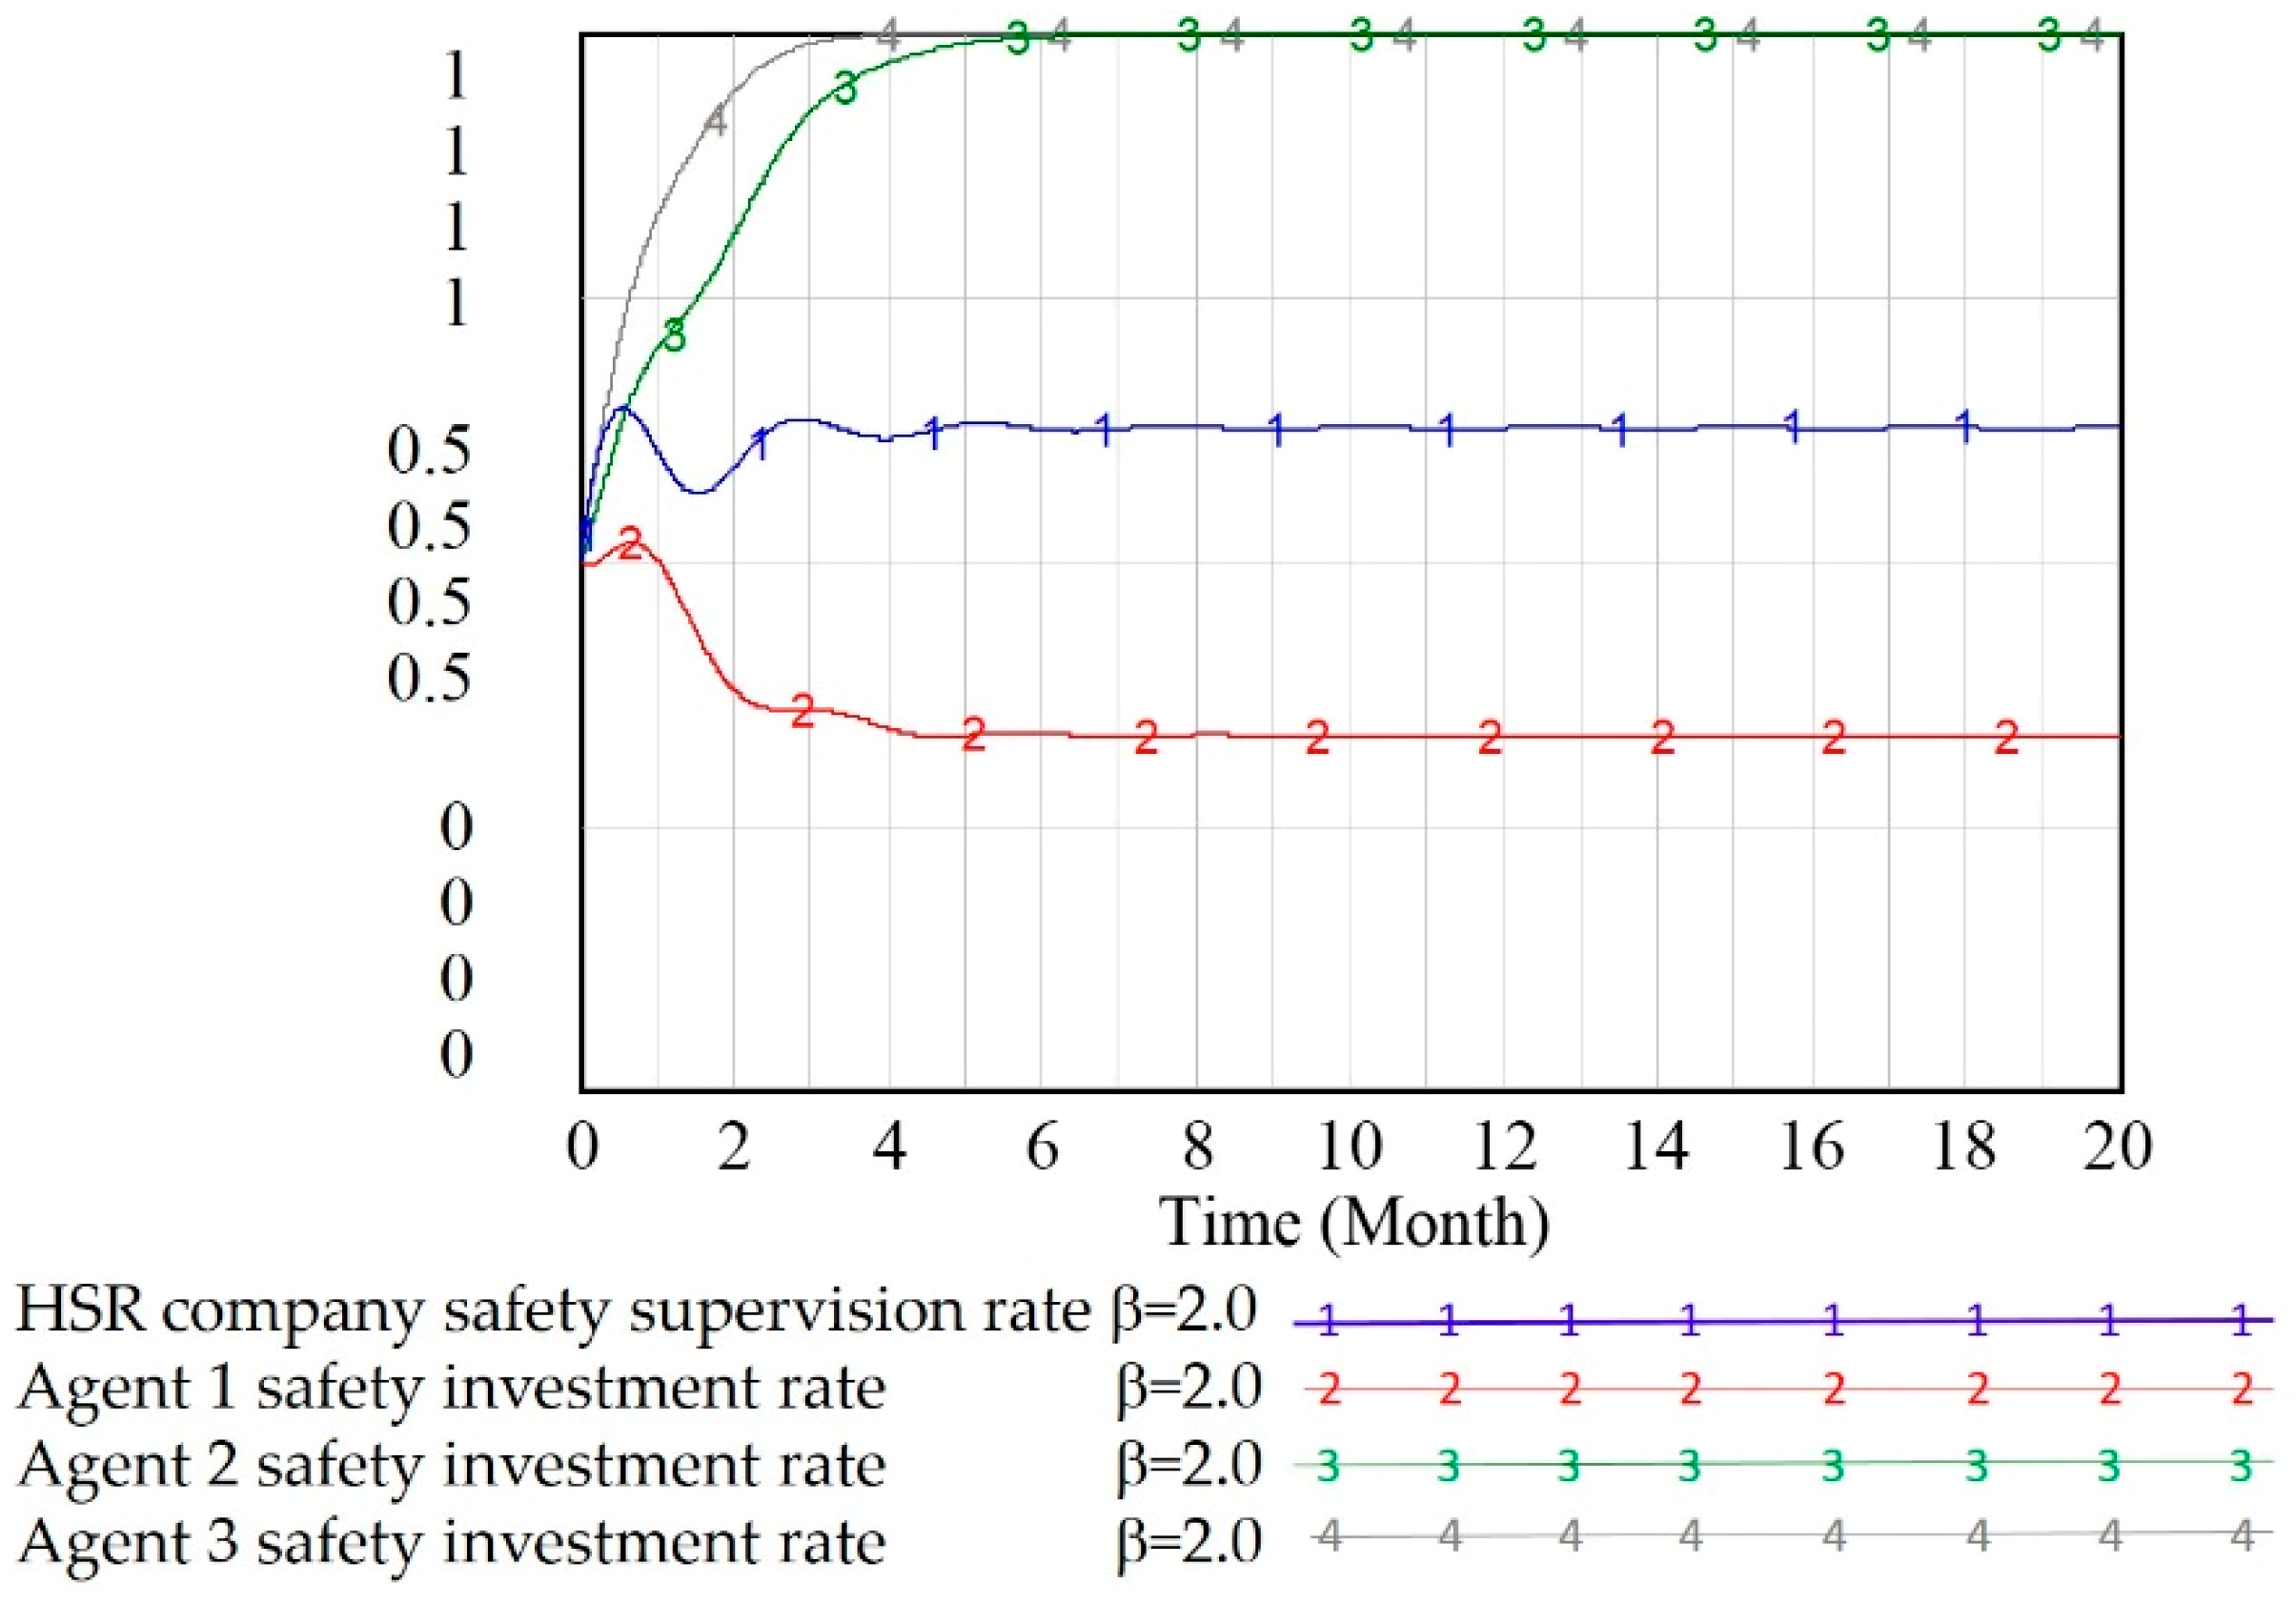
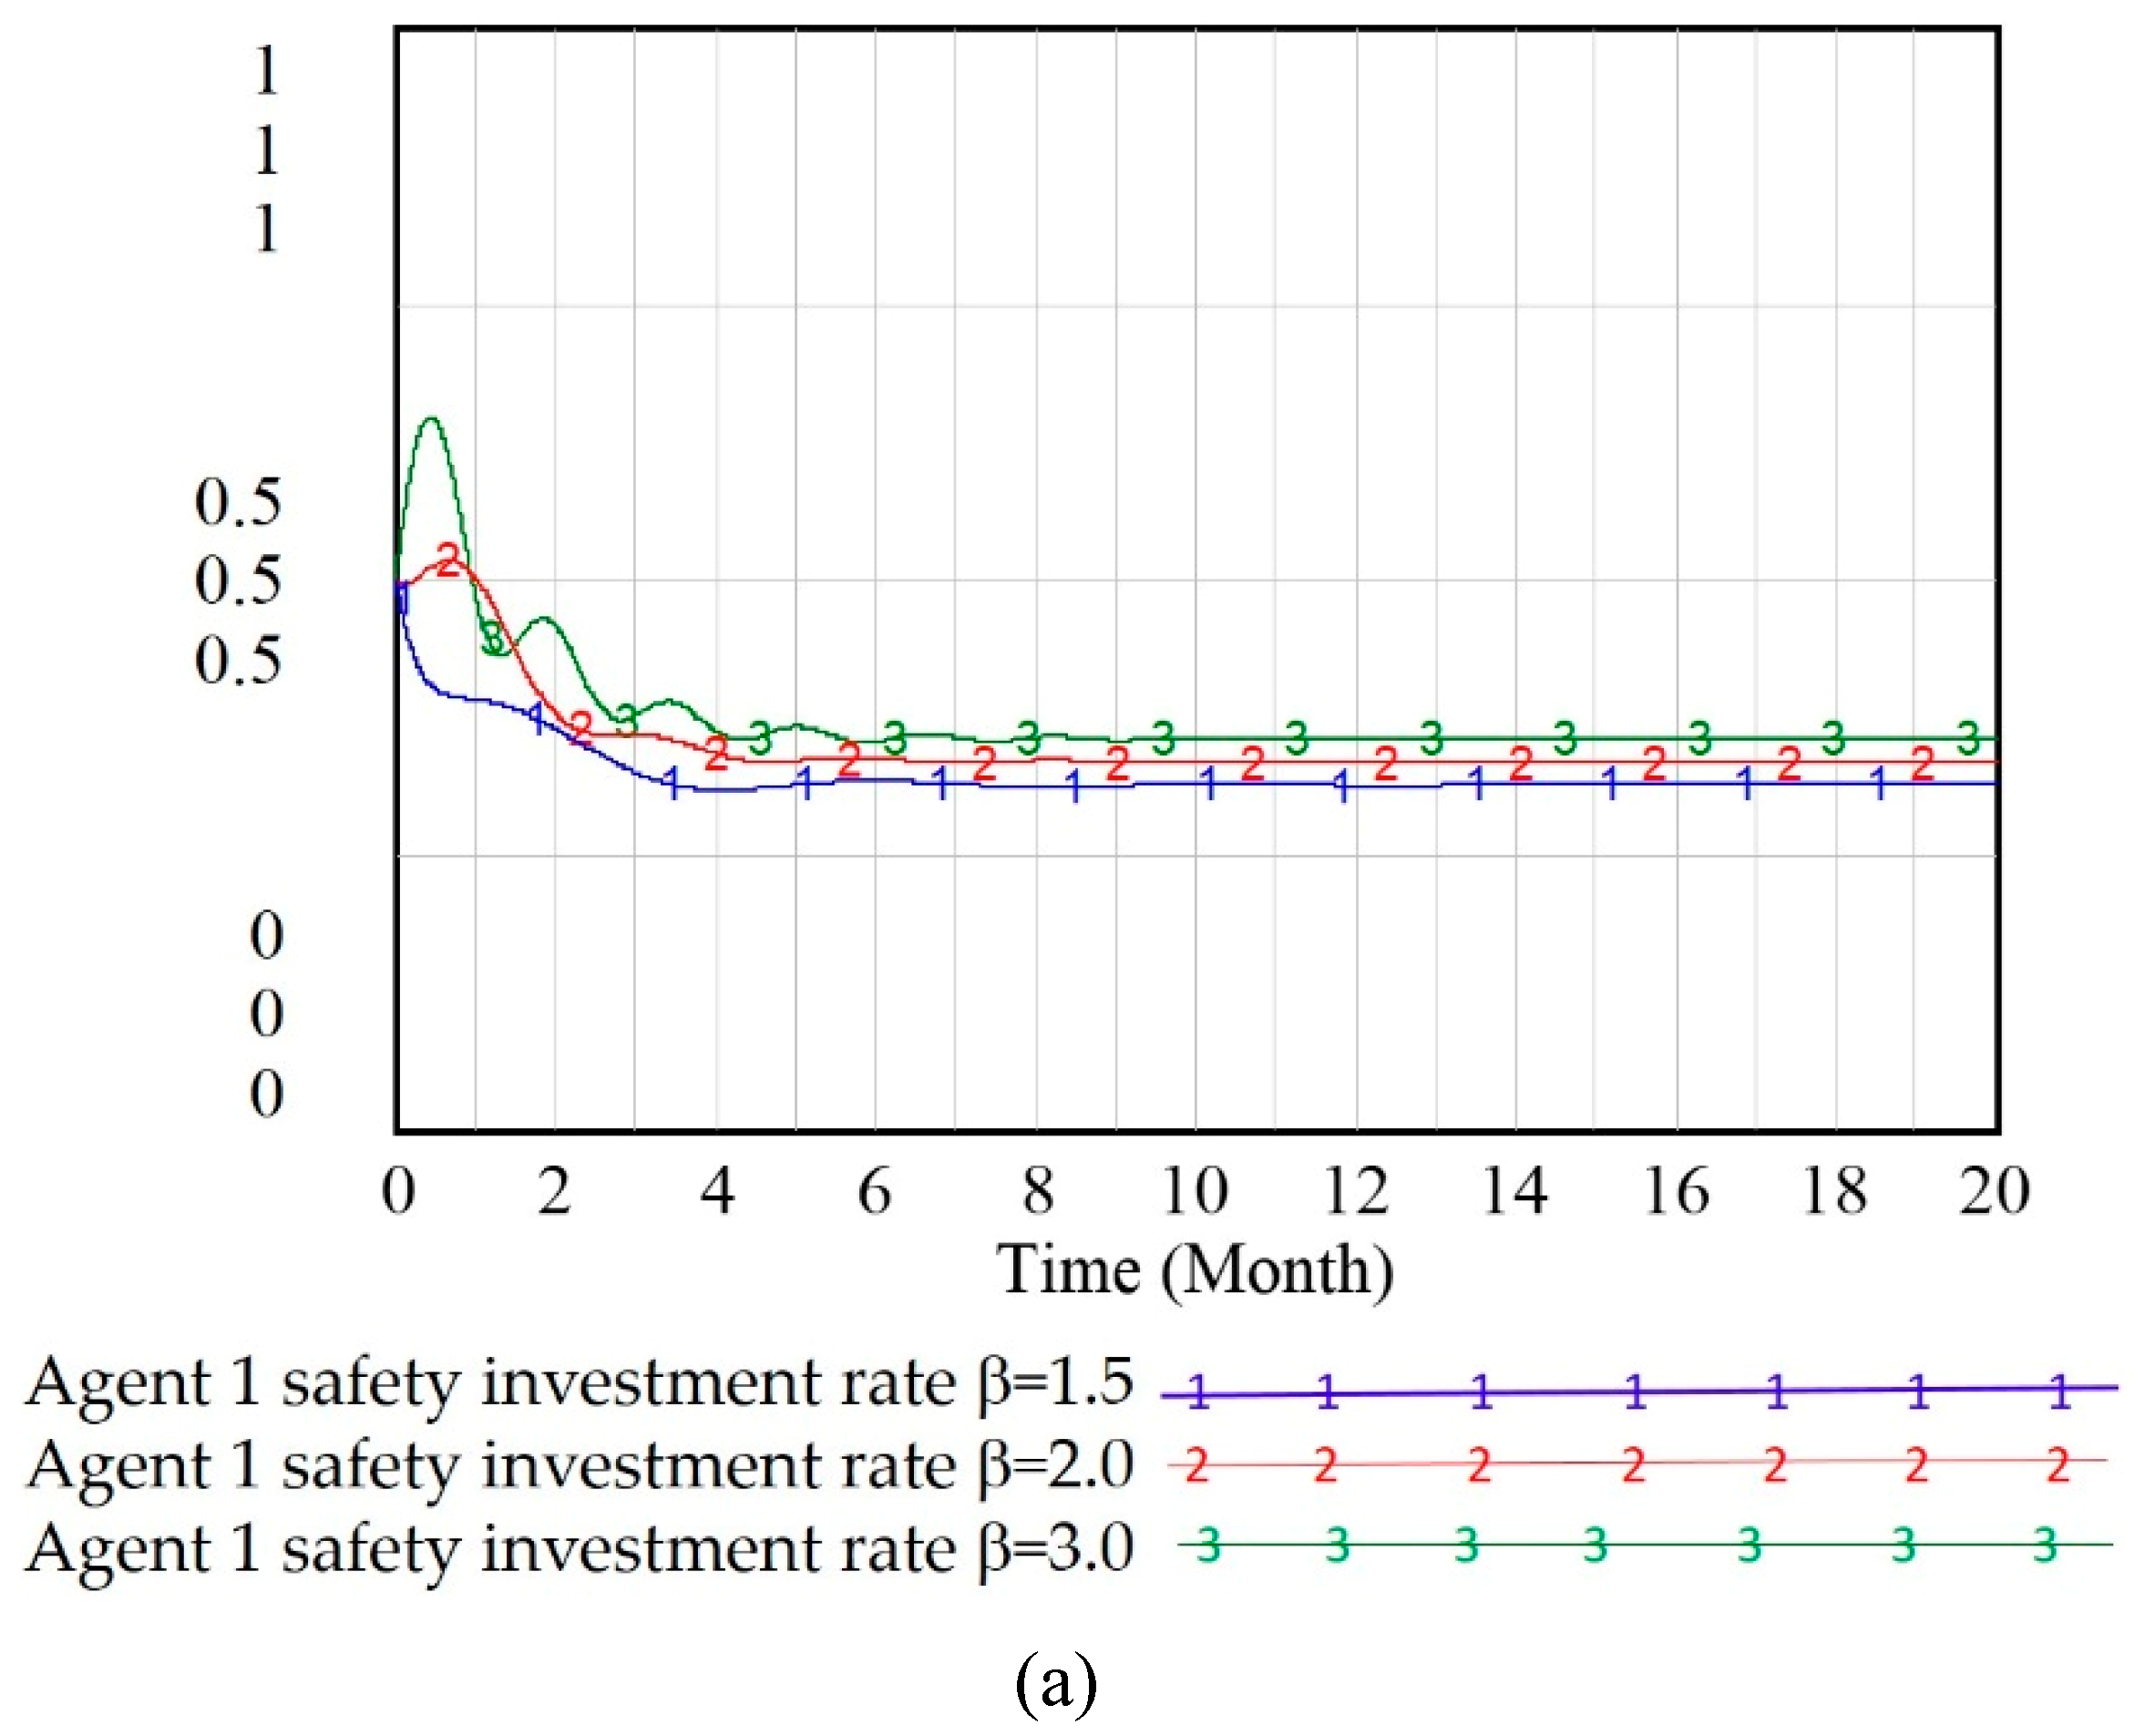
3.2. Stability Analysis of an Optimized Multiple–Agent Supervision System Based on SD

When the HSR company supervises three agents in a dynamic RPCS, the initial strategies of the four stakeholders of the game are X = 0.5 , Y 1 = 0.5 , Y 2 = 0.5 , Y 3 = 0.5 , and the reward–penalty coefficient is β = 2 . The evolutionary game processes of the four stakeholders of the system are shown in Figure 4. This figure shows that in a dynamic RPCS, the strategy fluctuations of all four stakeholders in the game process is effectively restrained, and their strategy selection has converged to the stable state in the short term. The evolutionary game process probably converges to E21′ = (0.6250, 0.3333, 1, 1), which indicates that the system has an ESS. Furthermore, the results of the theoretical analysis in Table 5 have also been verified.
Changing the reward–penalty coefficients β = 1.5 , β = 2 and β = 3 to observe the influence of HSR company supervision on the strategy selection of the three agents yields the simulation results in a dynamic RPCS shown in Figure 5.
From Figure 5, it can be seen that with the increase in the coefficient β , the value of the safety supervision rate of the HSR company in a stable state will decrease, the safety investment rate of Agent 1 will increase, and the upward trend of the safety investment rates of Agents 2 and 3 will be slowed. A comparative analysis of Figure 4 and Figure 5 shows that when the reward–penalty coefficient is the same, the mean value of fluctuations in the safety supervision rates of the HSR company in a static RPCS is lower than in a dynamic RPCS, and the mean value of the safety investment rates of the three agents in a static RPCS is higher than in a dynamic RPCS. Therefore, when multiple agents exist in the system, the use of a dynamic RPCS can effectively reduce the fluctuations of the game process while reducing the safety investment rate of the three agents.
From the above simulation results, it can be seen that although there are fluctuations in the game process in a static RPCS, it can effectively increase the safety investment rate of the three agents in a short period of time, which is conducive to the improvement of the operational safety level and the reduction of risks for the HSR. The fluctuations have been rapidly constrained in a dynamic RPCS so that the risks caused by uncertain factors are reduced. When the HSR company make strategic selections and develops policies, they should combine static and dynamic RPCSs according to their main objectives during different periods so that the safety level of HSR operations with multiple agents can be controlled in a stable manner, thus reducing the occurrence of safety accidents.

4. Conclusions

Because the HSR company has multiple agents in its operational safety supervision system in China, the evolutionary game process is more complicated. Based on the HSR ETMM, a model for a supervision evolutionary game among the HSR company and its three agents has been established. The theoretical analysis combined with SD simulations enabled the analysis of the strategy selection of all the stakeholders that are influenced by different RPCSs and coefficients under conditions of bounded rationality. The main conclusions of this study include the following,
(1) In a static RPCS, the game process of the four stakeholders fluctuates. No ESS exists. A reasonable determination of the reward–penalty coefficient will have a direct impact on the strategy selection of these stakeholders. When the coefficient value is small, income from illegal operations (the safety investment cost) of Agent 1 is higher than the possible penalty, so the supervision and inspection results for Agent 1 do not work well. The safety investment rate of Agent 1 is low, and it can potentially lead to an increase in risk. However, through the increase in the coefficient value, the amplitude and frequency of fluctuations of the game process in the system are increased, causing uncertainty in the outcome of the game and making the actual problem more difficult to control.
(2) In a dynamic RPCS, the fluctuations of the game process are effectively constrained and there is an ESS in the game process. The results indicate that the desired control goal of the supervision and inspection rate of the HSR company and the safety investment rates of the three agents can be achieved quickly. However, with the same reward–penalty coefficient, the static RPCS is more effective than the dynamic RPCS for the improvement of the safety investment rate.
(3) In both the dynamic and static RPCS, if the three agents have illegal behavior and neglect safety investment at the same time, the penalty for them is far more than their own safety investment cost. Because the safety investment cost for Agent 3 is the lowest among the three agents, its safety investment rate can reach the highest level faster than Agent 2, indicating that an agent with a relatively low safety investment cost is more inclined to make safety investments.

Author Contributions

Conceptualization, K.L. and J.G.; Investigation, W.W. and T.Z.; Methodology, K.L. and J.G.; Software, K.L. and Y.Z.; Supervision, Y.Z. and T.Z.; Writing—original draft, K.L. and W.W.; Writing—review & editing, K.L. and Y.Z.

Funding

This research was funded by the National Natural Science Foundation of China, grant number 61703349; the Fundamental Research Funds for the Central Universities, grant number 2682017CX101, 2682017ZDPY10; and the Key Research Projects of the China Railway Corporation, grant number 2017X007–D.

Acknowledgments

Authors express great thank to the financial support from National Natural Science Foundation of China.

Conflicts of Interest

The authors declare that they have no conflicts of interest.

References

  1. He, B.J.; Zhao, D.X.; Zhu, J. Promoting and implementing urban sustainability in China–An integration of sustainable initiatives at different urban scales. Habitat Intern. 2018, 82, 83–93. [Google Scholar] [CrossRef]
  2. Zhang, P.; Qin, G.; Wang, Y. Optimal Maintenance Decision Method for Urban Gas Pipelines Based on as Low as Reasonably Practicable Principle. Sustainability 2018, 11, 153. [Google Scholar] [CrossRef]
  3. de Rus, G.; Nombela, G. Is investment in high speed rail socially profitable? JTEP 2007, 41, 3–23. [Google Scholar]
  4. Bi, M.; He, S. Express delivery with high–speed railway, Definitely feasible or just a publicity stunt. Trans. Res. Part A 2019, 120, 165–187. [Google Scholar] [CrossRef]
  5. Chai, J. Analysis on shock effect of China’s high–speed railway on aviation transport. Trans. Res. Part A 2018, 108, 35–44. [Google Scholar] [CrossRef]
  6. Bazin, S. High speed railway, service innovations and urban and business tourisms development. Econ. Manag. Tour. 2011, 1, 115–141. [Google Scholar]
  7. Martínez–Rodrigo, M.D. Dynamic performance of existing high–speed railway bridges under resonant conditions retrofitted with fluid viscous dampers. Eng. Struct. 2010, 32, 808–828. [Google Scholar]
  8. Sun, Z. Technology innovation and entrepreneurial state, the development of China’s high–speed rail industry. Technol. Anal. Strateg. Manag. 2015, 27, 646–659. [Google Scholar] [CrossRef]
  9. Yin, M. The effects of the high–speed railway on urban development, International experience and potential implications for China. Prog. Plan. 2015, 98, 1–52. [Google Scholar] [CrossRef]
  10. Chester, M. Life–cycle assessment of high–speed rail, the case of California. Environ. Res. Lett. 2010, 5, 014003. [Google Scholar] [CrossRef]
  11. Marincioni, F.; Appiotti, F. The Lyon–Turin High–Speed Rail, The Public Debate and Perception of Environmental Risk in Susa Valley, Italy. Environ. Manag. 2009, 43, 863–875. [Google Scholar] [CrossRef] [PubMed]
  12. Albalate, D.; Fageda, X. High speed rail and tourism, Empirical evidence from Spain. Transport. Res. Part A 2016, 85, 174–185. [Google Scholar] [CrossRef]
  13. Givoni, M.; Banister, D. Speed, the less important element of the High–Speed Train. J. Trans. Geogr. 2012, 22, 306–307. [Google Scholar] [CrossRef]
  14. State Investigation Team of the China–Yongwen Railway Accident. The Investigation Report on the 7.23 Yongwen Line Major Railway Accident. Available online: https://wenku.baidu.com/view/cf406b601ed9ad51f01df278.html (accessed on 10 February 2019).
  15. Dong, A. Application of CAST and STPA to Railroad Safety in China. Massachusetts Institute of Technology. 2012. Available online: http://citeseerx.ist.psu.edu/viewdoc/download;jsessionid=F6766C6A6C4263DD67F74BDDA2C1E94C?doi=10.1.1.300.9065&rep=rep1&type=pdf (accessed on 10 February 2019).
  16. Fan, Y.; Li, Z. Applying systems thinking approach to accident analysis in China, Case study of “7.23” Yong–Tai–Wen High–Speed train accident. Saf. Sci. 2015, 76, 190–201. [Google Scholar] [CrossRef]
  17. Liu, P.; Yang, L. Fault tree analysis combined with quantitative analysis for high–speed railway accidents. Saf. Sci. 2015, 79, 344–357. [Google Scholar] [CrossRef]
  18. Wang, D. Study on the Management Mode of Entrusted Operation on High–speed Railways. Railw. Trans. Econ. 2014, 36, 12–14, 41. [Google Scholar]
  19. China Railway Corporation. Guiding Opinions on Commissioning Transportation Management by New Joint–Venture Railway. Available online: http://ishare.iask.sina.com.cn/f/24751958.html (accessed on 10 February 2019).
  20. Lazonick, W. Business Organization and the Myth of the Market Economy; Cambridge University Press: Cambridge, UK, 1993. [Google Scholar]
  21. Durlauf, S.N. The New Palgrave, Dictionary of Economics. New Palgravediction. Econ. 2008, 6, 1–40. [Google Scholar]
  22. Marzband, M. Non–cooperative game theory based energy management systems for energy district in the retail market considering DER uncertainties. IET Gener. Trans. Distrib. 2016, 10, 2999–3009. [Google Scholar] [CrossRef]
  23. Myerson, R.B. Game Theory; Harvard University Press: Cambridge, MA, USA, 2013. [Google Scholar]
  24. Weibull, J.W. Evolutionary Game Theory; MIT Press: Cambridge, MA, USA, 1997. [Google Scholar]
  25. Ji, P. Developing green purchasing relationships for the manufacturing industry–An evolutionary game theory perspective. Int. J. Prod. Econ. 2015, 166, 155–162. [Google Scholar] [CrossRef]
  26. Xiao, Z. A solution of dynamic VMs placement problem for energy consumption optimization based on evolutionary game theory. J. Syst. Softw. 2015, 101, 260–272. [Google Scholar] [CrossRef]
  27. Li, Z.L. Evolutionary game of speeding driving behavior. J. Transp. Syst. Eng. Inf. Technol. 2010, 10, 137–142. [Google Scholar]
  28. Cai, L.R. Multi–person evolutionary game of environment pollution based on system dynamics. Appl. Res. Comput. 2011, 28, 2982–2986. [Google Scholar]
  29. Cai, L.R. Dynamic Analysis and Control Strategy of the Inspection Game in Environmental Pollution. Ph.D. Thesis, Huazhong University of Science and Technology, Wuhan, China, 2010. [Google Scholar]
  30. Wang, H.; Cai, L.R.; Zeng, W. Research on the evolutionary game of environmental pollution in system dynamics model. J. Exp. Theor. Artif. Intell. 2011, 23, 39–50. [Google Scholar] [CrossRef]
  31. Zhu, Q.H. Analysis of an evolutionary game between local governments and manufacturing enterprises under carbon reduction policies based on system dynamics. Oper. Res. Manag. Sci. 2014, 23, 71–82. [Google Scholar]
  32. Zhang, G.L. Defraud Behavior of Network Toll Highway Based on Evolutionary Game Model. J. Transp. Syst. Eng. Inf. Technol. 2014, 14, 113–119. [Google Scholar]
  33. Tian, Y.; Govindan, K.; Zhu, Q. A system dynamics model based on evolutionary game theory for green supply chain management diffusion among Chinese manufacturers. J. Clean. Prod. 2014, 80, 96–105. [Google Scholar] [CrossRef]
  34. Liu, Q.; Li, X.; Hassall, M. Evolutionary game analysis and stability control scenarios of coal mine safety inspection system in China based on system dynamics. Saf. Sci. 2015, 80, 13–22. [Google Scholar] [CrossRef]
  35. Zhang, C. Small and medium–sized enterprises closed–loop supply chain finance risk based on evolutionary game theory and system dynamics. J. Shanghai Jiaotong Univ. Sci. 2016, 21, 355–364. [Google Scholar] [CrossRef]
  36. Duan, W. Game modeling and policy research on the system dynamics–based tripartite evolution for government environmental regulation. Clust. Comput. 2016, 19, 2061–2074. [Google Scholar] [CrossRef]
  37. Guo, S. System dynamics model based on evolutionary game theory for quality supervision among construction stakeholders. J. Civ. Eng. Manag. 2018, 24, 318–330. [Google Scholar] [CrossRef]
  38. Peng, H.; Zhao, J. Incentive–compatible Mechanism Model of Entrusted Transportation Management for Joint–venture Railway. J. Transp. Syst. Eng. Inf. Technol. 2013, 6, 003. [Google Scholar]
  39. Han, S.T. Discussion on Strengthening Entrusted Transport Management of Joint Venture Railway. Railw. Transp. Econ. 2015, 37, 57–60. [Google Scholar]
  40. Ji, Z.Z. The research on regulation of railway based on game theory. J. Railw. Sci. Eng. 2015, 3, 040. [Google Scholar]
  41. Li, K. System dynamics model for high-speed railway operation safety supervision system based on evolutionary game theory. Concur. Comput. Pract. Exper. 2018, 10, e4743. [Google Scholar] [CrossRef]
  42. State Council. Regulation on the Administration of Railway Safety. Available online: https://wenku.baidu.com/view/11b5394ef02d2af90242a8956bec0975f465a4dd.html (accessed on 10 February 2019).
  43. China Railway Corporation. Safety Management Regulations. Available online: https://www.docin.com/p-1861034656.html (accessed on 10 February 2019).
  44. Gintis, H. Game Theory Evolving, a Problem–Centered Introduction to Modeling Strategic Behavior; Princeton University Press: Princeton, NJ, USA, 2000. [Google Scholar]
  45. Friedman, D. Evolutionary games in economics. J. Econ. Soc. 1991, 59, 637–666. [Google Scholar] [CrossRef]
  46. Friedman, D. On economic applications of evolutionary game theory. J. Evol. Econ. 1998, 8, 15–43. [Google Scholar] [CrossRef]
  47. Ventana Systems, Inc. Vensim User’s Guide Version 5 [EB/OL]. USA, Ventana Systems, Inc. Available online: https://vensim.com/free-download/ (accessed on 10 February 2019).
Figure 1. SD model of an HSR operational safety supervision system with multiple agents in a static RPCS.
Sustainability 11 01300 g001
Figure 2. Game results in the static RPCS.
Sustainability 11 01300 g002
Figure 3. Game results under a different reward and penalty coefficient in a static RPCS. (a) Safety investment rate of Agent 1. (b) Safety investment rate of Agent 2. (c) Safety investment rate of Agent 3. (d) Safety supervision rate of the HSR company.
Sustainability 11 01300 g003aSustainability 11 01300 g003bSustainability 11 01300 g003c
Figure 4. Game results in a dynamic strategy.
Sustainability 11 01300 g004
Figure 5. Game results under different reward–penalty coefficients in a dynamic RPCS. (a), Safety investment rate of Agent 1. (b), Safety investment rate of Agent 2. (c), Safety investment rate of Agent 3. (d), Safety supervision rate of HSR company.
Sustainability 11 01300 g005aSustainability 11 01300 g005b
Table 1. Payoff matrix of the three agents.
StrategyAgent 1 Makes Safety InvestmentAgent 1 Neglects Safety Investment
Agent 2 Makes Safety InvestmentAgent 2 Neglects Safety InvestmentAgent 2 Makes Safety InvestmentAgent 2 Neglects Safety Investment
Agent 3 makes safety investment π 1 + X B 1 , π 2 + X B 2 , π 3 + X B 3 π 1 + X B 1 , π 2 + C 2 X P 2 , π 3 + X B 3 π 1 + C 1 X P 1 , π 2 + X B 2 , π 3 + X B 3 π 1 + C 1 X ( P 1 + P 2 ) , π 2 + C 2 X ( P 1 + P 2 ) , π 3 + X B 3
Agent 3 neglects safety investment π 1 + X B 1 , π 2 + X B 2 , π 3 + C 3 X P 3 π 1 + X B 1 , π 2 + C 2 X ( P 3 + P 2 ) , π 3 + C 3 X ( P 3 + P 2 ) π 1 + C 1 X ( P 1 + P 3 ) , π 2 + X B 2 , π 3 + C 3 X ( P 1 + P 3 ) π 1 + C 1 X ( P 1 + P 2 + P 3 ) , π 2 + C 2 X ( P 1 + P 2 + P 3 ) , π 3 + C 3 X ( P 1 + P 2 + P 3 )
Table 2. Payoff matrix of the HSR company and three agents.
StrategyHSR Company Profit
Performs the Duty of SupervisionFails to Perform the Duty of Supervision
Agents 1, 2 and 3 make safety investment C S B 1   B 2   B 3 0
Agent 1 makes safety investment, Agents 2 and 3 neglect safety investment C S + P 2 + P 3   L 2   L 3 B 1 L 2 L 3
Agent 2 makes safety investment, Agents 1 and 3 neglect safety investment C S + P 1 + P 3   L 1 L 3 B 2 L 1 L 3
Agent 3 makes safety investment, Agents 1 and 2 neglect safety investment C S + P 1 + P 2 L 1   L 2 B 3 L 1 L 2
Agents 1 and 2 make safety investment, Agent 3 neglects safety investment C S + P 3   L 3 B 1 B 2 L 3
Agents 1 and 3 make safety investment, Agent 2 neglects safety investment C S + P 2   L 2 B 1 B 3 L 2
Agents 2 and 3 make safety investment, Agent 1 neglects safety investment C S + P 1 L 1 B 2 B 3 L 1
Agents 1, 2 and 3 neglect safety investment C S + P   L 1 L 2 L 3 L 1 L 2 L 3
Table 3. Simulation parameter setting.
Variables Meaning of the VariablesInitial Values
X HSR company safety supervision rate[0,1]
Y 1 Agent 1 safety investment rate[0,1]
Y 2 Agent 2 safety investment rate[0,1]
Y 3 Agent 3 safety investment rate[0,1]
C S HSR company safety supervision cost1
L 1 HSR company expected losses because Agent 1 neglected safety investment6
L 2 HSR company expected losses because Agent 2 neglected safety investment3
L 3 HSR company expected losses because Agent 3 neglected safety investment1.5
A 1 Agent 1 general rewards2
A 2 Agent 2 general rewards1
A 3 Agent 3 general rewards0.5
π 1 Agent 1 profits 11
π 2 Agent 2 profits 6
π 3 Agent 3 profits 3
C 1 Agent 1 safety investment cost5
C 2 Agent 2 safety investment cost3
C 3 Agent 3 safety investment cost1.5
β Reward–penalty coefficient2
Table 4. Equilibrium solution and characteristic values of the game model with multiple agents in a static RPCS.
Equilibrium SolutionCharacteristic ValuesState
E 1 = ( 0 , 1 , 0 , 0 ) ( 3 , 1.5 , 4 , 5 ) saddle point
E 2 = ( 0 , 1 , 1 , 0 ) ( 4 , 1.5 , 3 , 5 ) saddle point
E 3 = ( 0 , 0 , 0 , 0 ) ( 5 , 3 , 1.5 , 18 ) saddle point
E 4 = ( 0 , 0 , 1 , 0 ) ( 5 , 1.5 , 3 , 10 ) saddle point
E 5 = ( 1 , 0 , 0 , 0 ) ( 18 , 18 , 18 , 18.5 ) saddle point
E 6 = ( 1 , 1 , 0 , 0 ) ( 18 , 4 , 8 , 8.5 ) saddle point
E 7 = ( 1 , 0 , 1 , 0 ) ( 18 , 10 , 12 , 12.5 ) .saddle point
E 8 = ( 1 , 1 , 1 , 0 ) ( 12 , 8 , 2.5 , 4 ) saddle point
E 9 = ( 0 , 1 , 0 , 1 ) (−3, 0, 1.5, 5)saddle point
E 10 = ( 0 , 1 , 1 , 1 ) (−8, 1.5, 3, 5)saddle point
E 11 = ( 0 , 0 , 0 , 1 ) (−5, −3, 1.5, 14)saddle point
E 12 = ( 0 , 0 , 1 , 1 ) (−5, 1.5, 3, 6)saddle point
E 13 = ( 1 , 0 , 0 , 1 ) (−18.5, −14, 15, 15)saddle point
E 14 = ( 1 , 1 , 0 , 1 ) (−15, −8.5, 0, 5)saddle point
E 15 = ( 1 , 0 , 1 , 1 ) (−15, −12.5, −6, 9)saddle point
E 16 = ( 1 , 1 , 1 , 1 ) (−9, −5, −2.5, 8)saddle point
E 17 = ( 163 / 568 , 123 / 163 , 70 / 163 , 1 ) ( 0.2256 + 3.6557 i , 0.2256 3.6557 i , 0.4512 , 1.3345 ) saddle point
E18 = (163/631, 153/163, 99/163, 0)(−0.1185 + 2.6873i, −0.1185 − 2.6873i, 0.2371, 0.3003)saddle point
E19 = (5/17, 5/7, 1, 0)(3.1755i, −3.1755i, −1.0756, 0.5168)saddle point
E20 = (3/11, 1, 1/2, 0)(2.0889i, −2.0889i, −0.4545, 0.4091)saddle point
E21 = (3/20, 1, 0, 1)(0, 2, −1.8, 0)saddle point
Table 5. Equilibrium solution and characteristic values of the game model in a dynamic RPCS.
Equilibrium SolutionCharacteristic ValuesState
E 1 = ( 0 , 1 , 0 , 0 ) ( 3 , 1.5 , 4 , 5 ) saddle point
E 2 = ( 0 , 1 , 1 , 0 ) ( 4 , 1.5 , 3 , 5 ) saddle point
E 3 = ( 0 , 0 , 0 , 0 ) ( 5 , 3 , 1.5 , 18 ) saddle point
E 4 = ( 0 , 0 , 1 , 0 ) ( 5 , 1.5 , 3 , 10 ) saddle point
E 5 = ( 1 , 0 , 0 , 0 ) ( 18 , 14 , 16 , 17.5 ) saddle point
E 6 = ( 1 , 1 , 0 , 0 ) ( 18 , 4 , 6 , 7.5 ) saddle point
E 7 = ( 1 , 0 , 1 , 0 ) ( 12 , 10 , 8 , 11.5 ) saddle point
E 8 = ( 1 , 1 , 1 , 0 ) ( 2 , 2 , 1.5 , 4 ) saddle point
E 9 = ( 0 , 1 , 0 , 1 ) (−3, 0, 1.5, 5)saddle point
E 10 = ( 0 , 1 , 1 , 1 ) (−8, 1.5, 3, 5)saddle point
E 11 = ( 0 , 0 , 0 , 1 ) (−5, −3, 1.5, 14)saddle point
E 12 = ( 0 , 0 , 1 , 1 ) (−5, 1.5, 3, 6)saddle point
E 13 = ( 1 , 0 , 0 , 1 ) (−15.5, −14, 11, 13)saddle point
E 14 = ( 1 , 1 , 0 , 1 ) (−5.5, −5, 0, 3)saddle point
E 15 = ( 1 , 0 , 1 , 1 ) (−9.5, −9, −6, 5)saddle point
E 16 = ( 1 , 1 , 1 , 1 ) (0.5, 1, 1, 8)saddle point
E17′ = (0.2142, 1, 0, 1)(0, 2.858, −1.7148, 0.0006)saddle point
E18′ = (0.4014, 1, 0.3819, 0)(−0.1895 + 1.9378i, −0.1895 − 1.9378i, 1.2701, 0.6243)saddle point
E19′ = (0.5362, 0.6125, 1, 0)(−0.3818 + 2.6109i, −0.3818 −2.6109i, −0.4861, 0.9137)saddle point
E20′ = (1, 0.8792, 0.7877, 0.958)(−0.9919, −0.073, −0.3227, 5.829)saddle point
E21′ = (0.6250, 0.3333, 1, 1)(−0.4167 + 2.5482i, −0.4167 −2.5482i, −1.0281, −1.9031)ESS

