Article

The Synergy in the Economic Production System: An Empirical Study with Chinese Industry

1
Donlinks School of Economics and Management, University of Science and Technology Beijng, Beijing 100083, China
2
Institute of Operational Research and Mathematical Economics, School of Economics, Renmin University of China, Beijing 100872, China
*
Author to whom correspondence should be addressed.
Sustainability 2019, 11(4), 980; https://doi.org/10.3390/su11040980
Submission received: 11 December 2018 / Revised: 30 January 2019 / Accepted: 31 January 2019 / Published: 14 February 2019

Abstract

:
Due to the difference in pollutants discharged, along with heterogeneous abatement technology, the structural and model design of the economic production system needs to consider these differences. This study first proposes a network slacks-based model (SBM) to address the inefficiency of the production system after considering pollutant abatement technology heterogeneity for different kinds of pollutant. Then, we employ the model to study the inefficiency of the Chinese industrial production system, analyzing the inefficiency in the stages of economic production and pollutant treatment. Furthermore, the regional distribution of inefficiencies concerning SO2 (NOx) generation (emission) are discussed and compared. The results show that only the joint reduction of NOx in two sub-stages simultaneously is feasible, and the synergistic pollutant reductions seems limited.

1. Introduction

Nowadays, environmental pollutant abatement strategies have attracted significant attention, and a large number of studies have discussed the efficiency of economic production and environmental abatement from different viewpoints [1,2,3]. However, even using the same network framework and data, a variety of suitable network DEA models can be identified, based on different perspectives [4,5].
Numerous studies have addressed undesirable outputs under two-stage DEA frameworks of economic production. The production system is often divided into two sub-stages: an economic production sub-stage and a pollutant abatement sub-stage [6,7,8,9]. In the process of economic production, various kinds of pollutants are generated due to different industry structures. For instance, regions with better energy, metallurgy, building materials, nonferrous metals, and petrochemical industries are expected to produce more SO2, while regions with a focus on electricity, cement, and transportation industries are likely to generate more NOx. Since each region’s economic structure is diverse, the efficiency of disposing pollutant is distinct; therefore, it is essential to take account of technology differences in the pollutant abatement sub-stage. However, in the existing studies, the technology for different kinds of pollutants is predetermined identically in the model.
Synergistic effects exist in many fields, and different kinds of pollutant reduction strategies might create positive synergies [10]. Sueyoshi and Goto [11] compared the operational performance of electricity-specialized firms with that of diversified utility firms and found no synergy in the operational performance of diversified utility companies from 1990 to 2004. Buonocore et al. [12] found that reducing carbon dioxide (CO2) emissions from power plants has important “co-benefits” for public health, causing a reduction in the emissions of air pollutants. Complex models have been proposed to analyze these synergies, such as the Greenhouse Gas and Air Pollution Interaction and Synergies (GAINS) model, which has been successfully used as a policy support tool in Europe and Asia [13]. However, none of the research discusses the synergistic effect in different pollutant generation and treatment. Because various pollutants are produced within the same production process, through different emissions channel, and may be addressed by different emission reduction measures, we can discuss whether a synergistic effect exist during the production of the pollutant and the treatment of the emission.
The contributions of this study are as follows. First, a new production system framework is proposed. In previous studies, the production system often preestablish that the technology in the abatement sub-stage is identical for different kinds of pollutants. In this study, we assume that the pollutant abatement sub-stage’s technology depends on the type of pollutant for the first time. Second, this study proposes an additive network SBM to measure the inefficiency in different sub-stages after distinguishing the technology difference of the pollutant. Third, the proposed model is employed to study the inefficiency of the Chinese industries. Furthermore, this study explores the synergy between the inefficiencies of the SO2 (NOX) generation sub-stage and SO2 (NOX) abatement sub-stage.
The remainder of this paper is organized as follows. Section 2 describes the production system and presents the model. Section 3 shows the empirical data and results, and Section 4 concludes.

2. Methodology

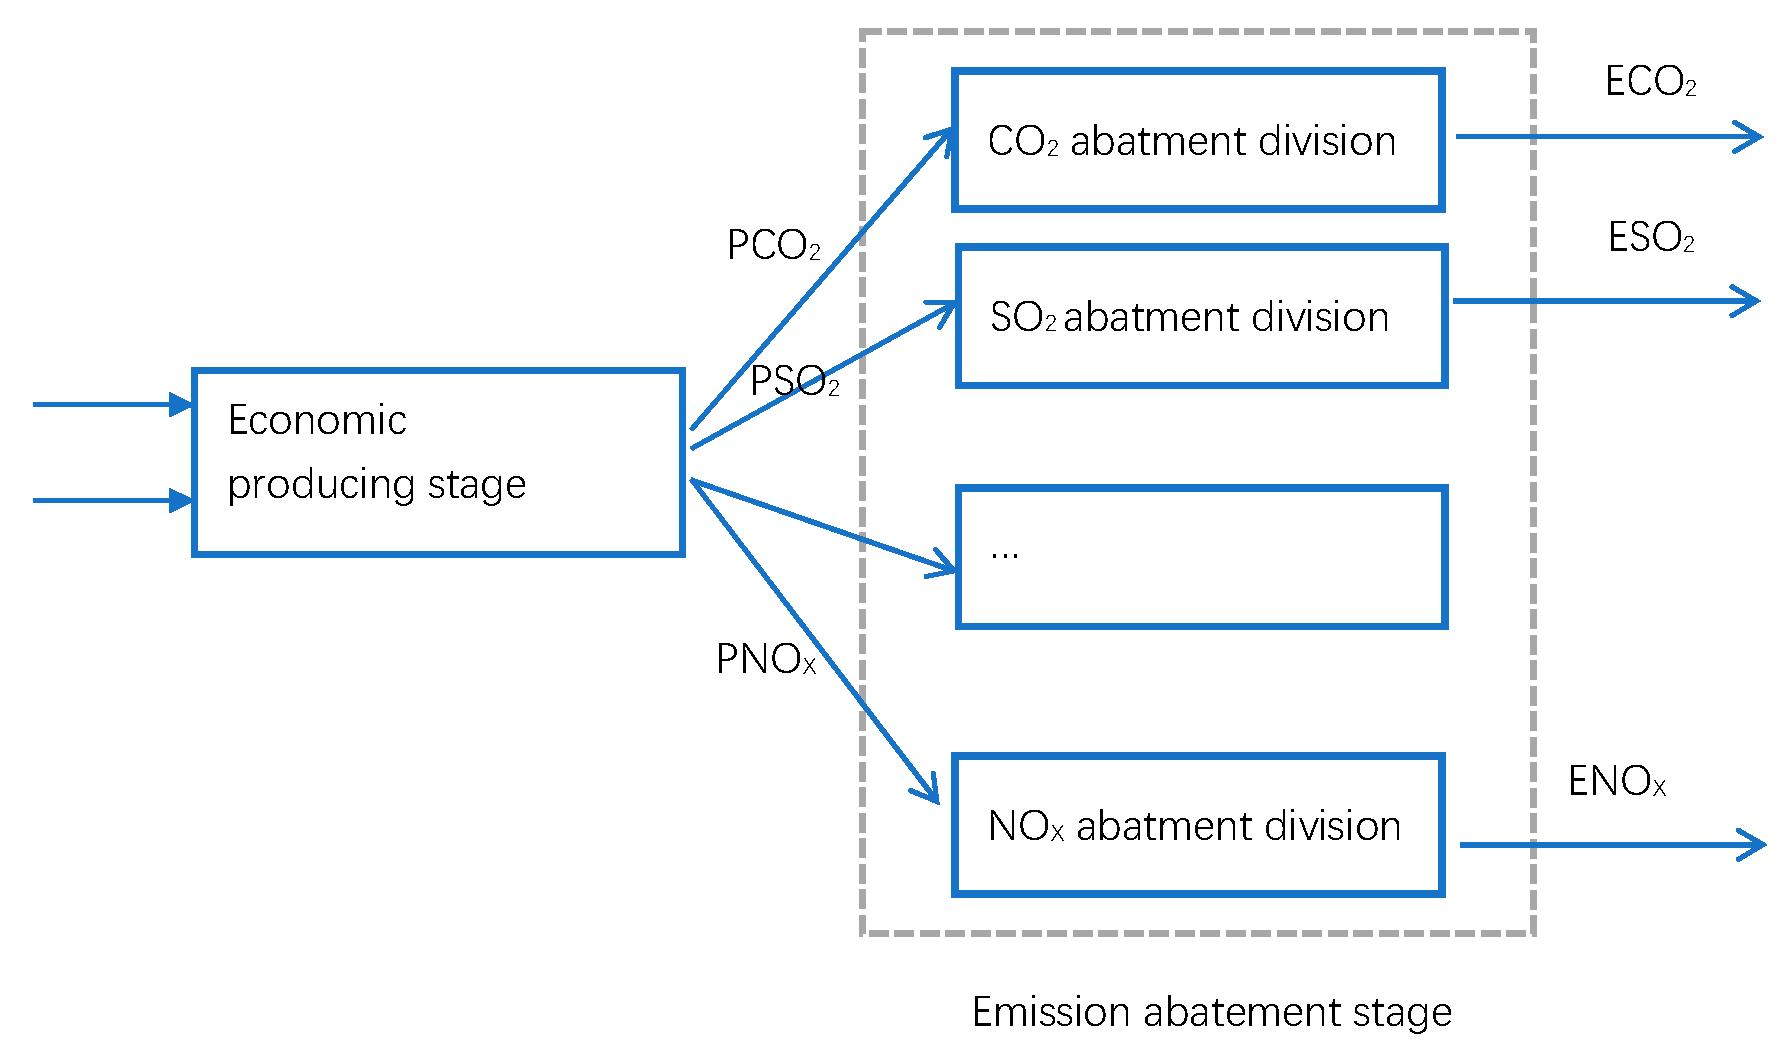
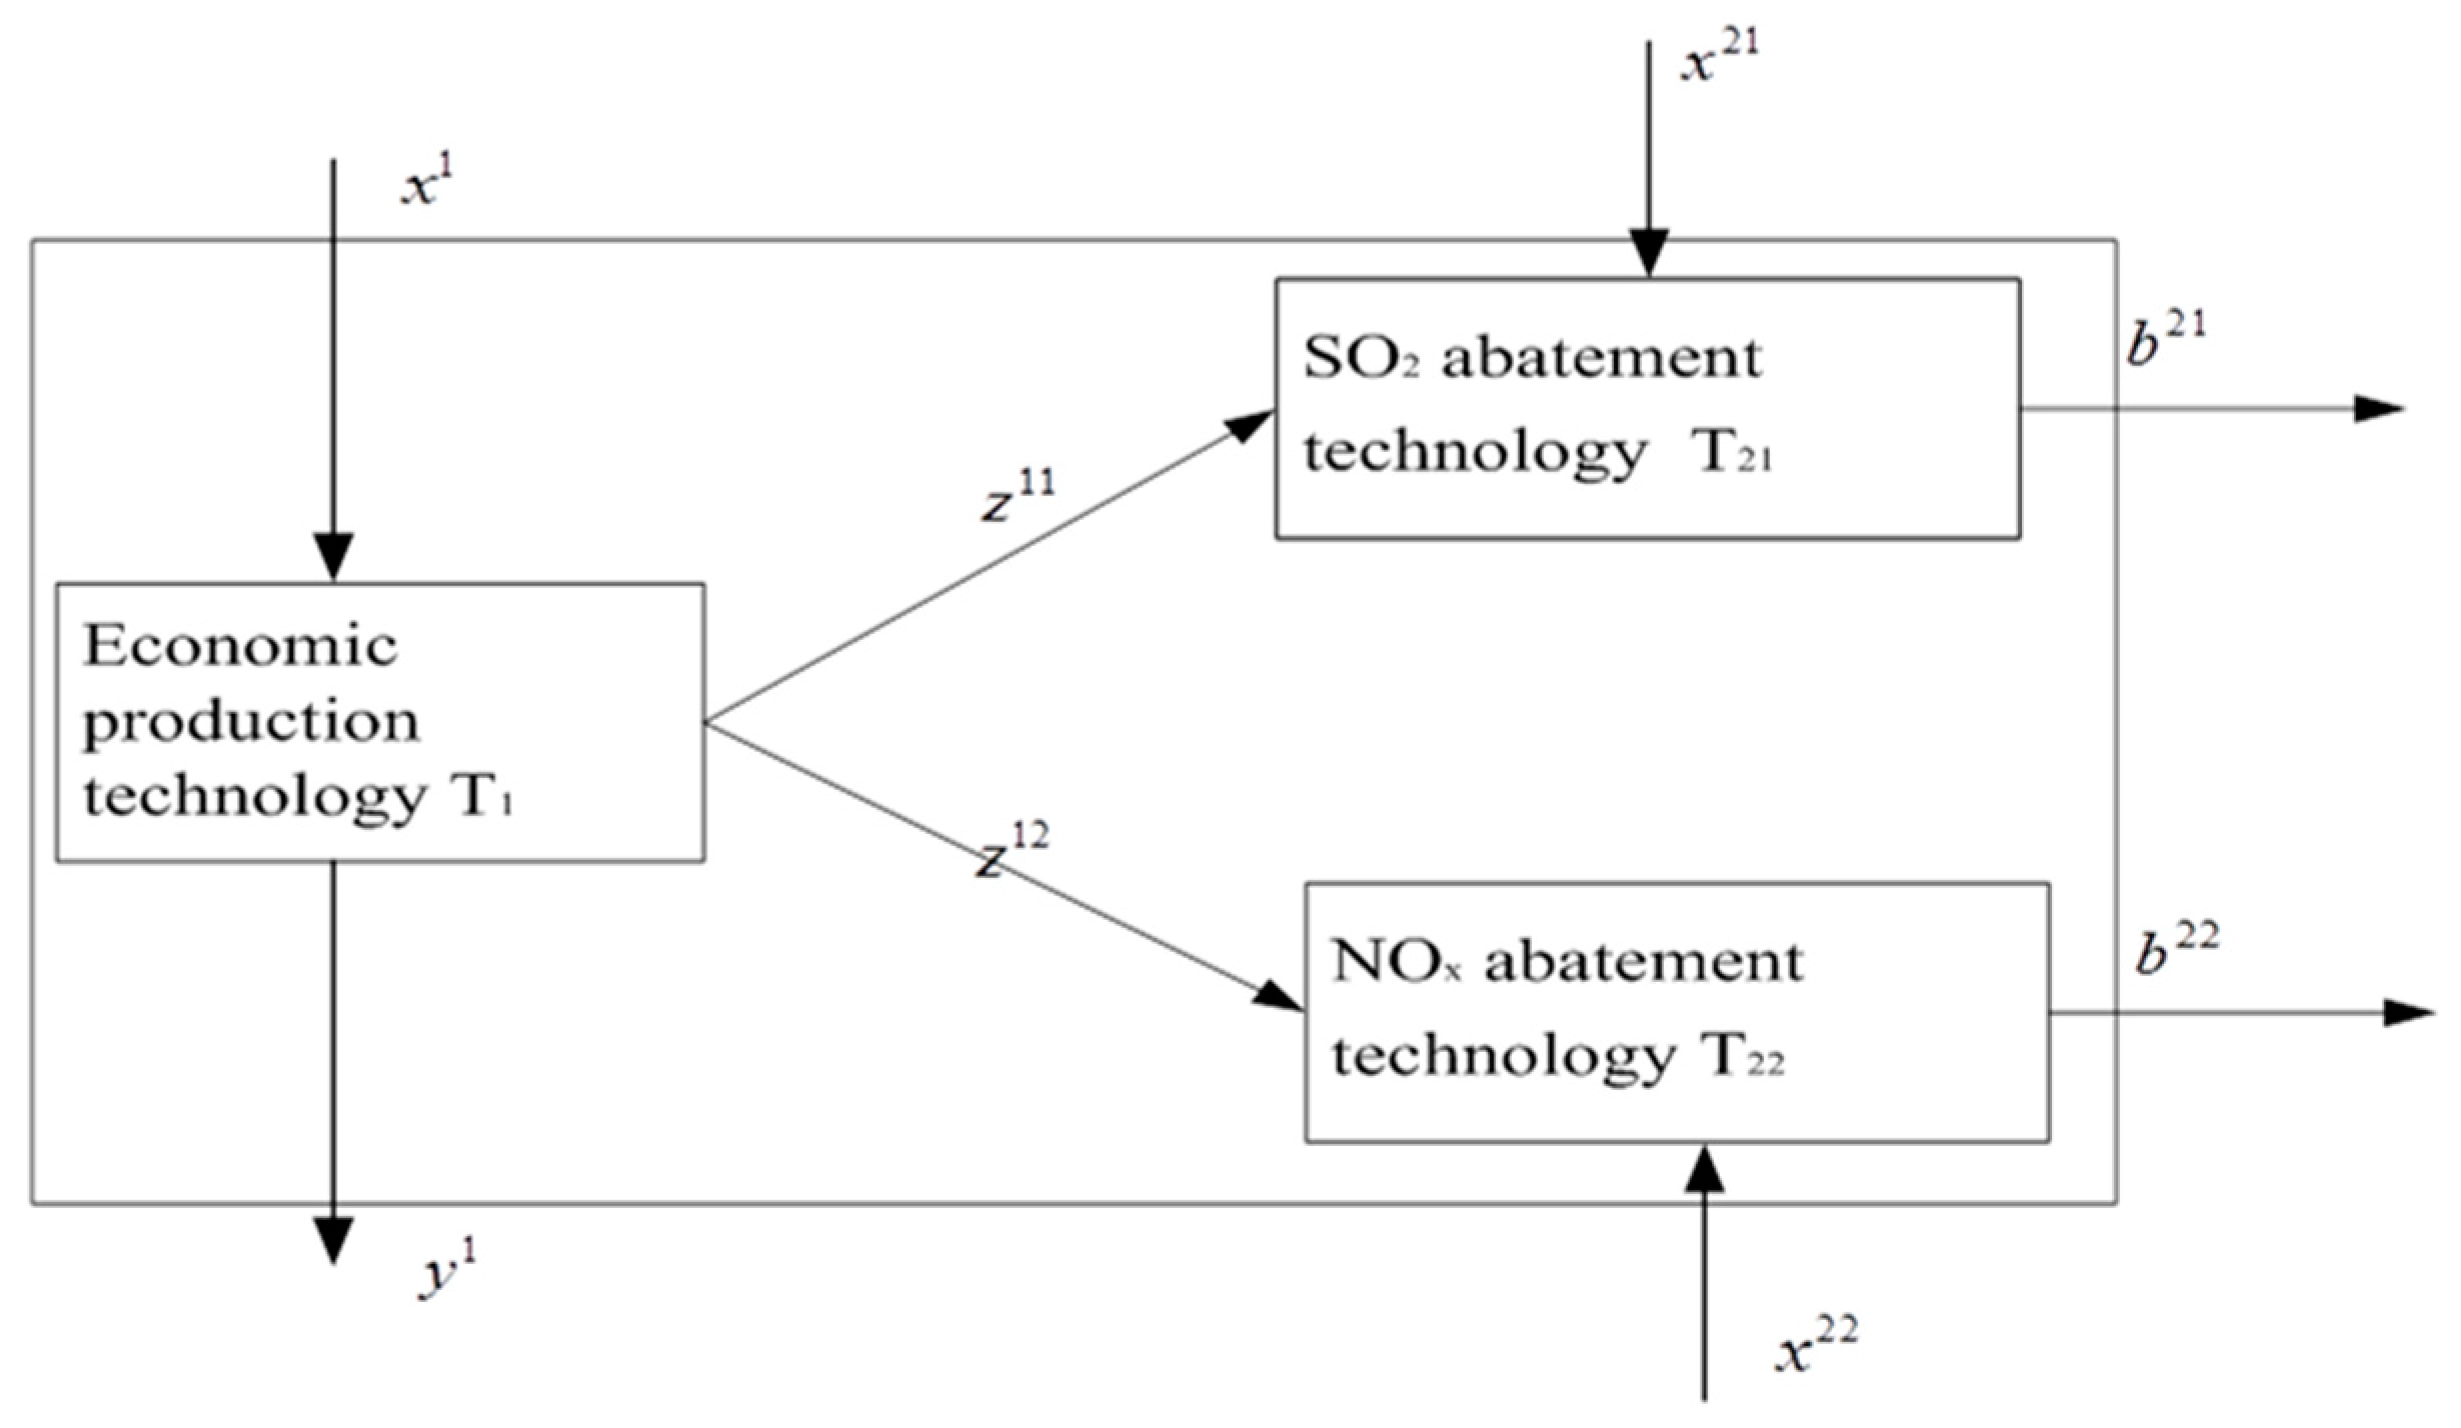
2.1. The Production System

In the economic production process, undesirable outputs are often generated along with desirable outputs. In pollutant control practice, there are two main categories, namely, “source control” and “end-of-pipe treatment” [14,15,16]. Source control indicates preventing and controlling pollutants in the economic production process. It assumes that a firm should pay close attention to the entire production process, with a full range of management methods, and try to eliminate the pollutant sources in the production process. For instance, by improving the product design, using clean energy and raw materials, adopting advanced technology and equipment, and improving management measures, a firm can improve its resource use efficiency, reducing or even avoiding the generation of pollutants. End-of-pipe treatment indicates the separate treatment of the generated pollutants after the production process [14]. The purpose of end-of-pipe treatment is to control the emissions of pollutants or dispose the pollutants to meet certain standards. In addition, end-of-pipe treatment also involves the consumption of resources to eliminate pollutant. With the increase in emission standards, treatment costs are expected to increase significantly, thus affecting the overall effectiveness of the method. This indicates that we can decrease the pollutant generation in the production and decrease the emission before discharging.
Currently, source control and end-of-pipe treatment are the two leading approaches to reducing or eliminating pollutants, and they run in parallel. Following these pollutant treatment practice, this study divided the production system into two sub-stages: an economic production sub-stage and a pollutant abatement sub-stage. In the sub-stage of economic production, investment and energy are used, and pollutants like SO2, NOx, and CO2 are generated along with the production of the desired output. In the sub-stage of emission abatement, the pollutants’ treatment technology is distinguished, since the economic structures might result in a diversity of discharged pollutants. For instance, in developed countries, where the number of automobiles is high, the disposal technology on NOx might receive more attention than in developing countries. In the pollutant abatement sub-stage, the different pollutant abatement facilities, such as desulfurization facilities and denitrification facilities, operate independently or dependently. Therefore, it is necessary to consider the technology differences in pollutant abatement sub-stage. To achieve this goal, we first divide the pollutant abatement sub-stage into several parallel divisions.
Specifically, a firm’s total emissions are determined by the efficiency of both the pollutant generation sub-stage and the pollutant abatement sub-stage. In the former sub-stage, a company obtains its desirable output, Y, but at the same time, it also generates undesirable outputs, like CO2, SO2, and NOX. Assuming that PCO2, PSO2, and PNOx are the amount of CO2, SO2, and NOx produced in the economic production sub-stage, ECO2, ESO2, and ENOx are the quantities of pollutants discharged in the pollutant abatement sub-stage. Thus, PCO2, PSO2, and PNOx are the undesired output amount of the economic production sub-stage as well as the input of the pollutant abatement sub-stage. The production system is illustrated in Figure 1.

2.2. The Network DEA Model

As discussed in Section 2.1, we assume that the production system includes two sub-stages. In the pollutant abatement sub-stage, we assume that it is composed of two parallel divisions, a NOx abatement division and a SO2 abatement division. The proposed model can also be applied to production systems with more than two kinds of undesired outputs after adding the corresponding constraints and objective function.
The inputs and outputs of the production system are described in Figure 2. In the economic production process, for the j-th DMU, the input is defined as x j 1 + M , and the desired output is defined as y j 1 + P . At the same time, the economic production generates undesired intermediate SO2 emissions, z j 11 + S 1 , and NOX emissions, z j 12 + S 2 . In the emission abatement sub-stage, a portion of the produced emission is eliminated. In the SO2 emission abatement division, x j 21 + M 1 is used to deal with the produced SO2, and only partial SO2 b j 21 + R 1 ( S 1 = R 1 ) is discharged. In the NOX abatement division, x j 22 + M 2 is used to deal with the produced NOX emission, and only partial NOX b j 22 + R 2 . ( S 2 = R 2 ) is discharged.
The strong and weak disposability assumptions of undesirable outputs have gained acceptance among the majority of researchers [17]. However, the generally accepted assumption is the weak disposability of the desirable and undesirable outputs [18]. Several studies also assume strong disposability of the desirable and undesirable outputs in their research [19,20]. It is worth mentioning that the weak disposability on undesirable outputs indicates a possible occurrence of “undesirable congestion”, or a conceptual extension of the conventional congestion in DEA, while the strong disposability does not incorporate such an occurrence of undesirable congestion [21]. In this study, we intend to discuss the inefficiency of pollutant in both the economic production sub-stage and pollutant abatement sub-stage; therefore, we assume the strong disposability of the undesirable outputs, which might be different from the existing studies. The reason for this is that if we assume weak disposability of the undesirable outputs, we would not be able to obtain the inefficiency score of pollutant generation in the economic production sub-stage. Thus, we would not able to discuss the synergy effects in the production system.
The overall technology of the system production process, T s , can be estimated as:
T s = { ( x 1 , y 1 , z 11 , z 12 , x 11 , x 21 , b 21 , b 22 ) + M + P + S 1 + S 2 + M 1 + M 2 + R 1 + R 2 : j = 1 J λ j 1 x m j 1 x m k 1 , m = 1 , , M , j = 1 J λ j 1 y p j 1 y p k 1 , p = 1 , , P , j = 1 J λ j 1 z s 1 j 11 z s 1 k 11 , s 1 = 1 , , S 1 , j = 1 J λ j 1 z s 2 j 12 z s 2 k 12 , s 2 = 1 , , S 2 , j = 1 J λ j 21 x m 1 j 21 x m 1 k 21 , m 1 = 1 , , M 1 , j = 1 J λ j 21 b r 1 j 21 b r 1 k 21 , r 1 = 1 , , R 1 , j = 1 J λ j 22 x m 2 j 22 x m 2 k 22 , m 2 = 1 , , M 2 , j = 1 J λ j 22 b r 2 j 22 b r 2 k 22 , r 2 = 1 , , R 2 , j = 1 J λ j 1 z s 1 j 11 = j = 1 J λ j 21 z s 1 j 11 , s 1 = 1 , , S 1 , j = 1 J λ j 1 z s 2 j 12 = j = 1 J λ j 22 z s 2 j 12 , s 2 = 1 , , S 2 }
Assuming an output-oriented evaluation of the inefficiency of the production system, the system inefficiency can be obtained by solving the following network SBM model:
E k s = max ( 1 P p = 1 P v p + y p k 1 + 1 S 1 s 1 = 1 S 1 t s 1 z s 1 k 11 + 1 S 2 s 2 = 1 S 2 t s 2 z s 2 k 12 + 1 R 1 r 1 = 1 R 1 v r 1 + b r 1 k 21 + 1 R 2 r 2 = 1 R 2 v r 2 + b r 2 k 22 ) s . t . j = 1 J λ j 1 x m j 1 x m k 1   , m = 1 , , M ; j = 1 J λ j 1 y p j 1 v p + = y p k 1 , p = 1 , , P ; j = 1 J λ j 1 z s 1 j 11 + t s 1 = z s 1 k 11 , s 1 = 1 , , S 1 ; j = 1 J λ j 1 z s 2 j 12 + t s 2 = z s 2 k 12 , s 2 = 1 , , S 2 ; j = 1 J λ j 1 z s 1 j 11 = j = 1 J λ j 21 z s 1 j 11 , s 1 = 1 , , S 1 ; j = 1 J λ j 1 z s 2 j 12 = j = 1 J λ j 22 z s 2 j 12 , s 2 = 1 , , S 2 ; j = 1 J λ j 21 x n 1 j 21 x n 1 k 21 , n 1 = 1 , , M 1 ; j = 1 J λ j 22 x n 2 j 22 x n 2 k 22 , n 2 = 1 , , M 2 ; j = 1 J λ j 21 b r 1 j 21 + v r 1 + = b r 1 k 21 , r 1 = 1 , , R 1 ; j = 1 J λ j 22 b r 2 j 22 + v r 2 + = b r 2 k 22 , r 2 = 1 , , R 2 ; λ j 1 , λ j 21 , λ j 22 0 }
In this program, the objective of model 5 represents the output inefficiency, including desirable and undesirable outputs. It is calculated as the sum of the potential output improvement divided by the observed output. The objective function of model (5) is also a network slacks-based inefficiency measure (NSBI) [8,22,23], in which the firm’s undesirable and desirable outputs are contracted and expanded, respectively. The model drives the DMU to the farthest point of the production frontier by expanding the desired outputs and contracting the undesired outputs simultaneously. The objective of the model takes value from zero to infinity.
Assuming that ( v p + * , t s 1 * , t s 2 * , v r 1 + * , v r 2 + * ) are the optimal solutions, the inefficiency of the economic production system in the k-th DMU can be defined as:
E k S * = 1 P p = 1 P v p + * y p k 1 + 1 S 1 s 1 = 1 S 1 t s 1 * z s 1 k 11 + 1 S 2 s 2 = 1 S 2 t s 2 * z s 2 k 12 + 1 R 1 r 1 = 1 R 1 v r 1 + * b r 1 k 21 + 1 R 2 r 2 = 1 R 2 v r 2 + * b r 2 k 22
The inefficiency of the economic production sub-stage and pollutant abatement sub-stage can be obtained using the following two equations, respectively:
E k 1 * = 1 P p = 1 P v p + * y p k 1 + 1 S 1 s 1 = 1 S 1 t s 1 * z s 1 k 11 + 1 S 2 s 2 = 1 S 2 t s 2 * z s 2 k 12
E k 2 * = 1 R 1 r 1 = 1 R 1 v r 1 + * b r 1 k 21 + 1 R 2 r 2 = 1 R 2 v r 2 + * b r 2 k 22
where E k S * = E k 1 * + E k 2 * .
The inefficiency of the production system equal to the sum of all inefficiency of the outputs in both the economic production sub-stage and pollutant abatement sub-stage.
Furthermore, we can decompose the inefficiency of the economic production sub-stage into three parts: the inefficiency of the desirable output, the inefficiency of cleaner SO2 production, and the inefficiency of cleaner NOX production, using the following equations:
E k 10 * = 1 P p = 1 P v p + * y p k 1
E k 11 * = 1 S 1 s 1 = 1 S 1 t s 1 * z s 1 k 11
E k 12 * = 1 S 2 s 2 = 1 S 2 t s 2 * z s 2 k 12
where E k 1 * = E k 10 * + E k 11 * + E k 12 * .
E k 10 * represents the increasable proportion of desirable output, and E k 11 * and E k 12 * represent the reducible proportion of the generated SO2 and NOX for the k-th DMU in the economic production sub-stage.
Similarly, we can obtain the inefficiency of the SO2 abatement division and the inefficiency of NOX abatement division using the following equations:
E k 21 * = 1 R 1 r 1 = 1 R 1 v r 1 + * b r 1 k 21
E k 22 * = 1 R 2 r 2 = 1 R 2 v r 2 + * b r 2 k 22
where E k 2 * = E k 21 * + E k 22 * .
E k 21 * and E k 22 * represent the reducible emissions of SO2 and NOX for the k-th DMU in the pollutant abatement stage. The above score reflects the level of inefficiency, and hence, a higher value indicates a lower efficiency of the D M U .
Definition 1: D M U k is system efficient if and only if E k S = 0 .
Definition 2: D M U k is efficient in sub-stage 1 if and only if E k 1 = 0 .
Definition 3: D M U k is efficient in sub-stage 2 if and only if E k 2 = 0 .

3. An Empirical Study of China’s Industrial Inefficiency

3.1. Data Description

In the past 30 years, China’s rapid economic growth has attracted worldwide attention, and the industrial sector has made substantial contributions to the country’s growth. The rapid industrial development has generated a significant amount of pollutants. According to the National Environmental Statistical Bulletin of 2013, Chinese industrial energy consumption accounted for 70% of the national energy consumption, and Chinese industry’s output accounted for 38.48% of the national GDP. In addition, the industrial emission of SO2 and NOx accounted for 90.3% and 70.9% of the country’s emissions, respectively. The government and the companies have invested a large amount of input and adopted several measures to abate pollutant emission, with significant results. In 2012, the investment for the control of industrial pollutant reached 50.05 billion RMB, and the industrial waste gas abatement accounts for 28% of the total investment.
Some regions in China follow the route of “treatment after pollution”, which blindly pursues the economic boom, often neglecting the generation and emissions of pollutants. Due to the technology and industrial structure are different across regions, a regional analysis seems appropriate. Therefore, this study uses Chinese provincial data of industrial sector as DMUs.
With respect to the sub-stage of economic production, most previous studies have focused on investment, energy, and labor. This study takes capital and energy as inputs in this sub-stage. Since 2011, employment data relative to Chinese industrial sectors have no longer been published; therefore, the labor variable is not considered in this study. The output of the economic production sub-stage consists of both desirable and undesirable outputs. In particular, the industrial product is regarded as the desirable output, while the generated SO2 and NOx emissions are considered the undesirable output.
For the sub-stage of pollutant abatement, investments for improving environmental sustainability are not classified by the type of pollutant. Because the number and cost of facilities are counted by the type of pollutant, this study chose these variables as the input in this sub-stage. In the SO2 abatement division, we chose the cost for running the desulphurization, the number of desulphurization facilities, along with the yield of SO2 in the economic production sub-stage as the inputs. In addition, as SO2 cannot be eliminated completely in the division, we defined the emission of SO2 as the undesirable output of the division. Likewise, in the NOx abatement division, we identified the cost for running the denitrification, the number of denitrification facilities, along with the yields of NOx in the economic production sub-stage as inputs. Due to the incomplete disposal of NOx abatement, we defined the emission of NOx as the undesirable output of the division. Because the statistical standards for pollutants in the China Statistical Yearbook on Environment changed in 2011, this study employed data from 2012, and 30 provinces, cities, and autonomous regions were selected as DMUs. Tibet, Hainan province, and Qinghai province have not been included in the analysis due to lack of data. The statistics used in this study were obtained from the China Statistical Yearbook 2013, China Statistical Yearbook on Environment 2013, and China Energy Statistical Yearbook 2013. The variables referring to the production system are shown in Table 1, and a statistical summary of the variables used in the analysis is presented in Table 2.

3.2. Results of the Analysis

The empirical results are discussed in the following section.

3.2.1. The Analysis of the Inefficiency of Three Areas in China

Table 3 shows the inefficiencies in three areas. The second column of Table 3 is the inefficiency of the desirable output, E 10 , in the economic production sub-stage. E 10 in the East was lower than that of the central area, which, in turn, was lower than that of the West. This phenomenon paralleled the economic developments of these areas in China, perhaps because areas with a higher economic development level could produce more output. This result is in line with several existing studies [24,25,26]. The results also indicate that the economic development potential in the central and west area is rather large, which could enhance their technology by learning from the east areas.
The third and fourth column of Table 3 show the inefficiency of two undesirable outputs SO2 and NOx in the economic production sub-stage, E11 and E12, respectively. The eastern area shows the smallest values for E11 and E12, respectively, which indicate low emission in these areas based on technological innovation and upgraded emissions standards. It is worth noting that SO2 can be reduced more than NOx in the three areas, and the country’s inefficiency in terms of cleaner SO2 and NOx production is 64.02% and 48.67%, respectively.
In the sub-stage of pollutant abatement, E21 in the three areas was comparatively higher than E22. Therefore, the inefficiency in the abatement of SO2 is also higher than the inefficiency of the NOx abatement, indicating that most regions’ treatment technology of SO2 needs to be improved dramatically.
To verify whether the three areas show significant differences in terms of inefficiency score, the Kruskal-Wallis test was performed. The null hypothesis is that the inefficiency difference of the three areas is not statistically significant. Based on the results reported in Table 4, we cannot reject the null hypothesis that E10, E11, E12, E1, E21, E22, E2 and Es for these three areas are the same at the 1% significance level. Three areas also show a statistically significant difference in both the economic production sub-stage and pollutant abatement sub-stage. The results seem to indicate that, under increasingly stringent environmental regulations, the eastern, central, and western areas’ inefficiency measures are all statistically different. This indicates that the three areas can improve their efficiency in different ways, and each region should pay attention to their own industrial structure and adopt the corresponding advanced technology to reduce pollutants.
For the inefficiency in the economic production sub-stage, E1 is equal to zero in Beijing, Shanghai, Jiangsu, and Guangdong, while Ningxia, Xinjiang, Guizhou, and Gansu can significantly reduce their pollution or increase their desirable output dramatically. In twenty regions, E2 is larger than E1. Therefore, the reduction of pollutants in the abatement sub-stage needs more attention. For the inefficiency of the industrial system, ES, Jiangsu province has the lowest inefficiency, followed by Shanghai, while Ningxia and Xinjiang have the highest inefficiency. Moreover, ES is rather high in most western provinces, suggesting that their system efficiency can be improved notably.

3.2.2. Statistical Analysis of the Inefficiency Score

In this section, we explore the difference between the inefficiencies regarding SO2 (NOX) in the sub-stages of economic production and pollutant abatement. In other words, we test whether the inefficiency show similar features in two sub-stages. The Wilcoxon-Mann-Whitney test is employed in this section; the null hypothesis is that the difference in the inefficiency score of two sub-stages is not statistically significant. Based on the results shown in Table 5, we can reject the null hypothesis that E11 equals E21 at the 1% significance level, and we cannot reject the null hypothesis that E12 equals E22 at 1% significance level. The results suggest that the generated SO2 in the economic production sub-stage and the emitted SO2 in the pollutant abatement sub-stage show different characteristics, while the generated NOx is similar to the emitted NOx. Since most areas are inefficient in both the NOx production and abatement sub-stages, the regions with more NOx generation tend to discharge more NOx.
We also address whether there is a significant difference between E11 ( E 21 ) and E12 (E22), that is, whether it is necessary to consider the difference of SO2 and NOx in the economic production sub-stage and the pollutant abatement sub-stage. To answer this question, we performed the Wilcoxon-Mann-Whitney test, and the results are reported in Table 6. We can reject the null hypothesis that E11 equals E12, and we can also reject the null hypothesis that E 21 equals E 22 . Thus, it is necessary to distinguish the inefficiency of different types of pollutants in the economic production, and the pollutant reduction measurements in this stage should pay more attention to the source of different pollutants.

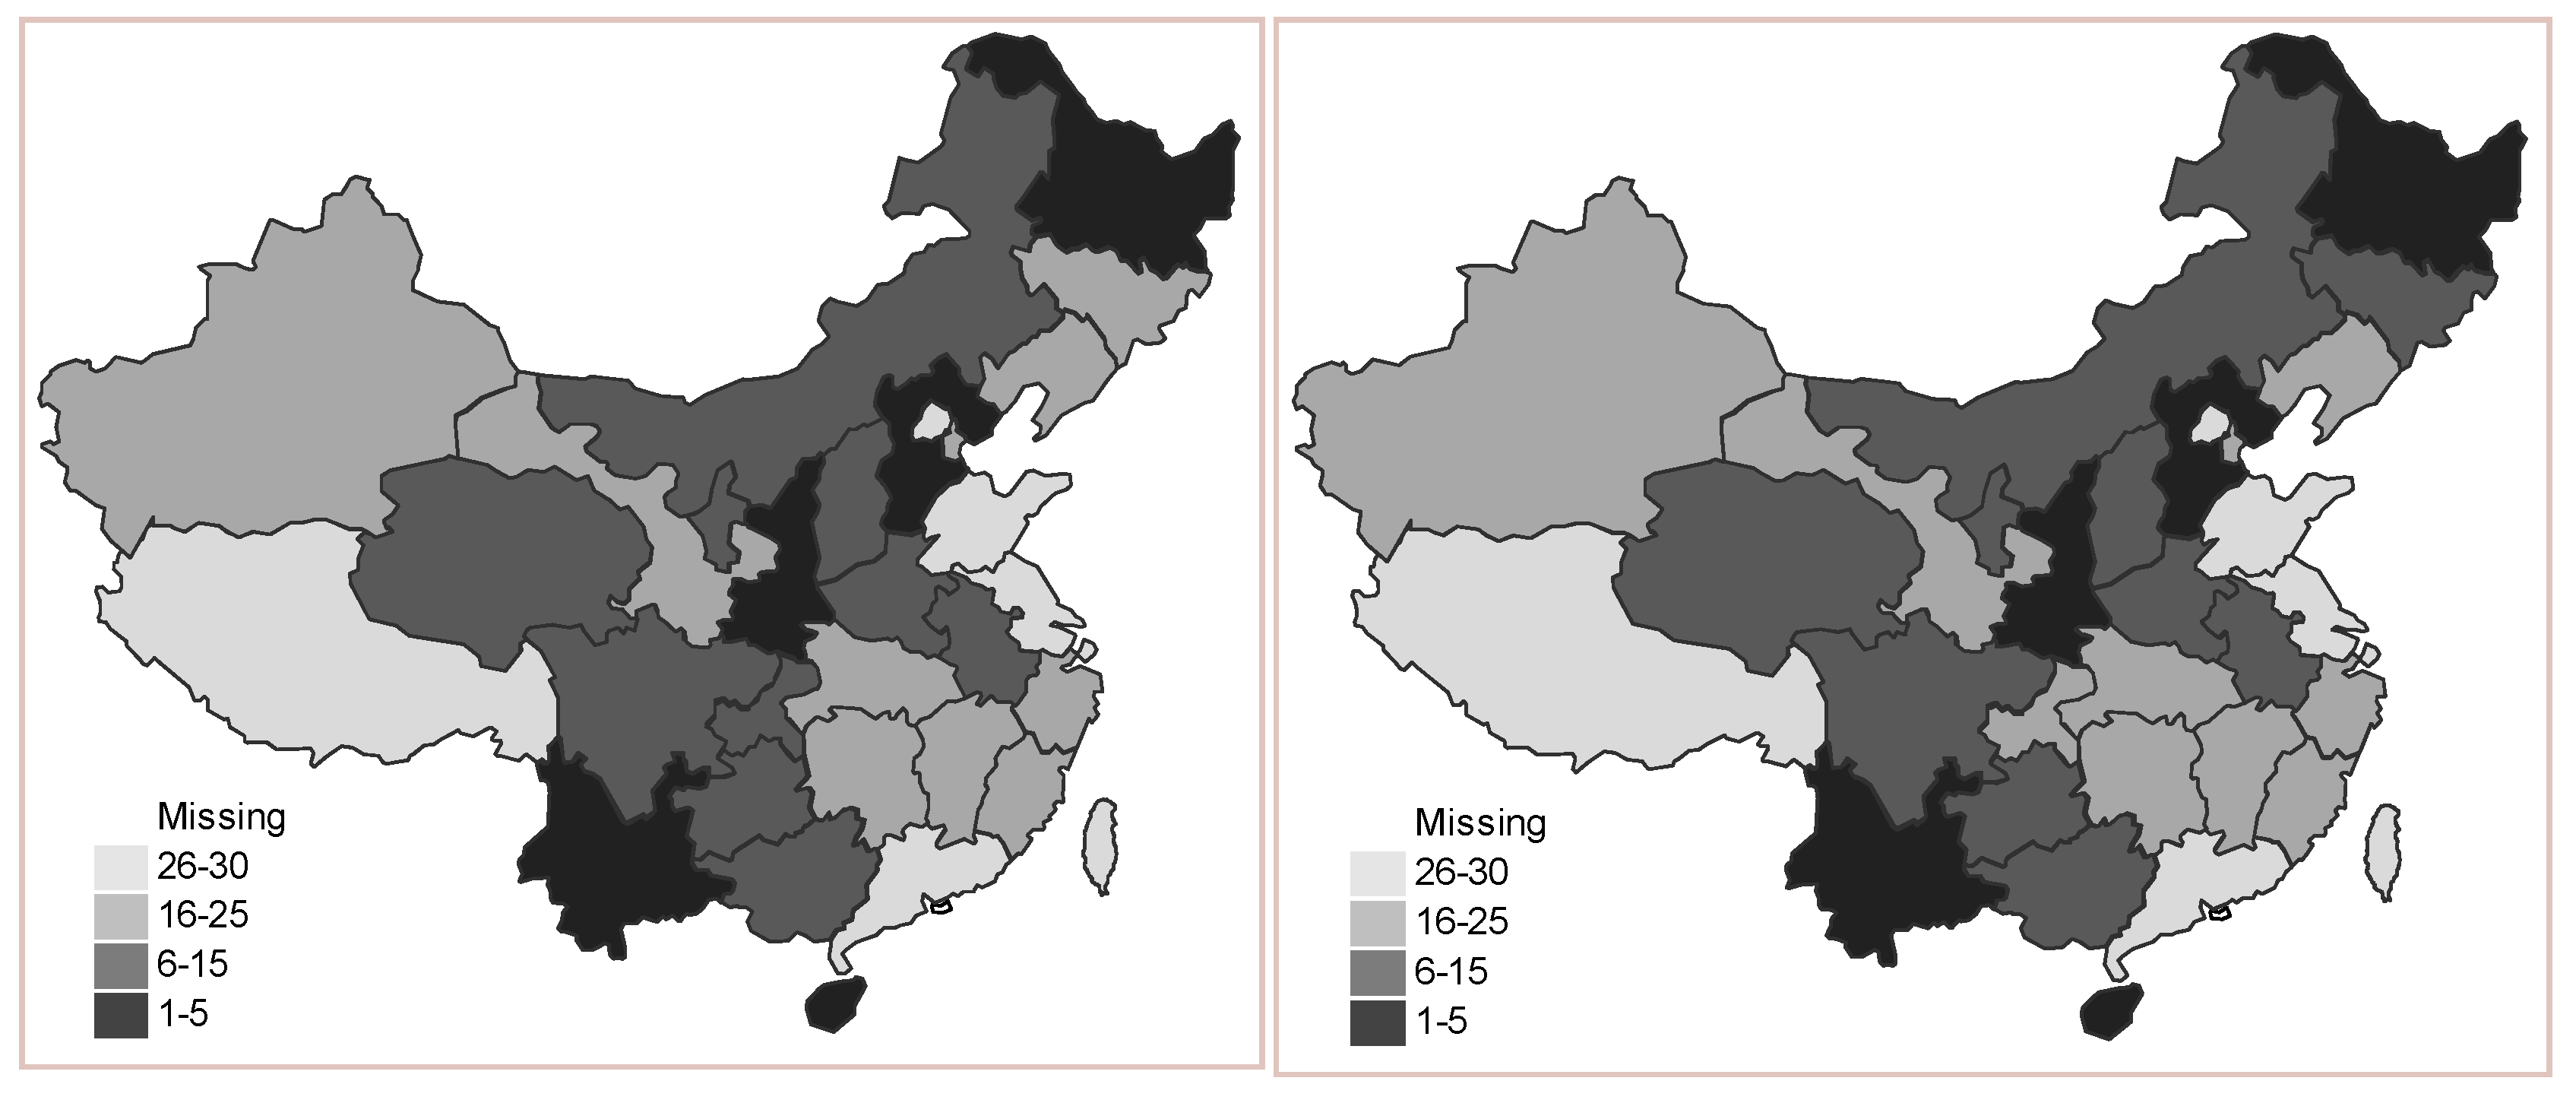
3.2.3. Regional Distribution of the Inefficiency Score

To further analyze the regional distribution of E11 and E21, Figure 3 plots the map of E 11 and E 21 across the 30 regions, divided into four groups. The regions with inefficiency rankings between 1 and 5 are set as Group 1, regions ranking between 6 and 15 as Group 2, regions between 16 and 25 as Group 3, and regions with inefficiency rankings between 26 and 30 are set as Group 4. The groups are represented by a different shade of gray on the map. The regional distribution of E 11 and E 21 show different characteristic. Among the 30 regions, Chongqing, Shanxi Province, and Yunnan are the regions with the largest E11 and E21, meaning that both the source control and end-of-pipe treatment of SO2 is essential for those regions. The values of E 11 and E 21 in Beijing, Shanghai, Jiangsu, Guangdong, and Fujian were the smallest.
We also analyze the relationship between the inefficiency in NOx generation and NOx emission. Figure 4 plots the map of E12 and E 22 across the 30 regions. The regional distribution of E 12 and E 22 in China is similar, and the correlation coefficient between the values is up to 0.994. In particular, these regions need to greatly reduce the NOX in both the economic production sub-stage and the emission abatement sub-stage, and in a similar fashion. Among the 30 regions, Yunnan, Shanxi Province, Hebei, Heilongjiang, and Hainan show the largest values for both E 11 and E 21 , meaning that the source control and end-of-pipe treatment of NOX are both needed in these regions urgently.
We can address the regional distribution of E11 and E12 by comparing the left image in Figure 3 and Figure 4. The figures show that the regional distributions of inefficiency score of SO2 and NOx generation are rather different. Therefore, it is necessary to reduce SO2 and NOx using specialized technology in the economic production sub-stage, respectively. Similarly, we can also address the regional distribution of E21 and E 22 by comparing the right image in Figure 3 and Figure 4. The figures show that the regional distributions of inefficiency score of SO2 and NOx emission are rather different. Thus, it is necessary to differentiate the technology for reducing SO2 and NOx in the pollutant abatement sub-stage, as well.

4. Discussion and Conclusions

This paper contributes to the literature on efficiency analysis by proposing a new framework with two parallel divisions and two sub-stages after considering undesirable outputs, and we develop a non-parametric frontier model to evaluate the DMU’s inefficiency. The model allows us to build the best-practice efficient frontier based on observed input–output data without making explicit prioritization assumptions. The model also allows for greater flexibility and opens up a new path for the analysis of frontier models, and is not limited to the measurement of the inefficiency of economic production system. Furthermore, the inefficiency of the system can be decomposed into the inefficiency in different sub-stages, and further into the inefficiency of different divisions. In addition, the proposed framework can be applied to other complex systems after changing the variables and structure of the model.
Our application of the model to Chinese regional industrial production shows that, although relevant departments have made significant efforts toward environmental protection and management, cleaner production technologies and pollution control technologies still have a large potential for improvement in many regions. In most regions of China, the efficiency in the sub-stage of pollutant abatement is lower than in the sub-stage of economic production. In particular, in some eastern regions of China, the efficiency of pollutant abatement is low despite their rather developed economy. Hence, it is necessary to improve the target management of pollutant abatement and update the controlling goals. The government should encourage industries to adopt advanced techniques to eliminate most pollutants before they are discharged.
Although most regions are inefficient in both pollutant generation and pollutant abatement, the feasibility of synergistic pollutant reductions seems limited. The synergy effects in SO2 and NOx generation (emission) in the economic production sub-stage (emission abatement sub-stage) are infeasible. Therefore, it is indispensable to improve the source control target management and emission abatement for different kinds of pollutant simultaneously. Building sound systems for pollutant supervision and emission-reduction responsibility management is also essential for NOX. The inefficiency score can help DMUs understand their competitive advantage and provide a benchmark for subsequent efficiency improvement.
However, several aspects should be considered in future research. First, in this study, we assume that the sum of inefficiency in different sub-stages can obtain a global value for the system. Future research can relax this assumption and investigate the impact of different weights. Second, although the proposed model makes it easier for managers to make good decisions, the system of preference of decision makers and multi-objective production systems may also be considered. In addition, the functional relationship between sub-stages and divisions should also be investigated in detail. Although this research identified the main causes of inefficiency in the Chinese industrial production system, future research may discuss the industrial factors that affect regional inefficiencies as well.

Author Contributions

Y.S. participated in all phases of this work, including the establishment and application of the framework, as well as the paper writing. S.H. performed the modeling and revised the whole paper. All authors contributed to the experiment design, and have read and approved the final manuscript.

Funding

This work was supported by the National Natural Science Foundation of China (No. 71573251, 71103177) and the Fundamental Research Funds for the Central Universities (NO. FRF-TP-17-014A1). Professor Song Han’s work is supported by fund for building world-class universities (disciplines) of Renmin University of China.

Conflicts of Interest

The authors declare no conflict of interest.

References

  1. Sanz-Díaz, M.T.; Velasco-Morente, F.; Yñiguez, R.; Díaz-Calleja, E. An analysis of Spain’s global and environmental efficiency from a European Union perspective. Energy Policy 2017, 104, 183–193. [Google Scholar] [CrossRef]
  2. Lacko, R.; Hajduová, Z. Determinants of environmental efficiency of the EU countries using two-step DEA approach. Sustainability 2018, 10, 3525. [Google Scholar] [CrossRef]
  3. Song, M.; Zhang, J.; Wang, S. Review of the network environmental efficiencies of listed petroleum enterprises in China. Renew. Sustain. Energy Rev. 2015, 43, 65–71. [Google Scholar] [CrossRef]
  4. Chen, Y.; Cook, W.D.; Kao, C.; Zhu, J. Network DEA pitfalls: Divisional efficiency and frontier projection under general network structures. Eur. J. Oper. Res. 2013, 226, 507–515. [Google Scholar] [CrossRef]
  5. Guo, C.; Shureshjani, R.A.; Foroughi, A.A.; Zhu, J. Decomposition weights and overall efficiency in two-stage additive network DEA. Eur. J. Oper. Res. 2016, 257, 896–906. [Google Scholar] [CrossRef]
  6. Hampf, B. Separating environmental efficiency into production and abatement efficiency: A nonparametric model with application to US power plants. J. Product. Anal. 2014, 41, 457–473. [Google Scholar] [CrossRef]
  7. Bian, Y.; Liang, N.; Xu, H. Efficiency evaluation of Chinese regional industrial systems with undesirable factors using a two-stage slacks-based measure approach. J. Clean. Prod. 2015, 87, 348–356. [Google Scholar] [CrossRef]
  8. Lozano, S. Technical and environmental efficiency of a two-stage production and abatement system. Ann. Oper. Res. 2015, 255, 199–219. [Google Scholar] [CrossRef]
  9. Wu, J.; Zhu, Q.; Ji, X.; Chu, J.; Liang, L. Two-stage network processes with shared resources and resources recovered from undesirable outputs. Eur. J. Oper. Res. 2016, 251, 182–197. [Google Scholar] [CrossRef]
  10. Wilson, R. Architecture of power markets. Econometrica 2002, 70, 1299–1340. [Google Scholar] [CrossRef]
  11. Sueyoshi, T.; Goto, M. Operational synergy in the US electric utility industry under an influence of deregulation policy: A linkage to financial performance and corporate value. Energy Policy 2011, 39, 699–713. [Google Scholar] [CrossRef]
  12. Buonocore, J.J.; Lambert, K.F.; Burtraw, D.; Sekar, S.; Driscoll, C.T. An analysis of costs and health co-benefits for a U.S. power plant carbon standard. PLoS ONE 2016, 11, e0156308. [Google Scholar] [CrossRef] [PubMed]
  13. Klausbruckner, C.; Annegarn, H.; Henneman, L.R.F.; Rafaj, P. A policy review of synergies and trade-offs in South African climate change mitigation and air pollution control strategies. Environ. Sci. Policy 2016, 57, 70–78. [Google Scholar] [CrossRef] [Green Version]
  14. Zotter, K.A. “End-of-pipe” versus “process-integrated” water conservation solutions: A comparison of planning, implementation and operating phases. J. Clean. Prod. 2004, 12, 685–695. [Google Scholar] [CrossRef]
  15. De, V.K.; Weustenraad, J.; Nolf, C.; Wolfs, V.; De, M.B.; Shannon, K.; Willems, P. Green-blue water in the city: Quantification of impact of source control versus end-of-pipe solutions on sewer and river floods. Water Sci. Technol. 2014, 70, 1825–1837. [Google Scholar]
  16. Vezzaro, L.; Sharma, A.K.; Ledin, A.; Mikkelsen, P.S. Evaluation of stormwater micropollutant source control and end-of-pipe control strategies using an uncertainty-calibrated integrated dynamic simulation model. J. Environ. Manag. 2015, 151, 56–64. [Google Scholar] [CrossRef] [Green Version]
  17. Chen, L.; Wang, Y.-M.; Lai, F. Semi-disposability of undesirable outputs in data envelopment analysis for environmental assessments. Eur. J. Oper. Res. 2017, 260, 655–664. [Google Scholar] [CrossRef]
  18. Färe, R.; Grosskopf, S. Nonparametric productivity analysis with undesirable outputs: Comment. Am. J. Agric. Econ. 2003, 85, 1070–1074. [Google Scholar] [CrossRef]
  19. Chang, Y.T.; Park, H.S.; Jeong, J.B.; Lee, J.W. Evaluating economic and environmental efficiency of global airlines: A SBM-DEA approach. Trans. Res. Part D Transp. Environ. 2014, 27, 46–50. [Google Scholar] [CrossRef]
  20. Liu, W.; Zhou, Z.; Ma, C.; Liu, D.; Shen, W. Two-stage DEA models with undesirable input-intermediate-outputs. Omega 2015, 56, 74–87. [Google Scholar] [CrossRef]
  21. Sueyoshi, T.; Goto, M. Environmental assessment on coal-fired power plants in US north-east region by DEA non-radial measurement. Energy Econ. 2015, 50, 125–139. [Google Scholar] [CrossRef]
  22. Fukuyama, H.; Weber, W.L. A slacks-based inefficiency measure for a two-stage system with bad outputs. Omega 2010, 38, 398–409. [Google Scholar] [CrossRef]
  23. Lozano, S. Slacks-based inefficiency approach for general networks with bad outputs: An application to the banking sector. Omega 2016, 60, 73–84. [Google Scholar] [CrossRef]
  24. Bian, Y.; Yan, S.; Xu, H. Efficiency evaluation for regional urban water use and wastewater decontamination systems in China: A DEA approach. Resour. Conserv. Recycl. 2014, 83, 15–23. [Google Scholar] [CrossRef]
  25. Wu, H.-Q.; Shi, Y.; Xia, Q.; Zhu, W.-D. Effectiveness of the policy of circular economy in China: A DEA-based analysis for the period of 11th five-year-plan. Resour. Conserv. Recycl. 2014, 83, 163–175. [Google Scholar] [CrossRef]
  26. Sueyoshi, T.; Yuan, Y. China’s regional sustainability and diversified resource allocation: DEA environmental assessment on economic development and air pollution. Energy Econ. 2015, 49, 239–256. [Google Scholar] [CrossRef]
Figure 1. The economic production system with a multi-division network structure.
Sustainability 11 00980 g001
Figure 2. The multi-division and multi-stage production system.
Sustainability 11 00980 g002
Figure 3. Regional (provinces, autonomous regions, and municipalities) inefficiency in SO2 generation (left) and SO2 emission (right).
Sustainability 11 00980 g003
Figure 4. Regional (provinces, autonomous regions, and municipalities) inefficiency of NOx generation (left) and NOx emission (right).
Sustainability 11 00980 g004
Table 1. The inputs, intermediate variable, desirable outputs, and undesirable outputs in different stages and divisions.
TypeNameUnit
Economic production stage
InputsIndustrial fixed assets Billion RMB
Energy consumptionMillion tons of standard coal
Desirable outputIndustrial output valueBillion RMB
Intermediate variablesYield of industrial SO2Thousand tons
Yield of industrial NOXThousand tons
Pollutant abatement stage
SO2 abatement division
InputsOperational cost of desulphurization facilitiesMillion RMB
Number of desulphurization facilitiesSet
Undesirable outputEmission of SO2Thousand tons
NOX abatement division
InputsOperational cost of denitrification facilitiesMillion RMB
Number of denitrification facilitiesSet
Undesirable outputEmission of NOXThousand tons
Table 2. Statistical description of the main variables in 2012.
MeanS.D.MinMax
Industrial fixed assets945.69674.3172.022774.01
Energy consumption72.4848.168.49199.09
Industrial output value3032.363034.44179.9111870.55
Yield of SO21977.591231.49114.845004.97
Yield of NOX597.63372.4585.671338.19
Operational cost of desulfuration facilities1801.451471.56146.645613.81
Number desulphurization facilities698.93806.4716.003392.00
Emission of SO2637.19378.3933.041543.77
Operational cost of denitrification facilities220.10274.520.391111.55
Number of denitrification facilities27.8328.162.00126.00
Emission of NOX552.55341.4871.851238.17
Table 3. Inefficiencies of different stages and divisions in three areas.
E10E11E12E1E21E22E2Es
East0.36%38.31%26.47%65.14%67.56%33.24%100.80%165.94%
Central19.27%75.13%57.95%152.35%88.40%63.77%152.17%304.52%
West108.64%81.65%64.12%254.41%90.82%67.43%158.26%412.66%
All45.11%64.02%48.67%157.80%81.65%53.92%135.57%293.36%
Table 4. Hypothesis testing for inefficiency values of different stages in three major areas.
Chi-Squaredp-ValueHypothesis Test
E1012.0290.0024 ***Rejected
E1112.1640.0023 ***Rejected
E128.8690.0119 **Rejected
E117.7590.0001 ***Rejected
E2112.0050.0025 ***Rejected
E228.5210.0141 **Rejected
E28.8020.0123 **Rejected
Es17.7590.0001 ***Rejected
Note: *** denotes significance at the 1% level, and ** denotes significance at the 5% level.
Table 5. Statistical differences between the inefficiency of SO2 (NOx) generation and emission.
Null HypothesisZ-StatisticsSignificanceResult
E 11 = E 21 −3.4370.00 ***Rejected
E 12 = E 22 −0.9390.3478No rejected
Note: *** denotes significance level at the 1%.
Table 6. Statistical differences between waste gas and effluent abatement efficiencies in the stages of economic production and pollutant abatement.
Null HypothesisZ-StatisticsSignificanceResult
E11 = E122.8090.005 *** Rejected
E21 = E224.9380.000 ***Rejected
Note: *** denotes significance at the 1% level.

