Abstract
Tourists are in contact with two types of services at destinations: enterprise services offered by tourism enterprises (e.g., hotels, shops, restaurants, etc.) and public services (public transportation, public information, public safety, etc.) provided by the local government. Following Churchill’s (1979) procedures, a model of destination service encounters (DSEs), including four dimensions (i.e.,enterprise personal interaction encounters (EPIEs), enterprise physical environment encounters (EPEEs), public personal interaction encounters (PPIEs), public physical environment encounters (PPEEs), and 10 subdimensions, was constructed. Then, the effects of DSEs on tourist satisfaction (TS) were tested with data collected in Shaoshan Township, China. The results revealed that EPIEs, PPIEs, and PPEEs had significant positive effects on TS. This model promotes the application of service encounter (SE) theory in destination management, and it offers implications for the synergy management of public and private sectors at destinations to improve tourist experiences.
1. Introduction
In 2017, the total revenue of world tourism was $1.34 trillion, an increase of $94 billion over 2016, and the total number of international tourists reached 1.323 billion, an increase of about 84 million over the previous year, which is also the largest increase since 2010 [1]. The rapid growth of the tourism industry indicates that tourism has become an important way of life for people all over the world. There has been a significant increase of enterprise services and public services for individual tours. Tourist satisfaction (TS) contributes to the subjective well-being of tourists’ experience [2]. Exploring ways to improve TS, thereby increasing tourists’ subjective well-being, is of great significance.
In the service domain, the relationship between service encounters (SEs) and customer satisfaction is not a new topic of discussion. The term SE was introduced in the 1980s and has attracted intensive attention in the service marketing field [3,4]. SE adopts an interactive view to describe customers’ perceptions and service outcomes, such as satisfaction and dissatisfaction [5]. In SEs, customers’ encounters with service employees and service environment are the two main elements. In the service industry, services are produced and delivered by consumers’ encounters with frontline employees [6]. This kind of encounter is regarded as “the moment of truth”, which plays a critical role in customers’ perceived service quality and satisfaction [7]. As the place where service is generated, the service environment also impacts consumers’ perceived experience [8].
Similarly, tourism experiences are formed by tourists’ encounters with service employees [9]. Moreover, with the development of the tourism market from “sightseeing market”to “leisure market”and “personalized experience market”, tourists have higher requirements on the quality of tourism service environment, highlighting the importance of service environment at destinations. The SEs are significant predictors of TS [10]. Tourism scholars have suggested that environmental cues like noise, anxiety, ambience [11], facilities, and flora and fauna [12] at destinations significantly affect TS.
However, previous studies were conducted in the context of tourist attractions, or focused on a single aspect of service encounter at the destination. Their measurement of SEs cannot be directly applied to a destination context, which involves two service units (i.e., tourism enterprises and the local government) and two kinds of service encounters (i.e., encounters with the employees and service environment).
Therefore, the current study explored a destination service encounter (DSE) model adopting an encompassing manner, and tested its effects on TS. In the current study, Section 2 presents the concepts, dimensions, and effects of DSEs based on the previous literature. Section 3 details a five-step process of model development and validation, including item generation, content validity assessment, pilot testing, primary testing, and reliability and validity assessment. In Section 4, the conclusions and their implications are provided.
2. Literature Review
2.1. Conceptualization of DSEs
Over more than 30 years of development, the concept of SE has undergone an evolutionary process (see Table 1). In a narrow sense, SE refers to “the face to face dyadic interaction between a customer and a service provider” [5]. From this perspective, SEs are a combination of contact moments (i.e., moments of truth) between customers and service employees [13].

Table 1.
Relevant researches on the conceptualization of service encounter (SE).
Shostack [14] broadened the definition of SEs to customer’s interactions with any element of a service firm, including its service employees, physical environment, and other tangible and intangible factors. In reference to previous studies, DSEs are defined as tourists’ interactions with any element of a destination, including service employees, physical environment, and other tangible and intangible factors of tourism enterprises and the local government.
2.2. Dimensions of DSEs
Tourists typically interact with two types of services at destinations, i.e., enterprise services offered by tourism enterprises (e.g., hotels, souvenir shops, restaurants, etc.) and public services (e.g., public transportation, public information, public safety, etc.) provided by the local government [15]. Public services, as an overlooked dimension of SEs, have shown significant influence on tourist destination experiences [16,17,18,19], suggesting the need to incorporate them into the SEs framework. Thus, enterprise service encounters (ESEs) and public service encounters (PSEs) were incorporated in the DSEs model.
Furthermore, adopting the idea of Keng et al. (2007) [3] and Lin and Mattila (2010) [20], SEs are composed of tourists’ encounters with service employees and service environment, namely, personal interaction encounters and physical environment encounters. The personal interaction encounters are divided into employees’ attitude, expertiseand behavior [5,21,22], and PSEs incorporate ambient factorsand design factors [23]. As forPSEs, their dimensions and subdimensions are the same as ESEs, according to the results of literature review and interviews. Therefore, DSEs consist of two kinds of SEs (i.e., ESEs and PSEs), four dimensions (i.e., enterprise personal interaction encounters (EPIEs), enterprise physical environment encounters (EPEEs), public personal interaction encounters (PPIEs), public physical environment encounters (PPEEs)) and 10 subdimensions. The dimensional construct of DSEs is shown in Figure 1, and the specific explanation is seen in Section 2.2.1 and Section 2.2.2.
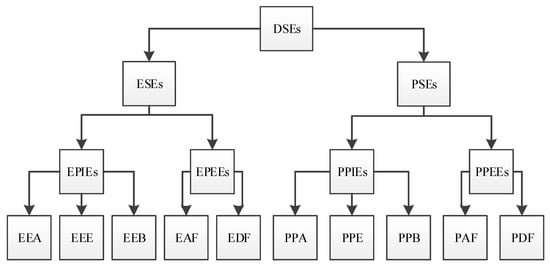
Figure 1.
The dimensional construct of destination service encounters (DSEs).
2.2.1. Enterprise Service Encounters
EPIEs. Personal interaction encounters refer to customers’ interactions with service employees over a period of time [24]. Interpersonal interactions between consumers and service employees were once recognized as the entire content of SEs [5]. In most service settings, customers interact with service staff as the service itself [25]. Only with the help of service employees can customers complete the service consumption process [26]. Personal interaction encounters have been recognized as an essential part of enterprise service encounters [4,20]. EPIEs at a destination are similar to encounters in restaurants and retail stores, which can be evaluated from employees’ attitudes, expertise, and behaviors [22].
EPEEs. Physical environment encounters refer to tourists’ interactions with physical facilities and other elements in a servicescape over a period of time [24]. Customers usually consume a service in a certain environment [8], and evaluate it based on their perceptions, thereby generating EPEEs. In previous research, EPEEs were captured as the essential constituents of ESEs [3,20]. At destinations, tourists interact with the physical environment of tourism enterprises, such as hotels, restaurants, and souvenir shops. Consistent with the study by Baker(1986) [23] and Bitner(1992) [8], ambient factors and design factors were incorporated into EPEEs.
2.2.2. Public Service Encounters
PPIEs. PPIEs were introduced based on the reality that tourists do interact with various public service personnel at destinations. In reference to the concept of EPIEs, PPIEs are defined as tourists’ interactions with public service personnel over a period of time, including civil servants in government departments and staff in tourism public service sectors. In the evaluation of public service quality, public servants are important components to be evaluated [19]. Similarly, public service personnel are important factors of tourism service evaluations at destinations. To evaluate tourists’ interactions with public personnel, attitude, expertise and behavior was selected as the three dimensions of PPIEs according to enterprise service researches and the results of interviews (see Section 3).
PPEEs. As the physical basis of public services, the public physical environment plays an important role in tourist experiences [18,19]. Referring to the definition of EPEEs, PPEEs are tourists’ interactions with physical facilities and other elements at a destination. At destinations, the public environment has been mentioned as a predictor of tourist perceptions and behavioral intentions. For example, tourists’ interactions with medical and educational services were proved to influence tourists’ willingness to pay at a destination [16]. Tourist information [27], public transportation [28], urban planning [29], and public safety [30] have also affected tourism development. According to enterprise service research and the results of interviews (see Section 3), the PPEEs are divided into ambient factors and design factors.
2.3. The RelationshipsBetween DSEs and TS
EPIEs and TS. In enterprises, frontline employees are the most important performers of services and influence customers’ evaluations and satisfaction significantly [20]. Attractive appearances, positive emotions, and helping behaviors of employees positively influence consumer satisfaction [31]. However, aloof, rude, and arrogant behaviors of staff negatively affect customer satisfaction [32]. Studies on destinations and the tourism industry have also revealed the positive effects of EPIEs on TS [11,20,33].
EPEEs and TS. In service encounters, the physical environment directly affects customer satisfaction [25]. According to environmental psychology, stimuli from the environment affect people’s emotional and behavioral responses [34]. A high-quality service environment can improve customer satisfaction and repatronage willingness [35]. The physical elements in the servicescape also have remarkable influences on TS [11].
PPIEs and TS. In researches on civil service reform [36] and competency management [37], the performance of public personnel has received much attention from scholars. Staff and volunteers have been also considered a dimension of performance quality at destinations [38]. Therefore, public service personnel are potential influential factors of TS at destinations.
PPEEs and TS. Empirical studies have revealed the significant influence of tourism public facilities (e.g., transportation) on TS [17,18,19]. Studies on destination image [39] and service quality [38] have also testified the effects of physical environment factors, such as transportation, signage, cleanliness, and comfort amenities, on TS. In a study on national parks, the author verified the positive effect of the service environment of the park (i.e., signs, symbol and artefacts, cleanliness, flora and fauna, space and function, and ambience) on TS [12].
Based on the above analysis, the following research hypotheses are proposed. The conceptual model are seen in Figure 2.
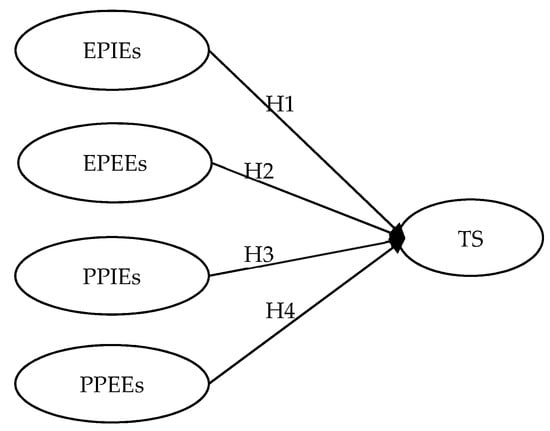
Figure 2.
Conceptual model and hypotheses.
- H1:
- EPIEs are a significantly positive predictor of TS.
- H2:
- EPEEs are a significantly positive predictor of TS.
- H3:
- PPIEs are a significantly positive predictor of TS.
- H4:
- PPEEs are a significantly positive predictor of TS.
3. Development and Validation of DSEs
3.1. Context and Procedures
The research was conducted in China. China had 5.01 billion domestic visits and 139 million inbound visits in 2017 [40], which stimulates great demand for tourism services at destinations. In particular, according to the China National Tourism Administration [41], there has been a significant increase of individual tours, with more than 85% being self-help trips and more than 60% of tourists travelling by car. The tourism competition in China has gone beyond the attractions themselves [41] and tourism services play an increasingly important role in the comprehensive competition among destinations.
However, the service systems at China’s destinations were constructed with little attention paid to tourists’ needs during service encounters. The supply of services cannot meet the expectations of tourists and lead to a low TS level. Moreover, tourism public services in China have become the subject of growing interest among researchers and managers [15,42]. Therefore, China was selected as the research context.
Following the guidelines of Churchill (1979) [43], the current study divided the development and validation process into 5 steps. The item generation of PSEs was conducted in step 1, which aimed at generating initial items through semi-structured interviews with tourists. In step 2, items of ESEs were generated based on previous studies, and the DSEs model was refined through content validity assessment. In step 3, the first purification of the model was conducted with data from thepilot test. In step 4, the second purification of the model was implemented with data from the primary test. Following step4, the fifth step tested the reliability and validity of the model using confirmatory factor analysis (CFA). Finally, the path relationships between DSEs and TS were examined through structural equation modeling by using AMOS 21.0.
3.2. Step 1: Item Generation of PSEs
Initial items can either be derived from previous studies or exploratory research, such as focus groups and interviews. As previous studies have explored tourism public service elements, but have not studied PSEs before, semi-structured interviews were adopted to generate the initial items.
3.2.1. Interview Preparation
The purposes of the interviews included (1) investigating interviewees’ perceptions of PPIEs; (2) exploring interviewees’ perceptions of PPEEs; and (3) exploring the effects of public service elements on TS at a destination. The interview outline (Appendix A) was adapted from Xu and Pan [15,42].
3.2.2. Interviews
The interviews were conducted in June of 2016 in Changsha, the capital of Hunan province, China. Most of the respondents were 20–30 years old. The vocations of the respondents were widely distributed among student, teacher, company employee, retiree, military personnel, and other fields (see Table 2). The respondents were found in the main scenic spots of Changsha. Before the interviews, there were short conversations between the investigators and respondentsto choose the interviewees, who had at least 2 travel experiences in 2016. Every interview lasted for at least half an hour and was recorded for the extraction of initial items.
Table 2.
Interviewees’ basic information.
3.2.3. Interview Data Coding
Following the recommendations of Cabiddu et al. [44] for coding procedures, a four-step coding system was adopted. First, PPIEs and PPEEs were selected as the dimensions to help form the interview outline. Second, two researchers of the study and one doctoral student coded sentences as part of interview transcription. Friendly, clean, fresh, unique, and other elements emerged as initial codes to characterize the units of text. During the coding process, when a new code was created, its meaning and parameters were documented by coders [45]. By step-and-repeat operation, the code structure was iteratively updated and refined.
In the third step, through repeat comparisons between new data and previously coded transcripts, coders added or transformed codes to improve the code structure [46]. When the new codes stopped to emerge, it suggested that theoretical saturation had been reached [46]. Finally, all of the documented codes were examined and similar codes (items) were merged into one until the code structure became smaller and more parsimonious.
In order to ensure the objectivity and accuracy of the coding results, back-to-back coding (double-blind coding) was adopted. The confusion matrix of Marques and McCall (2005) [47] was used to check the inter-rater reliability, and the number of valid items obtained was 298. The inter-rater reliability of this coding is 244/298 = 81.9%.
3.3. Step 2: Item Generation and Content Validity Assessment
According to the results of interviews and the literature review, an initial pool incorporating 49 items was constructed (see Table 3). In the initial item pool, EPIEs incorporated 9 items derived from [22], EPEEs encompassed 16 items adapted from [48], PPIEs consisted of 10items obtained from the previous literature and interviews, and PPEEs comprised 14 items from the previous literature and interviews.A two-step content validity assessment was then conducted. In the first step, five doctoral students were invited as judges to classify the items in each construct. The definition of each construct was explained, and the classifying procedure was illustrated to the judges before the work began. If four or five of the judges considered an item not to belong to any construct, then the item was deleted.
Table 3.
Sources and descriptions of the initial item pool.
In the second step, another five judges, who were faculty members of tourism, hospitality, and marketing departments at destinations, were invited to rate the representativeness of the items under each construct. The judges were asked to label each item using a 3-point scale (not representative, somewhat representative, or clearly representative). Similarly, the definition of each construct was first explained to the judges. If more than three judges affirmed that an item was clearly representative of a construct, and no judges denied the conclusion, then the item was kept; otherwise, it was deleted. Through content validity assessment, six items (B12, B15, C4, C5, D6, D9) were deleted, thus eventually forming an item pool consisting of 43 items.
3.4. Step 3: Pilot Surveys
Pilot surveys were conducted in Changsha. A total of 250 questionnaires were distributed to visitors in scenic spots of Changsha in June 2016, 210 of which were returned. For this investigation, convenience sampling was adopted. People answered how strongly they agreed with the 43 items of SEs based on the destination that they most recently visited by using a 5-point Likert-type scale (1 = strongly disagree and 5 = strongly agree). To ensure the data quality, a question was firstly asked regarding whether the respondents had experienced all of the types of tourism services at the destination. The scale of tourist satisfaction wasfrom Hutchinson et al.(2009) [49].Additionally, an expectation maximum (EM) was adopted to address data missing from the survey data matrix [50].
Among the 210 respondents, there were 95 females (45.2%) and 115 males (54.8%), and 83.4% of them were aged from 15 to 44 years old. Most of the respondents (86.2%) received high school or higher education. As students accounted for a large proportion (31.9%) of the respondents, 31.9% of the respondents have no income and 43.8% of them earned 1001–5000 RMB per month, on average, before tax.
According to the normality test criterion suggested by Chen and Petrick (2014) [51], it is indicated that there was no violation to the normality assumption as the skewness and kurtosis of most items were in the interval of −1 to 1. Though the absolute values of skew and kurtosis indices of item D2 slightly exceeded 1, they were still under the threshold of 3 and 8, respectively, suggesting that the univariate normality was not extremely violated.
Exploratory factor analysis (EFA) was used to purify the four dimensions (EPIEs, EPEEs, PPIEs, and PPEEs) of DSEs. Before EFA, Kaiser-Meyer-Olkin (KMO) measurements for testing the sampling adequacy and Bartlett’s test of sphericity for examining correlations among items were conducted by using SPSS software, version 21.0. The results showed that the KMO values of the four dimensions were 0.905, 0.886, 0.931, and 0.921, respectively, and Bartlett’s test was significant at the 0.05 level, suggesting the appropriateness to conduct EFA.
For EFA, factors were extracted based upon the rule of eigenvalues greater than the 1.0 threshold and scree testing as recommended by Cattell (1966) [52]. In addition, items were considered to be deleted if (1) the greatest factor loading of an item was less than 0.40 or (2) the difference between the factor loadings of an item on different dimensions was less than 0.10.
For EPIEs, three factors were extracted from the construct and explained 78.1% of the variance. The factor loadings ranged from 0.552 to 0.850. The Cronbach reliability coefficient was 0.918, which exceeded the criterion of 0.70 recommended by Hair (2006) [53].
For EPEEs, two possible dimensions were extracted from the scale and explained 59.1% of the variance. The factor loadings were in the range of 0.490 to 0.862, and items B5 (the background music is appropriate), B8 (the physical facilities in the enterprises are comfortable), and B10 (the signs used in enterprises are helpful to me) were considered for deleting, due to their close factor loadings in two dimensions. A second EFA without the three items found that the deletion increased the explained variance and part of the items’ factor loadings, but it decreased the reliability coefficient. It was ultimately decided to keep these items for further purification. The Cronbach reliability coefficient reached the recommended level with a value of 0.914.
For PPIEs, three possible dimensions were extracted and explained 88.5% of the variance. The factor loadings were between 0.611and 0.903, and item C5 (The public service personnel are able to respond quickly to my needs) was considered for deletion due to its close factor loadings on two dimensions. Similar to B5, B8, and B10, C5 was finally kept for the primary test. The Cronbach reliability coefficient was 0.961. For PPEEs, two dimensions were extracted and explained 66.9% of the variance. The factor loadings were in the range of 0.561 to 0.842, and no items were removed. The Cronbach reliability coefficient was 0.938.
3.5. Step 4: Primary Survey
Primary data were gathered in Shaoshan Township, the hometown of Chairman Mao Zedong in Hunan province, China, which attracted 20.52 million visits in 2017 [54]. In Shaoshan, public service providers are non-profit organizations, including government departments (e.g., the tourism development commission), free of charge scenic spots (e.g., the former residence and the memorial hall of Chairman Mao Zedong), and providers of local public infrastructure. The enterprise service providers include hotels, restaurants, travel agencies, for-profit scenic spots, souvenir shops, etc. In Shaoshan, both enterprise and public service encounters occur frequently, especially on festivals, holidays and over weekends.
A total of 600 questionnaires were distributed in Shaoshan from July 1 to August 1, 2016, including two weekends and two festivals for red tourism in China. Systematic random sampling was conducted. Questionnaires were distributed to every fifth tourist based on the queues at major scenic spots in Shaoshan and seat numbers on tourist-dedicated trains from Shaoshan.
A total of 457 copies of questionnaires were returned, with a response rate of 76.17%. As shown in Table 4, among the 457 respondents, female (48.6%) and male (50.8%) were close, and a majority of respondents (80.2%) aged from 15 to 44 years old. Most of the respondents (85.7%) received high school or higher education, and 76.6% of the respondents earned less than 5001 RMB per month on average. In addition, a large proportion of the respondents were students (28.7%) and enterprise staff (20.1%). According to the descriptive statistics of all the items in primary survey and the criterion proposed by [51], the univariate normality was not extremely violated.
Table 4.
Sample characteristics of primary survey.
A second EFA was performed with the primary data. The KMO values for each construct were 0.938, 0.942, 0.937, and 0.946, respectively, and Bartlett’s test was significant at 0.05 level, indicating the appropriateness to conduct EFA. Special attention was paid to the items with cross-factor loadings in the first EFA. The results showed that only C5 encountered the same problem again, andwas ultimately deleted, while the other items were kept.
3.6. Step 5: Reliability and Validity Assessment
In this step, Cronbach’s coefficient was used to test the factors’ reliability andconfirmatory factor analysis (CFA) was conducted to test the validity of the DSEs model. Additionally, common method variance (CMV) was examined through the chi-square statistic comparison [55] in order to avoid type I and II error.
3.6.1. Reliability
The results of Cronbach’s coefficient showed that all of the factors had reached the criterion of 0.70. In addition, the composite reliability (CR) and average variance extracted (AVE)values (see Table 5) achieved the recommended criterion of 0.70 and 0.50, respectively, demonstrating strong indicator reliability.
Table 5.
Results of confirmatory factor analysis (CFA) with primary data.
3.6.2. Structural Validity
Structural validity incorporates convergent validity and discriminant validity. The results of CFA (see Table 5) showed that all of the items’ standard loadings exceeded the threshold of 0.70 [53] and the T values were greater than the cut-off value of 2.57 [56], supporting convergent validity. Additionally, AVEs reached the suggested standard of 0.50 by ranging from 0.57 to 0.87, together with the square root of AVEs for each factor being greater than its correlations with other factors, proving discriminant validity.
3.6.3. Common Method Variance
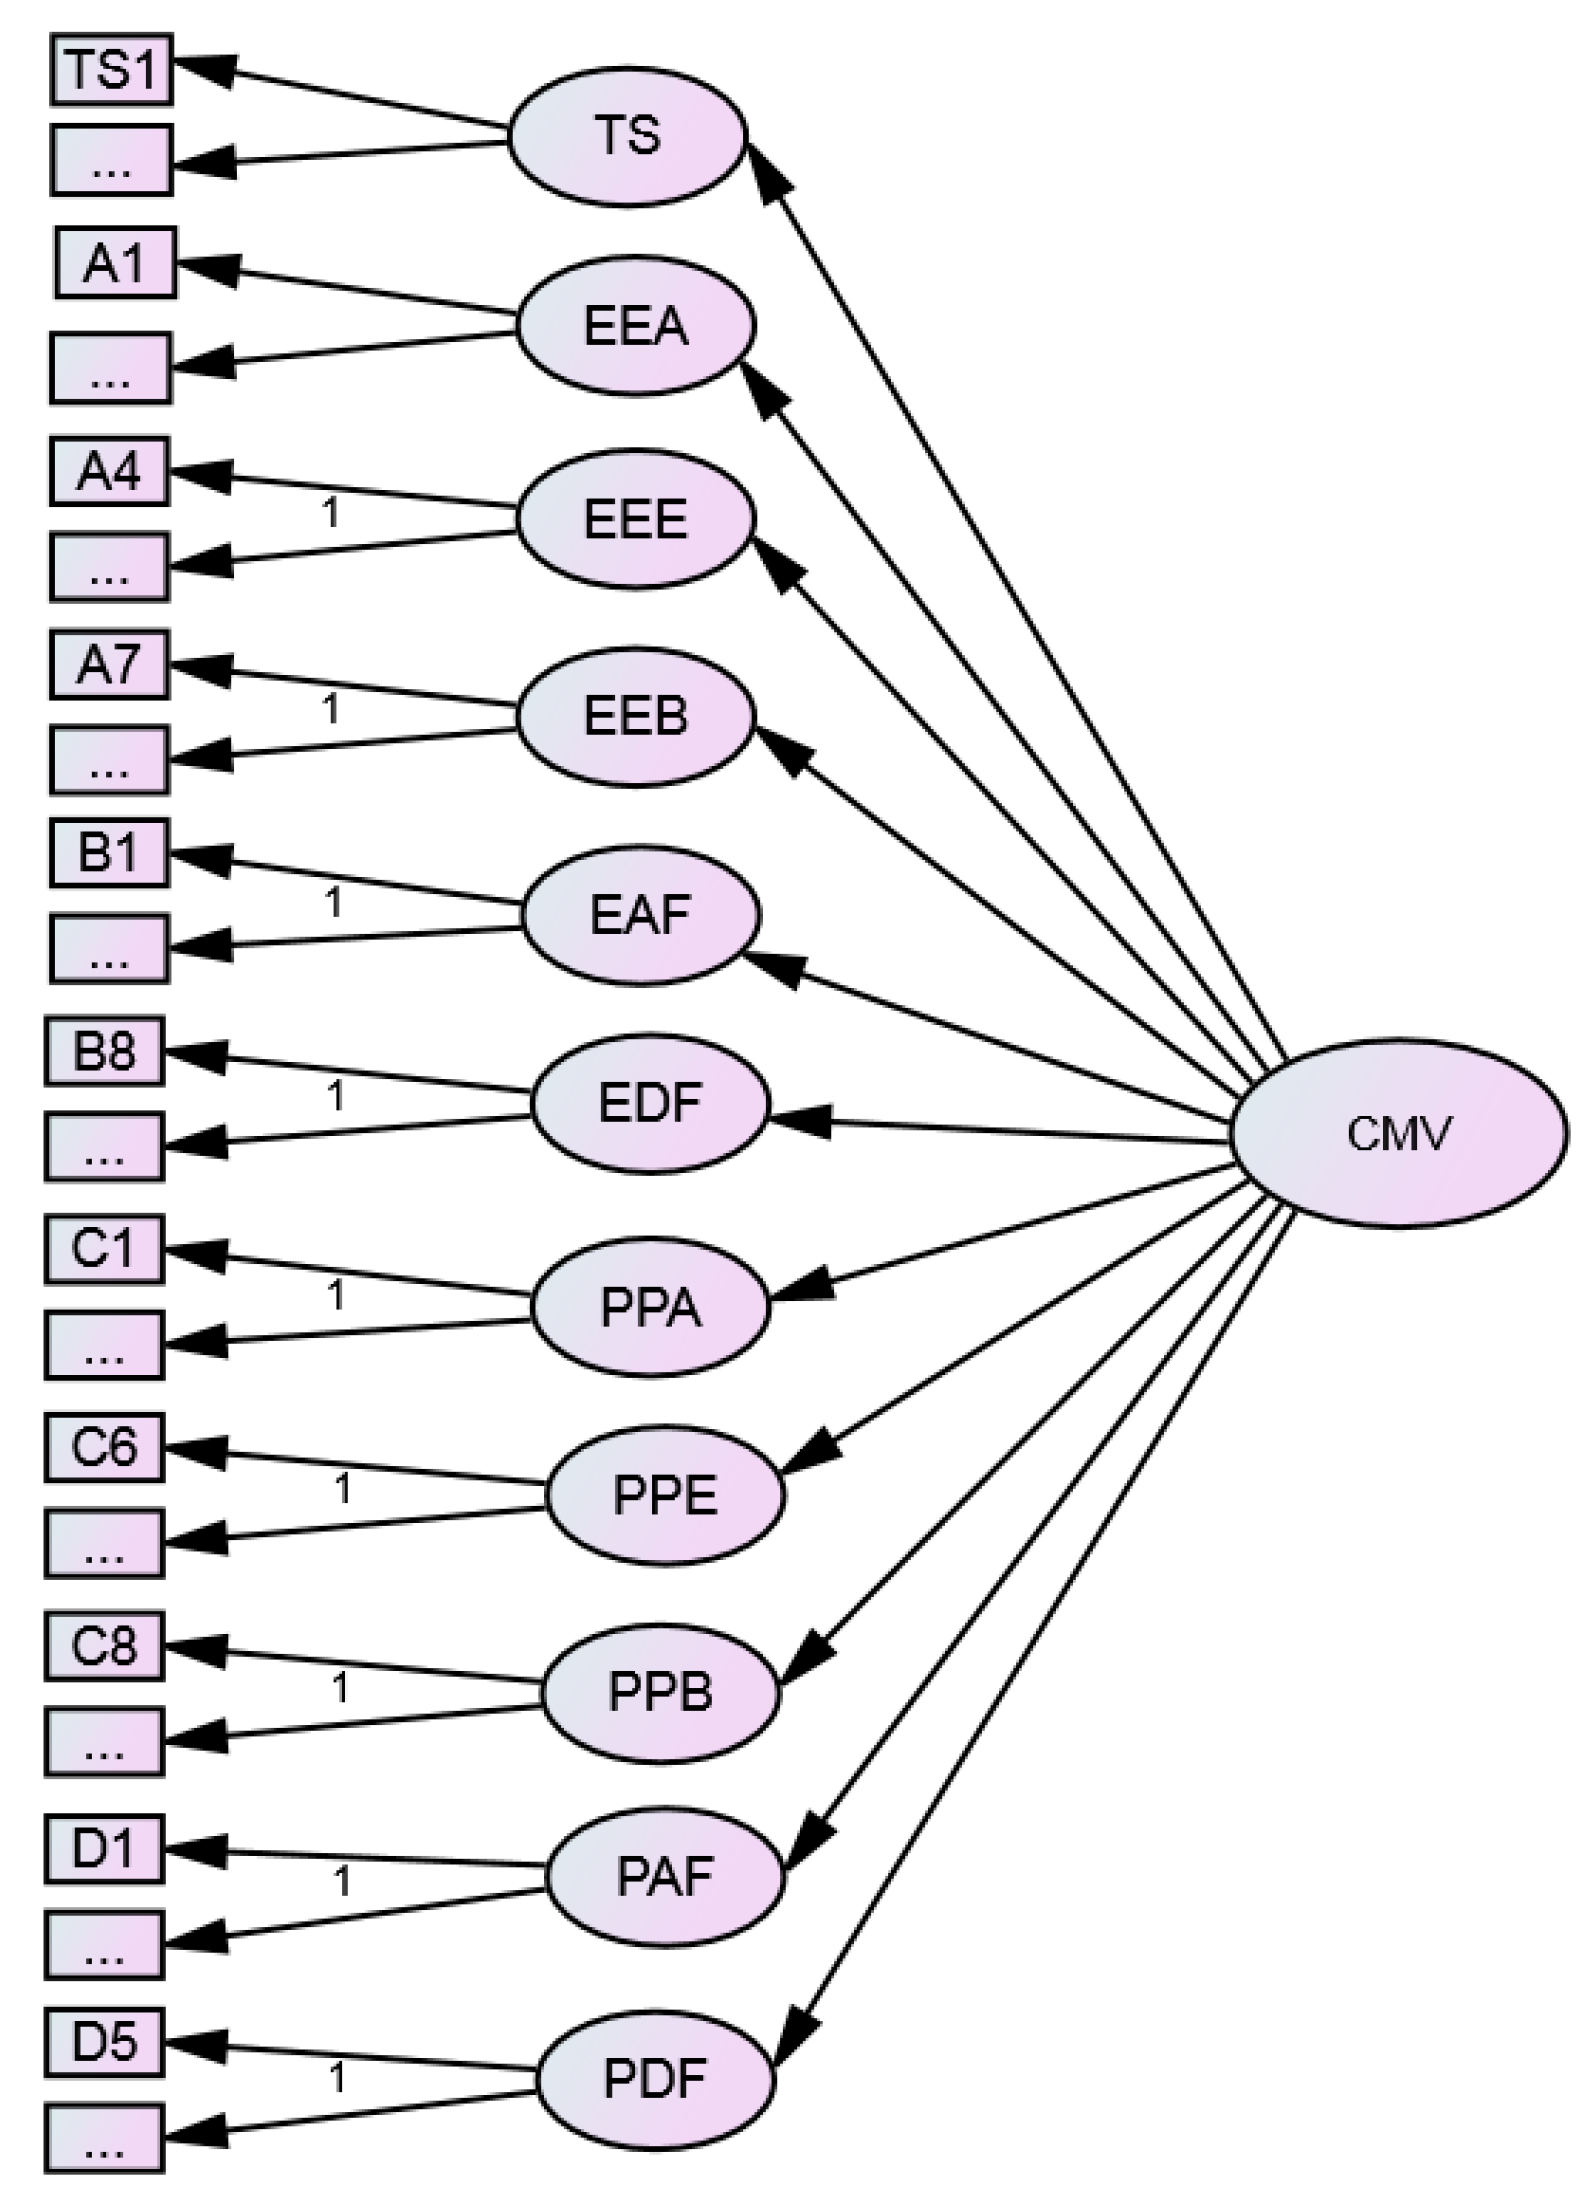
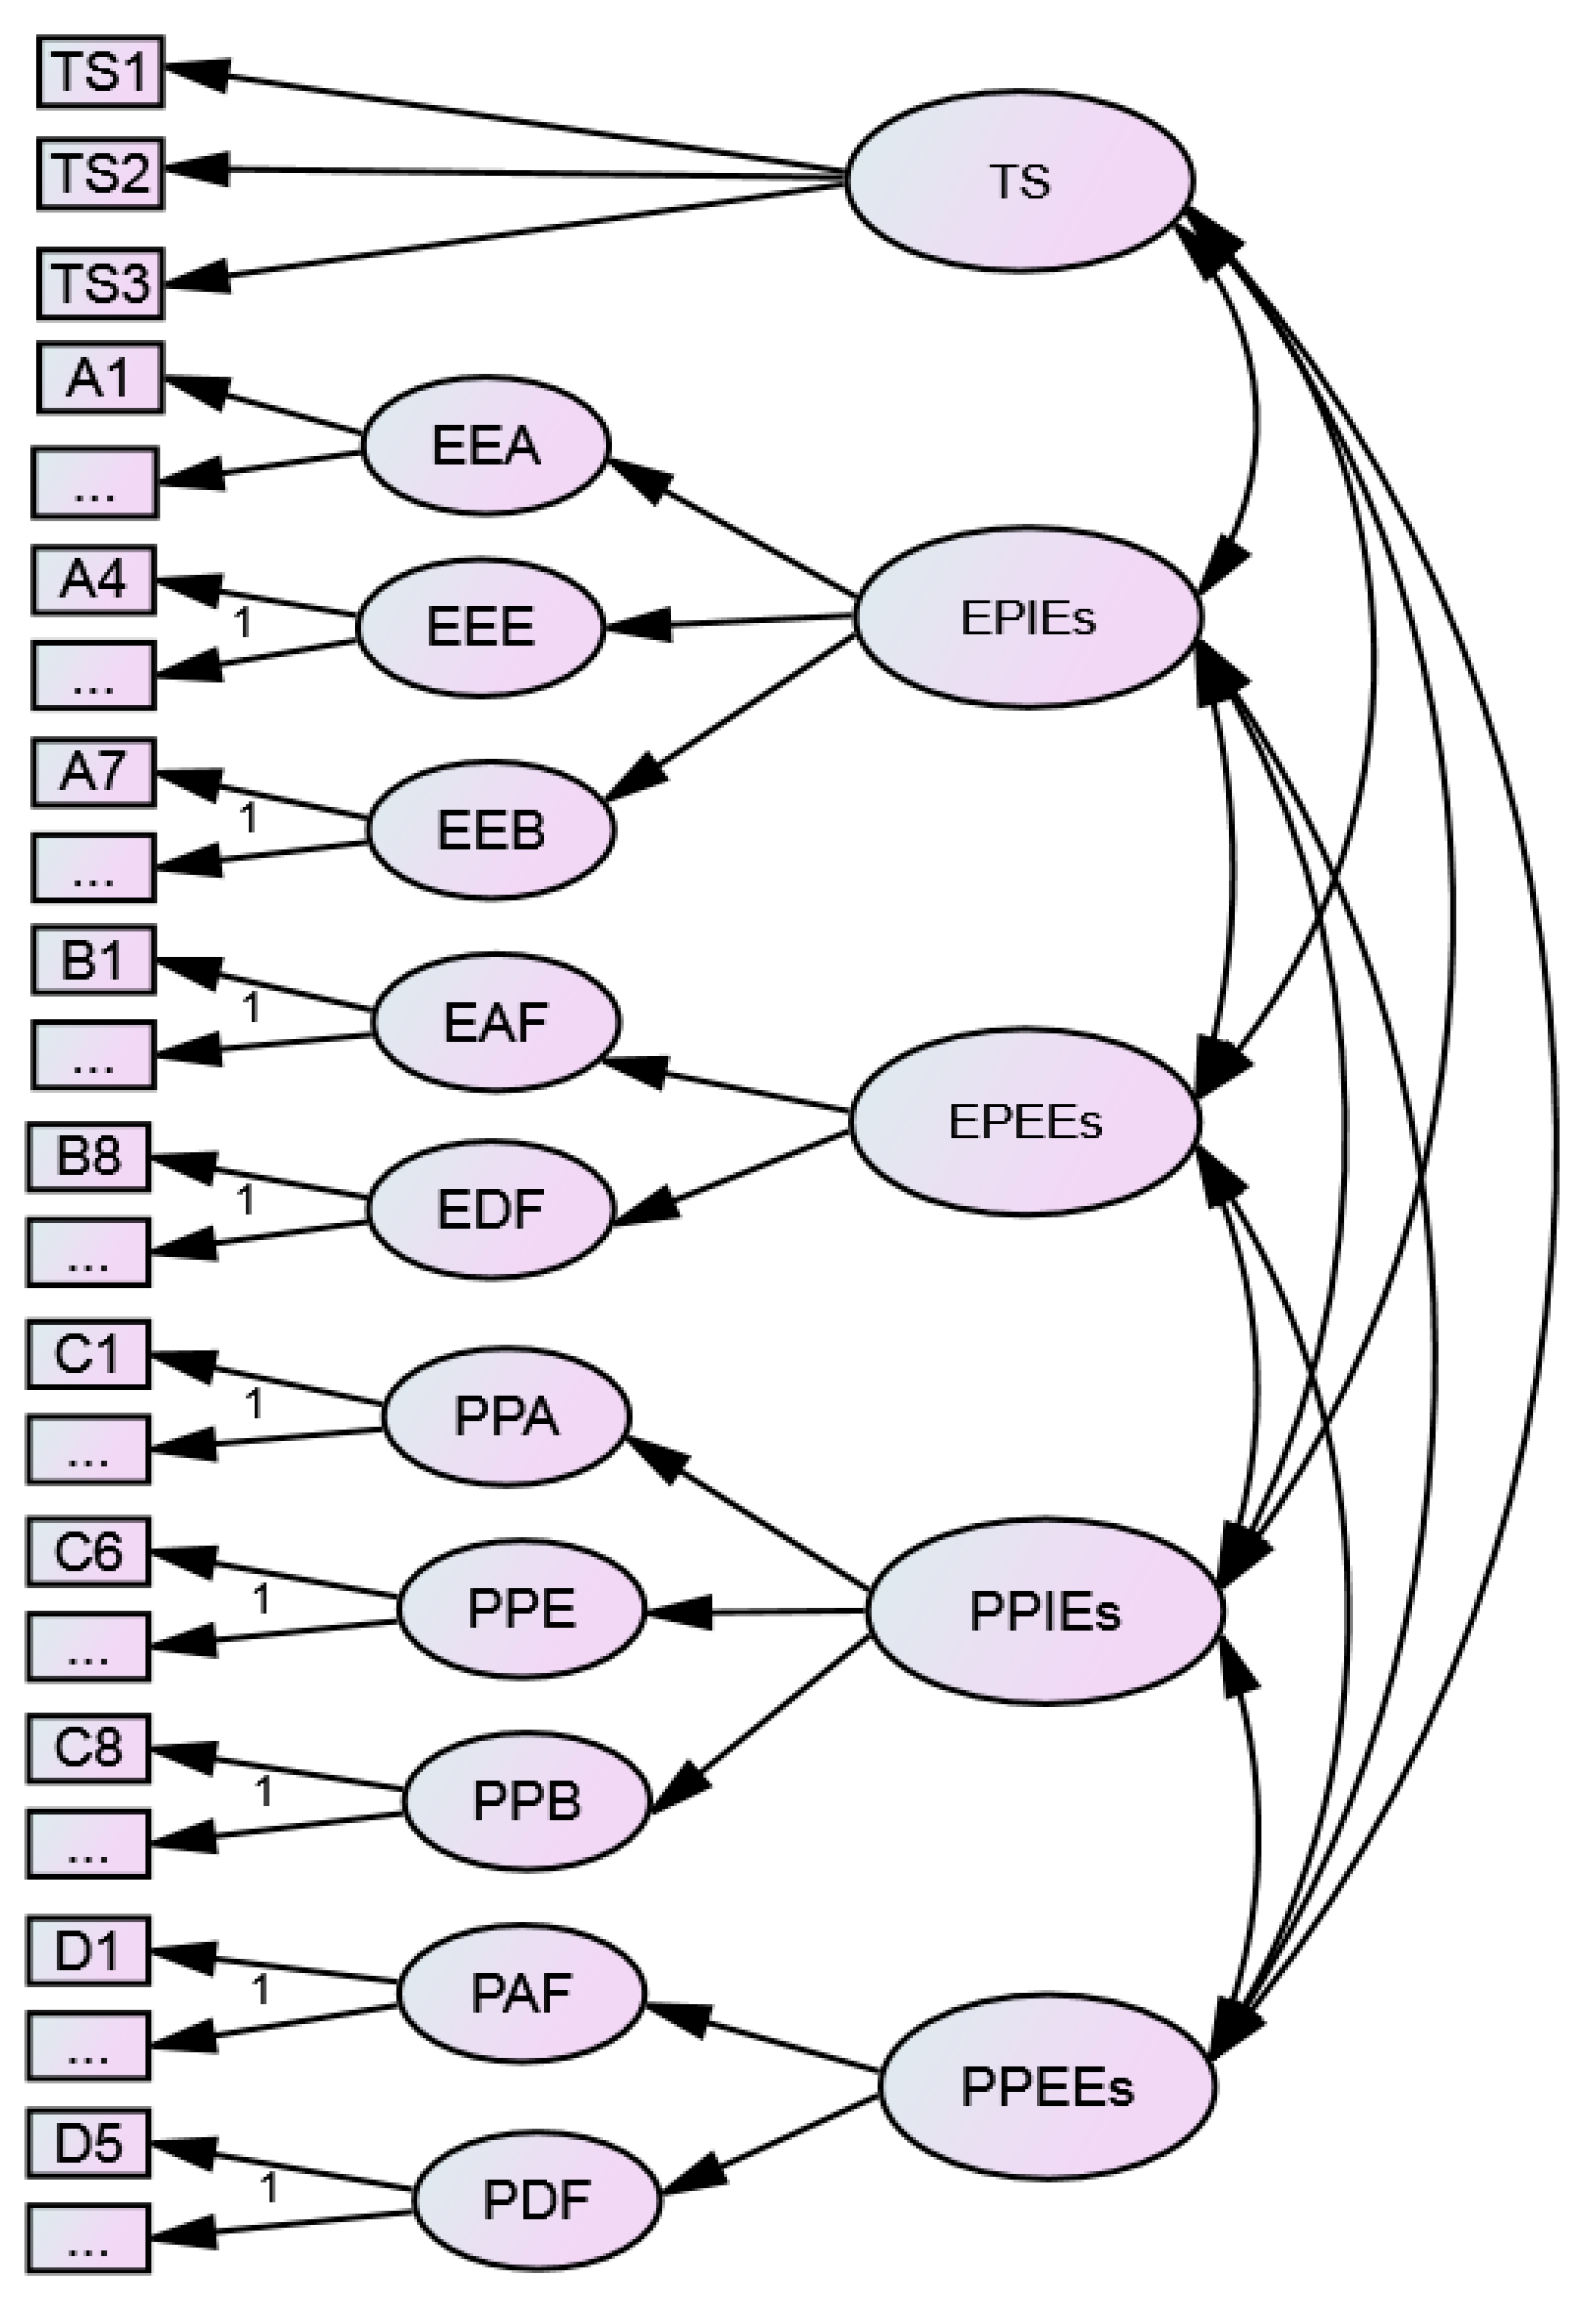
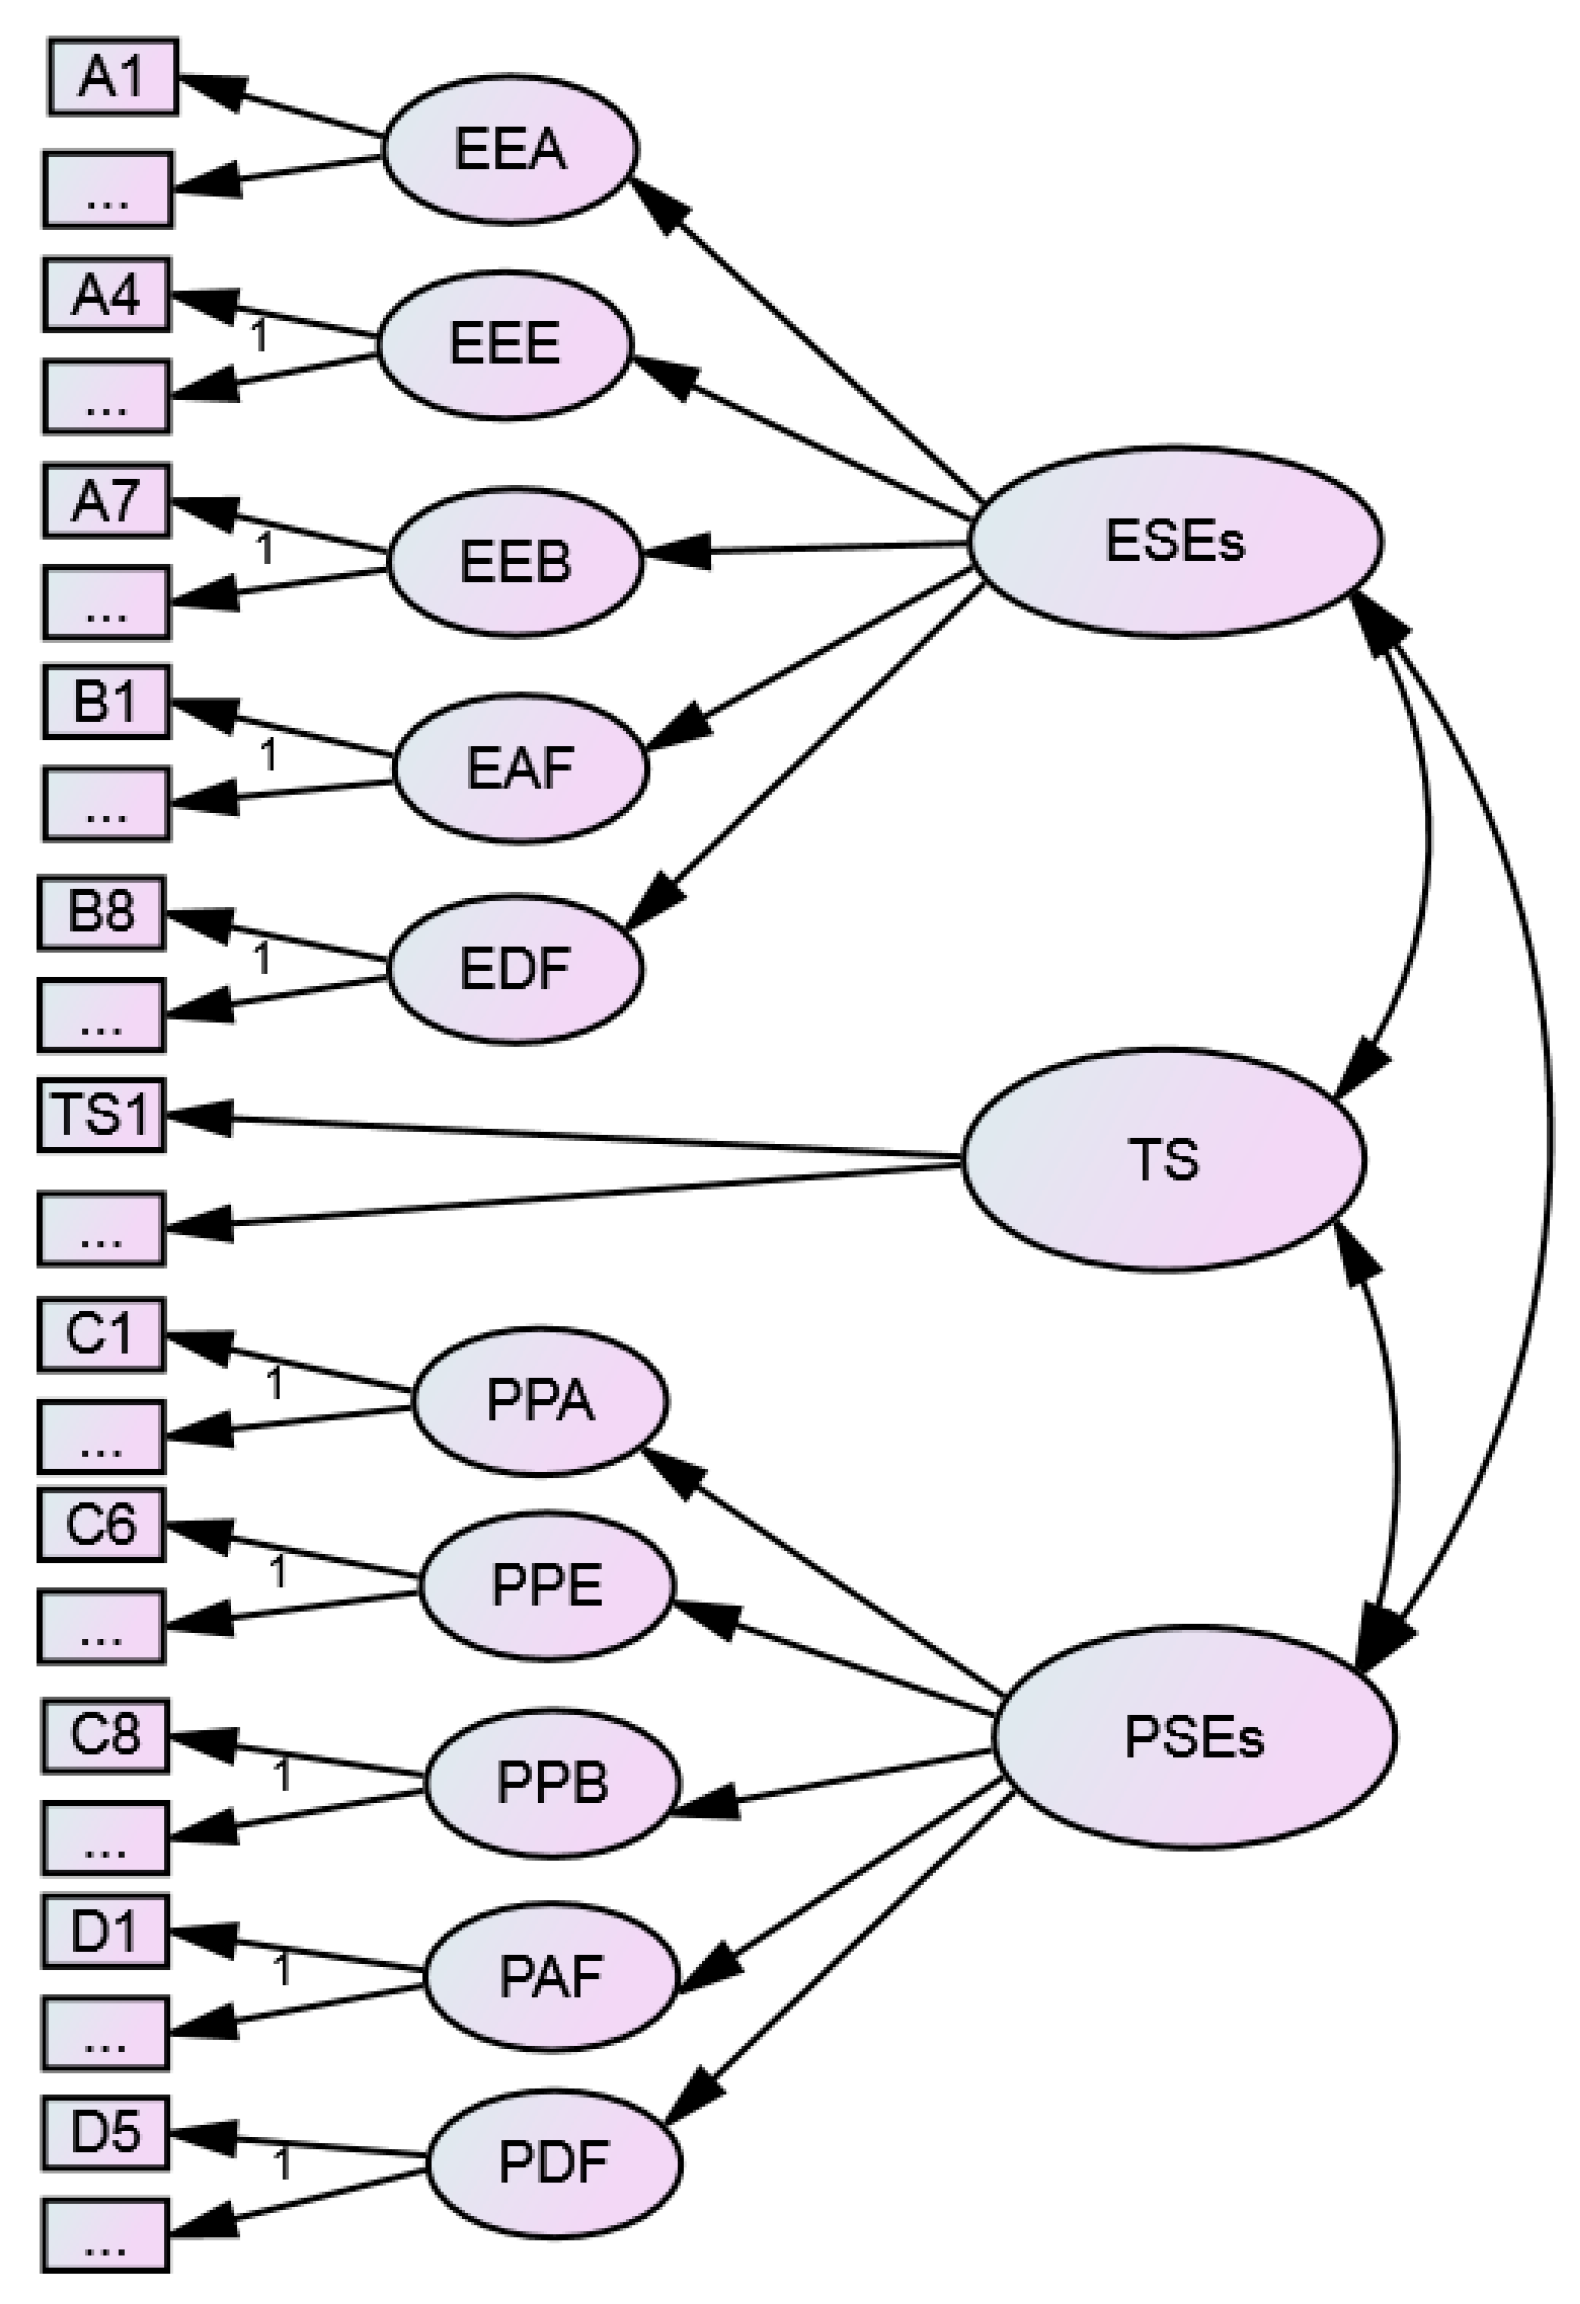
To examine the CMV, four confirmatory factor models (Figure 3, Figure 4, Figure 5 and Figure 6) were constructed: (1) one-factor model (Model A); (2) two-factor model (Model B); (3) three-factor model (Model C); and (4) five-factor model (Model D).
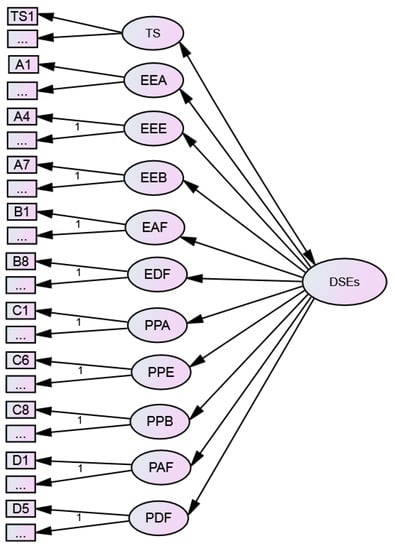
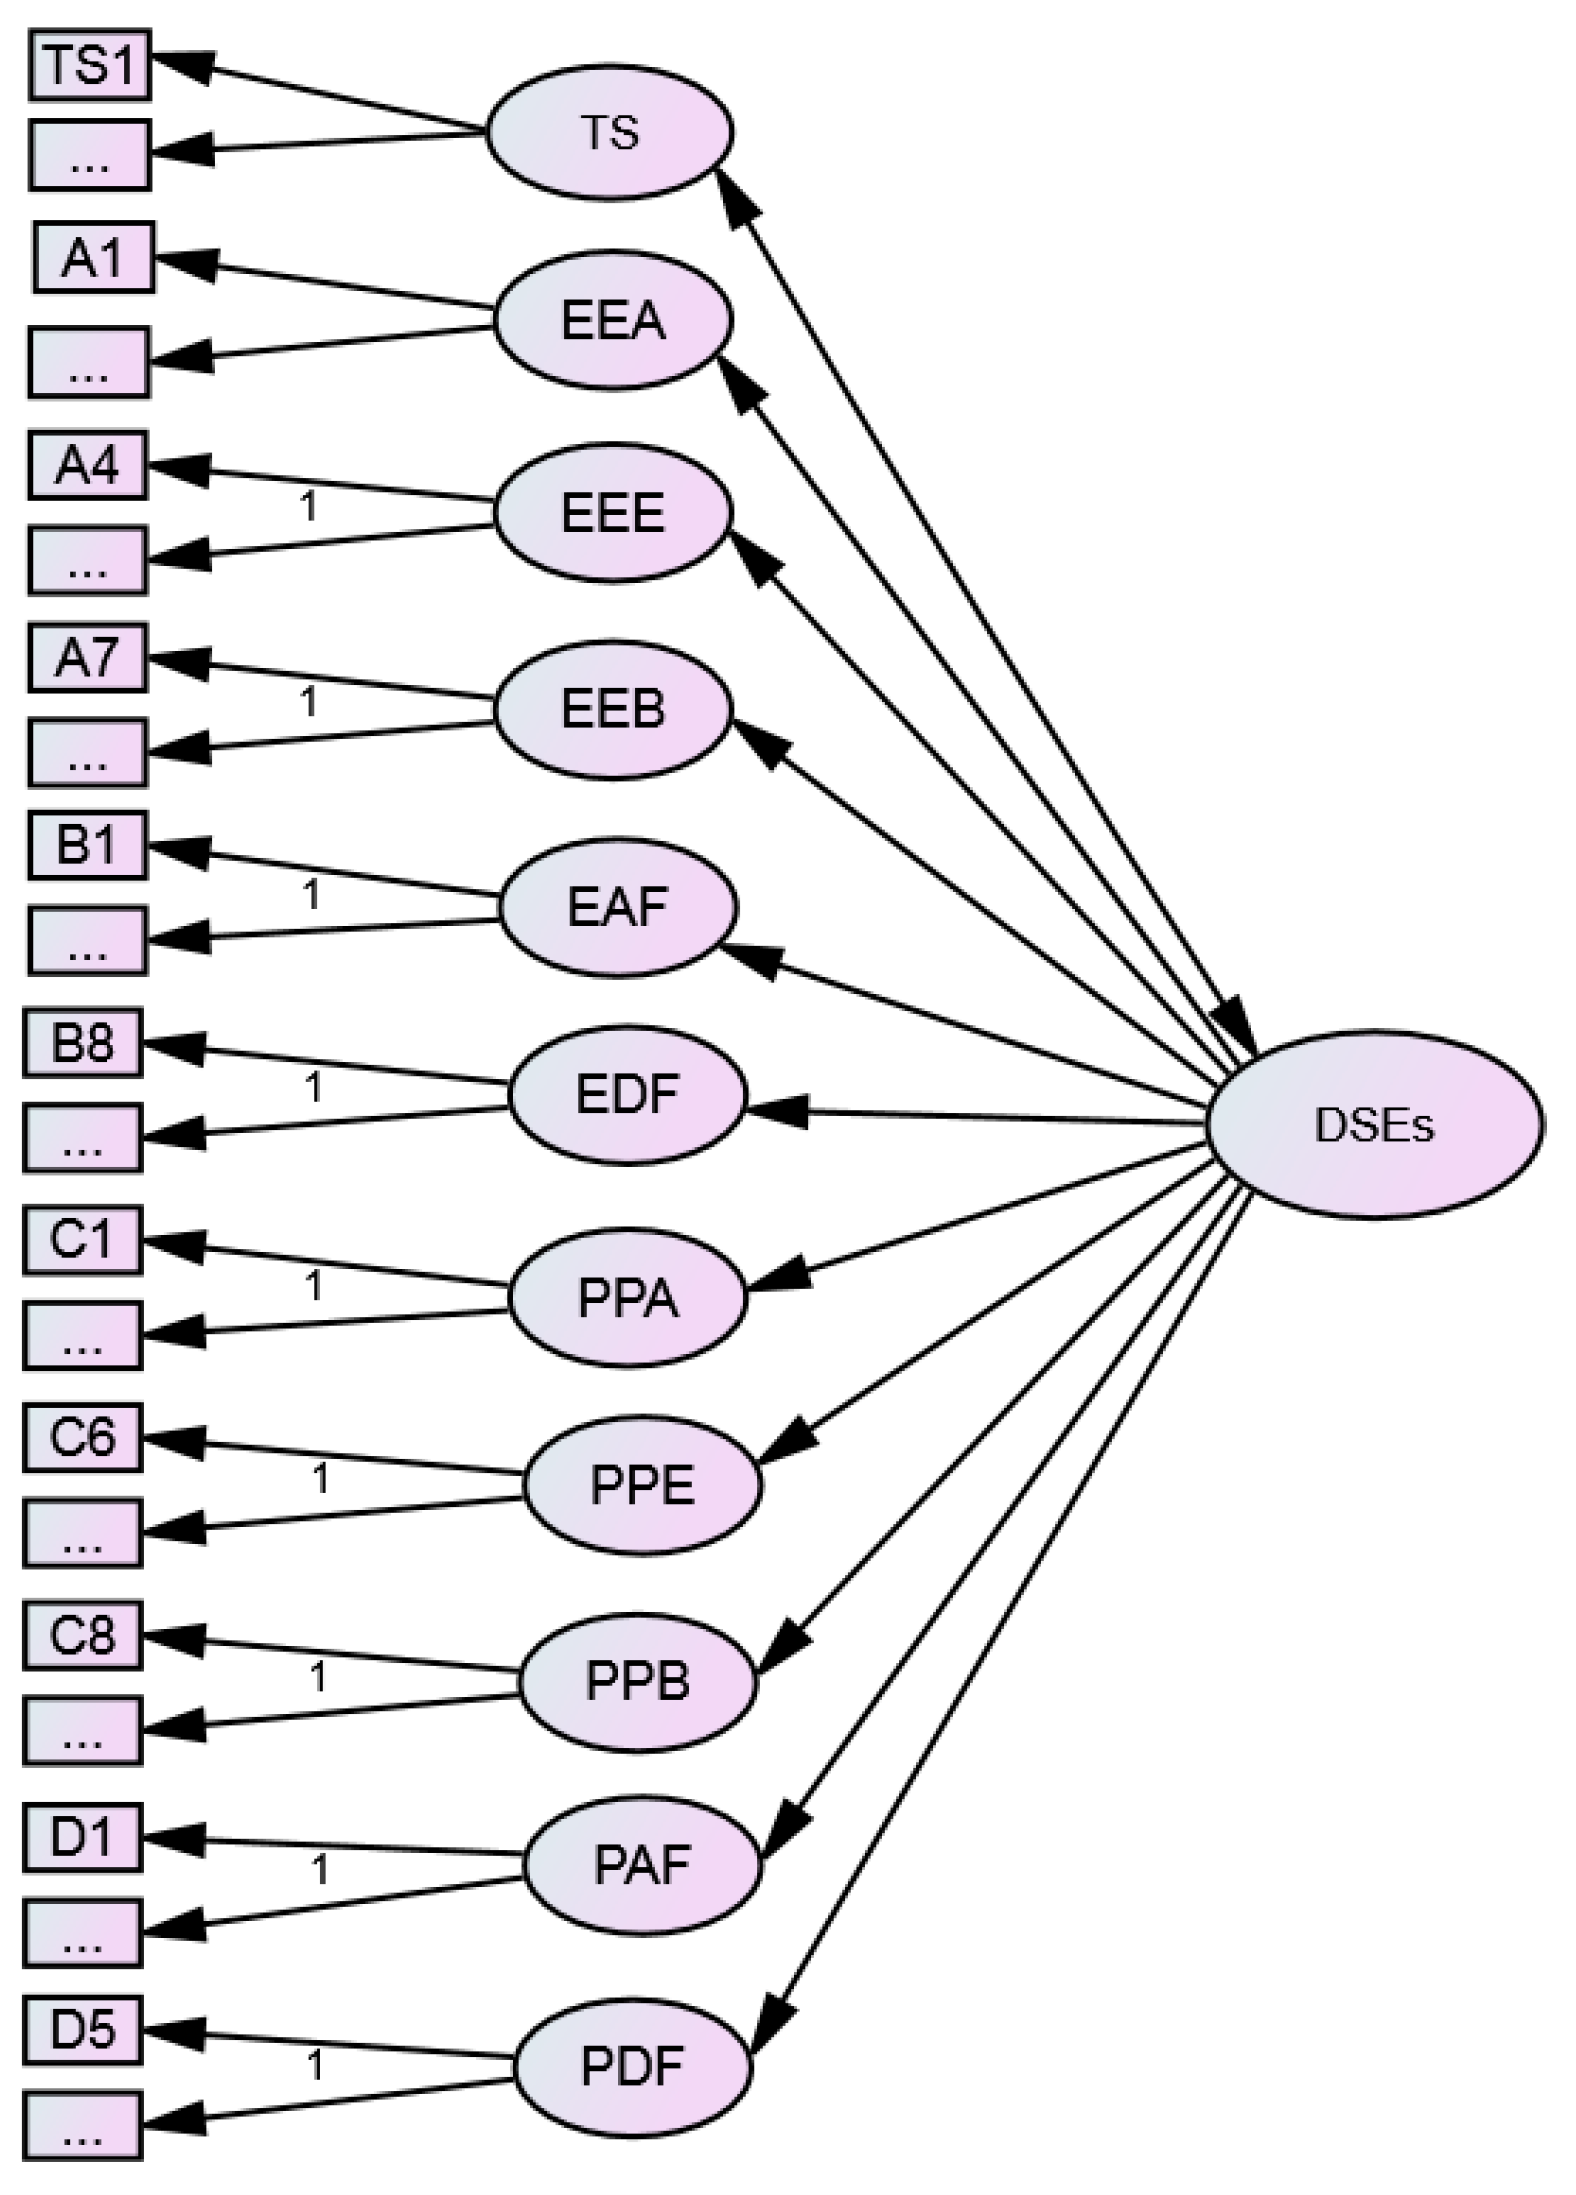
Figure 3.
One-factor model (Model A).
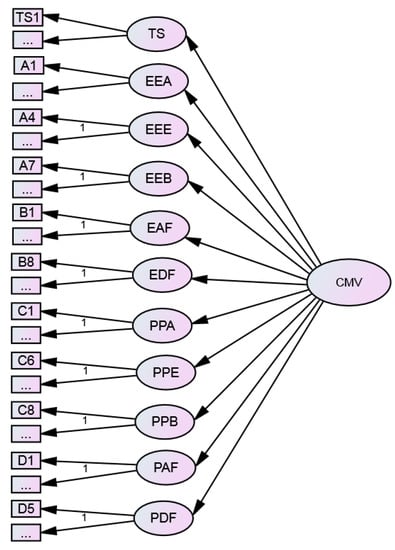
Figure 4.
Two-factor model (Model B).
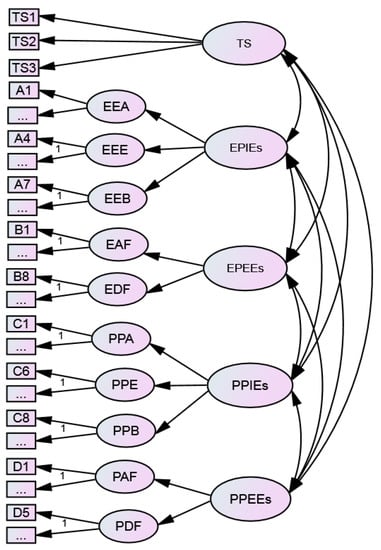
Figure 5.
Three-factor model (Model C).
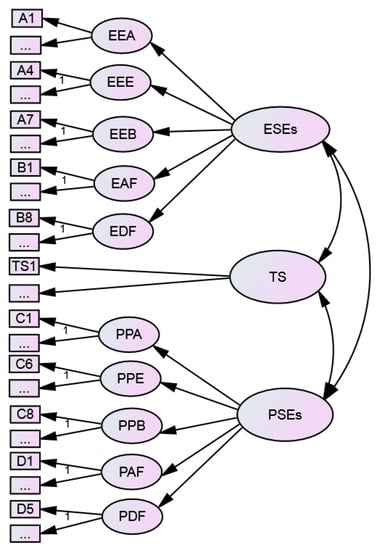
Figure 6.
Five-factor model (Model D).
Following the suggestions of So et al. (2012) [57], goodness-of-fit indices, including χ2, df, χ2/df, goodness-of-fit index(GFI), comparative fit index(CFI), Tucker–Lewis index(TLI), normed fit index(NFI), root mean square error of approximation(RMSEA), and standardized root mean square residual(SRMR), were used to measure the model fit. The goodness-of-fit of the four models were shown in Table 6. Selecting Model D as the baseline model, the model fit of models A, B, C, and D were compared. It turned out that Model D presented the best model fit, with lower df, χ2/df, RMSEA, and SRMR, and higher GFI, CFI, TLI, and NFI. Regarding the GFI value, when the CFI value of a model is greater than 0.9, the threshold value of GFI can be lowered to 0.85 [58]. Additionally, the χ2 between Model D and the other three models was significant at 0.001 level, indicating the obvious difference between the four models and no serious common method deviation. Furthermore, the comparisons among the four models helped select model D as the best DSEs model.
Table 6.
Goodness-of-fit measures of the four models.
Through development and validation procedures, the DSEs model, including 4dimensions, 10subdimensions, and 42 items, was constructed. The framework remained unchanged (see Figure 1), and one item (C5) was removed from the original model.
3.7. The Effects of DSEs on TS
To test the effects of DSEs on TS, path analysis of structural equation model was used to examine the causal relationships between DSEs and TS(see Figure 7). The results indicated that the model fitted well with the data (χ2 = 106.94, df = 55, χ2/df = 1.94, GFI = 0.97, CFI = 0.99, TLI = 0.99, NFI = 0.98, RMSEA = 0.046, SRMR = 0.018). Among the four dimensions, PPEEs (P < 0.001), PPIEs (P < 0.01), and EPIEs (P < 0.01) were positively associated with TS, while EPEEs (P = 0.104) showed no significant influence on TS. Therefore, H1, H3, and H4 were supported by the data, while H2 was not verified. As to the influence of the dimensions on TS, PPEEs were the most significant one (β = 0.693, CR = 8.286), followed by PPIEs (β = 0.176, CR = 2.652) and EPIEs (β = 0.153, CR = 2.656).
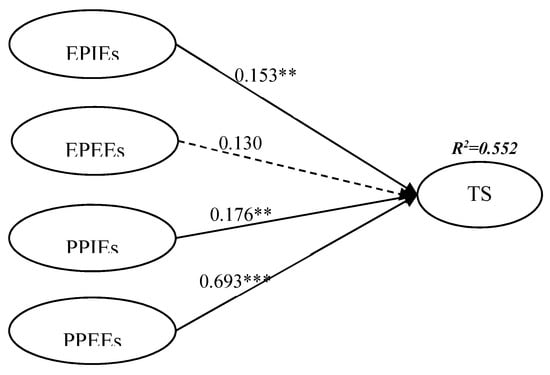
Figure 7.
Results of hypothesis testing.
4. Conclusions and Implications
4.1. Discussions
Firstly, SE theory was applied to a destination context. Previous studies about SEs focused on retail stores [3], restaurants [20], stadiums [48], tourist attractions [33], and farms [11]. SEs in these places only involve services provided by enterprises, without considering public services offered by the government. The current study explores a DSEs model in the destination context and emphasizes public services in the service process. In most past research concerning destinations, discrete elements of public services, such as tourist information [59], public transportation [28], and public safety [30], have been discussed. Little of the research constructed anindex systemof public services and explored its impacts on destination service evaluations [18,19]. The present work bridged this gap and broadened the contents of the SE framework.
Secondly, a multilevel dimensional construct of DSEs was explored. It is found that there are two types of service encounters in the DSEs model: ESEs and PSEs. Specifically, the model was composed of four dimensions (EPIEs, EPEEs, PPIEs, and PPEEs) and 10subdimensions (EEA, EEE, EEB, EAF, EDF, PPA, PPE, PPB, PAF, and PDF). However, in previous studies, SEs were regarded as a service process [60,61,62,63] or represented by piecemeal aspects of encounter elements (e.g., service environment [12],service employees [22], ambiance [64], etc.), and the current study adopts an encompassing approach and considers these elements simultaneously.
Thirdly, athree-dimensional construct of EPIEs and PPIEs, and a two-dimensional construct of ESEs were developed. Employees’ performances were described with different dimensions, such as attractive appearance, displayed emotion, and helpfulness of frontline employees [31], verbal and non-verbal behaviors of employees’ behaviors [65], interaction of love, money, and service from the social interaction perspective [33], etc. The division of our study was based on the employees’ performance and attributes, and it showed stability when applied to EPIEs and PPIEs. Regarding ESEs, the physical environment was divided into two dimensions of ambient factors and design factors. Ambient factors depict the background features of an environment, including temperature, background music, lighting, etc. Design factors reveal the visual elements in an environment, including the layout, signage, functionality, and aesthetics [8,23]. The two-dimensional construct was different from the three-dimensional division, which subdivides design factors into functionality and aesthetics [23] or layout, signage artefacts and function [8], perhaps because tourists do not spend too much time in one place at a destination and perceive the environment more vaguely. This division is also supported by the environmental psychologists, who have asserted that people’s reactions to the environment lie in the holistic layout, rather than discrete cues of the environment [66].
Fourthly, the results revealed that PPEEs, PPIEs, and EPIEs have significant positive effects on TS. Prior studies conducted in tourist attraction [11], national park [12],restaurant [4,20], and retailing [3] also verified tourists’ encounters with service employees or service environment have a significant impact on TS. However, the effects of ESEs and PSEs on TS have not been examined simultaneously. The present research addressed this gap. Inconsistent with the hypotheses and previous studies [11,20], the effects of EPEEs on TS are not significant, while PPEEs show the most significant influences on TS. This indicated that tourists might only be influenced notably by the general environment when there is ageneral environment and specific environment at the same time. This finding confirms the studies ofIttelson et al. (1974) [66] again, which suggested that people tend to respond to the general environment instead of scattered elements of the environment. In addition, the strong influence of PPEEs indicates the increasingly important influence of the public environment on tourists’ perceptions and evaluations.
4.2. Implications
Theoretically, the DSEs model offers a solution for applying SE theory to a destination servicescape involving two types of entities and services. The contents of DSEs provide a comprehensive understanding of the components of the destination service. Additionally, the DSEs model provides new explanatory variables for the post-evaluation and behaviors of tourists, such as TS. Previous studies have investigated the antecedents of TS at destinations, such as corporate reputation [67], destination image [68], tour quality [69], and destination social responsibility [70]. SEs have rarely been discussed within this domain. The current study constructed a SEs model for tourism destinations and testified its effects on TS, thus enriching the antecedents of tourists’ post-evaluation and behaviors at destinations. Practically, the DSEs model offers more detailed information for examining and improving public and enterprise service performance. Following DSEs, the destination management and marketing organizations are able to investigate tourists’ specific perceptions of enterprise employees, public personnel, enterprise environments and public environments. For example, the results of this investigation reveal that Shaoshan earned the highest score (mean = 4.03) for public ambient factors, followed by enterprise employees’ expertise (mean = 3.96) and public personnel’s behaviors (mean = 3.94). Conversely, enterprise design factors (mean = 3.73), public personnel’s attitudes (mean = 3.74), and expertise (mean = 3.75) received relatively poor evaluations.
Furthermore, DSEs’ influence on TS provides managers with an approach to improve destination management. For the public sector, the public physical environment, including ambient factors and design factors, should be the priority of management because it affects TS the most (β = 0.673, p < 0.001). As to enterprises at destinations, service employees are the most noticeable factors influencing TS. Therefore, staff training is necessary for enterprises.
Lastly, the research results emphasize the importance of public–private collaboration. To increase the tourists’ overall service benefits, destinationsshould join together to develop an effective cooperative relationship between the public and private sectors, such as destination marketing or management alliances [71]. In such a cooperation, the public sector is responsible for standardized public service, necessary assistance, and supervision, while the private sector can provide innovative and diverse service. For example, in Shaoshan township, every year, on chairman Mao Zedong’s birthday, many tourism enterprises and residents respond to the government’s call to provide tourists with long-lived noodles, and government departments provide information, transportation, and security services, etc.
4.3. Limitations and Future Research Directions
In spite of the contributions, the present study also has several limitations. First, the research context is in China, which might have limitations for the application of the DSEs model and data analysis results to other countries. Second, Shaoshan is a sightseeing tourism destination, and the application of the data analysis results to other types of destinations might be restricted. Third, the investigation of this study focused on core service encounters (i.e., service encounters exist in consumption experience periods), so service encounters in pre-purchase and post-purchase periods [72] were not considered.
Future research directions are suggested in the following aspects. First, the exploration and application of DSEs model in other countries can be attempted.Second, adopting a broader perspective of SEs, social interactions, including interactions with other customers, and local residents and companions, could be added to the model. Third, the time span of investigations could be extended to the pre- and post-purchase periods. Moreover, more types of destinations, such as holiday, agritourism, and adventure destinations, could be investigated to test the effects of DSEs. Finally, the effects of DSEs on other variables, such as emotions, service quality, destination image, repurchase intentions, etc., should be explored in future research.
Author Contributions
conceptualization, methodology, software, validation, formal analysis, investigation, data curation, writing—original draft preparation, M.Z.; writing—review and editing, supervision, F.W., K.W.; funding acquisition, M.Z.
Funding
This research was funded by a grant from the Philosophy and Social Science Foundation of Hunan Province, China (to Meijing Zhou) (No. 15YBA261).
Conflicts of Interest
The authors declare no conflict of interest.
Appendix A. Semi-Structured Interview Outline
- What are your feelings about the destination’s (i.e., the Shaoshan township) public infrastructure, such as public transportation, public toilets, urban greening, public security, etc.?
- What are your feelings about the destination’s public tourism attractions, such as urban parks, public leisure facilities, natural and cultural landscape, museums, etc.?
- What are your feelings about the destination’s public transportation system for tourists, such as sightseeing buses, parking lots, traffic signs, cruises and wharfs, transfer stations, etc.?
- What are your feelings about the destination’s market order regulation?
- What are your feelings about the visitors’ rights protection, such as complaints handling, safety guarantee, travel insurance, etc.?
- What are your feelings about the destination’s information services, such as tourism hotline, tourist information center, free tourism information, etc.?
- What are your feelings about the service attitude toward the public personnel at the destination?
- What are your feelings about the behaviors of the public service personnel at the destination?
- What are your feelings about the expertise of the public service personnel at the destination?
References
- UNWTO. Tourism Highlights 2018 Edition. Available online: https://www.e-unwto.org/doi/pdf/10.18111/9789284419876 (accessed on 23 December 2017).
- Su, L.; Swanson, S.R.; Chen, X. The effects of perceived service quality on repurchase intentions and subjective well-being of Chinese tourists: The mediating role of relationship quality. Tour. Manag. 2016, 52, 82–95. [Google Scholar] [CrossRef]
- Keng, C.J.; Huang, T.L.; Zheng, L.J.; Hsu, M.K. Modeling service encounters and customer experiential value in retailing: An empirical investigation of shopping mall customers in Taiwan. Int. J. Serv. Ind. Manag. 2007, 18, 349–367. [Google Scholar] [CrossRef]
- Wu, C.H.-J.; Liang, R.-D. Effect of experiential value on customer satisfaction with service encounters in luxury-hotel restaurants. Int. J. Hosp. Manag. 2009, 28, 586–593. [Google Scholar] [CrossRef]
- Solomon, M.R.; Surprenant, C.; Czepiel, J.A.; Gutman, E.G. A Role Theory Perspective on Dyadic Interactions: The Service Encounter. J. Mark. 1985, 49, 99–111. [Google Scholar] [CrossRef]
- Gallouj, F.; Weinstein, O. Innovation in services. Res. Policy 1997, 26, 537–556. [Google Scholar] [CrossRef]
- Carlzon, J. Moments of Truth; Harper Paperbacks: New York, NY, USA, 1989. [Google Scholar]
- Bitner, M.J. Servicescapes: The Impact of Physical Surroundings on Customers and Employees. J. Mark. 1992, 56, 57–71. [Google Scholar] [CrossRef]
- Baum, T. Making or breaking the tourist experience: The role of human resource management. In The Tourist Experience; Ryan, C., Ed.; Continuum: London, UK, 2002; pp. 94–111. [Google Scholar]
- Solnet, D. Employee—Customer Linkages: A Social Identification Perspective in a Hotel Industry Context. J. Hosp. Tour. Res. 2007, 14, 129–143. [Google Scholar] [CrossRef]
- Abubakar, B.; Mavondo, F. Tourism destinations: Antecedents to customer satisfaction and positive word-of-mouth. J. Hosp. Mark. Manag. 2014, 23, 833–864. [Google Scholar] [CrossRef]
- Tan, S.E.; Aziz, Y.A.; Khairi, W.A.; Zaiton, S. Linking Servicescape, Tourist Satisfaction and Overall Tour Guiding Experience: The Case of Taman Negara National Park, Malaysia. Pertanika J. Soc. Sci. Hum. 2015, 23, 33–48. [Google Scholar]
- Norman, R.J. Service Management: Strategy and Leadership in Service Businesses; Wiley: Hoboken, NJ, USA, 1986. [Google Scholar]
- Shostack, G.L. Planning the Service Encounter; Lexington Books: Lexington, MA, USA, 1985. [Google Scholar]
- Xu, J.; Pan, Y. Theoretical Cognition and Practical Judgment of Tourism Public Service—A Concurrent Discussion with Shuang Li. Tour. Tribune 2014, 29, 27–38. (In Chinese) [Google Scholar]
- Okuyama, T.; Ishihara, H. Effects of Improving Public Services for Tourism Developments in Islands: The Case of Remote Islands in Nagasaki, Japan. Open J. Soc. Sci. 2015, 3, 114–126. [Google Scholar] [CrossRef]
- Thompson, K.; Schofield, P. An investigation of the relationship between public transport performance and destination satisfaction. J. Transp. Geogr. 2007, 15, 136–144. [Google Scholar] [CrossRef]
- Cheng, D.; Cheng, J.; Xiao, T. Examining the Structural Relationships of Tourism Public Service System and Destination Satisfaction—A Case Study of Guilin National Tourism Reform Experimental Zone. Hum. Geogr. 2011, 26, 111–116. (In Chinese) [Google Scholar]
- Guan, X.; Li, J.; Xie, L. The Impact of Tourism Public Service Quality on Destination Image. Tour. Sci. 2015, 29, 27–38. [Google Scholar]
- Lin, I.Y.; Mattila, A.S. Restaurant servicescape, service encounter, and perceived congruency on customers’ emotions and satisfaction. J. Hosp. Market. Manag. 2010, 19, 819–841. [Google Scholar] [CrossRef]
- Gronroos, C. Service management: A management focus for service competition. Int. J. Serv. Ind. Manag. 1990, 1, 6–14. [Google Scholar] [CrossRef]
- Brady, M.K.; Cronin, J.J. Some new thoughts on conceptualizing perceived service quality: A hierarchical approach. J. Mark. 2001, 65, 34–49. [Google Scholar] [CrossRef]
- Baker, J. The role of the environment in marketing services: The consumer perspective. In The Services Challenge: Integrating for Competitive Advantage; American Marketing Association: Chicago, IL, USA, 1986. [Google Scholar]
- Bitner, M.J. Evaluating Service Encounters: The Effects of Physical Surroundings and Employee Responses. J. Mark. 1990, 54, 69–82. [Google Scholar] [CrossRef]
- Surprenant, C.F.; Solomon, M.R. Predictability and Personalization in the Service Encounter. J. Mark. 1987, 51, 86–96. [Google Scholar] [CrossRef]
- Yi, Y.; Gong, T. An integrated model of customer social exchange relationship: The moderating role of customer experience. Serv. Ind. J. 2009, 29, 1513–1528. [Google Scholar] [CrossRef]
- Connell, J.; Reynolds, P. The implications of technological developments on Tourist Information Centres. Tour. Manag. 1999, 20, 501–509. [Google Scholar] [CrossRef]
- Albalate, D.; Bel, G. Tourism and urban public transport: Holding demand pressure under supply constraints. Tour. Manag. 2010, 31, 425–433. [Google Scholar] [CrossRef]
- Pearce, D.G. Tourism development in Paris: Public intervention. Ann. Touris. Res. 1998, 25, 457–476. [Google Scholar] [CrossRef]
- Heggie, T.W.; Heggie, T.M.; Kliewer, C. Recreational Travel Fatalities in US National Parks. J. Travel Med. 2010, 15, 404–411. [Google Scholar] [CrossRef]
- Keh, H.T.; Ren, R.; Hill, S.R.; Li, X. The beautiful, the cheerful, and the helpful: The effects of service employee attributes on customer satisfaction. Psychol. Mark. 2013, 30, 211–226. [Google Scholar] [CrossRef]
- Winsted, K.F. Service behaviors that lead to satisfied customers. Eur. J. Mark. 2000, 34, 399–417. [Google Scholar] [CrossRef]
- Choo, H.S.; Petrick, J.F. Social interactions and intentions to revisit for agritourism service encounters. Tour. Manag. 2014, 40, 372–381. [Google Scholar] [CrossRef]
- Mehrabian, A.; Russell, J.A. An Approach to Environmental Psychology; MIT: Cambridge, UK, 1980. [Google Scholar]
- Wakefield, K.L.; Blodgett, J.G. The Importance of Servicescapes in Leisure Service Settings. J. Serv. Mark. 1994, 8, 66–76. [Google Scholar] [CrossRef]
- Kettl, D.F. Civil Service Reform: Building a Government That Works. Public Admin. Rev. 2007, 62, 634–637. [Google Scholar]
- Meer, F.M.V.D.; Toonen, T.A.J. Competency management and civil service professionalism in Dutch central government. Public Admin. 2005, 83, 839–852. [Google Scholar] [CrossRef]
- Tiancole, S.; Crompton, J.L.; Willson, V.L. An empirical investigation of the relationships between service quality, satisfaction and behavioral intentions among visitors to a wildlife refuge. J. Leisure Res. 2002, 34, 1–24. [Google Scholar] [CrossRef]
- Prayag, G. Tourists’ Evaluations of Destination Image, Satisfaction, and Future Behavioral Intentions—The Case of Mauritius. J. Travel. Tour. Mark. 2009, 26, 836–853. [Google Scholar] [CrossRef]
- Data Center of China National Tourism Administration. Annual Tourism Statistics Report of 2016 and Forecast of Tourism Economic Situation in 2017. Available online: http://www.cnta.gov.cn/zwgk/lysj/201711/t20171108_846343.shtml (accessed on 20 December 2017).
- China National Tourism Administration (CNTA). Whole domain Tourism Development Report 2017. Available online: http://www.cnta.gov.cn/zwgk/tzggnew/gztz/201708/P020170822603620823148.pdf (accessed on 20 December 2017).
- Li, S.; Huang, F.; Li, J. Tourism Public Service: Connotation, Characteristics and Classification Framework. Tour. Tribune 2010, 25, 20–26. [Google Scholar]
- Churchill, G.A. A Paradigm for Developing Better Measures of Marketing Constructs. J. Mark. Res. 1979, 16, 64–73. [Google Scholar] [CrossRef]
- Cabiddu, F.; Lui, T.-W.; Piccoli, G. Managing Value Co-Creation in the Tourism Industry. Ann. Tour. Res. 2013, 42, 86–107. [Google Scholar] [CrossRef]
- Miles, M.B.; Huberman, A.M. Qualitative Data Analysis, 2nd ed.; Sage: Thousand Oaks, CA, USA, 1994; p. 2. [Google Scholar]
- Strauss, A.L.; Corbin, J.M. Basics of Qualitative Research: Techniques and Procedures for Developing Grounded Theory; Sage: Thousand Oaks, CA, USA, 1998. [Google Scholar]
- Marques, J.F.; Mccall, C. The application of interrater reliability as a solidification instrument in a phenomenological study. Qual. Rep. 2005, 10, 439–462. [Google Scholar]
- Hightower, R.; Brady, M.K.; Baker, T.L. Investigating the role of the physical environment in hedonic service consumption: An exploratory study of sporting events. J. Bus. Res. 2002, 55, 697–707. [Google Scholar] [CrossRef]
- Hutchinson, J.; Lin, F.; Wang, Y. Understanding the relationship of quality, value, equity, satisfaction, and behavioral in tent ions among golf travelers. Tour. Manag. 2009, 30, 298–308. [Google Scholar] [CrossRef]
- Brown, T.; Churchill, G.J.; Peter, J. Research note:Improving the measurement of service quality. J. Retail. 1993, 69, 127–139. [Google Scholar] [CrossRef]
- Chen, C.-C.; Petrick, J.F. The Roles of Perceived Travel Benefits, Importance, and Constraints in Predicting Travel Behavior. J. Travel. Res. 2014, 55, 509–522. [Google Scholar] [CrossRef]
- Cattell, R.B. The scree plot for the number of factors. Multivar. Bahav. Res. 1966, 1, 245–276. [Google Scholar] [CrossRef] [PubMed]
- Hair, J.F.; Black, W.C.; Babin, B.J.; Anderson, R.E.; Tatham, R.L. Multivariate Data Analysis, 6th ed.; Pearson/Prentice Hall: Upper Saddle River, NJ, USA, 2006. [Google Scholar]
- Statistics Bureau of Shaoshan City. National Economic and Social Development Statistics Bulletin of Shaoshan City in 2016. Available online: http://www.shaoshan.gov.cn/Item/95033.aspx (accessed on 20 December 2017).
- Harris, S.G.; Mossholder, K.W. The affective implications of perceived congruence with culture dimensions during organizational transformation. J. Manag. 1996, 22, 527–547. [Google Scholar] [CrossRef]
- Netemeyer, R.G.; Bearden, W.O.; Sharma, S. Scaling Procedures: Issues and Applications; Sage: Thousand Oaks, CA, USA, 2003; p. S10. [Google Scholar]
- So, K.K.F.; King, C.; Sparks, B. Customer Engagement with Tourism Brands. J. Hosp. Tour. Res. 2012, 38, 304–329. [Google Scholar] [CrossRef]
- Bentler, P.M. Comparative fit indexes in structural models. Psychol. Bull. 1990, 107, 238–246. [Google Scholar] [CrossRef]
- Perakovic, D.; Jovović, I.; Forenbacher, I. Improving Croatian Tourist Information Via Location-Based Public Service Through Mobile Phones. In Proceedings of the 4th International Conference on Methodologies, Technologies and Tools Enabling e-Government (MeTTeG), Olten, Switzerland, 1–2 July 2010. [Google Scholar]
- Mariani, M.M.; Borghi, M.; Kazakov, S. The role of language in the online evaluation of hospitality service encounters: An empirical study. Int. J. Hosp. Manag. 2019, 78, 50–58. [Google Scholar] [CrossRef]
- Svinhufvud, K. Waiting for the customer: Multimodal analysis of waiting in service encounters. J. Prag. 2018, 129, 48–75. [Google Scholar] [CrossRef]
- Söderlund, M. Employee display of burnout in the service encounter and its impact on customer satisfaction. J. Retail. Consum. Serv. 2017, 37, 168–176. [Google Scholar] [CrossRef]
- Söderlund, M.; Oikarinen, E.L. Joking with customers in the service encounter has a negative impact on customer satisfaction: Replication and extension. J. Retail. Consum. Serv. 2018, 42, 55–64. [Google Scholar] [CrossRef]
- Sukhu, A.; Bilgihan, A.; Seo, S. Willingness to pay in negative restaurant service encounters. Int. J. Hosp. Manag. 2017, 65, 11–19. [Google Scholar] [CrossRef]
- Sundaram, D.; Webster, C. The role of nonverbal communication in service encounter. J. Serv. Mark. 2000, 14, 378–391. [Google Scholar] [CrossRef]
- Ittelson, W.H.; Proshansky, H.M.; Rivlin, L.G.; Winkel, G.H. An Introduction to Environmental Psychology; Holt, Rinehart and Winston: New York, NY, USA, 1974. [Google Scholar]
- Su, L.; Swanson, S.R.; Chinchanachokchai, S.; Hsu, M.K.; Chen, X. Reputation and intentions: The role of satisfaction, identification, and commitment. J. Bus. Res. 2016, 69, 3261–3269. [Google Scholar] [CrossRef]
- Wang, C.; Hsu, M. The relationships of destination image, satisfaction, and behavioral intentions: An integrated model. J. Travel. Tour. Mark. 2010, 27, 829–843. [Google Scholar] [CrossRef]
- Zhao, M.; Liu, S.J. The impact of tour quality and tourist satisfaction on tourist loyalty: The case of Chinese tourists in Korea. Tour. Manag. 2011, 32, 1115–1124. [Google Scholar]
- Tran, H.A.T.; Hwang, Y.S.; Yu, C.; Yoo, S.J. The Effect of Destination Social Responsibility on Tourists’ Satisfaction: The Mediating Role of Emotions. Sustainability 2018, 10, 3044. [Google Scholar] [CrossRef]
- Palmer, A.; Bejou, D. Tourism destination marketing alliances. Ann. Tourism. Res. 1995, 22, 616–629. [Google Scholar] [CrossRef]
- Voorhees, C.M.; Fombelle, P.W.; Gregoire, Y.; Bone, S.; Gustafsson, A.; Sousa, R.; Walkowiak, T. Service encounters, experiences and the customer journey: Defining the field and a call to expand our lens. J. Bus. Res. 2017, 79, 269–280. [Google Scholar] [CrossRef]


© 2019 by the authors. Licensee MDPI, Basel, Switzerland. This article is an open access article distributed under the terms and conditions of the Creative Commons Attribution (CC BY) license (http://creativecommons.org/licenses/by/4.0/).