Harnessing Insights from Social-Ecological Systems Research for Monitoring Sustainable Development


Abstract
1. Introduction
2. Materials and Methods
2.1. Social-Ecological Feedbacks
2.2. Resilience
2.3. Heterogeneity
2.4. Nonlinearity
2.5. Cross-Scales Dynamics
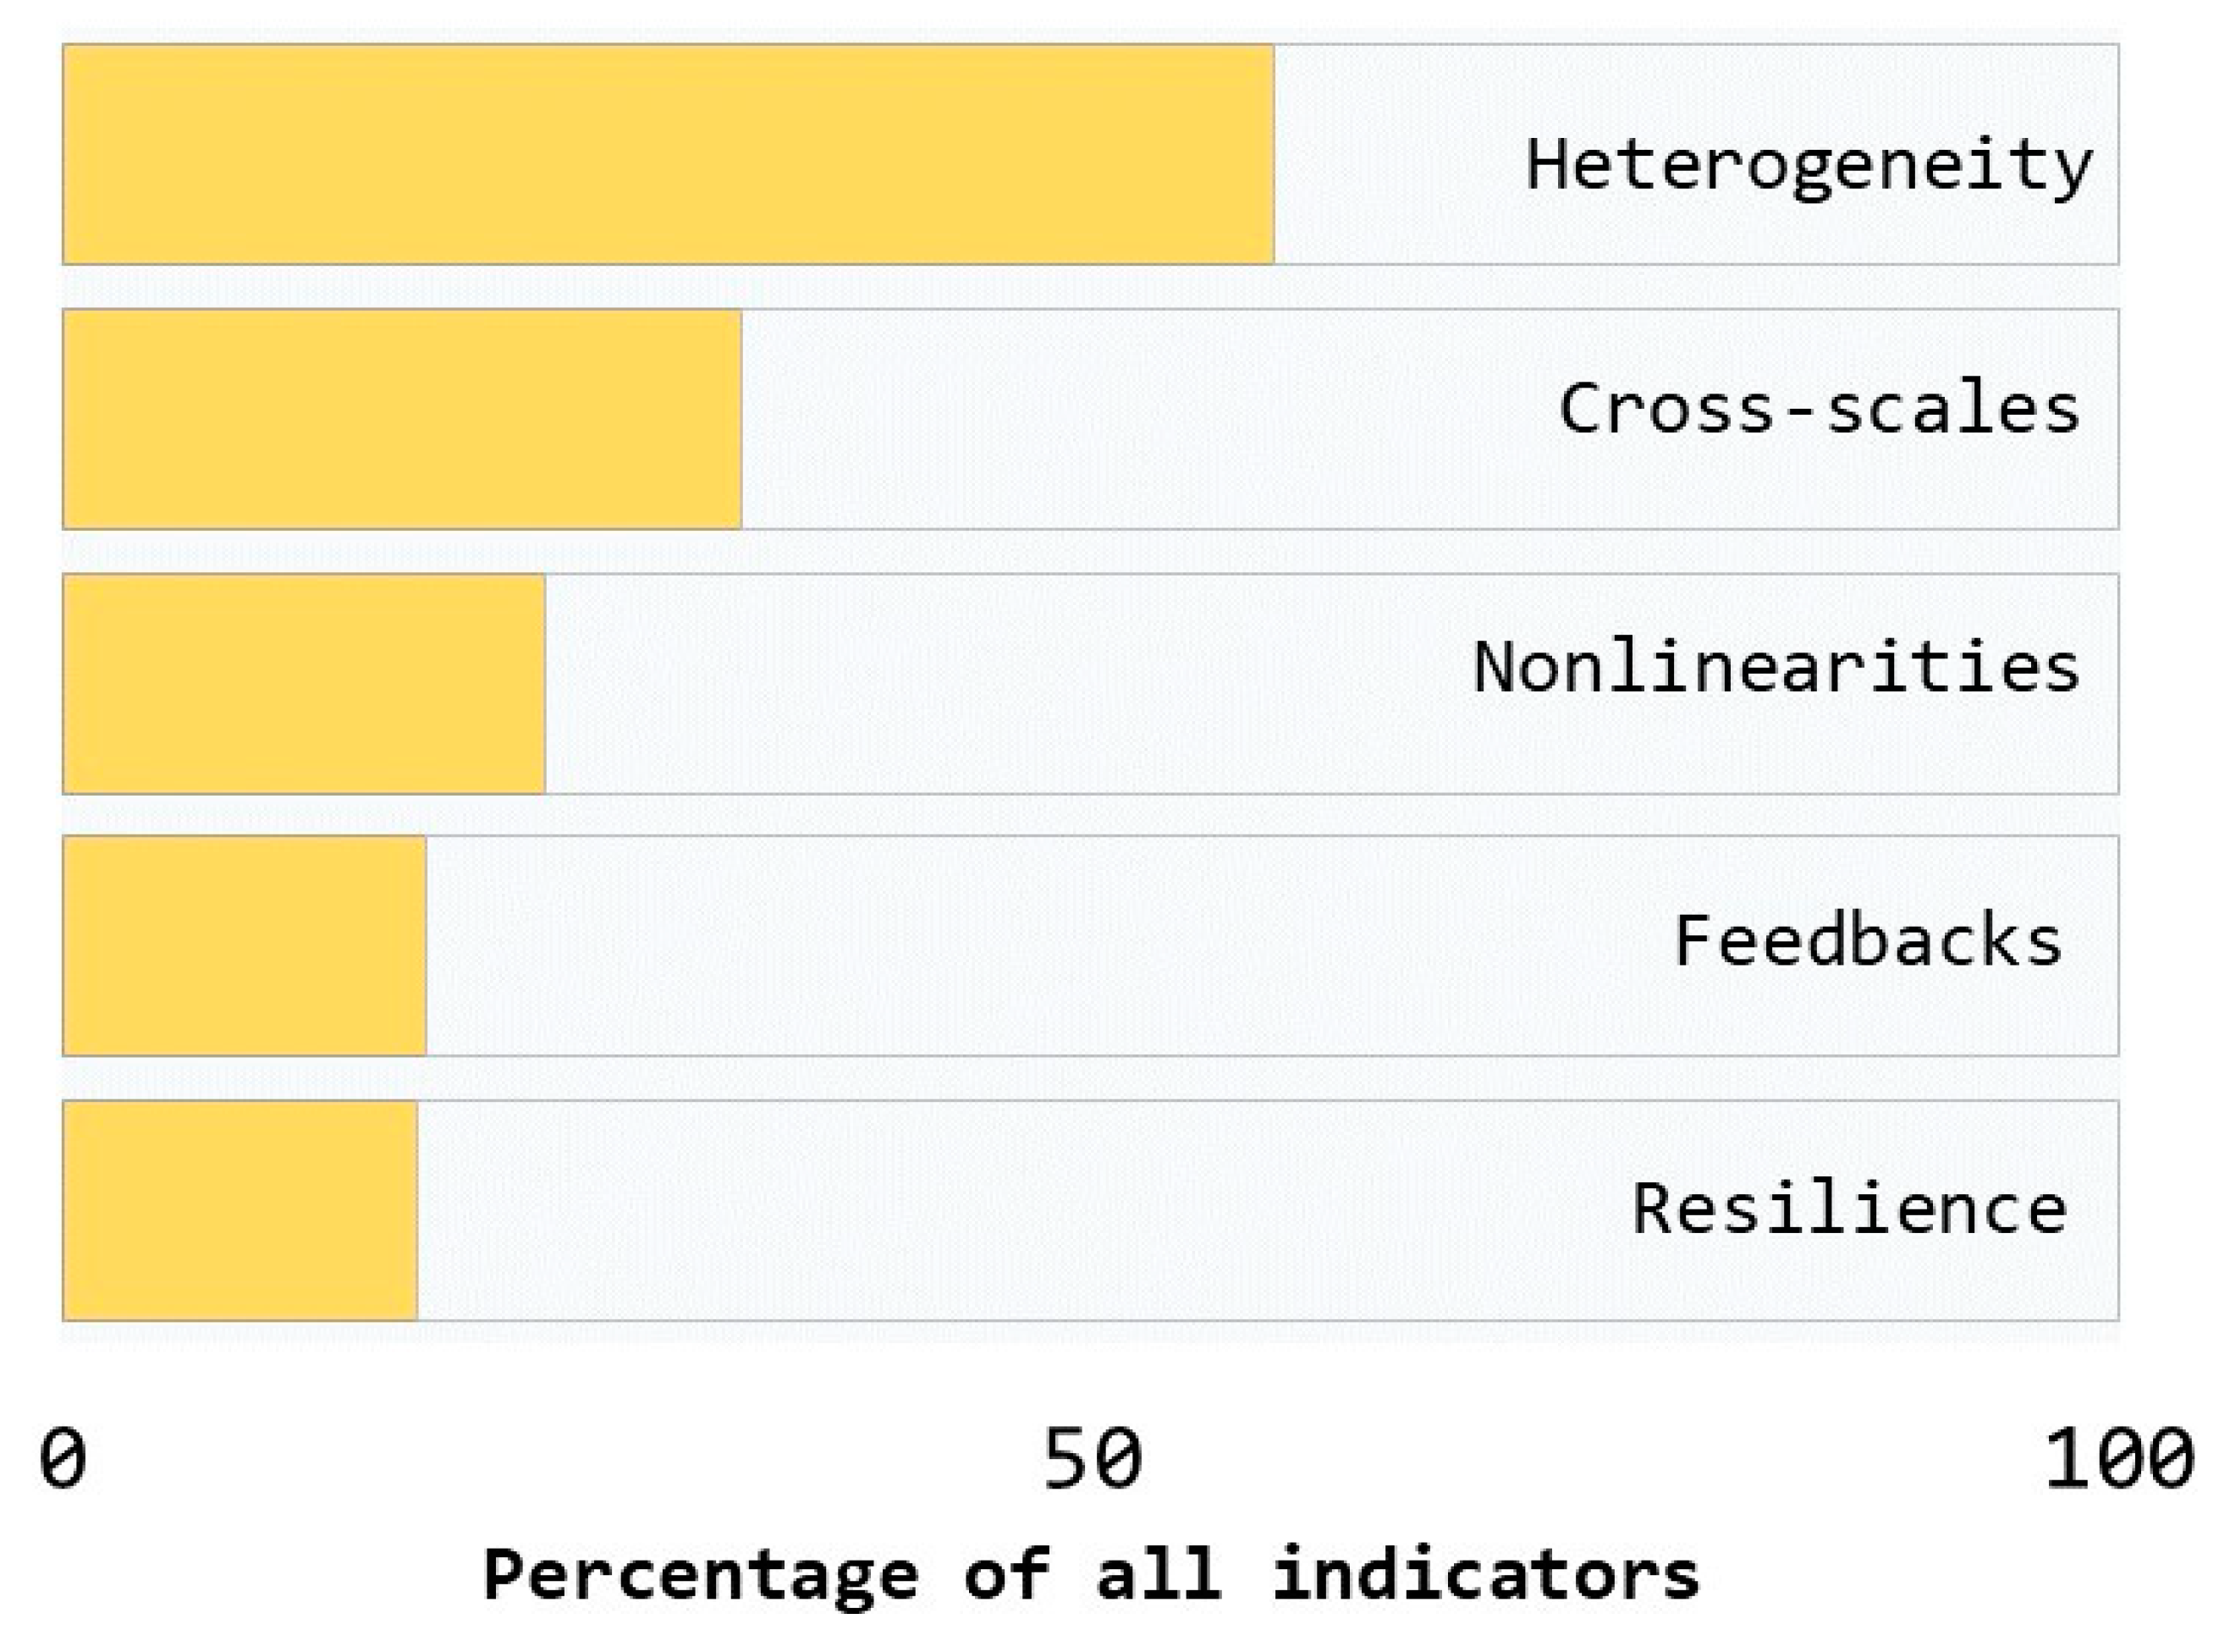
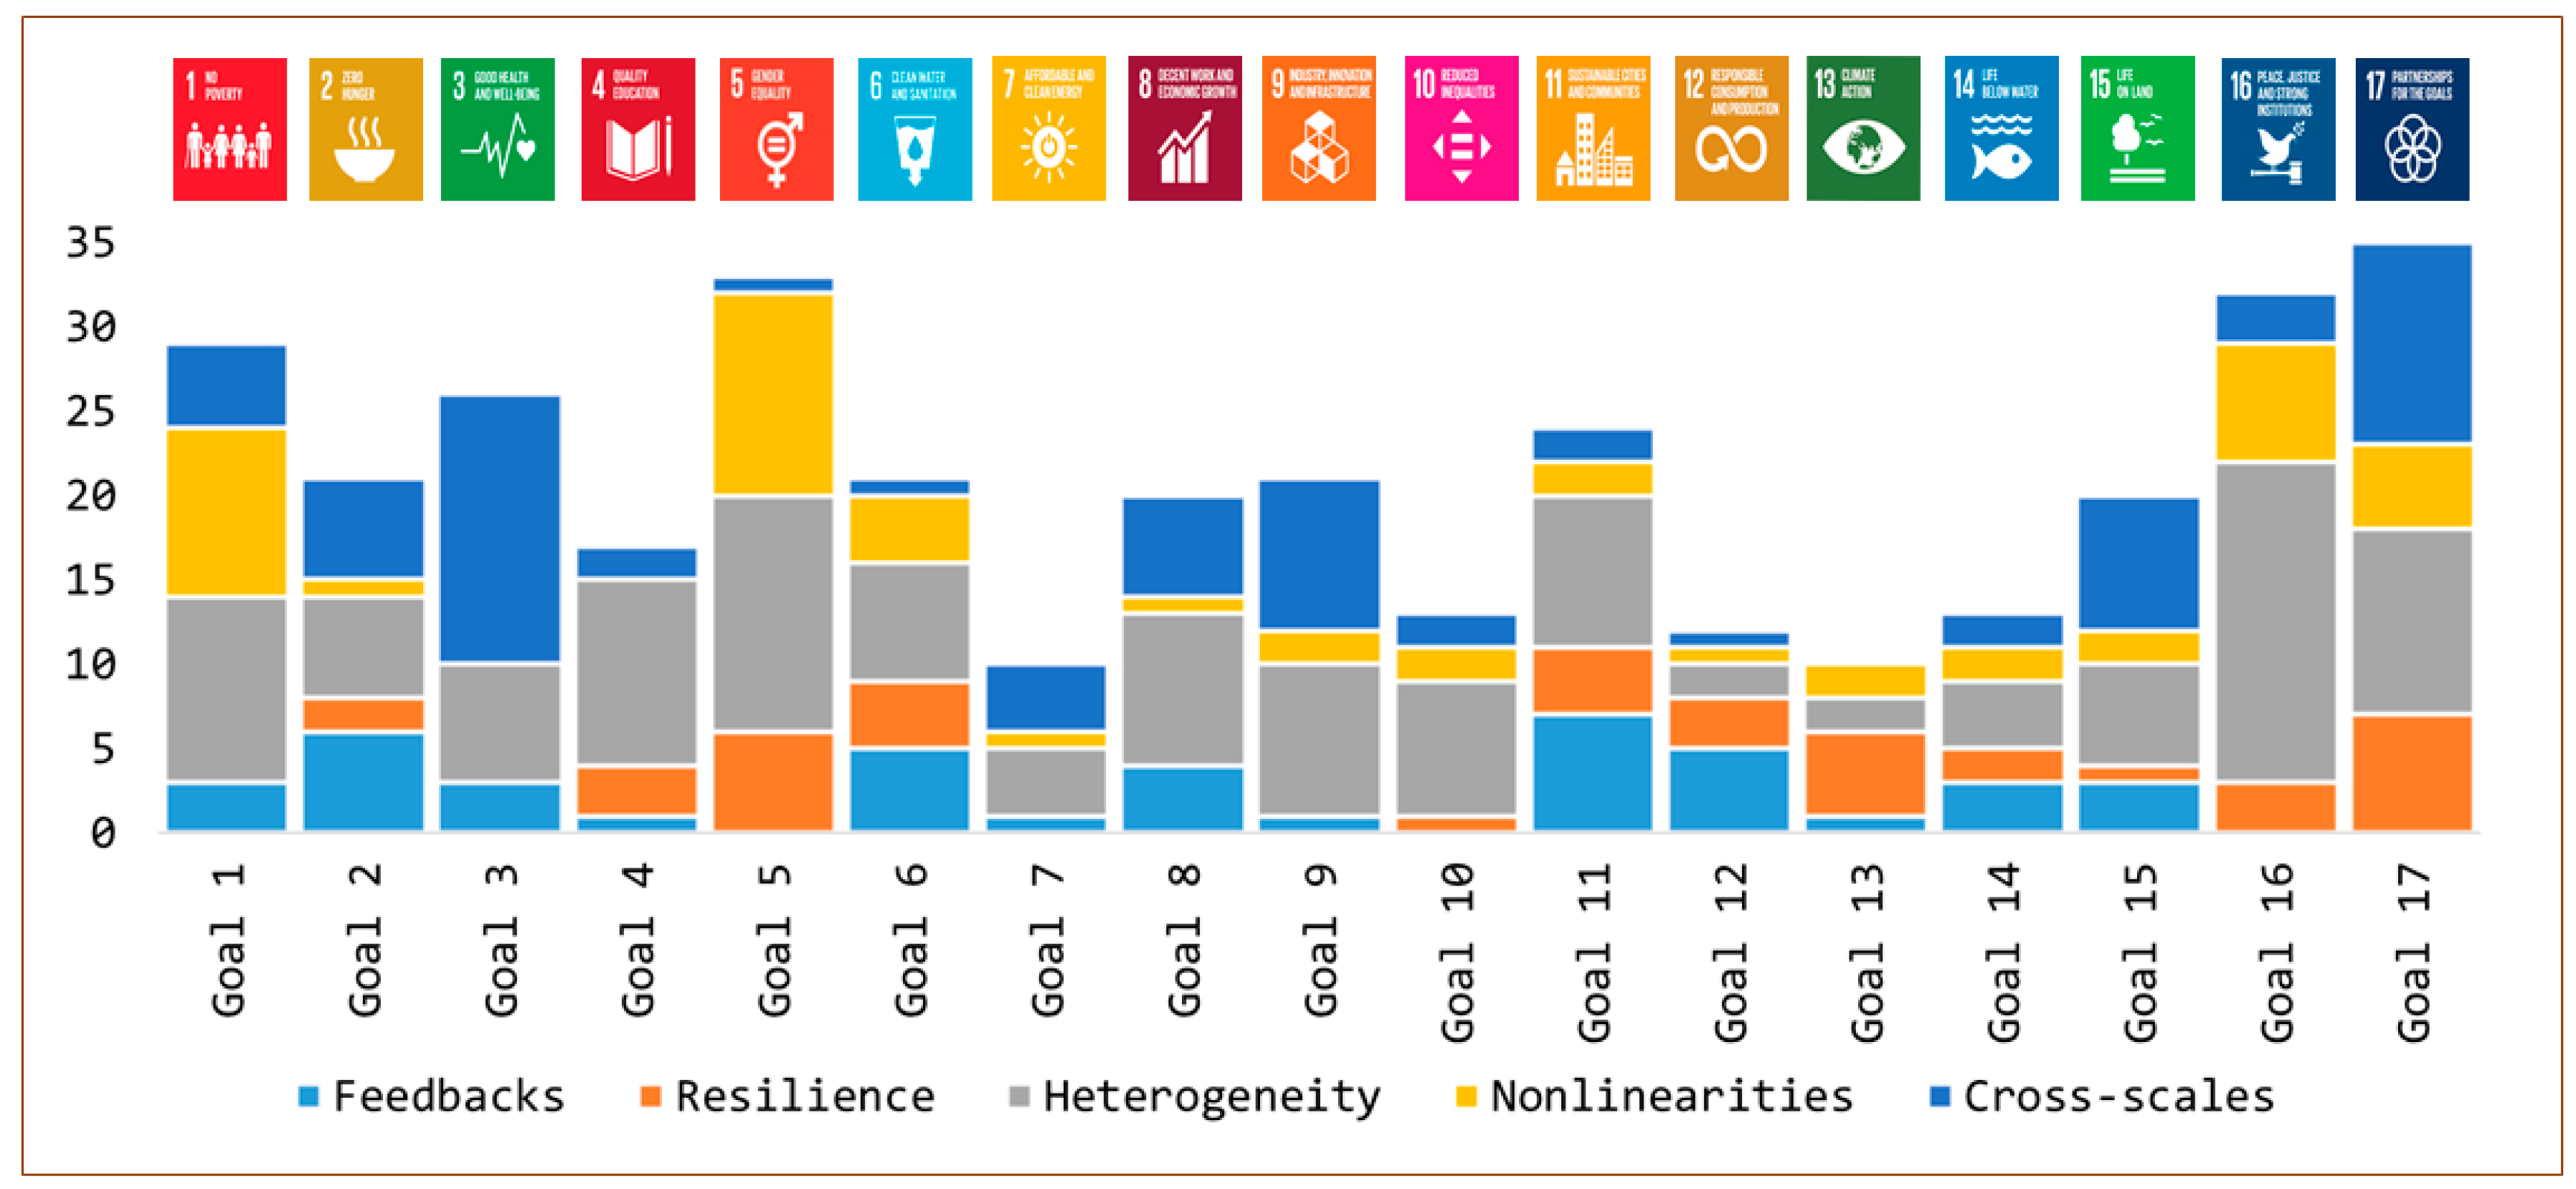
3. Results
4. Discussion
4.1. Social-Ecological System (SES) Dynamic Features: Current Progress, Gaps, and Future Directions
4.1.1. Heterogeneity
4.1.2. Cross-Scale Dynamics
4.1.3. Nonlinearities
4.1.4. Social-Ecological Feedbacks
4.1.5. Resilience
4.2. Moving towards Dynamic System Indicators for Sustainable Development
Author Contributions
Funding
Conflicts of Interest
Appendix A

| Feedbacks | Resilience | Heterogeneity | Nonlinearity | Cross-Scale Dynamics | |||||||||
|---|---|---|---|---|---|---|---|---|---|---|---|---|---|
| Goal | Indicators | Social | Ecological | Social Ecological | Learning | Governance | Participation | Diversity | Disaggregation | Multi-Dimension | Ecological Thresholds | Social Thresholds | Years |
| 1 | 1.1.1. Proportion of population below the international poverty line, by sex, age, employment status, and geographical location (urban/rural) | 1 | 0 | 0 | 0 | 0 | 0 | 0 | 1 | 0 | 0 | 1 | 27 |
| 1 | 1.2.1. Proportion of population living below the national poverty line, by sex and age | 1 | 0 | 0 | 0 | 0 | 0 | 0 | 1 | 0 | 0 | 1 | 32 |
| 1 | 1.2.2. Proportion of men, women, and children of all ages living in poverty in all its dimensions according to national definitions | 1 | 0 | 0 | 0 | 0 | 0 | 0 | 1 | 0 | 0 | 1 | 0 |
| 1 | 1.3.1. Proportion of population covered by social protection floors/systems, by sex, distinguishing children, unemployed persons, older persons, persons with disabilities, pregnant women, newborns, work-injury victims, and the poor and the vulnerable | 1 | 0 | 0 | 0 | 0 | 0 | 0 | 1 | 0 | 0 | 1 | 0 |
| 1 | 1.4.1. Proportion of population living in households with access to basic services | 1 | 0 | 0 | 0 | 0 | 0 | 0 | 1 | 1 | 0 | 1 | 0 |
| 1 | 1.4.2. Proportion of total adult population with secure tenure rights to land, with legally recognized documentation and who perceive their rights to land as secure, by sex and by type of tenure | 0 | 0 | 1 | 0 | 0 | 0 | 0 | 1 | 0 | 0 | 1 | 0 |
| 1 | 1.5.1. Number of deaths, missing persons and directly affected persons attributed to disasters per 100,000 population | 0 | 0 | 1 | 0 | 0 | 0 | 0 | 0 | 0 | 0 | 0 | 0 |
| 1 | 1.5.2. Direct economic loss attributed to disasters in relation to global gross domestic product (GDP) | 0 | 0 | 1 | 0 | 0 | 0 | 0 | 0 | 0 | 0 | 0 | 0 |
| 1 | 1.5.3. Number of countries that adopt and implement national disaster risk reduction strategies in line with the Sendai Framework for Disaster Risk Reduction 2015–2030 | 1 | 0 | 0 | 0 | 0 | 0 | 0 | 0 | 0 | 0 | 0 | 10 |
| 1 | 1.5.4. Proportion of local governments that adopt and implement local disaster risk reduction strategies in line with national disaster risk reduction strategies | 1 | 0 | 0 | 0 | 0 | 0 | 0 | 1 | 0 | 0 | 0 | 0 |
| 1 | 1.a.1. Proportion of domestically generated resources allocated by the government directly to poverty reduction programs | 1 | 0 | 0 | 0 | 0 | 0 | 0 | 1 | 0 | 0 | 1 | 0 |
| 1 | 1.a.2. Proportion of total government spending on essential services (education, health, and social protection) | 1 | 0 | 0 | 0 | 0 | 0 | 0 | 1 | 0 | 0 | 1 | 0 |
| 1 | 1.a.3. Sum of total grants and non-debt-creating inflows directly allocated to poverty reduction programs as a proportion of GDP | 1 | 0 | 0 | 0 | 0 | 0 | 0 | 1 | 0 | 0 | 1 | 0 |
| 1 | 1.b.1. Proportion of government recurrent and capital spending to sectors that disproportionately benefit women, the poor, and vulnerable groups | 1 | 0 | 0 | 0 | 0 | 0 | 0 | 1 | 0 | 0 | 1 | 0 |
| 2 | 2.1.1. Prevalence of undernourishment | 1 | 0 | 0 | 0 | 0 | 0 | 0 | 0 | 0 | 0 | 0 | 18 |
| 2 | 2.1.2. Prevalence of moderate or severe food insecurity in the population, based on the Food Insecurity Experience Scale (FIES) | 1 | 0 | 0 | 0 | 0 | 0 | 0 | 0 | 1 | 0 | 1 | 3 |
| 2 | 2.2.1. Prevalence of stunting (height for age <−2 standard deviations from the median of the World Health Organization (WHO) Child Growth Standards) among children under 5 years of age | 1 | 0 | 0 | 0 | 0 | 0 | 0 | 0 | 0 | 0 | 0 | 27 |
| 2 | 2.2.2. Prevalence of malnutrition (weight for height >+2 or <−2 standard deviation from the median of the WHO Child Growth Standards) among children under 5 years of age, by type (wasting and overweight) | 1 | 0 | 0 | 0 | 0 | 0 | 0 | 1 | 0 | 0 | 0 | 27 |
| 2 | 2.3.1. Volume of production per labor unit by classes of farming/pastoral/forestry enterprise size | 0 | 0 | 1 | 0 | 0 | 0 | 0 | 1 | 0 | 0 | 0 | 0 |
| 2 | 2.3.2. Average income of small-scale food producers, by sex and indigenous status | 0 | 0 | 1 | 0 | 0 | 0 | 0 | 1 | 0 | 0 | 0 | 0 |
| 2 | 2.4.1. Proportion of agricultural area under productive and sustainable agriculture | 0 | 0 | 1 | 0 | 0 | 0 | 0 | 1 | 0 | 0 | 0 | 0 |
| 2 | 2.5.1. Number of plant and animal genetic resources for food and agriculture secured in either medium- or long-term conservation facilities | 0 | 0 | 1 | 1 | 0 | 0 | 0 | 1 | 0 | 0 | 0 | 3 |
| 2 | 2.5.2. Proportion of local breeds classified as being at risk, not at risk, or at unknown level of risk of extinction | 0 | 0 | 1 | 0 | 0 | 0 | 1 | 1 | 0 | 0 | 0 | 24 |
| 2 | 2.a.1. The agriculture orientation index for government expenditures | 1 | 0 | 0 | 1 | 0 | 0 | 0 | 0 | 0 | 0 | 0 | 0 |
| 2 | 2.a.2. Total official flows (official development assistance plus other official flows) to the agriculture sector | 1 | 0 | 0 | 0 | 0 | 0 | 0 | 0 | 0 | 0 | 0 | 44 |
| 2 | 2.b.1. Agricultural export subsidies | 0 | 0 | 1 | 0 | 0 | 0 | 0 | 0 | 0 | 0 | 0 | 22 |
| 2 | 2.c.1. Indicator of food price anomalies | 1 | 0 | 0 | 0 | 0 | 0 | 0 | 0 | 0 | 0 | 0 | 0 |
| 3 | 3.1.1. Maternal mortality ratio | 1 | 0 | 0 | 0 | 0 | 0 | 0 | 0 | 0 | 0 | 0 | 27 |
| 3 | 3.1.2. Proportion of births attended by skilled health personnel | 1 | 0 | 0 | 0 | 0 | 0 | 0 | 1 | 0 | 0 | 0 | 27 |
| 3 | 3.2.1. Under-5 mortality rate | 1 | 0 | 0 | 0 | 0 | 0 | 0 | 0 | 0 | 0 | 0 | 27 |
| 3 | 3.2.2 Neonatal mortality rate | 1 | 0 | 0 | 0 | 0 | 0 | 0 | 0 | 0 | 0 | 0 | 27 |
| 3 | 3.3.1 Number of new HIV infections per 1000 uninfected population, by sex, age, and key populations | 1 | 0 | 0 | 0 | 0 | 0 | 0 | 1 | 0 | 0 | 0 | 0 |
| 3 | 3.3.2. Tuberculosis incidence per 100,000 population | 1 | 0 | 0 | 0 | 0 | 0 | 0 | 0 | 0 | 0 | 0 | 17 |
| 3 | 3.3.3. Malaria incidence per 1000 population | 0 | 0 | 1 | 0 | 0 | 0 | 0 | 0 | 0 | 0 | 0 | 17 |
| 3 | 3.3.4. Hepatitis B incidence per 100,000 population | 1 | 0 | 0 | 0 | 0 | 0 | 0 | 0 | 0 | 0 | 0 | 0 |
| 3 | 3.3.5. Number of people requiring interventions against neglected tropical diseases | 1 | 0 | 0 | 0 | 0 | 0 | 0 | 0 | 0 | 0 | 0 | 17 |
| 3 | 3.4.1. Mortality rate attributed to cardiovascular disease, cancer, diabetes, or chronic respiratory disease | 1 | 0 | 0 | 0 | 0 | 0 | 0 | 0 | 0 | 0 | 0 | 17 |
| 3 | 3.4.2. Suicide mortality rate | 1 | 0 | 0 | 0 | 0 | 0 | 0 | 0 | 0 | 0 | 0 | 17 |
| 3 | 3.5.1. Coverage of treatment interventions (pharmacological, psychosocial and rehabilitation and aftercare services) for substance use disorders | 1 | 0 | 0 | 0 | 0 | 0 | 0 | 0 | 0 | 0 | 0 | 0 |
| 3 | 3.5.2. Harmful use of alcohol, defined according to the national context as alcohol per capita consumption (aged 15 years and older) within a calendar year in liters of pure alcohol | 1 | 0 | 0 | 0 | 0 | 0 | 0 | 0 | 0 | 0 | 0 | 12 |
| 3 | 3.6.1. Death rate due to road traffic injuries | 1 | 0 | 0 | 0 | 0 | 0 | 0 | 0 | 0 | 0 | 0 | 17 |
| 3 | 3.7.1. Proportion of women of reproductive age (aged 15–49 years) who have their need for family planning satisfied with modern methods | 1 | 0 | 0 | 0 | 0 | 0 | 0 | 1 | 0 | 0 | 0 | 17 |
| 3 | 3.7.2. Adolescent birth rate (aged 10–14 years; aged 15–19 years) per 1000 women in that age group | 1 | 0 | 0 | 0 | 0 | 0 | 0 | 1 | 0 | 0 | 0 | 0 |
| 3 | 3.8.1. Coverage of essential health services (defined as the average coverage of essential services based on tracer interventions that include reproductive, maternal, newborn and child health, infectious diseases, non-communicable diseases and service capacity and access, among the general and the most disadvantaged population) | 1 | 0 | 0 | 0 | 0 | 0 | 0 | 0 | 1 | 0 | 0 | 0 |
| 3 | 3.8.2. Proportion of population with large household expenditures on health as a share of total household expenditure or income | 1 | 0 | 0 | 0 | 0 | 0 | 0 | 1 | 0 | 0 | 0 | 0 |
| 3 | 3.9.1. Mortality rate attributed to household and ambient air pollution | 0 | 0 | 1 | 0 | 0 | 0 | 0 | 0 | 0 | 0 | 0 | 27 |
| 3 | 3.9.2. Mortality rate attributed to unsafe water, unsafe sanitation and lack of hygiene (exposure to unsafe Water, Sanitation and Hygiene for All (WASH) services) | 0 | 0 | 1 | 0 | 0 | 0 | 0 | 0 | 0 | 0 | 0 | 5 |
| 3 | 3.9.3. Mortality rate attributed to unintentional poisoning | 1 | 0 | 0 | 0 | 0 | 0 | 0 | 0 | 0 | 0 | 0 | 5 |
| 3 | 3.a.1. Age-standardized prevalence of current tobacco use among persons aged 15 years and older | 1 | 0 | 0 | 0 | 0 | 0 | 0 | 0 | 0 | 0 | 0 | 17 |
| 3 | 3.b.1. Proportion of the target population covered by all vaccines included in their national program | 1 | 0 | 0 | 0 | 0 | 0 | 0 | 1 | 0 | 0 | 0 | 0 |
| 3 | 3.b.2. Total net official development assistance to medical research and basic health sectors | 1 | 0 | 0 | 0 | 0 | 0 | 0 | 0 | 0 | 0 | 0 | 44 |
| 3 | 3.b.3. Proportion of health facilities that have a core set of relevant essential medicines available and affordable on a sustainable basis | 1 | 0 | 0 | 0 | 0 | 0 | 0 | 1 | 0 | 0 | 0 | 0 |
| 3 | 3.c.1. Health worker density and distribution | 1 | 0 | 0 | 0 | 0 | 0 | 0 | 0 | 0 | 0 | 0 | 17 |
| 3 | 3.d.1. International Health Regulations (IHR) capacity and health emergency preparedness | 1 | 0 | 0 | 0 | 0 | 0 | 0 | 0 | 0 | 0 | 0 | 1 |
| 4 | 4.1.1. Proportion of children and young people (a) in grades 2/3; (b) at the end of primary; and (c) at the end of lower secondary achieving at least a minimum proficiency level in (i) reading and (ii) mathematics, by sex | 1 | 0 | 0 | 0 | 0 | 0 | 0 | 1 | 0 | 0 | 0 | 7 |
| 4 | 4.2.1. Proportion of children under 5 years of age who are developmentally on track in health, learning and psychosocial well-being, by sex | 1 | 0 | 0 | 0 | 0 | 0 | 0 | 1 | 0 | 0 | 0 | 0 |
| 4 | 4.2.2. Participation rate in organized learning (one year before the official primary entry age), by sex | 1 | 0 | 0 | 0 | 0 | 0 | 0 | 1 | 0 | 0 | 0 | 19 |
| 4 | 4.3.1 Participation rate of youth and adults in formal and non-formal education and training in the previous 12 months, by sex | 1 | 0 | 0 | 0 | 0 | 0 | 0 | 1 | 0 | 0 | 0 | 0 |
| 4 | 4.4.1. Proportion of youth and adults with information and communications technology (ICT) skills, by type of skill | 1 | 0 | 0 | 0 | 0 | 0 | 0 | 1 | 1 | 0 | 0 | 0 |
| 4 | 4.5.1. Parity indices (female/male, rural/urban, bottom/top wealth quintile and others such as disability status, indigenous peoples and conflict-affected, as data become available) for all education indicators on this list that can be disaggregated | 1 | 0 | 0 | 0 | 0 | 0 | 0 | 1 | 0 | 0 | 0 | 0 |
| 4 | 4.6.1. Proportion of population in a given age group achieving at least a fixed level of proficiency in functional (a) literacy and (b) numeracy skills, by sex | 1 | 0 | 0 | 0 | 0 | 0 | 0 | 1 | 0 | 0 | 0 | 0 |
| 4 | 4.7.1. Extent to which (i) global citizenship education and (ii) education for sustainable development, including gender equality and human rights, are mainstreamed at all levels in (a) national education policies; (b) curricula; (c) teacher education; and (d) student assessment | 1 | 0 | 0 | 1 | 0 | 0 | 0 | 1 | 0 | 0 | 0 | 0 |
| 4 | 4.a.1. Proportion of schools with access to (a) electricity; (b) the Internet for pedagogical purposes; (c) computers for pedagogical purposes; (d) adapted infrastructure and materials for students with disabilities; (e) basic drinking water; (f) single-sex basic sanitation facilities; and (g) basic handwashing facilities (as per the WASH indicator definitions) | 0 | 0 | 1 | 0 | 0 | 0 | 0 | 1 | 1 | 0 | 0 | 0 |
| 4 | 4.b.1. Volume of official development assistance flows for scholarships by sector and type of study | 1 | 0 | 0 | 1 | 0 | 0 | 0 | 1 | 1 | 0 | 0 | 7 |
| 4 | 4.c.1. Proportion of teachers in: (a) pre-primary; (b) primary; (c) lower secondary; and (d) upper secondary education who have received at least the minimum organized teacher training (e.g., pedagogical training), pre-service or in-service, required for teaching at the relevant level in a given country | 1 | 0 | 0 | 1 | 0 | 0 | 0 | 1 | 0 | 0 | 0 | 0 |
| 5 | 5.1.1. Whether or not legal frameworks are in place to promote, enforce, and monitor equality and non-discrimination on the basis of sex | 1 | 0 | 0 | 0 | 1 | 0 | 0 | 1 | 0 | 0 | 1 | 0 |
| 5 | 5.2.1. Proportion of ever-partnered women and girls aged 15 years and older subjected to physical, sexual, or psychological violence by a current or former intimate partner in the previous 12 months, by form of violence and by age | 1 | 0 | 0 | 0 | 0 | 0 | 1 | 1 | 1 | 0 | 1 | 0 |
| 5 | 5.2.2. Proportion of women and girls aged 15 years and older subjected to sexual violence by persons other than an intimate partner in the previous 12 months, by age and place of occurrence | 1 | 0 | 0 | 0 | 0 | 0 | 0 | 1 | 0 | 0 | 1 | 0 |
| 5 | 5.3.1. Proportion of women aged 20–24 years who were married or in a union before age 15 and before age 18 | 1 | 0 | 0 | 0 | 0 | 0 | 0 | 1 | 0 | 0 | 1 | 0 |
| 5 | 5.3.2. Proportion of girls and women aged 15–49 years who have undergone female genital mutilation/cutting, by age | 1 | 0 | 0 | 0 | 0 | 0 | 0 | 1 | 0 | 0 | 1 | 0 |
| 5 | 5.4.1. Proportion of time spent on unpaid domestic and care work, by sex, age, and location | 1 | 0 | 0 | 0 | 0 | 0 | 0 | 1 | 0 | 0 | 0 | 0 |
| 5 | 5.5.1. Proportion of seats held by women in (a) national parliaments and (b) local governments | 1 | 0 | 0 | 0 | 1 | 1 | 0 | 1 | 0 | 0 | 1 | 0 |
| 5 | 5.5.2. Proportion of women in managerial positions | 1 | 0 | 0 | 0 | 1 | 1 | 0 | 1 | 0 | 0 | 1 | 12 |
| 5 | 5.6.1. Proportion of women aged 15–49 years who make their own informed decisions regarding sexual relations, contraceptive use, and reproductive health care | 1 | 0 | 0 | 0 | 0 | 0 | 0 | 1 | 0 | 0 | 1 | 0 |
| 5 | 5.6.2 Number of countries with laws and regulations that guarantee full and equal access to women and men aged 15 years and older to sexual and reproductive health care, information, and education | 1 | 0 | 0 | 0 | 1 | 0 | 0 | 1 | 0 | 0 | 1 | 0 |
| 5 | 5.a.1. (a) Proportion of total agricultural population with ownership or secure rights over agricultural land, by sex; and (b) share of women among owners or rights-bearers of agricultural land, by type of tenure | 1 | 0 | 0 | 0 | 0 | 0 | 0 | 1 | 0 | 0 | 1 | 0 |
| 5 | 5.a.2. Proportion of countries where the legal framework (including customary law) guarantees women’s equal rights to land ownership and/or control | 1 | 0 | 0 | 0 | 1 | 1 | 0 | 1 | 0 | 0 | 1 | 0 |
| 5 | 5.b.1. Proportion of individuals who own a mobile telephone, by sex | 1 | 0 | 0 | 0 | 0 | 0 | 0 | 1 | 0 | 0 | 0 | 4 |
| 5 | 5.c.1. Proportion of countries with systems to track and make public allocations for gender equality and women’s empowerment | 1 | 0 | 0 | 0 | 1 | 0 | 0 | 1 | 0 | 0 | 1 | 0 |
| 6 | 6.1.1. Proportion of population using safely managed drinking water services | 0 | 0 | 1 | 0 | 0 | 0 | 0 | 1 | 0 | 0 | 1 | 0 |
| 6 | 6.2.1. Proportion of population using safely managed sanitation services, including a hand-washing facility with soap and water | 0 | 0 | 1 | 0 | 0 | 0 | 0 | 1 | 0 | 0 | 1 | 0 |
| 6 | 6.3.1. Proportion of wastewater safely treated | 0 | 0 | 1 | 0 | 0 | 0 | 0 | 1 | 0 | 0 | 0 | 0 |
| 6 | 6.3.2. Proportion of bodies of water with good ambient water quality | 0 | 1 | 0 | 0 | 0 | 0 | 0 | 1 | 0 | 1 | 0 | 0 |
| 6 | 6.4.1. Change in water-use efficiency over time | 0 | 0 | 1 | 0 | 0 | 0 | 0 | 0 | 0 | 1 | 0 | 0 |
| 6 | 6.4.2. Level of water stress: freshwater withdrawal as a proportion of available freshwater resources | 0 | 0 | 1 | 0 | 0 | 0 | 0 | 1 | 0 | 1 | 0 | 56 |
| 6 | 6.5.1. Degree of integrated water resources management implementation (0–100) | 1 | 0 | 0 | 0 | 1 | 0 | 0 | 0 | 0 | 0 | 0 | 9 |
| 6 | 6.5.2. Proportion of transboundary basin area with an operational arrangement for water cooperation | 1 | 0 | 0 | 0 | 1 | 0 | 0 | 1 | 0 | 0 | 0 | 0 |
| 6 | 6.6.1. Change in the extent of water-related ecosystems over time | 0 | 1 | 0 | 0 | 0 | 0 | 0 | 0 | 0 | 1 | 0 | 0 |
| 6 | 6.a.1. Amount of water- and sanitation-related official development assistance that is part of a government-coordinated spending plan | 1 | 0 | 0 | 0 | 1 | 0 | 0 | 0 | 0 | 0 | 0 | 9 |
| 6 | 6.b.1. Proportion of local administrative units with established and operational policies and procedures for participation of local communities in water and sanitation management | 1 | 0 | 0 | 0 | 1 | 1 | 0 | 1 | 0 | 0 | 0 | 9 |
| 7 | 7.1.1. Proportion of population with access to electricity | 1 | 0 | 0 | 0 | 0 | 0 | 0 | 1 | 0 | 0 | 1 | 27 |
| 7 | 7.1.2. Proportion of population with primary reliance on clean fuels and technology | 1 | 0 | 0 | 0 | 0 | 0 | 0 | 1 | 0 | 0 | 0 | 37 |
| 7 | 7.2.1. Renewable energy share in the total final energy consumption | 0 | 0 | 1 | 0 | 0 | 0 | 0 | 1 | 0 | 0 | 0 | 27 |
| 7 | 7.3.1. Energy intensity measured in terms of primary energy and GDP | 1 | 0 | 0 | 0 | 0 | 0 | 0 | 0 | 0 | 0 | 0 | 27 |
| 7 | 7.a.1. International financial flows to developing countries in support of clean energy research and development and renewable energy production, including in hybrid systems | 1 | 0 | 0 | 0 | 0 | 0 | 0 | 0 | 0 | 0 | 0 | 0 |
| 7 | 7.b.1. Investments in energy efficiency as a proportion of GDP and the amount of foreign direct investment in financial transfer for infrastructure and technology to sustainable development services | 1 | 0 | 0 | 0 | 0 | 0 | 0 | 1 | 0 | 0 | 0 | 0 |
| 8 | 8.1.1. Annual growth rate of real GDP per capita | 1 | 0 | 0 | 0 | 0 | 0 | 0 | 0 | 0 | 0 | 0 | 47 |
| 8 | 8.10.1. (a) Number of commercial bank branches per 100,000 adults and (b) number of automated teller machines (ATMs) per 100,000 adults | 1 | 0 | 0 | 0 | 0 | 0 | 0 | 0 | 0 | 0 | 0 | 13 |
| 8 | 8.10.2. Proportion of adults (15 years and older) with an account at a bank or other financial institution or with a mobile-money-service provider | 1 | 0 | 0 | 0 | 0 | 0 | 0 | 1 | 0 | 0 | 0 | 6 |
| 8 | 8.2.1. Annual growth rate of real GDP per employed person | 1 | 0 | 0 | 0 | 0 | 0 | 0 | 0 | 0 | 0 | 0 | 26 |
| 8 | 8.4.1. Material footprint, material footprint per capita, and material footprint per GDP | 0 | 0 | 1 | 0 | 0 | 0 | 0 | 0 | 0 | 0 | 0 | 0 |
| 8 | 8.4.2. Domestic material consumption, domestic material consumption per capita, and domestic material consumption per GDP | 0 | 0 | 1 | 0 | 0 | 0 | 0 | 0 | 0 | 0 | 0 | 47 |
| 8 | 8.5.1. Average hourly earnings of female and male employees, by occupation, age, and persons with disabilities | 1 | 0 | 0 | 0 | 0 | 0 | 0 | 1 | 0 | 0 | 0 | 0 |
| 8 | 8.5.2. Unemployment rate, by sex, age, and persons with disabilities | 1 | 0 | 0 | 0 | 0 | 0 | 0 | 1 | 0 | 0 | 0 | 8 |
| 8 | 8.6.1. Proportion of youth (aged 15–24 years) not in education, employment, or training | 1 | 0 | 0 | 0 | 0 | 0 | 0 | 1 | 0 | 0 | 0 | 14 |
| 8 | 8.7.1. Proportion and number of children aged 5–17 years engaged in child labor, by sex and age | 1 | 0 | 0 | 0 | 0 | 0 | 0 | 1 | 0 | 0 | 1 | 0 |
| 8 | 8.8.1. Frequency rates of fatal and non-fatal occupational injuries, by sex and migrant status | 1 | 0 | 0 | 0 | 0 | 0 | 0 | 1 | 0 | 0 | 0 | 0 |
| 8 | 8.8.2. Level of national compliance with labor rights (freedom of association and collective bargaining) based on International Labor Organization (ILO) textual sources and national legislation, by sex and migrant status | 1 | 0 | 0 | 0 | 0 | 0 | 0 | 1 | 0 | 0 | 0 | 0 |
| 8 | 8.9.1. Tourism direct GDP as a proportion of total GDP and in growth rate | 0 | 0 | 1 | 0 | 0 | 0 | 0 | 1 | 0 | 0 | 0 | 0 |
| 8 | 8.9.2. Proportion of jobs in sustainable tourism industries out of total tourism jobs | 0 | 0 | 1 | 0 | 0 | 0 | 0 | 1 | 0 | 0 | 0 | 0 |
| 8 | 8.a.1. Aid for Trade commitments and disbursements | 1 | 0 | 0 | 0 | 0 | 0 | 0 | 0 | 0 | 0 | 0 | 15 |
| 8 | 8.b.1. Existence of a developed and operationalized national strategy for youth employment, as a distinct strategy or as part of a national employment strategy | 1 | 0 | 0 | 0 | 0 | 0 | 0 | 0 | 0 | 0 | 0 | 0 |
| 9 | 9.1.1. Proportion of the rural population who live within 2 km of an all-season road | 1 | 0 | 0 | 0 | 0 | 0 | 0 | 1 | 0 | 0 | 0 | 0 |
| 9 | 9.1.2. Passenger and freight volumes, by mode of transport | 1 | 0 | 0 | 0 | 0 | 0 | 0 | 1 | 0 | 0 | 0 | 47 |
| 9 | 9.2.1. Manufacturing value added as a proportion of GDP and per capita | 1 | 0 | 0 | 0 | 0 | 0 | 0 | 1 | 0 | 0 | 0 | 27 |
| 9 | 9.2.2. Manufacturing employment as a proportion of total employment | 1 | 0 | 0 | 0 | 0 | 0 | 0 | 1 | 0 | 0 | 0 | 27 |
| 9 | 9.3.1. Proportion of small-scale industries in total industry value added | 1 | 0 | 0 | 0 | 0 | 0 | 0 | 1 | 0 | 0 | 1 | 0 |
| 9 | 9.3.2. Proportion of small-scale industries with a loan or line of credit | 1 | 0 | 0 | 0 | 0 | 0 | 0 | 1 | 0 | 0 | 1 | 0 |
| 9 | 9.4.1. CO2 emission per unit of value added | 0 | 0 | 1 | 0 | 0 | 0 | 0 | 0 | 0 | 1 | 0 | 27 |
| 9 | 9.5.1. Research and development expenditure as a proportion of GDP | 1 | 0 | 0 | 0 | 0 | 0 | 0 | 1 | 0 | 0 | 0 | 36 |
| 9 | 9.5.2. Researchers (in full-time equivalent) per million inhabitants | 1 | 0 | 0 | 0 | 0 | 0 | 0 | 0 | 0 | 0 | 0 | 36 |
| 9 | 9.a.1. Total official international support (official development assistance plus other official flows) to infrastructure | 1 | 0 | 0 | 0 | 0 | 0 | 0 | 0 | 0 | 0 | 0 | 15 |
| 9 | 9.b.1. Proportion of medium and high-tech industry value added in total value added | 1 | 0 | 0 | 0 | 0 | 0 | 0 | 1 | 0 | 0 | 0 | 27 |
| 9 | 9.c.1. Proportion of population covered by a mobile network, by technology | 1 | 0 | 0 | 0 | 0 | 0 | 0 | 1 | 0 | 0 | 0 | 10 |
| 10 | 10.1.1. Growth rates of household expenditure or income per capita among the bottom 40 percent of the population and the total population | 1 | 0 | 0 | 0 | 0 | 0 | 0 | 1 | 0 | 0 | 0 | 0 |
| 10 | 10.2.1. Proportion of people living below 50 percent of median income, by sex, age and persons with disabilities | 1 | 0 | 0 | 0 | 0 | 0 | 0 | 1 | 0 | 0 | 0 | 0 |
| 10 | 10.3.1. Proportion of population reporting having personally felt discriminated against or harassed in the previous 12 months on the basis of a ground of discrimination prohibited under international human rights law | 1 | 0 | 0 | 0 | 1 | 0 | 0 | 0 | 0 | 0 | 1 | 0 |
| 10 | 10.4.1. Labor share of GDP, comprising wages and social protection transfers | 1 | 0 | 0 | 0 | 0 | 0 | 0 | 1 | 0 | 0 | 1 | 0 |
| 10 | 10.5.1. Financial Soundness Indicators | 1 | 0 | 0 | 0 | 0 | 0 | 0 | 0 | 0 | 0 | 0 | 0 |
| 10 | 10.6.1. Proportion of members and voting rights of developing countries in international organizations | 1 | 0 | 0 | 0 | 0 | 0 | 0 | 1 | 0 | 0 | 0 | 0 |
| 10 | 10.7.1. Recruitment cost borne by employee as a proportion of yearly income earned in country of destination | 1 | 0 | 0 | 0 | 0 | 0 | 0 | 1 | 0 | 0 | 0 | 0 |
| 10 | 10.7.2. Number of countries that have implemented well-managed migration policies | 1 | 0 | 0 | 0 | 0 | 0 | 0 | 0 | 0 | 0 | 0 | 0 |
| 10 | 10.a.1. Proportion of tariff lines applied to imports from least developed countries and developing countries with zero-tariff | 1 | 0 | 0 | 0 | 0 | 0 | 0 | 1 | 0 | 0 | 0 | 12 |
| 10 | 10.b.1. Total resource flows for development, by recipient and donor countries and type of flow (e.g., official development assistance, foreign direct investment and other flows) | 1 | 0 | 0 | 0 | 0 | 0 | 0 | 1 | 0 | 0 | 0 | 57 |
| 10 | 10.c.1. Remittance costs as a proportion of the amount remitted | 1 | 0 | 0 | 0 | 0 | 0 | 0 | 1 | 0 | 0 | 0 | 0 |
| 11 | 11.1.1. Proportion of urban population living in slums, informal settlements, or inadequate housing | 1 | 0 | 0 | 0 | 0 | 0 | 0 | 1 | 0 | 0 | 0 | 27 |
| 11 | 11.2.1. Proportion of population that has convenient access to public transport, by sex, age, and persons with disabilities | 1 | 0 | 0 | 0 | 0 | 0 | 0 | 1 | 0 | 0 | 0 | 0 |
| 11 | 11.3.1. Ratio of land consumption rate to population growth rate | 0 | 0 | 1 | 0 | 0 | 0 | 0 | 0 | 0 | 1 | 0 | 0 |
| 11 | 11.3.2. Proportion of cities with a direct participation structure of civil society in urban planning and management that operate regularly and democratically | 1 | 0 | 0 | 0 | 1 | 1 | 0 | 1 | 0 | 0 | 0 | 0 |
| 11 | 11.4.1. Total expenditure (public and private) per capita spent on the preservation, protection, and conservation of all cultural and natural heritage, by type of heritage (cultural, natural, mixed and World Heritage Centre designation), level of government (national, regional and local/municipal), type of expenditure (operating expenditure/investment), and type of private funding (donations in kind, private non-profit sector and sponsorship) | 1 | 0 | 1 | 0 | 1 | 0 | 1 | 0 | 1 | 0 | 0 | 0 |
| 11 | 11.5.1. Number of deaths, missing persons and directly affected persons attributed to disasters per 100,000 population | 0 | 0 | 1 | 0 | 0 | 0 | 0 | 0 | 0 | 0 | 0 | 0 |
| 11 | 11.5.2. Direct economic loss in relation to global GDP, damage to critical infrastructure and number of disruptions to basic services, attributed to disasters | 0 | 0 | 1 | 0 | 0 | 0 | 0 | 0 | 0 | 0 | 0 | 27 |
| 11 | 11.6.1. Proportion of urban solid waste regularly collected and with adequate final discharge out of total urban solid waste generated, by cities | 0 | 0 | 1 | 0 | 0 | 0 | 0 | 1 | 0 | 0 | 0 | 0 |
| 11 | 11.6.2. Annual mean levels of fine particulate matter (e.g., PM2.5 and PM10) in cities (population weighted) | 0 | 0 | 1 | 0 | 0 | 0 | 0 | 0 | 0 | 1 | 0 | 9 |
| 11 | 11.7.1. Average share of the built-up area of cities that is open space for public use for all, by sex, age, and persons with disabilities | 1 | 0 | 0 | 0 | 0 | 0 | 0 | 1 | 0 | 0 | 0 | 0 |
| 11 | 11.7.2. Proportion of persons victim of physical or sexual harassment, by sex, age, disability status, and place of occurrence, in the previous 12 months | 1 | 0 | 0 | 0 | 0 | 0 | 0 | 1 | 0 | 0 | 0 | 0 |
| 11 | 11.a.1. Proportion of population living in cities that implement urban and regional development plans integrating population projections and resource needs, by size of city | 0 | 0 | 1 | 0 | 0 | 0 | 0 | 1 | 0 | 0 | 0 | 0 |
| 11 | 11.b.1. Number of countries that adopt and implement national disaster risk reduction strategies in line with the Sendai Framework for Disaster Risk Reduction 2015–2030 | 1 | 0 | 0 | 0 | 1 | 0 | 0 | 0 | 0 | 0 | 0 | 10 |
| 11 | 11.b.2. Proportion of local governments that adopt and implement local disaster risk reduction strategies in line with national disaster risk reduction strategies | 1 | 0 | 0 | 0 | 1 | 0 | 0 | 1 | 0 | 0 | 0 | 0 |
| 11 | 11.c.1. Proportion of financial support to the least developed countries that is allocated to the construction and retrofitting of sustainable, resilient, and resource-efficient buildings utilizing local materials | 1 | 0 | 0 | 0 | 0 | 0 | 0 | 1 | 0 | 0 | 0 | 0 |
| 12 | 12.1.1. Number of countries with sustainable consumption and production (SCP) national action plans or SCP mainstreamed as a priority or a target into national policies | 1 | 0 | 0 | 0 | 1 | 0 | 0 | 0 | 0 | 0 | 0 | 0 |
| 12 | 12.2.1. Material footprint, material footprint per capita, and material footprint per GDP | 0 | 0 | 1 | 0 | 0 | 0 | 0 | 0 | 0 | 0 | 0 | 0 |
| 12 | 12.2.2. Domestic material consumption, domestic material consumption per capita, and domestic material consumption per GDP | 0 | 0 | 1 | 0 | 0 | 0 | 0 | 0 | 0 | 0 | 0 | 47 |
| 12 | 12.3.1. Global food loss index | 0 | 0 | 1 | 0 | 0 | 0 | 0 | 0 | 0 | 0 | 0 | 0 |
| 12 | 12.4.1. Number of parties to international multilateral environmental agreements on hazardous waste, and other chemicals that meet their commitments and obligations in transmitting information as required by each relevant agreement | 1 | 0 | 0 | 0 | 1 | 0 | 0 | 0 | 0 | 0 | 0 | 7 |
| 12 | 12.4.2. Hazardous waste generated per capita and proportion of hazardous waste treated, by type of treatment | 0 | 0 | 1 | 0 | 0 | 0 | 0 | 1 | 0 | 1 | 0 | 0 |
| 12 | 12.5.1. National recycling rate, tons of material recycled | 0 | 0 | 1 | 0 | 0 | 0 | 0 | 0 | 0 | 0 | 0 | 0 |
| 12 | 12.6.1. Number of companies publishing sustainability reports | 1 | 0 | 0 | 0 | 0 | 0 | 0 | 0 | 0 | 0 | 0 | 0 |
| 12 | 12.7.1. Number of countries implementing sustainable public procurement policies and action plans | 1 | 0 | 0 | 0 | 0 | 0 | 0 | 0 | 0 | 0 | 0 | 0 |
| 12 | 12.8.1. Extent to which (i) global citizenship education and (ii) education for sustainable development (including climate change education) are mainstreamed in (a) national education policies; (b) curricula; (c) teacher education; and (d) student assessment | 1 | 0 | 0 | 1 | 0 | 0 | 1 | 0 | 0 | 0 | 0 | 0 |
| 12 | 12.a.1. Amount of support to developing countries on research and development for sustainable consumption and production and environmentally sound technologies | 1 | 0 | 0 | 0 | 0 | 0 | 0 | 0 | 0 | 0 | 0 | 0 |
| 12 | 12.b.1. Number of sustainable tourism strategies or policies and implemented action plans with agreed monitoring and evaluation tools | 1 | 0 | 0 | 0 | 0 | 0 | 0 | 0 | 0 | 0 | 0 | 0 |
| 12 | 12.c.1. Amount of fossil-fuel subsidies per unit of GDP (production and consumption) and as a proportion of total national expenditure on fossil fuels | 1 | 0 | 0 | 0 | 0 | 0 | 0 | 1 | 0 | 0 | 0 | 0 |
| 13 | 13.1.1. Number of deaths, missing persons and directly affected persons attributed to disasters per 100,000 population | 0 | 0 | 1 | 0 | 0 | 0 | 0 | 0 | 0 | 0 | 0 | 0 |
| 13 | 13.1.2. Number of countries that adopt and implement national disaster risk reduction strategies in line with the Sendai Framework for Disaster Risk Reduction 2015–2030 | 1 | 0 | 0 | 0 | 0 | 0 | 0 | 0 | 0 | 0 | 0 | 10 |
| 13 | 13.1.3. Proportion of local governments that adopt and implement local disaster risk reduction strategies in line with national disaster risk reduction strategies | 1 | 0 | 0 | 0 | 1 | 0 | 0 | 1 | 0 | 0 | 0 | 0 |
| 13 | 13.2.1. Number of countries that have communicated the establishment or operationalization of an integrated policy/strategy/plan, which increases their ability to adapt to the adverse impacts of climate change, and foster climate resilience and low greenhouse gas emissions development in a manner that does not threaten food production (including a national adaptation plan, nationally determined contribution, national communication, biennial update report, or other) | 1 | 0 | 0 | 0 | 0 | 0 | 0 | 0 | 0 | 0 | 0 | 0 |
| 13 | 13.3.1. Number of countries that have integrated mitigation, adaptation, impact reduction and early warning into primary, secondary, and tertiary curricula | 1 | 0 | 0 | 0 | 1 | 0 | 0 | 0 | 0 | 0 | 0 | 0 |
| 13 | 13.3.2. Number of countries that have communicated the strengthening of institutional, systemic, and individual capacity-building to implement adaptation, mitigation and technology transfer, and development actions | 1 | 0 | 0 | 0 | 1 | 0 | 0 | 0 | 0 | 0 | 0 | 0 |
| 13 | 13.a.1. Mobilized amount of United States dollars per year between 2020 and 2025 accountable towards the $100 billion commitment | 1 | 0 | 0 | 0 | 1 | 0 | 0 | 0 | 0 | 0 | 1 | 0 |
| 13 | 13.b.1. Number of least developed countries and small island developing States that are receiving specialized support, and amount of support, including finance, technology, and capacity-building for mechanisms in raising capacities for effective climate change-related planning and management, including focusing on women, youth, and local and marginalized communities | 1 | 0 | 0 | 0 | 1 | 0 | 0 | 1 | 0 | 0 | 1 | 0 |
| 14 | 14.1.1. Index of coastal eutrophication and floating plastic debris density | 0 | 0 | 1 | 0 | 0 | 0 | 0 | 0 | 0 | 1 | 0 | 0 |
| 14 | 14.2.1. Proportion of national exclusive economic zones managed using ecosystem-based approaches | 0 | 0 | 1 | 0 | 0 | 0 | 0 | 1 | 0 | 0 | 0 | 0 |
| 14 | 14.3.1. Average marine acidity (pH) measured at agreed suite of representative sampling stations | 0 | 1 | 0 | 0 | 0 | 0 | 0 | 0 | 0 | 0 | 0 | 0 |
| 14 | 14.4.1. Proportion of fish stocks within biologically sustainable levels | 0 | 1 | 0 | 0 | 0 | 0 | 0 | 1 | 0 | 0 | 0 | 43 |
| 14 | 14.5.1. Coverage of protected areas in relation to marine areas | 0 | 1 | 0 | 0 | 0 | 0 | 0 | 0 | 0 | 0 | 0 | 117 |
| 14 | 14.6.1. Progress by countries in the degree of implementation of international instruments aiming to combat illegal, unreported, and unregulated fishing | 1 | 0 | 0 | 0 | 0 | 0 | 0 | 0 | 0 | 0 | 0 | 0 |
| 14 | 14.7.1. Sustainable fisheries as a proportion of GDP in small island developing States, least developed countries and all countries | 0 | 0 | 1 | 0 | 0 | 0 | 0 | 1 | 0 | 0 | 0 | 0 |
| 14 | 14.a.1. Proportion of total research budget allocated to research in the field of marine technology | 1 | 0 | 0 | 0 | 0 | 0 | 0 | 1 | 0 | 0 | 0 | 0 |
| 14 | 14.b.1. Progress by countries in the degree of application of a legal/regulatory/policy/institutional framework, which recognizes and protects access rights for small-scale fisheries | 1 | 0 | 0 | 0 | 1 | 0 | 0 | 0 | 0 | 0 | 1 | 0 |
| 14 | 14.c.1. Number of countries making progress in ratifying, accepting, and implementing through legal, policy, and institutional frameworks, ocean-related instruments that implement international law, as reflected in the United Nations Convention on the Law of the Sea, for the conservation and sustainable use of the oceans and their resources | 1 | 0 | 0 | 0 | 1 | 0 | 0 | 0 | 0 | 0 | 0 | 0 |
| 15 | 15.1.1. Forest area as a proportion of total land area | 0 | 1 | 0 | 0 | 0 | 0 | 0 | 1 | 0 | 0 | 0 | 27 |
| 15 | 15.1.2. Proportion of important sites for terrestrial and freshwater biodiversity that are covered by protected areas, by ecosystem type | 0 | 1 | 0 | 0 | 0 | 0 | 0 | 1 | 0 | 0 | 0 | 117 |
| 15 | 15.2.1. Progress towards sustainable forest management | 0 | 1 | 0 | 0 | 0 | 0 | 0 | 0 | 0 | 0 | 0 | 27 |
| 15 | 15.3.1. Proportion of land that is degraded over total land area | 0 | 1 | 0 | 0 | 0 | 0 | 0 | 1 | 0 | 0 | 0 | 0 |
| 15 | 15.4.1. Coverage by protected areas of important sites for mountain biodiversity | 0 | 1 | 0 | 0 | 0 | 0 | 0 | 0 | 0 | 0 | 0 | 117 |
| 15 | 15.4.2 Mountain Green Cover Index | 0 | 1 | 0 | 0 | 0 | 0 | 0 | 0 | 0 | 0 | 0 | 17 |
| 15 | 15.5.1. Red List Index | 0 | 1 | 0 | 0 | 0 | 0 | 0 | 0 | 0 | 0 | 0 | 37 |
| 15 | 15.6.1. Number of countries that have adopted legislative, administrative, and policy frameworks to ensure fair and equitable sharing of benefits | 1 | 0 | 0 | 0 | 0 | 0 | 0 | 0 | 0 | 0 | 1 | 0 |
| 15 | 15.7.1. Proportion of traded wildlife that was poached or illicitly trafficked | 0 | 0 | 1 | 0 | 0 | 0 | 0 | 1 | 0 | 0 | 0 | 0 |
| 15 | 15.8.1. Proportion of countries adopting relevant national legislation and adequately resourcing the prevention or control of invasive alien species | 1 | 0 | 0 | 0 | 1 | 0 | 0 | 1 | 0 | 0 | 0 | 0 |
| 15 | 15.9.1. Progress towards national targets established in accordance with Aichi Biodiversity Target 2 of the Strategic Plan for Biodiversity 2011–2020 | 0 | 0 | 1 | 0 | 0 | 0 | 0 | 0 | 0 | 1 | 0 | 0 |
| 15 | 15.a.1. Official development assistance and public expenditure on conservation and sustainable use of biodiversity and ecosystems | 1 | 0 | 0 | 0 | 0 | 0 | 0 | 0 | 0 | 0 | 0 | 15 |
| 15 | 15.b.1. Official development assistance and public expenditure on conservation and sustainable use of biodiversity and ecosystems | 1 | 0 | 0 | 0 | 0 | 0 | 0 | 0 | 0 | 0 | 0 | 15 |
| 15 | 15.c.1. Proportion of traded wildlife that was poached or illicitly trafficked | 0 | 0 | 1 | 0 | 0 | 0 | 0 | 1 | 0 | 0 | 0 | 0 |
| 16 | 16.1.1. Number of victims of intentional homicide per 100,000 population, by sex and age | 1 | 0 | 0 | 0 | 0 | 0 | 0 | 1 | 0 | 0 | 1 | 7 |
| 16 | 16.1.2. Conflict-related deaths per 100,000 population, by sex, age, and cause | 1 | 0 | 0 | 0 | 0 | 0 | 0 | 1 | 0 | 0 | 1 | 0 |
| 16 | 16.1.3. Proportion of population subjected to physical, psychological or sexual violence in the previous 12 months | 1 | 0 | 0 | 0 | 0 | 0 | 0 | 1 | 0 | 0 | 1 | 0 |
| 16 | 16.1.4. Proportion of population that feel safe walking alone around the area they live | 1 | 0 | 0 | 0 | 0 | 0 | 0 | 1 | 0 | 0 | 1 | 0 |
| 16 | 16.10.1. Number of verified cases of killing, kidnapping, enforced disappearance, arbitrary detention and torture of journalists, associated media personnel, trade unionists and human rights advocates in the previous 12 months | 1 | 0 | 0 | 0 | 0 | 0 | 0 | 0 | 0 | 0 | 0 | 0 |
| 16 | 16.10.2. Number of countries that adopt and implement constitutional, statutory, and/or policy guarantees for public access to information | 1 | 0 | 0 | 0 | 1 | 0 | 0 | 0 | 0 | 0 | 0 | 0 |
| 16 | 16.2.1. Proportion of children aged 1–17 years who experienced any physical punishment and/or psychological aggression by caregivers in the past month | 1 | 0 | 0 | 0 | 0 | 0 | 0 | 1 | 0 | 0 | 0 | 0 |
| 16 | 16.2.2. Number of victims of human trafficking per 100,000 population, by sex, age, and form of exploitation | 1 | 0 | 0 | 0 | 0 | 0 | 0 | 1 | 0 | 0 | 0 | 0 |
| 16 | 16.2.3. Proportion of young women and men aged 18–29 years who experienced sexual violence by age 18 | 1 | 0 | 0 | 0 | 0 | 0 | 0 | 1 | 0 | 0 | 0 | 0 |
| 16 | 16.3.1. Proportion of victims of violence in the previous 12 months who reported their victimization to competent authorities or other officially recognized conflict resolution mechanisms | 1 | 0 | 0 | 0 | 0 | 0 | 0 | 1 | 0 | 0 | 0 | 0 |
| 16 | 16.3.2. Unsentenced detainees as a proportion of overall prison population | 1 | 0 | 0 | 0 | 0 | 0 | 0 | 1 | 0 | 0 | 0 | 14 |
| 16 | 16.4.1. Total value of inward and outward illicit financial flows (in current United States dollars) | 1 | 0 | 0 | 0 | 0 | 0 | 0 | 0 | 0 | 0 | 0 | 0 |
| 16 | 16.4.2. Proportion of seized, found, or surrendered arms whose illicit origin or context has been traced or established by a competent authority in line with international instruments | 1 | 0 | 0 | 0 | 0 | 0 | 0 | 1 | 0 | 0 | 0 | 0 |
| 16 | 16.5.1. Proportion of persons who had at least one contact with a public official and who paid a bribe to a public official, or were asked for a bribe by those public officials, during the previous 12 months | 1 | 0 | 0 | 0 | 0 | 0 | 0 | 1 | 0 | 0 | 0 | 0 |
| 16 | 16.5.2. Proportion of businesses that had at least one contact with a public official and that paid a bribe to a public official, or were asked for a bribe by those public officials during the previous 12 months | 1 | 0 | 0 | 0 | 0 | 0 | 0 | 1 | 0 | 0 | 0 | 0 |
| 16 | 16.6.1 Primary government expenditures as a proportion of original approved budget, by sector (or by budget codes or similar) | 1 | 0 | 0 | 0 | 0 | 0 | 0 | 1 | 0 | 0 | 0 | 0 |
| 16 | 16.6.2. Proportion of population satisfied with their last experience of public services | 1 | 0 | 0 | 0 | 0 | 0 | 0 | 1 | 0 | 0 | 0 | 0 |
| 16 | 16.7.1. Proportions of positions (by sex, age, persons with disabilities, and population groups) in public institutions (national and local legislatures, public service, and judiciary) compared to national distributions | 1 | 0 | 0 | 0 | 0 | 0 | 0 | 1 | 0 | 0 | 0 | 0 |
| 16 | 16.7.2. Proportion of population who believe decision-making is inclusive and responsive, by sex, age, disability, and population group | 1 | 0 | 0 | 0 | 1 | 1 | 0 | 1 | 0 | 0 | 1 | 0 |
| 16 | 16.8.1. Proportion of members and voting rights of developing countries in international organizations | 1 | 0 | 0 | 0 | 1 | 1 | 0 | 1 | 0 | 0 | 0 | 0 |
| 16 | 16.9.1. Proportion of children under 5 years of age whose births have been registered with a civil authority, by age | 1 | 0 | 0 | 0 | 0 | 0 | 0 | 1 | 0 | 0 | 0 | 7 |
| 16 | 16.a.1. Existence of independent national human rights institutions in compliance with the Paris Principles | 1 | 0 | 0 | 0 | 0 | 0 | 0 | 0 | 0 | 0 | 1 | 17 |
| 16 | 16.b.1. Proportion of population reporting having personally felt discriminated against or harassed in the previous 12 months on the basis of a ground of discrimination prohibited under international human rights law | 1 | 0 | 0 | 0 | 0 | 0 | 0 | 1 | 0 | 0 | 1 | 0 |
| 17 | 17.1.1. Total government revenue as a proportion of GDP, by source | 1 | 0 | 0 | 0 | 0 | 0 | 0 | 1 | 0 | 0 | 0 | 26 |
| 17 | 17.1.2. Proportion of domestic budget funded by domestic taxes | 1 | 0 | 0 | 0 | 0 | 0 | 0 | 1 | 0 | 0 | 0 | 27 |
| 17 | 17.10.1. Worldwide weighted tariff-average | 1 | 0 | 0 | 0 | 0 | 0 | 0 | 0 | 0 | 0 | 0 | 12 |
| 17 | 17.11.1. Developing countries’ and least developed countries’ share of global exports | 1 | 0 | 0 | 0 | 0 | 0 | 0 | 1 | 0 | 0 | 0 | 17 |
| 17 | 17.12.1. Average tariffs faced by developing countries, least developed countries and small island developing States | 1 | 0 | 0 | 0 | 0 | 0 | 0 | 0 | 0 | 0 | 0 | 12 |
| 17 | 17.13.1. Macroeconomic Dashboard | 1 | 0 | 0 | 0 | 0 | 0 | 0 | 0 | 0 | 0 | 0 | 0 |
| 17 | 17.14.1. Number of countries with mechanisms in place to enhance policy coherence of sustainable development | 1 | 0 | 0 | 0 | 1 | 0 | 0 | 0 | 0 | 0 | 0 | 0 |
| 17 | 17.15.1. Extent of use of country-owned results frameworks and planning tools by providers of development cooperation | 1 | 0 | 0 | 0 | 0 | 0 | 0 | 0 | 0 | 0 | 0 | 0 |
| 17 | 17.16.1. Number of countries reporting progress in multi-stakeholder development effectiveness monitoring frameworks that support the achievement of the sustainable development goals | 1 | 0 | 0 | 0 | 1 | 0 | 0 | 0 | 0 | 0 | 0 | 0 |
| 17 | 17.17.1. Amount of United States dollars committed to public–private and civil society partnerships | 1 | 0 | 0 | 0 | 0 | 0 | 0 | 0 | 0 | 0 | 0 | 0 |
| 17 | 17.18.1. Proportion of sustainable development indicators produced at the national level with full disaggregation when relevant to the target, in accordance with the Fundamental Principles of Official Statistics | 1 | 0 | 0 | 0 | 0 | 0 | 0 | 1 | 0 | 0 | 0 | 0 |
| 17 | 17.18.2 Number of countries that have national statistical legislation that complies with the Fundamental Principles of Official Statistics | 1 | 0 | 0 | 0 | 1 | 0 | 0 | 0 | 0 | 0 | 0 | 0 |
| 17 | 17.18.3. Number of countries with a national statistical plan that is fully funded and under implementation, by source of funding | 1 | 0 | 0 | 0 | 1 | 0 | 0 | 1 | 0 | 0 | 0 | 10 |
| 17 | 17.19.1. Dollar value of all resources made available to strengthen statistical capacity in developing countries | 1 | 0 | 0 | 0 | 0 | 0 | 0 | 0 | 0 | 0 | 1 | 11 |
| 17 | 17.19.2. Proportion of countries that (a) have conducted at least one population and housing census in the last 10 years; and (b) have achieved 100 per cent birth registration and 80 percent death registration | 1 | 0 | 0 | 1 | 0 | 0 | 0 | 1 | 0 | 0 | 0 | 0 |
| 17 | 17.2.1. Net official development assistance, total and to least developed countries, as a proportion of the Organization for Economic Cooperation and Development (OECD) Development Assistance Committee donors’ gross national income (GNI) | 1 | 0 | 0 | 0 | 1 | 0 | 0 | 1 | 0 | 0 | 1 | 15 |
| 17 | 17.3.1. Foreign direct investment (FDI), official development assistance, and South–South cooperation as a proportion of total domestic budget | 1 | 0 | 0 | 0 | 1 | 0 | 0 | 1 | 0 | 0 | 0 | 0 |
| 17 | 17.3.2. Volume of remittances (in United States dollars) as a proportion of total GDP | 1 | 0 | 0 | 0 | 0 | 0 | 0 | 1 | 0 | 0 | 0 | 27 |
| 17 | 17.4.1. Debt service as a proportion of exports of goods and services | 1 | 0 | 0 | 0 | 0 | 0 | 0 | 1 | 0 | 0 | 0 | 27 |
| 17 | 17.5.1. Number of countries that adopt and implement investment promotion regimes for least developed countries | 1 | 0 | 0 | 0 | 0 | 0 | 0 | 0 | 0 | 0 | 1 | 0 |
| 17 | 17.6.1. Number of science and/or technology cooperation agreements and programs between countries, by type of cooperation | 1 | 0 | 0 | 0 | 0 | 0 | 0 | 0 | 0 | 0 | 1 | 0 |
| 17 | 17.6.2. Fixed Internet broadband subscriptions per 100 inhabitants, by speed | 1 | 0 | 0 | 0 | 0 | 0 | 0 | 0 | 0 | 0 | 0 | 16 |
| 17 | 17.7.1. Total amount of approved funding for developing countries to promote the development, transfer, dissemination, and diffusion of environmentally sound technologies | 1 | 0 | 0 | 0 | 0 | 0 | 0 | 0 | 0 | 0 | 0 | 0 |
| 17 | 17.8.1. Proportion of individuals using the Internet | 1 | 0 | 0 | 0 | 0 | 0 | 0 | 1 | 0 | 0 | 0 | 22 |
| 17 | 17.9.1. Dollar value of financial and technical assistance (including through North–South, South–South, and triangular cooperation) committed to developing countries | 1 | 0 | 0 | 0 | 1 | 0 | 0 | 0 | 0 | 0 | 1 | 15 |
References
- Liu, J.; Mooney, H.A.; Hull, V.; Davis, S.J.; Gaskell, J.C.; Hertel, T.W.; Lubchenco, J.; Seto, K.C.; Gleick, P.H.; Kremen, C.; et al. Systems integration for global sustainability. Science 2015, 347, 1258832. [Google Scholar] [CrossRef] [PubMed]
- Adams, W.M.; Aveling, R.; Brockington, D.; Dickson, B.; Elliott, J.; Hutton, J.; Roe, D.; Vira, B.; Wolmer, W. Biodiversity conservation and the eradication of poverty. Science 2004, 306, 1146–1149. [Google Scholar] [CrossRef] [PubMed]
- Motesharrei, S.; Rivas, J.; Kalnay, E.; Asrar, G.R.; Busalacchi, A.J.; Cahalan, R.F.; Cane, M.A.; Colwell, R.R.; Feng, K.; Franklin, R.S.; et al. Modeling sustainability: Population, inequality, consumption, and bidirectional coupling of the Earth and Human Systems. Natl. Sci. Rev. 2016, 3, 470–494. [Google Scholar] [CrossRef]
- Hamann, M.; Berry, K.; Chaigneau, T.; Curry, T.; Heilmayr, R.; Henriksson, P.J.G.; Hentati-Sundberg, J.; Jina, A.; Lindkvist, E.; Lopez-Maldonado, Y.; et al. Inequality and the Biosphere. Annu. Rev. Environ. Resour. 2018, 43, 61–83. [Google Scholar] [CrossRef]
- Costello, A.; Abbas, M.; Allen, A.; Ball, S.; Bell, S.; Bellamy, R.; Friel, S.; Groce, N.; Johnson, A.; Kett, M.; et al. Managing the health effects of climate change. Lancet 2009, 373, 1693–1733. [Google Scholar] [CrossRef]
- Looke, D.F.M.M.; Gottlieb, T.; Jones, C.A. The global challenges of infectious diseases. Med. J. Aust. 2015, 202, 225–226. [Google Scholar] [CrossRef] [PubMed]
- Wilting, H.C.; Schipper, A.M.; Bakkenes, M.; Meijer, J.R.; Huijbregts, M.A.J. Quantifying biodiversity losses due to human consumption: A global-scale footprint analysis. Environ. Sci. Technol. 2017, 51, 3298–3306. [Google Scholar] [CrossRef] [PubMed]
- Lenzen, M.; Moran, D.; Kanemoto, K.; Foran, B.; Lobefaro, L.; Geschke, A. International trade drives biodiversity threats in developing nations. Nature 2012, 486, 109–112. [Google Scholar] [CrossRef] [PubMed]
- Steffen, W.; Broadgate, W.; Deutsch, L.; Gaffney, O.; Ludwig, C. The trajectory of the Anthropocene: The Great Acceleration. Anthr. Rev. 2015, 2, 81–98. [Google Scholar] [CrossRef]
- Fremier, A.K.; DeClerck, F.A.J.; Bosque-Pérez, N.A.; Carmona, N.E.; Hill, R.; Joyal, T.; Keesecker, L.; Klos, P.Z.; Martínez-Salinas, A.; Niemeyer, R.; et al. Understanding Spatiotemporal Lags in Ecosystem Services to Improve Incentives. Bioscience 2013, 63, 472–482. [Google Scholar] [CrossRef]
- Camill, P.; Clark, J.S. Long-term perspectives on lagged ecosystem responses to climate change: Permafrost in boreal peatlands and the grassland/woodland boundary. Ecosystems 2000, 3, 534–544. [Google Scholar] [CrossRef]
- Peters, D.P.C.; Groffman, P.M.; Nadelhoffer, K.J.; Grimm, N.B.; Collins, S.L.; Michener, W.K.; Huston, M.A. Living in an increasingly connected world: A framework for continental-scale environmental science. Front. Ecol. Environ. 2008, 6, 229–237. [Google Scholar] [CrossRef]
- Kohlheb, N.; Krausmann, F. Land use change, biomass production and HANPP: The case of Hungary 1961–2005. Ecol. Econ. 2009, 69, 292–300. [Google Scholar] [CrossRef]
- Liu, J.; Yang, W.; Li, S. Framing ecosystem services in the telecoupled Anthropocene. Front. Ecol. Environ. 2016, 14, 27–36. [Google Scholar] [CrossRef]
- Liu, J.; Dou, Y.; Batistella, M.; Challies, E.; Connor, T.; Friis, C.; Millington, J.D.A.; Parish, E.; Romulo, C.L.; Silva, R.F.B.; et al. Spillover systems in a telecoupled Anthropocene: Typology, methods, and governance for global sustainability. Curr. Opin. Environ. Sustain. 2018, 33, 58–69. [Google Scholar] [CrossRef]
- Bruckner, M.; Fischer, G.; Tramberend, S.; Giljum, S. Measuring telecouplings in the global land system: A review and comparative evaluation of land footprint accounting methods. Ecol. Econ. 2015, 114, 11–21. [Google Scholar] [CrossRef]
- Stoll, J.S.; Crona, B.I.; Fabinyi, M.; Farr, E.R. Seafood Trade Routes for Lobster Obscure Teleconnected Vulnerabilities. Front. Mar. Sci. 2018, 5, 239. [Google Scholar] [CrossRef]
- Eakin, H.; DeFries, R.; Kerr, S.; Lambin, E.F.; Liu, J.; Marcotullio, P.J.; Messerli, P.; Reenberg, A.; Rueda, X.; Swaffield, S.R.; et al. Significance of Telecoupling for Exploration of Land-Use Change. In Rethinking Global Land Use in an Urban Era; Seto, K.C., Reenberg, A., Eds.; MIT Press: Cambridge, MA, USA, 2014; pp. 141–161. ISBN 9780262026901. [Google Scholar]
- Nilsson, M.; Griggs, D.; Visbeck, M. Policy: Map the interactions between Sustainable Development Goals. Nature 2016, 534, 320–322. [Google Scholar] [CrossRef] [PubMed]
- Griggs, D.; Stafford-Smith, M.; Gaffney, O.; Rockström, J.; Ohman, M.C.; Shyamsundar, P.; Steffen, W.; Glaser, G.; Kanie, N.; Noble, I.; et al. Policy: Sustainable development goals for people and planet. Nature 2013, 495, 305–307. [Google Scholar] [CrossRef] [PubMed]
- Reyers, B.; Stafford-Smith, M.; Erb, K.-H.H.; Scholes, R.J.; Selomane, O. Essential Variables help to focus Sustainable Development Goals monitoring. Curr. Opin. Environ. Sustain. 2017, 26–27, 97–105. [Google Scholar] [CrossRef]
- Reyers, B.; Folke, C.; Moore, M.-L.; Biggs, R.; Galaz, V. Social-Ecological Systems Insights for Navigating the Dynamics of the Anthropocene. Annu. Rev. Environ. Resour. 2018, 43, 267–289. [Google Scholar] [CrossRef]
- Costanza, R.; Kubiszewski, I.; Giovannini, E.; Lovins, H.; McGlade, J.; Pickett, K.E.; Ragnarsdóttir, K.V.; Roberts, D.; De Vogli, R.; Wilkinson, R. Time to leave GDP behind. Nature 2014, 505, 283–285. [Google Scholar] [CrossRef] [PubMed]
- Dullinger, S.; Essl, F.; Rabitsch, W.; Erb, K.-H.K.-H.; Gingrich, S.; Haberl, H.; Hulber, K.; Jarosik, V.; Krausmann, F.; Kuhn, I.; et al. Europe’s other debt crisis caused by the long legacy of future extinctions. Proc. Natl. Acad. Sci. USA 2013, 110, 7342–7347. [Google Scholar] [CrossRef] [PubMed]
- Folke, C.; Jansson, Å.; Rockström, J.; Olsson, P.; Carpenter, S.R.; Stuart Chapin, F.; Crépin, A.-S.S.; Daily, G.; Danell, K.; Ebbesson, J.; et al. Reconnecting to the biosphere. Ambio 2011, 40, 719–738. [Google Scholar] [CrossRef] [PubMed]
- Carpenter, S.R.; Folke, C.; Norström, A.; Olsson, O.; Schultz, L.; Agarwal, B.; Balvanera, P.; Campbell, B.; Castilla, J.C.; Cramer, W.; et al. Program on ecosystem change and society: An international research strategy for integrated social–ecological systems. Curr. Opin. Environ. Sustain. 2012, 4, 134–138. [Google Scholar] [CrossRef]
- Reyers, B.; Selomane, O. Social-ecological systems approaches: Revealing and navigating the complex trade-offs of sustainable development. In Ecosystem Services and Poverty Alleviation: Trade-Offs and Governance; Schreckenberg, K., Mace, G., Poudyal, M., Eds.; Routledge: London, UK; New York, NY, USA, 2018; pp. 39–54. [Google Scholar]
- UN. Transforming Our World: The 2030 Agenda for Sustainable Development; United Nations: New York, NY, USA, 2015. [Google Scholar]
- Barbier, E.; Burgess, J. The Sustainable Development Goals and the systems approach to sustainability. Economics 2017, 11, 1–22. [Google Scholar] [CrossRef]
- Young, O.R.; Underdal, A.; Kanie, N.; Andresen, S.; Bernstein, S.; Biermann, F.; Gupta, J.; Haas, P.M.; Iguchi, M.; Kok, M.; et al. Earth System Challenges and a Multi-Layered Approach for the Sustainable Development Goals; POST2015/UNU-IAS Policy Brief #1; United Nations University Institute for the Advanced Study of Sustainability: Tokyo, Japan, 2014. [Google Scholar]
- Lim, M.M.L.; Søgaard Jørgensen, P.; Wyborn, C.A. Reframing the sustainable development goals to achieve sustainable development in the anthropocene—A systems approach. Ecol. Soc. 2018, 23, art22. [Google Scholar] [CrossRef]
- Lucas, P.; Kok, M.; Nilsson, M.; Alkemade, R. Integrating Biodiversity and Ecosystem Services in the Post-2015 Development Agenda: Goal Structure, Target Areas and Means of Implementation. Sustainability 2013, 6, 193–216. [Google Scholar] [CrossRef]
- Griggs, D.; Smith, M.S.; Rockström, J.; Öhman, M.C.; Gaffney, O.; Glaser, G.; Kanie, N. An integrated framework for sustainable development goals. Ecol. Soc. 2014, 19, 49. [Google Scholar] [CrossRef]
- Pradhan, P.; Costa, L.; Rybski, D.; Lucht, W.; Kropp, J.P. A Systematic Study of Sustainable Development Goal (SDG) Interactions. Earth’s Future 2017, 5, 1169–1179. [Google Scholar] [CrossRef]
- SDSN. Indicators and a Monitoring Framework for Sustainable Development Goals: Launching a Data Revolution for the SDGs; Sustainable Development Solutions Network: New York, NY, USA; Paris, France, 2015. [Google Scholar]
- Costanza, R.; Fioramonti, L.; Kubiszewski, I. The UN Sustainable Development Goals and the dynamics of well-being. Front. Ecol. Environ. 2016, 14, 59. [Google Scholar] [CrossRef]
- Levin, S.A. Complex Adaptive Systems: Exploring the known, the unknown and the unknowable. Bull. Am. Math. Soc. 2002, 40, 3–19. [Google Scholar] [CrossRef]
- Duit, A.; Galaz, V. Governance and Complexity—Emerging Issues for Governance Theory. Governance 2008, 21, 311–335. [Google Scholar] [CrossRef]
- Schoon, M.; van der Leeuw, S. Dossier: «À propos des relations natures/sociétés»—The shift toward social-ecological systems perspectives: Insights into the human-nature relationship. Nat. Sci. Soc. 2015, 23, 166–174. [Google Scholar] [CrossRef]
- Leach, M.; Reyers, B.; Bai, X.; Brondizio, E.S.; Cook, C.; Díaz, S.; Espindola, G.; Scobie, M.; Stafford-Smith, M.; Subramanian, S.M. Equity and sustainability in the Anthropocene: A social–ecological systems perspective on their intertwined futures. Glob. Sustain. 2018, 1, e13. [Google Scholar] [CrossRef]
- Liu, J.; Dietz, T.; Carpenter, S.R.; Alberti, M.; Folke, C.; Moran, E.; Pell, A.N.; Deadman, P.; Kratz, T.; Lubchenco, J.; et al. Complexity of coupled human and natural systems. Science 2007, 317, 1513–1516. [Google Scholar] [CrossRef] [PubMed]
- UN. Report of the Interagency and Expert Group on Sustainable Development Goal Indicators; United Nations Economic and Social Council: New York, NY, USA, 2016. [Google Scholar]
- Biggs, R.; Schlüter, M.; Schoon, M.L. Principles for Building Resilience, Sustaining Ecosystem Services in Social-Ecological System; Cambridge University Press: Cambridge, UK, 2015; ISBN 978-1-107-08265-6. [Google Scholar]
- Preiser, R.; Biggs, R.; De Vos, A.; Folke, C. Social-ecological systems as complex adaptive systems: Organizing principles for advancing research methods and approaches. Ecol. Soc. 2018, 23, art46. [Google Scholar] [CrossRef]
- Fischer-Kowalski, M.; Weisz, H. The Archipelago of Social Ecology and the Island of the Vienna School. In Social Ecology. Society–Nature Relations across Time and Space; Springer Int’l Publishing: Cham, Switzerland, 2016; pp. 3–28. ISBN 978-3-319-33324-3. [Google Scholar]
- Berryman, A.A. The Conceptual Foundations of Ecological Dynamics. Bull. Ecol. Soc. Am. 1989, 70, 230–236. [Google Scholar]
- Hull, V.; Tuanmu, M.N.; Liu, J. Synthesis of human-nature feedbacks. Ecol. Soc. 2015, 20, 17. [Google Scholar] [CrossRef]
- Claessens, L.; Schoorl, J.M.; Verburg, P.H.; Geraedts, L.; Veldkamp, A. Modelling interactions and feedback mechanisms between land use change and landscape processes. Agric. Ecosyst. Environ. 2009, 129, 157–170. [Google Scholar] [CrossRef]
- Armsworth, P.R.; Daily, G.C.; Kareiva, P.; Sanchirico, J.N. Land market feedbacks can undermine biodiversity conservation. Proc. Natl. Acad. Sci. USA 2006, 103, 5403–5408. [Google Scholar] [CrossRef] [PubMed]
- Miller, B.W.; Caplow, S.C.; Leslie, P.W. Feedbacks between Conservation and Social-Ecological Systems. Conserv. Biol. 2012, 26, 218–227. [Google Scholar] [CrossRef] [PubMed]
- Sundkvist, Å.; Milestad, R.; Jansson, A. On the importance of tightening feedback loops for sustainable development of food systems. Food Policy 2005, 30, 224–239. [Google Scholar] [CrossRef]
- Tilman, D. Global environmental impacts of agricultural expansion: The need for sustainable and efficient practices. Proc. Natl. Acad. Sci. USA 1999, 96, 5995–6000. [Google Scholar] [CrossRef] [PubMed]
- Bennett, E.M.; Carpenter, S.R.; Caraco, N.F. Human Impact on Erodable Phosphorus and Eutrophication: A Global Perspective. Bioscience 2001, 51, 227. [Google Scholar] [CrossRef]
- Hamann, M.; Biggs, R.; Reyers, B. Mapping social-ecological systems: Identifying “green-loop” and “red-loop” dynamics based on characteristic bundles of ecosystem service use. Glob. Environ. Chang. 2015, 34, 218–226. [Google Scholar] [CrossRef]
- Folke, C. Resilience (Republished). Ecol. Soc. 2016, 21, art44. [Google Scholar] [CrossRef]
- Carson, M.; Perterson, G. Arctic Council 2016. Arctic Resilience Report; Carson, M., Peterson, G., Eds.; Stockholm Environment Institute & Stockholm Resilience Centre: Stockholm, Sweden, 2016; ISBN 9789186125455. [Google Scholar]
- Polasky, S.; Bryant, B.; Hawthorne, P.; Johnson, J.; Keeler, B.; Pennington, D. Inclusive Wealth as a Metric of Sustainable Development. Annu. Rev. Environ. Resour. 2015, 40, 445–466. [Google Scholar] [CrossRef]
- Adger, W.N.; Vincent, K. Uncertainty in adaptive capacity. C. R. Geosci. 2005, 337, 399–410. [Google Scholar] [CrossRef]
- Engle, N.L.; Lemos, M.C. Unpacking governance: Building adaptive capacity to climate change of river basins in Brazil. Glob. Environ. Chang. 2010, 20, 4–13. [Google Scholar] [CrossRef]
- Fazey, I.; Fazey, J.A.; Fischer, J.; Sherren, K.; Warren, J.; Reed, F.; Dovers, S.R.; Noss, R.F. Adaptive leverage capacity for and learning to learn as leverage for social–ecological resilience. Front. Ecol. Environ. 2007, 5, 375–380. [Google Scholar] [CrossRef]
- Berkes, F.; Folke, C. Linking Social and Ecological Systems: Management Practices and Social Mechanisms for Building Resilience; Cambridge University Press: Cambridge, UK, 1998; ISBN 0521785626. [Google Scholar]
- Quinlan, A.E.; Berbés-Blázquez, M.; Haider, L.J.; Peterson, G.D. Measuring and assessing resilience: Broadening understanding through multiple disciplinary perspectives. J. Appl. Ecol. 2016, 53, 677–687. [Google Scholar] [CrossRef]
- Cundill, G.; Leitch, A.; Schultz, L.; Armitage, D.; Peterson, G. Principle 5—Encourage Learning. In Principles for Building Resilience: Sustaining Ecosystem Services in Social-Ecological Systems; Biggs, R., Schluter, M., Schoon, M., Eds.; Cambridge University Press: Cambridge, UK, 2015; pp. 174–192. ISBN 9781107082656. [Google Scholar]
- Leitch, A.; Cundill, G.; Schultz, L. 8 Principle 6–Broaden participation. In Principles for Building Resilience: Sustaining Ecosystem Services in Social-Ecological Systems; Biggs, R., Schluter, M., Schoon, M., Eds.; Cambridge University Press: Cambridge, UK, 2015; pp. 201–225. [Google Scholar]
- Schoon, M.L.; Robards, M.D.; Meek, C.L.; Galaz, V. Principle 7—Promote polycentric governance systems. In Principles for Building Resilience: Sustaining Ecosystem Services in Social-Ecological Systems; Biggs, R., Schluter, M., Schoon, M.L., Eds.; Cambridge University Press: Cambridge, UK, 2015; pp. 226–250. ISBN 9781316014240 | 9781107082656. [Google Scholar]
- Norberg, J.; Cumming, G.S. Complexity Theory for a Sustainable Future; Columbia University Press: New York, NY, USA, 2008; ISBN 0231508867. [Google Scholar]
- Scholes, R.J.; Biggs, R. A biodiversity intactness index. Nature 2005, 434, 45–49. [Google Scholar] [CrossRef] [PubMed]
- Loh, J.; Green, R.E.; Ricketts, T.; Lamoreux, J.F.; Jenkins, M.; Kapos, V.; Randers, J. The Living Planet Index: Using species population time series to track trends in biodiversity. Philos. Trans. R. Soc. Lond. B. Biol. Sci. 2005, 360, 289–295. [Google Scholar] [CrossRef] [PubMed]
- Mudaca, J.D.; Tsuchiya, T.; Yamada, M.; Onwona-Agyeman, S. Household participation in Payments for Ecosystem Services: A case study from Mozambique. For. Policy Econ. 2015, 55, 21–27. [Google Scholar] [CrossRef]
- Baker, T.J.; Cullen, B.; Debevec, L.; Abebe, Y. A socio-hydrological approach for incorporating gender into biophysical models and implications for water resources research. Appl. Geogr. 2015, 62, 325–338. [Google Scholar] [CrossRef]
- Lau, J.D.; Hicks, C.C.; Gurney, G.G.; Cinner, J.E. Disaggregating ecosystem service values and priorities by wealth, age, and education. Ecosyst. Serv. 2018, 29, 91–98. [Google Scholar] [CrossRef]
- Anand, S.; Sen, A.K. Human Development Index: Methodology and Measurement; Human Development Report Office: New York, NY, USA, 1994; 370p. [Google Scholar]
- Alkire, S.; Santos, M.E. Measuring Acute Poverty in the Developing World: Robustness and Scope of the Multidimensional Poverty Index. World Dev. 2014, 59, 251–274. [Google Scholar] [CrossRef]
- Raudsepp-Hearne, C.; Peterson, G.D.; Bennett, E.M. Ecosystem service bundles for analyzing tradeoffs in diverse landscapes. Proc. Natl. Acad. Sci. USA 2010, 107, 5242–5247. [Google Scholar] [CrossRef] [PubMed]
- Hamann, M.; Biggs, R.; Reyers, B. An exploration of human well-being bundles as identifiers of ecosystem service use patterns. PLoS ONE 2016, 11, e0163476. [Google Scholar] [CrossRef] [PubMed]
- Kotschy, K.; Biggs, R.; Daw, T.; Folke, C. 3 Principle 1—Maintain diversity and redundancy. In Principles for Building Resilience: Sustaining Ecosystem Services in Social-Ecological Systems; Biggs, R., Schluter, M., Schoon, M., Eds.; Cambridge University Press: Cambridge, UK, 2015; p. 290. ISBN 978-1-107-08265-6. [Google Scholar]
- Tilman, D.; Wedin, D.; Knops, J. Productivity and sustainability influenced by biodiversity in grassland ecosystems. Nature 1996, 379, 718–720. [Google Scholar] [CrossRef]
- Worm, B.; Barbier, E.B.; Beaumont, N.J.; Duffy, J.E.; Folke, C.; Halpern, B.S.; Jackson, J.B.C.; Lotze, H.K.; Micheli, F.; Palumbi, S.R.; et al. Impacts of biodiversity loss on ocean ecosystem services. Science 2006, 314, 787–790. [Google Scholar] [CrossRef] [PubMed]
- Tengö, M.; Hill, R.; Malmer, P.; Raymond, C.M.; Spierenburg, M.; Danielsen, F.; Elmqvist, T.; Folke, C. Weaving knowledge systems in IPBES, CBD and beyond—Lessons learned for sustainability. Curr. Opin. Environ. Sustain. 2017, 26–27, 17–25. [Google Scholar] [CrossRef]
- Sterling, E.J.; Filardi, C.; Toomey, A.; Sigouin, A.; Betley, E.; Gazit, N.; Newell, J.; Albert, S.; Alvira, D.; Bergamini, N.; et al. Biocultural approaches to well-being and sustainability indicators across scales. Nat. Ecol. Evol. 2017, 1, 1798–1806. [Google Scholar] [CrossRef] [PubMed]
- Díaz, S.; Pascual, U.; Stenseke, M.; Martín-López, B.; Watson, R.; Molnár, Z.; Hill, R.; Chan, K.; Baste, I.; Brauman, K.; et al. An inclusive approach to assess nature’s contributions to people. Science 2018, 359, 270–272. [Google Scholar] [CrossRef] [PubMed]
- Xiao, Y.; Drucker, J. Does economic diversity enhance regional disaster resilience? J. Am. Plan. Assoc. 2013, 79, 148–160. [Google Scholar] [CrossRef]
- Kent, R.; Dorward, A. Livelihood responses to Lantana camara invasion and biodiversity change in southern India: Application of an asset function framework. Reg. Environ. Chang. 2014, 15, 353–364. [Google Scholar] [CrossRef]
- Leslie, P.; McCabe, J.T. Response Diversity and Resilience in Social-Ecological Systems. Curr. Anthropol. 2013, 54, 114–143. [Google Scholar] [CrossRef] [PubMed]
- Daw, T.M.; Coulthard, S.; Cheung, W.W.L.; Brown, K.; Abunge, C.; Galafassi, D.; Peterson, G.D.; McClanahan, T.R.; Omukoto, J.O.; Munyi, L. Evaluating taboo trade-offs in ecosystems services and human well-being. Proc. Natl. Acad. Sci. USA 2015, 112, 6949–6954. [Google Scholar] [CrossRef] [PubMed]
- Hicks, C.C.; Cinner, J.E. Social, institutional, and knowledge mechanisms mediate diverse ecosystem service benefits from coral reefs. Proc. Natl. Acad. Sci. USA 2014, 111, 17791–17796. [Google Scholar] [CrossRef] [PubMed]
- Selomane, O.; Reyers, B.; Biggs, R.; Tallis, H.; Polasky, S. Towards integrated social-ecological sustainability indicators: Exploring the contribution and gaps in existing global data. Ecol. Econ. 2015, 118, 140–146. [Google Scholar] [CrossRef]
- Kaijser, A.; Kronsell, A. Climate change through the lens of intersectionality. Env. Politics 2014, 23, 417–433. [Google Scholar] [CrossRef]
- Kawarazuka, N.; Locke, C.; McDougall, C.; Kantor, P.; Morgan, M. Bringing analysis of gender and social–ecological resilience together in small-scale fisheries research: Challenges and opportunities. Ambio 2017, 46, 201–213. [Google Scholar] [CrossRef] [PubMed]
- Pickett, S.T.A.; Cadenasso, M.L. The Ecosystem as a Multidimensional Concept: Meaning, Model, and Metaphor. Ecosystems 2002, 5, 1–10. [Google Scholar] [CrossRef]
- Alkire, S. Dimensions of Human Development. World Dev. 2002, 30, 181–205. [Google Scholar] [CrossRef]
- Barbier, E.B.; Koch, E.W.; Silliman, B.R.; Hacker, S.D.; Wolanski, E.; Primavera, J.; Granek, E.F.; Polasky, S.; Aswani, S.; Cramer, L.A.; et al. Coastal ecosystem-based management with nonlinear ecological functions and values. Science 2008, 319, 321–323. [Google Scholar] [CrossRef] [PubMed]
- Rial, J.A.; Sr. Pielke, R.A.; Beniston, M.; Claussen, M.; Canadell, J.; Cox, P.; Held, H.; de Noblet-Ducoudré, N.; Prinn, R.; Reynolds, J.F.; et al. Nonlinearities, Feedbacks and Critical Thresholds within the Earth’s Climate System. Clim. Chang. 2004, 65, 11–38. [Google Scholar] [CrossRef]
- Drazin, P.G. Nonlinear Systems; Cambridge University Press: Cambridge, UK, 1992; ISBN 9781139172455. [Google Scholar]
- Pascual, U.; Palomo, I.; Adams, W.M.; Chan, K.M.A.; Daw, T.M.; Garmendia, E.; Gómez-Baggethun, E.; de Groot, R.S.; Mace, G.M.; Martín-López, B.; et al. Off-stage ecosystem service burdens: A blind spot for global sustainability. Environ. Res. Lett. 2017, 12, 075001. [Google Scholar] [CrossRef]
- Scheffer, M.; Carpenter, S.R. Catastrophic regime shifts in ecosystems: Linking theory to observation. Trends Ecol. Evol. 2003, 18, 648–656. [Google Scholar] [CrossRef]
- Schlüter, M.; McAllister, R.R.J.; Arlinghaus, R.; Bunnefeld, N.; Eisenack, K.; Hölker, F.; Milner-Gulland, E.J.; Müller, B.; Nicholson, E.; Quaas, M.; et al. New horizons for managing the environment: A review of coupled social-ecological systems modeling. Nat. Resour. Model. 2012, 25, 219–272. [Google Scholar] [CrossRef]
- Barabasi, A.-L.; Albert, R. Emergence of scaling in random networks. Science 1999, 286, 509–512. [Google Scholar] [CrossRef] [PubMed]
- Biggs, R.; Carpenter, S.R.; Brock, W.A. Turning back from the brink: Detecting an impending regime shift in time to avert it. Proc. Natl. Acad. Sci. USA 2009, 106, 826–831. [Google Scholar] [CrossRef] [PubMed]
- Kinzig, A.P.; Ryan, P.; Etienne, M.; Allison, H.; Elmqvist, T.; Walker, B.H. Resilience and regime shifts:assessing cascading effects. Ecol. Soc. 2006, 11, 20. [Google Scholar] [CrossRef]
- Scheffer, M.; Carpenter, S.R.S.; Foley, J.A.; Folke, C.; Walker, B. Catastrophic shifts in ecosystems. Nature 2001, 413, 591–596. [Google Scholar] [CrossRef] [PubMed]
- Spanbauer, T.L.; Allen, C.R.; Angeler, D.G.; Eason, T.; Fritz, S.C.; Garmestani, A.S.; Nash, K.L.; Stone, J.R. Prolonged instability prior to a regime shift. PLoS ONE 2014, 9, e108936. [Google Scholar] [CrossRef] [PubMed]
- Lade, S.J.; Gross, T. Early warning signals for critical transitions: A generalized modeling approach. PLoS Comput. Biol. 2012, 8, e1002360. [Google Scholar] [CrossRef] [PubMed]
- Scheffer, M.; Carpenter, S.R.; Lenton, T.M.; Bascompte, J.; Brock, W.; Dakos, V.; Van De Koppel, J.; Van De Leemput, I.A.; Levin, S.A.; Van Nes, E.H.; et al. Anticipating critical transitions. Science 2012, 338, 344–348. [Google Scholar] [CrossRef] [PubMed]
- Wang, R.; Dearing, J.A.; Langdon, P.G.; Zhang, E.; Yang, X.; Dakos, V.; Scheffer, M. Flickering gives early warning signals of a critical transition to a eutrophic lake state. Nature 2012, 492, 419–422. [Google Scholar] [CrossRef] [PubMed]
- Rockström, J.; Steffen, W.; Noone, K.; Persson, A.; Chapin, F.S.; Lambin, E.F.; Lenton, T.M.; Scheffer, M.; Folke, C.; Schellnhuber, H.J.; et al. A safe operating space for humanity. Nature 2009, 461, 472–475. [Google Scholar] [CrossRef] [PubMed]
- Steffen, W.; Richardson, K.; Rockström, J.; Cornell, S.E.; Fetzer, I.; Bennett, E.M.; Biggs, R.; Carpenter, S.R.; de Vries, W.; de Wit, C.A.; et al. Planetary boundaries: Guiding human development on a changing planet. Science 2015, 347, 1259855. [Google Scholar] [CrossRef] [PubMed]
- Tharme, R.E. A global perspective on environmental flow assessment: Emerging trends in the development and application of environmental flow methodologies for rivers. River Res. Appl. 2003, 19, 397–441. [Google Scholar] [CrossRef]
- Raworth, K. Oxfam Discussion Papers: A Safe and Just Space for Humanity: Can We Live within the Doughnut (Oxfam Discussion Paper); Oxfam: Oxford, UK, 2012; Volume 461. [Google Scholar]
- Nussbaum, M.; Sen, A. (Eds.) The Quality of Life; Oxford University Press: Oxford, UK, 1993; ISBN 9780198287971. [Google Scholar]
- Adger, W.N.; Brown, K.; Tompkins, E.L. The Political Economy of Cross-Scale Networks in Resource Co-Management. Ecol. Soc. 2005, 10. [Google Scholar] [CrossRef]
- Cash, D.W.; Adger, W.N.; Berkes, F.; Garden, P.; Lebel, L.; Olsson, P.; Pritchard, L.; Young, O. Scale and Cross-Scale Dynamics: Governance and Information in a Multilevel World. Ecol. Soc. 2006, 11, art8. [Google Scholar] [CrossRef]
- Grimm, N.B.; Foster, D.; Groffman, P.; Grove, J.M.; Hopkinson, C.S.; Nadelhoffer, K.J.; Pataki, D.E.; Peters, D.P. The changing landscape: Ecosystem responses to urbanization and pollution across climatic and societal gradients. Front. Ecol. Environ. 2008, 6, 264–272. [Google Scholar] [CrossRef]
- Keys, P.W.; Wang-Erlandsson, L.; Gordon, L.J. Revealing Invisible Water: Moisture Recycling as an Ecosystem Service. PLoS ONE 2016, 11, e0151993. [Google Scholar] [CrossRef] [PubMed]
- Barnett, J.; Evans, L.S.; Gross, C.; Kiem, A.S.; Kingsford, R.T.; Palutikof, J.P.; Pickering, C.M.; Smithers, S.G. From barriers to limits to climate change adaptation: Path dependency and the speed of change. Ecol. Soc. 2015, 20, art5. [Google Scholar] [CrossRef]
- Dearing, J.A.; Yang, X.; Dong, X.; Zhang, E.; Chen, X.; Langdon, P.G.; Zhang, K.; Zhang, W.; Dawson, T.P. Extending the timescale and range of ecosystem services through paleoenvironmental analyses: The example of the lower Yangtze basin. Proc. Natl. Acad. Sci. USA 2012, 109, E1111–E1120. [Google Scholar] [CrossRef] [PubMed]
- Zhang, K.; Dearing, J.A.; Dawson, T.P.; Dong, X.; Yang, X.; Zhang, W. Poverty alleviation strategies in eastern China lead to critical ecological dynamics. Sci. Total Environ. 2015, 506–507, 164–181. [Google Scholar] [CrossRef] [PubMed]
- Davidson, J.L.; Jacobson, C.; Lyth, A.; Dedekorkut-Howes, A.; Baldwin, C.L.; Ellison, J.C.; Holbrook, N.J.; Howes, M.J.; Serrao-Neumann, S.; Singh-Peterson, L.; et al. Interrogating resilience: Toward a typology to improve its operationalization. Ecol. Soc. 2016, 21, art27. [Google Scholar] [CrossRef]
- Leslie, H.M.; Basurto, X.; Nenadovic, M.; Sievanen, L.; Cavanaugh, K.C.; Cota-Nieto, J.J.; Erisman, B.E.; Finkbeiner, E.; Hinojosa-Arango, G.; Moreno-Báez, M.; et al. Operationalizing the social-ecological systems framework to assess sustainability. Proc. Natl. Acad. Sci. USA 2015, 112, 5979–5984. [Google Scholar] [CrossRef] [PubMed]
- Haug, M.R. Measurement in Social Stratification. Annu. Rev. Sociol. 1977, 3, 51–77. [Google Scholar] [CrossRef]
- Daw, T.; Brown, K.; Rosendo, S.; Pomeroy, R. Applying the ecosystem services concept to poverty alleviation: The need to disaggregate human well-being. Environ. Conserv. 2011, 38, 370–379. [Google Scholar] [CrossRef]
- Unterhalter, E. Poverty, education, gender and the Millennium Development Goals: Reflections on boundaries and intersectionality. Theory Res. Educ. 2012, 10, 253–274. [Google Scholar] [CrossRef]
- Dawson, N.; Martin, A. Assessing the contribution of ecosystem services to human wellbeing: A disaggregated study in western Rwanda. Ecol. Econ. 2015, 117, 62–72. [Google Scholar] [CrossRef]
- Butchart, S.H.M.; Walpole, M.; Collen, B.; van Strien, A.; Scharlemann, J.P.W.; Almond, R.E.A.; Baillie, J.E.M.; Bomhard, B.; Brown, C.; Bruno, J.; et al. Global biodiversity: Indicators of recent declines. Science 2010, 328, 1164–1168. [Google Scholar] [CrossRef] [PubMed]
- WWF. Living Planet Report: Risk and Resilience in a New Era; WWF International: Gland, Switzerland, 2016; ISBN 9783946211068. [Google Scholar]
- Boonstra, W.J.; Björkvik, E.; Haider, L.J.; Masterson, V. Human responses to social-ecological traps. Sustain. Sci. 2016, 11, 877–889. [Google Scholar] [CrossRef] [PubMed]
- Winter, K.; Lincoln, N.; Berkes, F.; Winter, K.B.; Lincoln, N.K.; Berkes, F. The Social-Ecological Keystone Concept: A Quantifiable Metaphor for Understanding the Structure, Function, and Resilience of a Biocultural System. Sustainability 2018, 10, 3294. [Google Scholar] [CrossRef]
- Nelson, G.C. Untangling the Environmentalist’s Paradox: Better Data, Better Accounting, and Better Technology Will Help. Bioscience 2011, 61, 9–10. [Google Scholar] [CrossRef]
- Ang, F.; Van Passel, S. Beyond the Environmentalist’s Paradox and the Debate on Weak versus Strong Sustainability. Bioscience 2012, 62, 251–259. [Google Scholar] [CrossRef]
- Dallimer, M.; Davies, Z.G.; Diaz-Porras, D.F.; Irvine, K.N.; Maltby, L.; Warren, P.H.; Armsworth, P.R.; Gaston, K.J. Historical influences on the current provision of multiple ecosystem services. Glob. Environ. Chang. 2015, 31, 307–317. [Google Scholar] [CrossRef]
- Galaz, V.; Moberg, F.; Olsson, E.K.; Paglia, E.; Parker, C. Institutional and political leadership dimensions of cascading ecological crises. Public Adm. 2011, 89, 361–380. [Google Scholar] [CrossRef]
- Galaz, V.; Tallberg, J.; Boin, A.; Ituarte-Lima, C.; Hey, E.; Olsson, P.; Westley, F. Global Governance Dimensions of Globally Networked Risks: The State of the Art in Social Science Research. Risk Hazards Cris. Public Policy 2017, 8, 4–27. [Google Scholar] [CrossRef]
- Sachs, J.D.; McArthur, J.W. The Millennium Project: A plan for meeting the Millennium Development Goals. Lancet 2005, 365, 347–353. [Google Scholar] [CrossRef]
- Wilcock, S.; Hossain, S.; Poppy, G.M. Managing Complex Systems To Enhance Sustainability. In Stressors in the Marine Environment; Oxford University Press: Oxford, UK, 2016; pp. 301–312. [Google Scholar]
- De Groot, R.S. A typology for the classification, description and valuation of ecosystem functions, goods and services. Ecol. Econ. 2002, 41, 393–408. [Google Scholar] [CrossRef]
- Müller, F.; Burkhard, B. The indicator side of ecosystem services. Ecosyst. Serv. 2012, 1, 26–30. [Google Scholar] [CrossRef]
- Tallis, H.; Mooney, H.A.; Sandy, A.; Balvanera, P.; Cramer, W.; Daniel, K.; Polasky, S.; Reyers, B.; Ricketts, T.; Running, S.; et al. A global system for monitoring ecosystem service change. Bioscience 2012, 62, 977–986. [Google Scholar] [CrossRef]
- Reyers, B.; Biggs, R.; Cumming, G.S.; Elmqvist, T.; Hejnowicz, A.P.; Polasky, S. Getting the measure of ecosystem services: A social-ecological approach. Front. Ecol. Environ. 2013, 11, 268–273. [Google Scholar] [CrossRef]
- Erb, K.H. How a socio-ecological metabolism approach can help to advance our understanding of changes in land-use intensity. Ecol. Econ. 2012, 76, 8–14. [Google Scholar] [CrossRef] [PubMed]
- Kennedy, C.A.; Cuddihy, J.; Engel-Yan, J. The changing metabolism of cities. J. Ind. Ecol. 2007, 11, 43–59. [Google Scholar] [CrossRef]
- Binder, C.R.; Hinkel, J.; Bots, P.W.G.; Claudia, P.-W.; Pahl-Wostl, C.; Claudia, P.-W. Comparison of Frameworks for Analyzing Social-ecological Systems. Ecol. Soc. 2013, 18, 26. [Google Scholar] [CrossRef]
- Scholz, R.W. Environmental Literacy in Scienceand Society From Knowledge to Decisions; Cambridge University Press: Cambridge, UK, 2011; ISBN 0095-3628. [Google Scholar]
- Plahte, E.; Thomas, M.; Omholt, S.W. Feedback loops, stability and multistationarity in dynamical systems. J. Biol. Syst. 1995, 3, 409–413. [Google Scholar] [CrossRef]
- Dawson, N.; Grogan, K.; Martin, A.; Mertz, O.; Pasgaard, M.; Vang Rasmussen, L. Environmental justice research shows the importance of social feedbacks in ecosystem service trade-offs. Ecol. Soc. 2017, 22. [Google Scholar] [CrossRef]
- Biggs, R.; Schlüter, M.; Biggs, D.; Bohensky, E.L.; BurnSilver, S.; Cundill, G.; Dakos, V.; Daw, T.M.; Evans, L.S.; Kotschy, K.; et al. Toward Principles for Enhancing the Resilience of Ecosystem Services. Annu. Rev. Environ. Resour. 2012, 37, 421–448. [Google Scholar] [CrossRef]
- Poppy, G.M.; Chiotha, S.; Eigenbrod, F.; Harvey, C.A.; Honzák, M.; Hudson, M.D.; Jarvis, A.; Madise, N.J.; Schreckenberg, K.; Shackleton, C.M.; et al. Food security in a perfect storm: Using the ecosystem services framework to increase understanding. Philos. Trans. R. Soc. Lond. B. Biol. Sci. 2014, 369, 20120288. [Google Scholar] [CrossRef] [PubMed]
- Kafumbata, D.; Jamu, D.; Chiotha, S. Riparian ecosystem resilience and livelihood strategies under test: Lessons from Lake Chilwa in Malawi and other lakes in Africa. Philos. Trans. R. Soc. Lond. B. Biol. Sci. 2014, 369, 20130052. [Google Scholar] [CrossRef] [PubMed]
- Folke, C.; Biggs, R.; Norstrom, A.V.; Reyers, B.; Rockstrom, J. Social-ecological resilience and biosphere-based sustainability science. Ecol. Soc. 2016, 21, 41. [Google Scholar] [CrossRef]
- Goodwin, H. Measuring and Reporting the Impact of Tourism on Poverty. In Developments in Tourism Research; Elsevier: Amsterdam, The Netherlands, 2011; pp. 1–13. [Google Scholar] [CrossRef]
- Cockburn, J.; Palmer, C.; Biggs, H.; Rosenberg, E. Navigating Multiple Tensions for Engaged Praxis in a Complex Social-Ecological System. Land 2018, 7, 129. [Google Scholar] [CrossRef]
- Talbot, M.; van den Broeck, D. Shifting from Individual to Collective Action: Living Land’s experience in the Baviaanskloof, South Africa. In Land Restoration: Reclaiming Landscapes for a Sustainable Future; Elsevier: Amsterdam, The Netherlands, 2015; pp. 521–531. ISBN 9780128013533. [Google Scholar]
- Swilling, M.; Hajer, M. Governance of urban transitions: Towards sustainable resource efficient urban infrastructures. Environ. Res. Lett. 2017, 12, 125007. [Google Scholar] [CrossRef]
- Wilson, S.; Pearson, L.J.; Kashima, Y.; Lusher, D.; Pearson, C. Separating Adaptive Maintenance (Resilience) and Transformative Capacity of Social-Ecological Systems. Ecol. Soc. 2013, 18, art22. [Google Scholar] [CrossRef]
- Brown, K.; Westaway, E. Agency, Capacity, and Resilience to Environmental Change: Lessons from Human Development, Well-Being, and Disasters. Annu. Rev. Environ. Resour. 2011, 36, 321–342. [Google Scholar] [CrossRef]
- Marshall, N.A.; Park, S.E.; Adger, W.N.; Brown, K.; Howden, S.M. Transformational capacity and the influence of place and identity. Environ. Res. Lett. 2012, 7, 034022. [Google Scholar] [CrossRef]
- Raworth, K. Doughnut Economics: Seven Ways to Think Like a 21st Century Economist; Random House Business Books: London, UK, 2017; ISBN 9781473517813. [Google Scholar]
- Parlee, B.L.; Geertsema, K.; Willier, A. Social-ecological thresholds in a changing boreal landscape: Insights from cree knowledge of the Lesser Slave Lake region of Alberta, Canada. Ecol. Soc. 2012, 17, art20. [Google Scholar] [CrossRef]
- Warner, K. Global environmental change and migration: Governance challenges. Glob. Environ. Chang. 2010, 20, 402–413. [Google Scholar] [CrossRef]
- Mace, G.; Baillie, J.E.M. The 2010 Biodiversity Indicators: Challenges for Science and Policy. Conserv. Biol. 2007, 21, 1406–1413. [Google Scholar] [CrossRef] [PubMed]
- Stafford-Smith, M.; Griggs, D.; Gaffney, O.; Ullah, F.; Reyers, B.; Kanie, N.; Stigson, B.; Shrivastava, P.; Leach, M.; O’Connell, D. Integration: The key to implementing the Sustainable Development Goals. Sustain. Sci. 2017, 12, 911–919. [Google Scholar] [CrossRef] [PubMed]
- Kim, R.E. The emergent network structure of the multilateral environmental agreement system. Glob. Environ. Chang. 2013, 23, 980–991. [Google Scholar] [CrossRef]
- Haider, L.J.; Iribarrem, A.; Gardner, T.; Latawiec, A.E.; Alves-Pinto, H.; Strassburg, B. 2 Understanding Indicators And Monitoring For Sustainability in the Context of Complex Social-Ecological Systems. In Sustainability Indicators in Practice; Latawiec, A.E., Agol, D., Eds.; De Gruyter: Boston, MA, USA, 2015. [Google Scholar]


© 2019 by the authors. Licensee MDPI, Basel, Switzerland. This article is an open access article distributed under the terms and conditions of the Creative Commons Attribution (CC BY) license (http://creativecommons.org/licenses/by/4.0/).
Share and Cite
Selomane, O.; Reyers, B.; Biggs, R.; Hamann, M. Harnessing Insights from Social-Ecological Systems Research for Monitoring Sustainable Development. Sustainability 2019, 11, 1190. https://doi.org/10.3390/su11041190
Selomane O, Reyers B, Biggs R, Hamann M. Harnessing Insights from Social-Ecological Systems Research for Monitoring Sustainable Development. Sustainability. 2019; 11(4):1190. https://doi.org/10.3390/su11041190
Chicago/Turabian StyleSelomane, Odirilwe, Belinda Reyers, Reinette Biggs, and Maike Hamann. 2019. "Harnessing Insights from Social-Ecological Systems Research for Monitoring Sustainable Development" Sustainability 11, no. 4: 1190. https://doi.org/10.3390/su11041190
APA StyleSelomane, O., Reyers, B., Biggs, R., & Hamann, M. (2019). Harnessing Insights from Social-Ecological Systems Research for Monitoring Sustainable Development. Sustainability, 11(4), 1190. https://doi.org/10.3390/su11041190