


Abstract
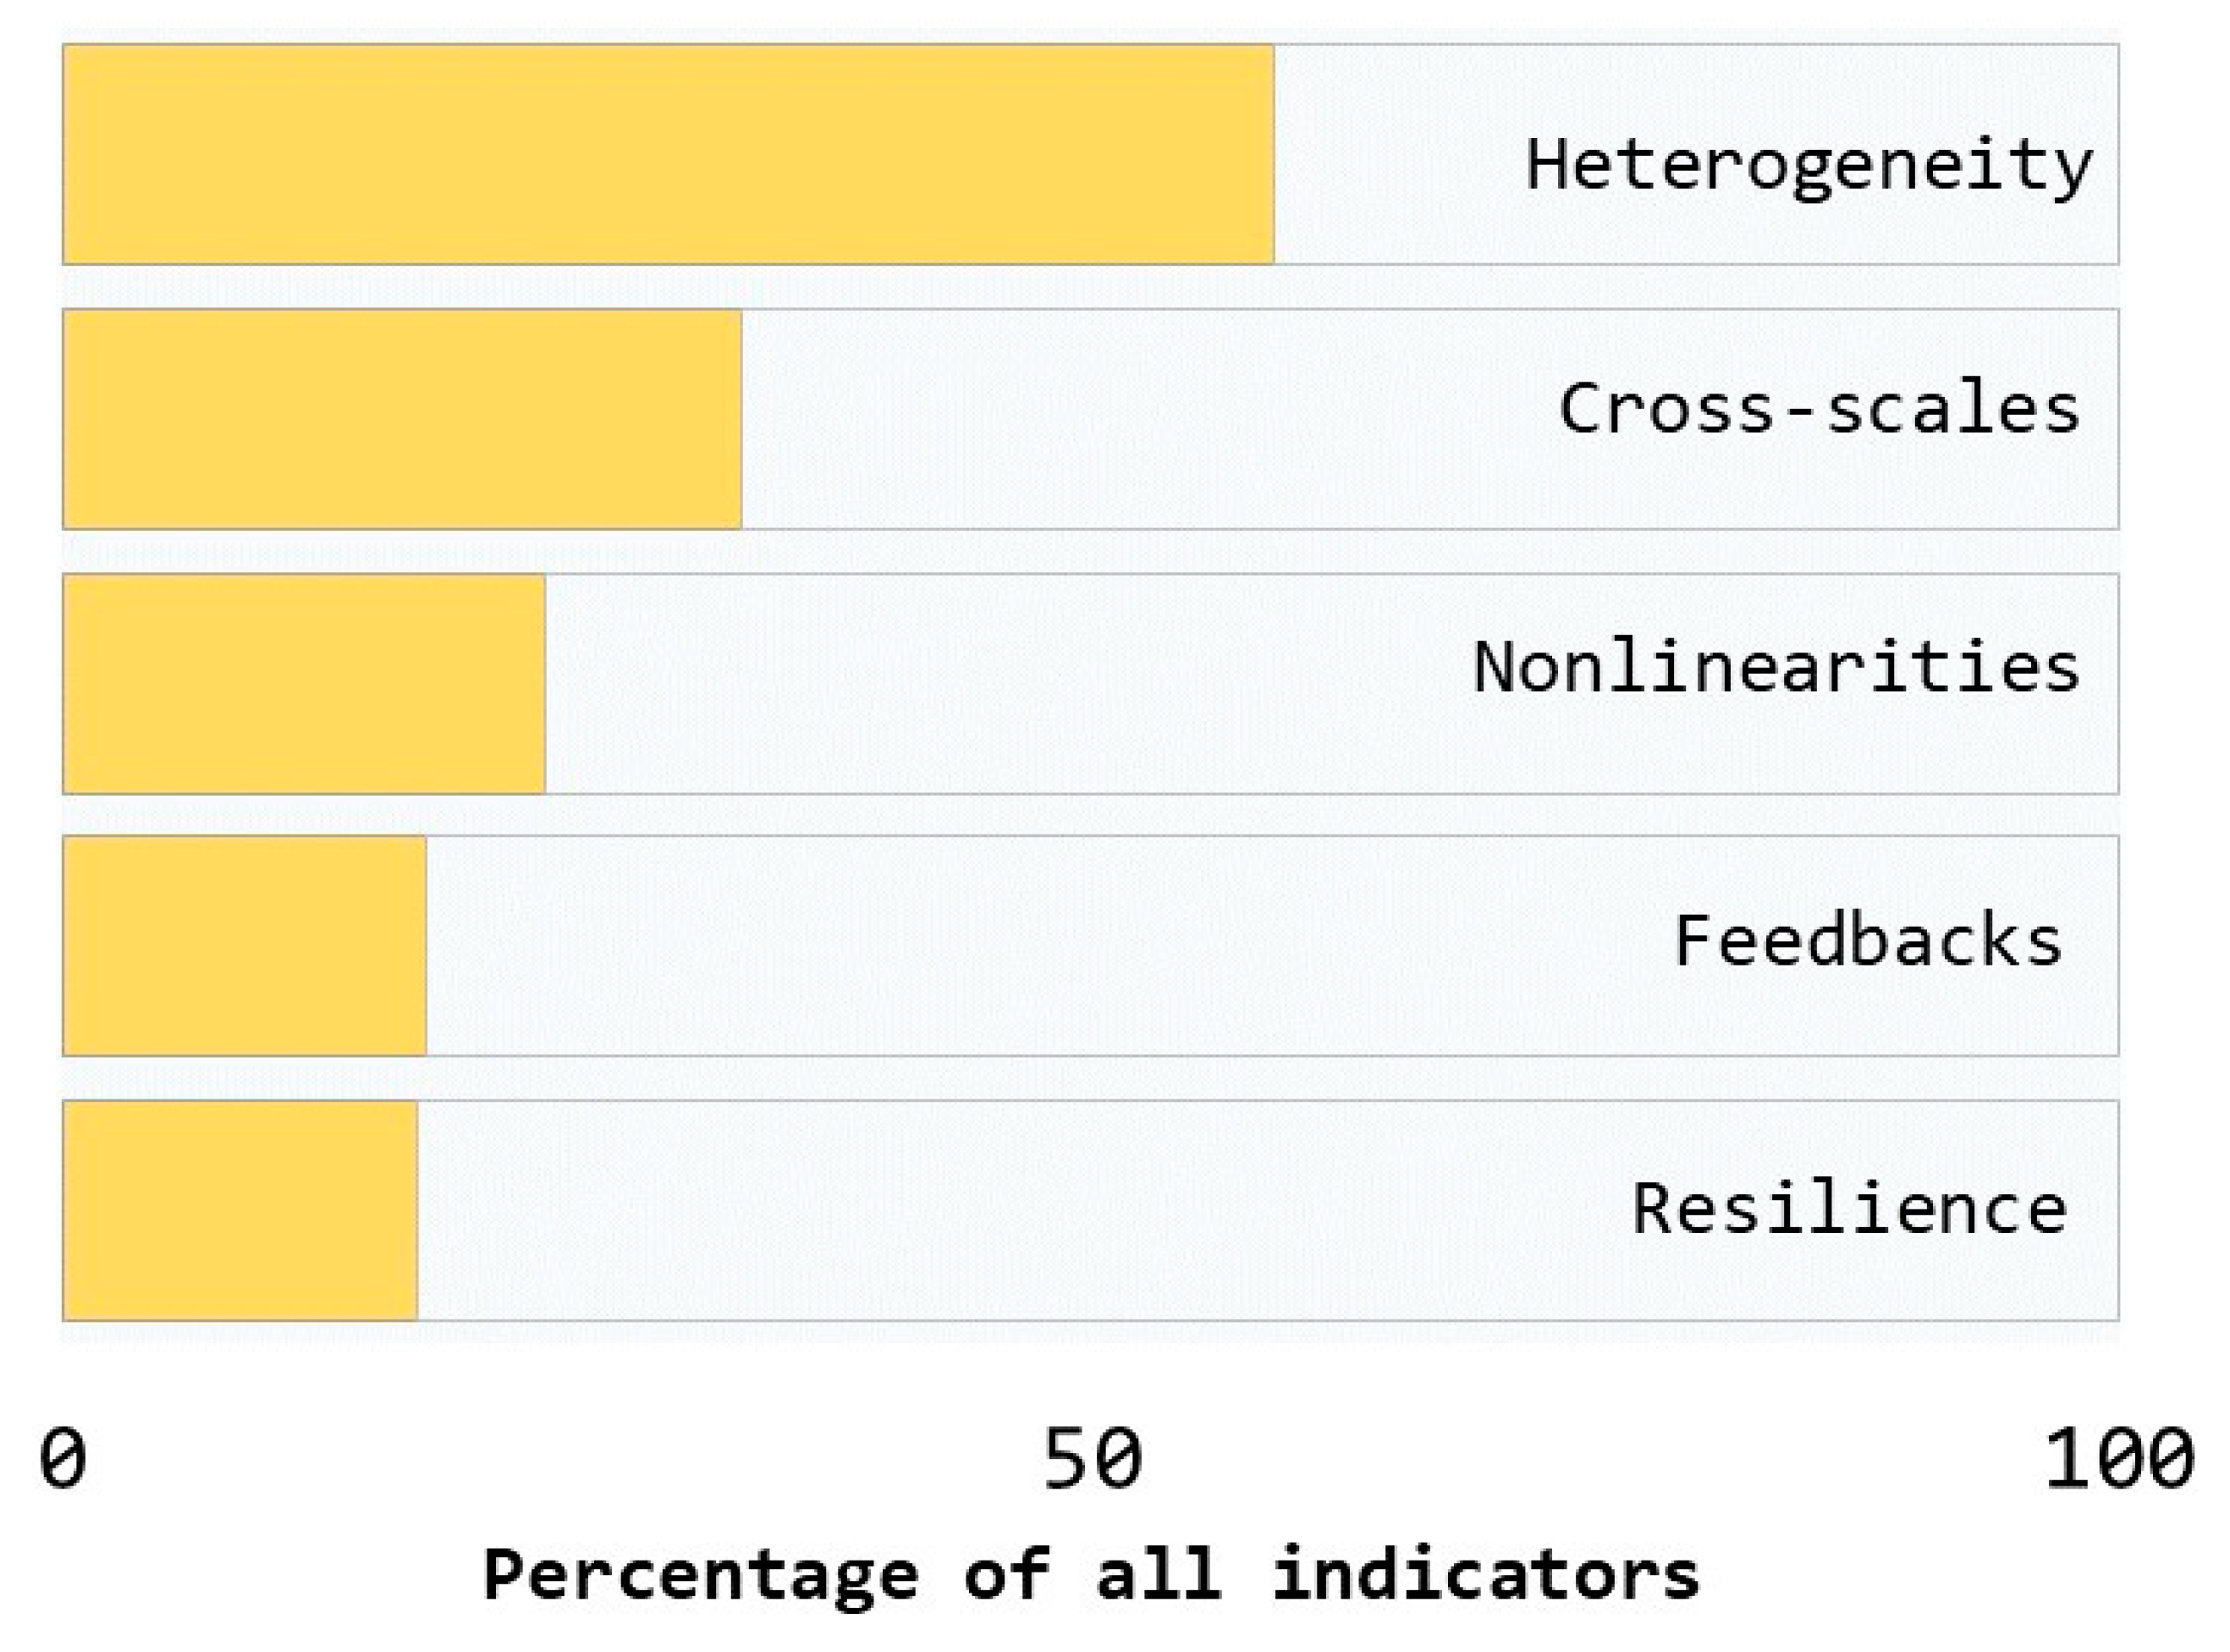
The United Nations’ Agenda 2030 marks significant progress towards sustainable development by making explicit the intention to integrate previously separate social, economic and environmental agendas. Despite this intention, the Sustainable Development Goals (SDGs) which were adopted to implement the agenda, are fragmented in their formulation and largely sectoral. We contend that while the design of the SDG monitoring is based on a systems approach, it still misses most of the dynamics and complexity relevant to sustainability outcomes. We propose that insights from the study of social-ecological systems offer a more integrated approach to the implementation of Agenda 2030, particularly the monitoring of progress towards sustainable development outcomes. Using five key features highlighted by the study of social-ecological systems (SESs) relevant to sustainable development: (1) social-ecological feedbacks, (2) resilience, (3) heterogeneity, (4) nonlinearity, and (5) cross-scale dynamics. We analyze the current set of SDG indicators based on these features to explore current progress in making them operational. Our analysis finds that 59% of the indicators account for heterogeneity, 33% for cross-scale dynamics, 23% for nonlinearities, and 18% and 17%, respectively, for social-ecological feedbacks and resilience. Our findings suggest limited use of complex SES science in the current design of SDG monitoring, but combining our findings with recent studies of methods to operationalize SES features suggests future directions for sustainable development monitoring for the current as well as post 2030 set of indicators.
1. Introduction
The major challenges currently facing the world, including persistent poverty, rising inequalities, biodiversity loss, and climate change, are increasingly recognized as the emergent outcomes of complex social and ecological interactions [1,2,3,4]. Climate change, for example, is recognized as one of the major threats to global health because it affects disease patterns, water and nutrition security, and the severity and frequency of extreme weather events [5,6]. Similarly, movements of resources through international trade and consumption patterns have been shown to affect biodiversity negatively by contributing to habitat destruction [7,8]. These examples are far from unique, as more and more interconnections between social and ecological systems and development challenges are emerging in this more hyper-connected era [1,9].
Importantly, social-ecological connections are not static, but change dynamically over time, and the consequences of changes in these connections are frequently non-linear and uncertain. In some cases, changes can accrue invisibly until a threshold or tipping point is reached [10,11]. In other cases, they are connected in space [12,13], with impacts appearing in seemingly unconnected distant areas, as shown more recently by studies of telecoupling [14,15,16,17,18]. These non-linear dynamics, which connect social and ecological systems across space and time, are key to efforts to achieve sustainable development, and neglecting them could result in recurring or new problem challenges for development.
The increased connectivity between social and ecological systems, and the dynamism associated with these interlinkages, presents two types of challenges to efforts in measuring and tracking progress towards sustainable development goals (SDGs). The first involves the need to more accurately represent the interconnections between social, economic, and ecological systems [19,20,21,22]. Failing to connect these has often resulted in undesirable trade-offs—many current ecological problems result from the neglect of the environment in economic and other measurement efforts [23,24]. The second involves understanding that these connections are not static, but dynamic, requiring the design of monitoring systems to be able to capture these dynamics including spatial, temporal, and cross-sectoral changes [25,26,27].
The first challenge is at the forefront of current efforts to implement Agenda 2030 of the United Nations, which highlights the interlinkages between social, environmental, and economic aspects of sustainable development. Declaration 18 aptly captures this intent: “We are announcing today 17 Sustainable Development Goals with 169 associated targets which are integrated and indivisible…” [28]. In response to this recognition of interlinked systems of nature, society, and economy, several “systems approaches” have been proposed to account for, monitor, and analyze trade-offs between these sub-systems in the implementation of the SDGs [29]. These system approaches highlight the need to capture and relate social, economic, and ecological components in order to assess and monitor progress to sustainable development [29,30,31] and are the main focus of several studies exploring sustainable development trade-offs [32,33,34,35,36].
However, sustainability outcomes are more than the sum of the ecological, economic, and the social “parts” of a system and are in fact also the result of complex interactions, feedbacks, and dynamics within and between systems. The study of complex adaptive systems has highlighted that interactions between individual and diverse components or actors results in emergent behavior or properties at a macro-level that cannot be predicted from micro-level components or properties [37,38,39]. This challenges the assumption underlying many system approaches, that micro-level monitoring of separate social, economic, and ecological variables can then be reconstructed to understand sustainability outcomes including trade-offs or possible future scenarios.
The second challenge can be addressed by broadening from a “systems” to a “complex adaptive systems” approach to monitor and analyze sustainable development, which has the potential to more adequately understand and track sustainability outcomes [22,40]. In an effort to explore what such broadening to a more dynamic and complex approach to sustainable development monitoring might entail, we interrogate the literature on complex social-ecological system (SES) approaches to sustainable development. SES is defined as complex adaptive systems, with strong interdependence and irreducibility between social and ecological systems across multiple scales. Recent reviews of this literature have highlighted key features that constitute complex SES relevant to sustainable development, including the importance of social-ecological interactions and feedbacks, non-linear dynamics, cross-scale (spatial and temporal) dynamics, diversity, and resilience [22,27,41]. Here we explore these key features of SES and evaluate their implications for sustainable development monitoring. We do so by first analyzing the current set of SDG indicators [42] using these features to explore current directions and gauge progress in making the features operational. Using these findings, as well as recent studies on complex SES and sustainable development, we then provide recommendations for sustainable development monitoring for the current set of indicators, as well as future improvements post-2030.
2. Materials and Methods
The core features of complex SES identified in previous reviews [22,27,41,43,44] are: (1) social-ecological feedbacks, (2) resilience, (3) heterogeneity, (4) nonlinearity, and (5) spatial and temporal cross-scale dynamics. We begin by analyzing the current set of SDG indicators in terms of the extent to which they include these core features. We do this using examples from existing SES research on measurable variables, or measurement methods aligned with the core features, and assess the extent to which each proposed SDG indicator uses such variables. We evaluated all 243 indicators from the 17 SDGs (See Appendix A). Below, we clarify the core features and explain how we applied each feature to evaluate the SDG indicators. Through this analysis of current indicators, we present a set of recommendations to harness the potential value that may be added by an SES perspective.
2.1. Social-Ecological Feedbacks
In addition to the components in a system, i.e., social factors (e.g., food security), ecological factors (e.g., forest health), and economic factors (e.g., market prices), interactions between these are also important for understanding and dealing with change. Interactions capture the flow of materials, energy, and waste between components of a system [45], and they create feedbacks when stimuli are fed back to their origin through one or a series of interactions [46,47]. For a feedback to occur, there first has to be an ‘initial’ trigger, represented by a unidirectional interaction from one phenomenon to another. This process can potentially involve a long string of components and interactions. Studies of feedbacks typically include ’process-impact’ relationships, where, for example, agricultural activity results in land degradation, which results in reduced agricultural activity, which in turn may result in further land degradation [48]. There are many similar examples showing different processes and impacts [49,50,51,52,53]. Our analysis of the SDG indicators showed few that account for feedbacks, and thus, we also included any indicators capturing interactions between social and ecological systems, e.g., ecosystem service use or governance of ecosystems [54].
2.2. Resilience
Resilience encompasses three elements: absorptive, adaptive, and transformative capacities [55], which sometimes overlap with one another. Many variables have been suggested to capture these capacities, including diversity of assets [56,57], social and demographic characteristics [58], and also the ability to self-organize, learn, and govern adaptively [59,60,61]. For this purpose, we adopt three of the seven principles of resilience [43], following [62], in which they split the seven principles into those focusing on the resilience of a system itself or its governance. The three principles chosen in this study are about the governance of a system, and the remaining four principles, which are left out, are dealt with in the other features. The three principles are: (1) encourage learning, which is a multifaceted phenomenon, including acquisition of information, skills, and interpreting knowledge differently [63], (2) broaden participation, which refers to the active engagement of relevant stakeholders in the management process [64], and (3) promote polycentric governance systems, which means governance system consisting of multiple governing authorities that interact across different levels of the policy process [65]. In evaluating the indicators, we identified those that mention or imply these three principles in their formulations by looking for mention of the words “learning”, “education”, “governance”, “management”, and “research” in the indicators.
2.3. Heterogeneity
Heterogeneity refers to the differentiation of system components [66]. System differentiation has previously been measured through indices of system diversity [67,68], socioeconomic or geographic characteristics [69,70,71], and indices showing multidimensionality of concepts such as bundles of ecosystem services [72,73,74,75]. Diversity comprises variety, disparity, and balance between system components [76]. This may include biodiversity [77,78], diversity of knowledge systems [79,80,81], diversity of livelihoods [82,83], and diversity or options for response to change [66,84]. Socioeconomic and geographic heterogeneity can be assessed by disaggregation of phenomena according to some criteria. In other studies, social differentiation is depicted through gender, poverty, or income classes [69,71,85,86,87], or through the intersections of such characteristics [88,89]. Finally, multidimensionality has been used to illustrate system components with multiple dimensions not adequately portrayed through single metrics, e.g., poverty, human wellbeing, or ecosystem health [73,90,91]. We identify indicators that capture any of these aspects of heterogeneity by looking for those indicators that are disaggregated by socioeconomic criteria (e.g., gender, sector, etc.), biological diversity (e.g., genetic diversity), or indicators that highlight multiple dimensions (e.g., human wellbeing outcomes). Studies have shown that more diversity is not always good—given that too much diversity could reduce efficiency, and too little could reduce resilience—which emphasizes the need to capture this feature in indicator sets to determine whether or not there is too much, or too little, diversity.
2.4. Nonlinearity
Nonlinearity is defined by the disproportionality between inputs and outputs, unexpected outcomes, or multiple equilibria [92,93,94]. Studies have linked the outcome of feedbacks between variables [95,96] and other factors, including emergence [97,98]. These nonlinear outcomes can result in sharp transitions over thresholds, and ultimately regime shifts (i.e., large, abrupt, and persistent changes in the structure and function of a system) [99,100,101]. Despite this understanding, the underlying assumptions behind most sustainable development indicators are that the phenomena they are measuring are linear.
Measurements or indicators currently used to observe nonlinearity include flickering (i.e., a period of instability before a regime shift occurs [102]), critical slowing down or increasing variance and autocorrelation, and recovery or return rate [103,104,105]. Because these variables generally require complex modelling, long term data, or both, and are therefore not immediately operable, we focused on the presence of stated or known thresholds in proposed indicators. These thresholds included any indicators with a defined limit or thresholds, as well as indicators for which we know existing approaches to define thresholds, e.g., the planetary boundary framework, ecological reserves, and limits [106,107,108]. We also use approaches that define minimum societal or individual requirements for development, such as the safe and just operating space [73,109,110].
2.5. Cross-Scales Dynamics
Recognizing the critical importance of feedbacks between social and ecological systems, SES research also highlights the multi- and cross-scale nature of these intertwined SES connections and feedbacks across time and space [41,111,112]. Studies on these dynamics have highlighted the importance of biophysical teleconnections and social-ecological telecouplings that link transboundary as well as far distant systems to each other [15,113,114]. Similarly, temporal links such as legacy effects, path dependencies, and time lags are the impact of prior actions, processes, natural phenomena, or other circumstances on later conditions and the (often delayed) time it takes for that impact to manifest [41,115]. Determining these cross-scale impacts is a difficult, but essential, task for sustainable development monitoring [12]. Such monitoring requires multi-scalar and multi-decadal data, or models where data are not available [105,116]. As the current indicator set is proposed for national and global reporting (although problematic for capturing cross-scale feedbacks), we focus here on the temporal cross-scale aspects of monitoring and come back to spatial scale in the recommendations. From a review of SDG indicators, little is mentioned regarding temporal dynamics, and so we rather focus on exploring whether indicators are based on time series data, with more than 10 years of data available. While most of the temporal dynamics can be modelled in cases where relationships between variables are known [105,117], time series data can be used to establish relationships, which were previously unknown, by observing how variables vary together.
3. Results
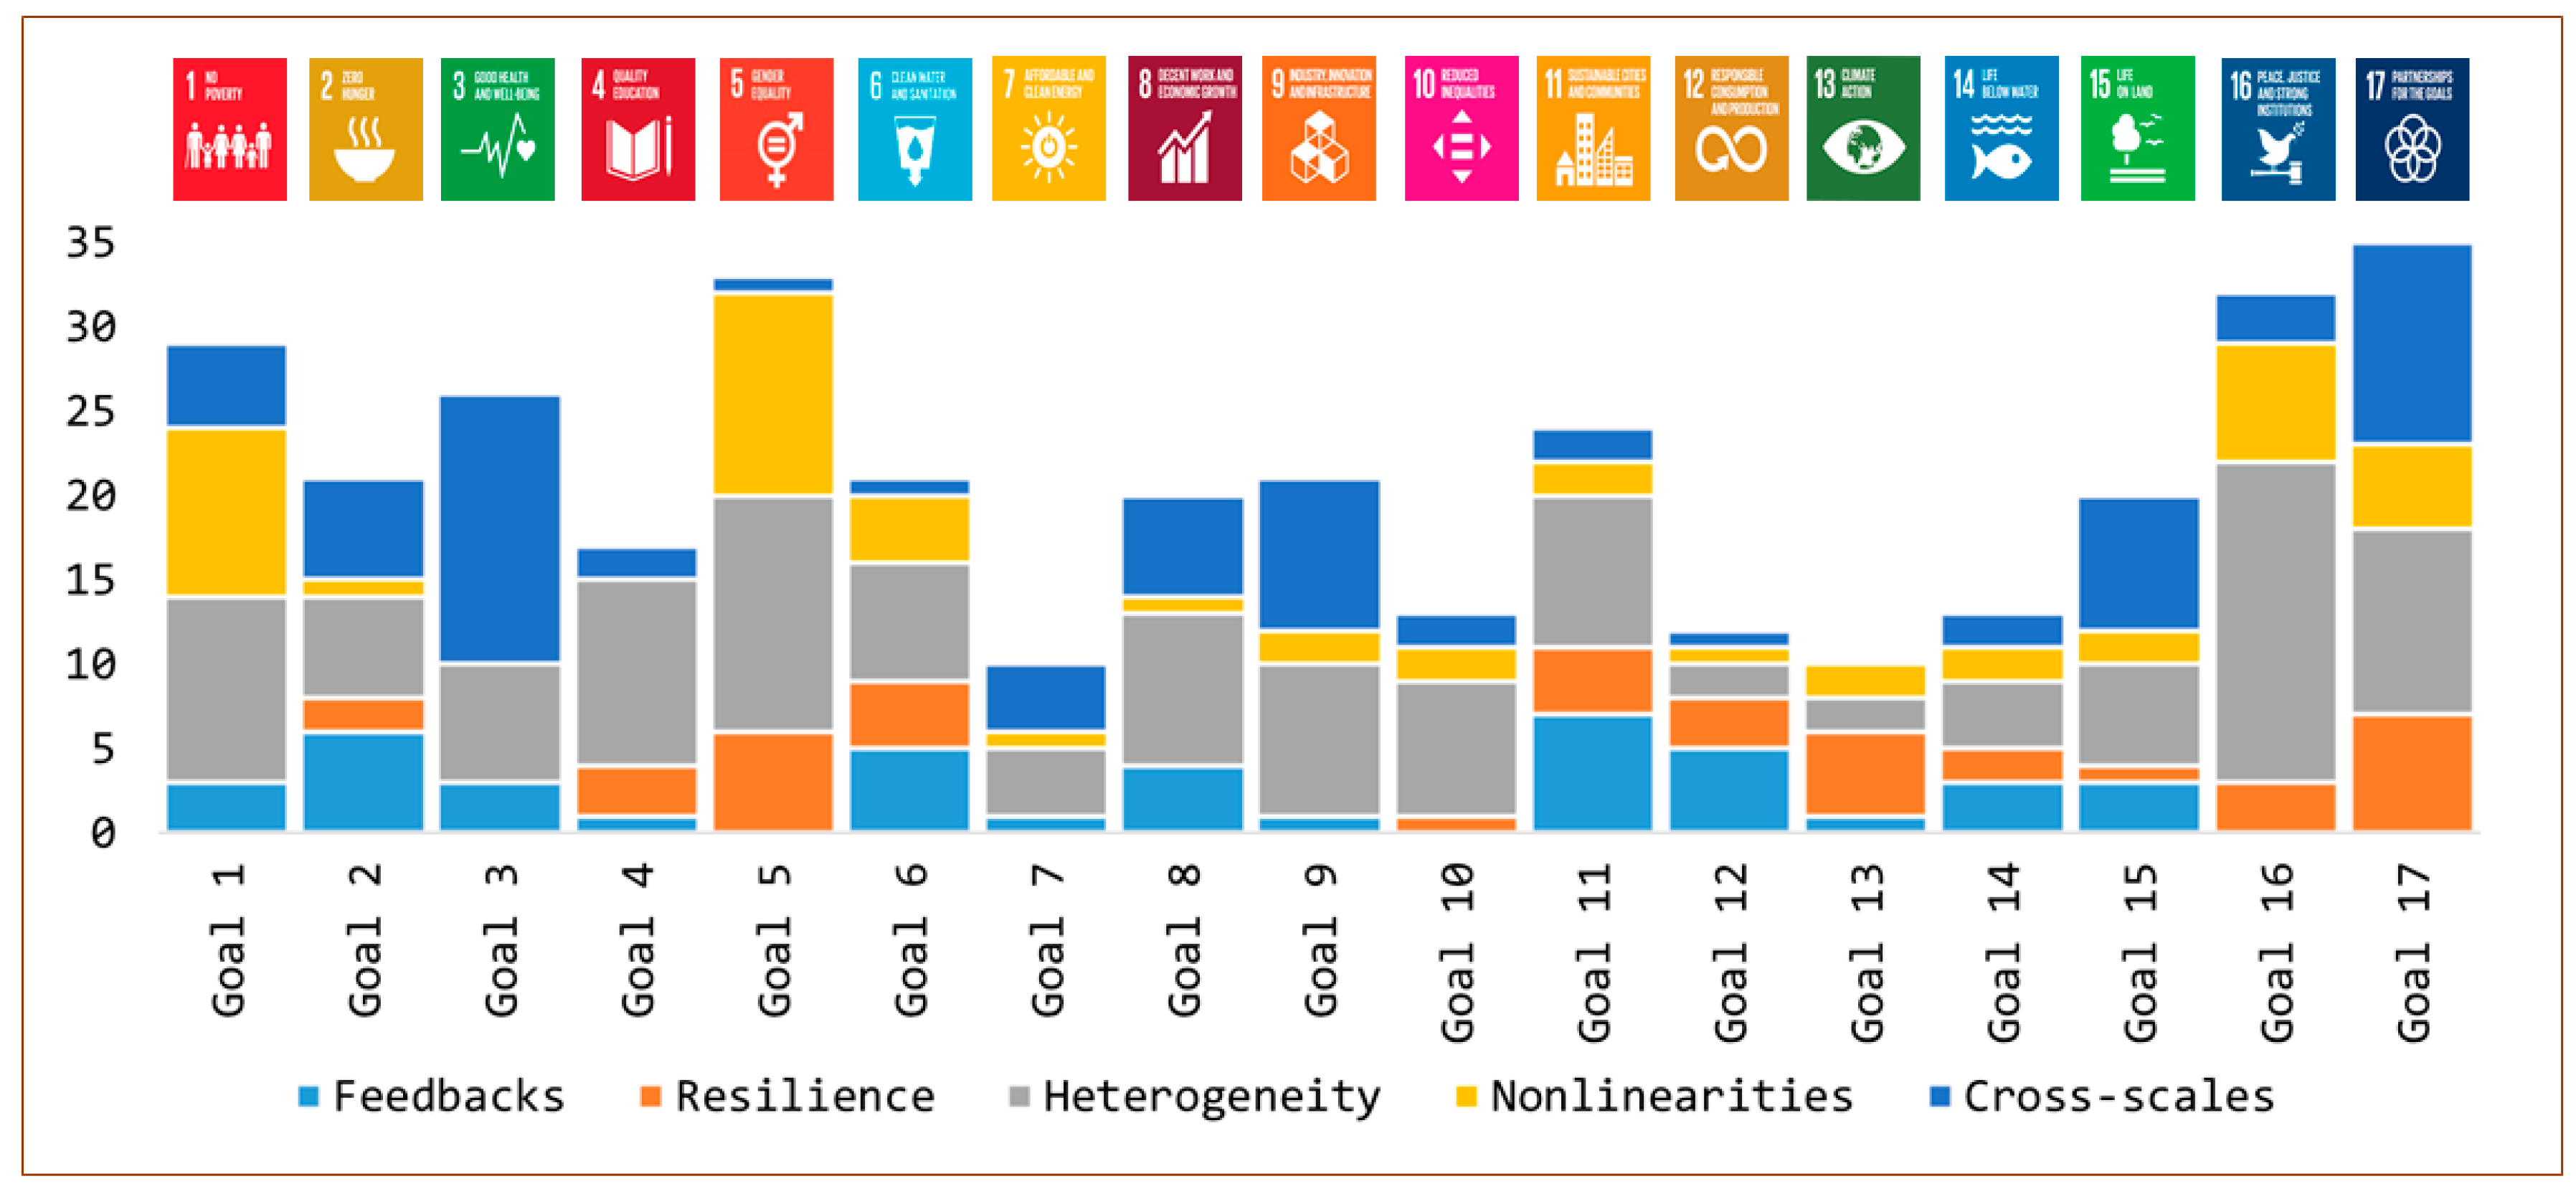
Figure 1 summarizes the proportion of the 243 indicators assessed in our analysis. Appendix A provides the details about how each individual indicator scored across each feature. The feature of heterogeneity was found to be best represented by the SDG indicators assessed (59% of indicators). Indicators included those that track differences in social groups, differences in economic sectors, and diversity of components (e.g., genetic diversity). We found 33% indicators that have the potential to monitor the cross-scale (temporal) feature based on data availability for 10 or more years. The remaining SES features were accounted for in roughly the same percentages of indicators, with 23% of the indicators capturing nonlinearities through some form of thresholds, and 18% and 17% depicting social-ecological interactions and resilience, respectively. Apart from the indicators of social-ecological feedbacks (18%), the majority of the indicators aligning with the remaining four features were social indicators. Overall, more than 70% of the SDG indicators are social indicators. The five different features were not captured equally across goals (Figure 2). Resilience was missing in five goals (1, 3, 7, 8, and 9), and feedbacks were missing in four goals (5, 10, 16, and 17). The rest of the features were represented across almost all the goals, and heterogeneity was captured in all goals. Below we expand on the findings for each of the features.
Figure 1.
The percentage of SDG indicators analyzed that captured each of the five social-ecological features evaluated in this paper.
Figure 2.
Degree to which indicators under each of the 17 SDGs capture each of the five key features of social-ecological systems dynamics assessed in this paper.
Social-ecological feedbacks. Indicators of potential social-ecological feedbacks are featured in most goals (Figure 2), and cover the topics of land use, natural disasters, and expenditure on conservation, waste management, and sustainable use of natural resources, among other areas. They included a mix of ecosystem-to-society and society-to-ecosystem flows, such as changes in water use efficiency (Goal 6, indicator 6.4.1) and material footprint per capita (Goal 8, indicators 8.4.1 and 8.4.2). They also included both material and nonmaterial flows, such as collection of waste in cities (Goal 11, indicator 11.6.1) and total expenditure on conservation (Goal 11, indicator 11.4.1). There were also indicators that captured actual feedbacks, e.g., mortality rate attributed to household and ambient air pollution (Goal 3, indicator 3.9.1).
Resilience. Indicators of resilience capacities were in 12 of the 17 goals. All but 2 of the 42 indicators that captured resilience capacities were social indicators. They were mainly concerned with laws and policies to increase the enforcement of national and international laws, to increase public participation in decision making, and to coordinate development assistance. For example, the number of countries reported progress in multi-stakeholder development effectiveness (e.g., Goal 13, indicator 13.3.1), monitoring frameworks that support the achievement of the sustainable development goals (Goal 17, indicator 17.16.1), or the proportion of transboundary basin area with an operational arrangement for water cooperation (Goal 6, indicator 6.5.2). Overall, governance aspects of resilience were spread across all but 5 goals (Figure 2). Most of the governance indicators come from Goal 17, which is about commitment to global partnership and cooperation.
Heterogeneity. Indicators that captured the feature of heterogeneity were related to indicators in 12 goals that differentiated between a phenomenon by type or proportion. The bulk of these (81%, 117 indicators) comprised social indicators (e.g., Goal 1, indicator 1.1.1: Proportion of population below the international poverty line by sex, age, employment status, and geographical location) primarily used by development agencies, where it is important to specify the targeted beneficiaries of different interventions. Of the remaining indicators, 15% were social-ecological indicators (e.g., Goal 11, indicator 11.3.1: Ratio of land consumption rate to population growth rate), and fewer still (4%) were ecological indicators (e.g., Proportion of important sites for terrestrial and freshwater biodiversity that are covered by protected areas, by ecosystem type).
Nonlinearities. Goals 3 and 4 are the only two of the 17 goals which did not have indicators with thresholds in them. These indicators primarily captured social, ecological, and social-ecological thresholds. While there were indicators with clear thresholds, such as the poverty line, other indicators did not explicitly state thresholds, but alluded to those defined elsewhere (e.g., the just space and the planetary boundary frameworks, which are threshold based frameworks) [107,109]. Others still, such as Indicator 12.3.1: Global food loss index, do not have a clearly defined threshold, but clearly alludes to undesired outcomes in the food system and were included.
Cross-scale dynamics (temporal). Of the 80 indicators with more than 10 years of reported data, over half have more than 25 years of reported data. These are mostly social indicators that have been reported for decades, such as the proportion of population below the poverty line. However, there were several ecological and social-ecological indicators too. Long term ecological indicators were primarily linked to protection and protected areas—e.g., Goal 15, Indicator 15.5.1: Red List Index, which is available for 37 years. There were also social-ecological indicators, e.g., Level of water stress: Freshwater withdrawal as a proportion of available freshwater resources (Goal 6, Indicator 6.4.2), which has been reported for the last 56 years. While these indicators did not convey information about temporal feedbacks, they fulfilled the minimum requirements to achieve this goal by existing over long periods, and therefore were available for temporal analyses and reporting.
4. Discussion
Moving from systems to complex adaptive systems approaches to account for the current hyper-connected, complex, and uncertain global context is proving popular across a number of domains, including sustainable development [22,40]. Complex social-ecological system research provides a useful lens for analysis in moving towards more dynamic and systemic monitoring systems. Key features of social-ecological systems such as feedbacks, non-linearities, and resilience are not easy to operationalize [118,119]. However, our findings highlight that there are areas of progress in making these features practical for sustainability monitoring. They also point to areas of sustainable development with relatively few current indicators capturing the key SES features, where future focus in SES theory development and their approaches could assist (Figure 1 and Figure 2). Below we explore areas of progress, as well as areas where progress is not apparent, to provide recommendations for SDG monitoring with a focus on current indicators, as well as future iterations of the SDGs.
4.1. Social-Ecological System (SES) Dynamic Features: Current Progress, Gaps, and Future Directions
4.1.1. Heterogeneity
Our evaluation suggests that some of the features of SES are easier to operationalize for monitoring than others. Heterogeneity, which we analyze using diversity, multidimensionality, and disaggregation measures, was captured by most indicators (59%). Almost all of these indicators particularly captured disaggregation aspects of heterogeneity, which mostly differentiates between age groups, gender, income, type of sector, and other socioeconomic differentiations, and have been highlighted as essential in Agenda 2030 to “leave no one behind” [71,120,121,122]. Progress in methods for disaggregation of data has been rapid and serves a strong foundation for a complex systems approach to monitoring at local to global scales (e.g., [27]). These approaches have been found to highlight power relations, conflicts, and trade-offs, as well as impacts that can potentially reinforce poverty [83,123]. Multidimensionality was not very prevalent, but an increasing focus in research on poverty, equity, and human wellbeing as multidimensional could help to address the lack of such indicators currently proposed in the SDGs [73,91]. However, the paucity of ecological indicators, and especially indicators of ecological diversity in the SDG indicator set, is a limitation. The wide range of research and data on this topic offers potential to rapidly close this gap [67,124,125]. Considering the evidence of the role of enhanced diversity in sustainability and resilience outcomes, a key recommendation would be to focus indicator development on capturing diversity in social, ecological, and social-ecological variables. Research on functional and response diversity highlights this importance and provides examples of potential indicators for use in current SDG monitoring, as well as future indicator development [126,127].
4.1.2. Cross-Scale Dynamics
Many indicators showed potential for capturing temporal dynamics due to the presence of time series data for those indicators (33% have at least 10-year time series). Most SDG indicators have existed for long periods of time, with some already starting in the 1940s following the formalization of international development and the subsequent establishment of institutions such as the United Nations, the World Bank, and the Food and Agriculture Organization. However, the existence of time series data does not mean that temporal dynamics will indeed be captured. This would require interactions between two or more factors to be established (for attribution), after which the relationship between them can be tracked overtime. It is also complicated by questions of what length of time is ‘long enough’ to capture effects [128] and assumptions of how to capture impacts [129]. This raises questions around the fit-for-purpose nature of the time series data available, suggesting the need for new datasets as well as new technologies able to model such data where it is missing. The focus on capturing and avoiding or negotiating trade-offs between SDGs is a major focus of current attention. Complex SES approaches emphasize the need to be able to make such trade-offs clear, not just between SDGs, but also over time and space to reveal hidden trade-offs. The availability of time series data, combined with recent advances in modelling, is increasingly making it possible to reveal temporal dynamics such as legacy effects and time lags [10,105,117,130]. When combined with scenario models and assessments, these indicators also provide an opportunity of exploring future consequences and dynamics and should be a focus of future monitoring efforts. While not explored in this analysis, the challenge of spatial cross-scale dynamics must also be highlighted. Currently, the focus is on national and global indicators, which will not be sufficient to highlight important cross-scale feedbacks and trade-offs within and between SDGs. This is especially important to explore important aspects, including teleconnections, surprise, and cascading effects that tend to dominate in poverty contexts [1,100,131]. New techniques and datasets present opportunities to capture this interplay between ecosystems and societies at multiple scales (see review in [22,132]).
4.1.3. Nonlinearities
Not many current SDG indicators captured nonlinearities, which we assessed by evaluating the presence of thresholds relating to social, ecological, and social-ecological systems within the indicators. Those that did capture thresholds focused primarily on social thresholds as minimum standards, above which people should be lifted [133]. Even within these indicators, and across all SDG indicators, lie assumptions of linear (and infinite) improvements (Figure 1), a major gap in SDG monitoring efforts. Furthermore, while the research and datasets for thresholds and non-linear effects are still relatively new and under development [99,106,107], some potential for improvement lies in several SDG indicators that use data, or variables, in which thresholds are known or predicted [106,107]—for example, use of nitrogen and phosphorus in agricultural systems [52,53]. This presents an opportunity to link these indicators to thresholds in the monitoring and reporting processes. Wilcock et al., 2016 in their review of the non-linear aspects of complex systems also highlight the challenges posed by current global indicators and the lack of early warning systems [134]. They point to hybrid models as a way to generate understanding of system trade-offs associated with non-linearities, an avenue that could be explored to prepare for post-2030 monitoring systems.
4.1.4. Social-Ecological Feedbacks
The paucity of SDG indicators that capture social-ecological feedbacks (18%) is a cause for concern. Advances in capturing them are already available from multiple areas of study, including ecosystem services [135,136,137,138], social-ecological metabolism [45,139,140], and many other human-nature frameworks [141,142], highlighting their importance to many fields of study [47,143,144]. It is a key requirement to capture the effects of ecosystem change on human wellbeing, and the resultant consequences of changes in wellbeing for ecosystems. Feedbacks are at the core of an SES approach to monitoring—both as a cause of features, such as non-linearities, temporal dynamics, and resilience capacities, and also as a consequence of system changes with strong roles in trade-offs, especially important in spatial and temporal cross-scale trade-offs [145]. An SDG monitoring system needs to, therefore, be designed to capture key feedbacks, as well as be able to account for unknown and unpredictable feedbacks as they emerge. New approaches that are able to conceptualize and analyze the system in a more integrated fashion, or at a macro-level scale, offer some promise (e.g., [146,147]).
4.1.5. Resilience
The topic of resilience and resilience indicators are a focus of much research and policy efforts. However, fewer efforts are targeted at the notion of resilience as a system property shaped by, and shaping, the SES features [148]. Our analysis here focused mostly on resilience as it related to system governance and management, while resilience of the system has been shown to be strongly reliant on the other features listed here, e.g., feedbacks and diversity. The low numbers of indicators capturing resilience of governance and management of systems is possibly due to the challenge of quantifying these factors [56,62] and their context-specific nature. However, progress in the monitoring of management effectiveness and governance suggest indicators for use [56]. Research on resilience has especially highlighted the need to foster complex systems approaches and learning [43,63,149] within the governance and management of social-ecological systems. This extends to their use in the development of SDG monitoring systems and could well prove useful as nation states implement and tailor the SDGs and their indicators for use in their contexts [150,151,152]. Furthermore, new research on absorptive, adaptive, and especially transformative capacities [153,154,155] offer useful avenues for indicator development. This research has also highlighted the differences between these capacities, suggesting the need for indicators that track each separately rather than assuming that higher levels of adaptive capacity are also good for transformative change [153,154,155].
4.2. Moving towards Dynamic System Indicators for Sustainable Development
For sustainability to be truly achieved, systems need to be understood not only in terms of the connections among the different components within them, but also the dynamic character of these connections [44](). In addition to biophysical feedbacks and thresholds [106,107], social feedbacks and thresholds [73,156], it is also important to understand thresholds resulting from the interactions between social and ecological systems [157,158]. It is crucial to distil how social and economic targets (such as ending poverty or increasing GDP) primarily affect, and are affected by, ecological targets (such as life on land and life under water). This is akin to observing ‘shadow effects’ where social indicators have ‘ecological shadows’ and vice versa. With limited social-ecological feedbacks and nonlinearities captured in the SDG (Figure 2), there is a possibility that warning of important tipping points will be missed that could have profound consequences. A future focus on the social-ecological nature of systems and systems changes, as well as an acknowledgement of the importance of heterogeneity within and between systems, is key to future efforts to track and adaptively manage sustainable development.
Indicators. Just under 40% of the indicators are conceptually clear, have internationally established methodology and standards, and data regularly produced by countries (UN 2017). The reliance on existing conventional data and indicators will not be sufficient to effectively monitor sustainable development [159]. There are too many individual indicators with no clear indication of what the ‘combined outcome’ of all SDGs will look like [33,36]. This will likely result in uncoordinated and disparate monitoring of indicators, which creates a monitoring burden and often results in silos of implementation [160,161]. To deal with this proliferation problem, it has been suggested to focus on ‘essential’ variables for SDGs that are indispensable and capture the system’s essence, coordination areas, and system transformation [21]. Such forms of indicators focus on the macro level, where sustainability and other system outcomes are realized, rather than the reductionist separation at the micro level, from which such emergence will not be visible. Systems level indicators will be integral to wider monitoring efforts, and in combination with other indicators, should give an indication of the general trajectory of the system as a whole [162].
Author Contributions
Conceptualization: O.S., B.R. and R.B.; methodology: O.S., B.R. and R.B.; validation: M.H., formal analysis: O.S., data curation: O.S.; writing: O.S., writing—review and editing: O.S., B.R., R.B. and M.H.
Funding
This research was supported by Sida funded GRAID program at Stockholm Resilience Centre (O.S., B.R. and R.B.). R.B. is also partly supported by the South African Research Chairs Initiative (SARChI) of the Department of Science and Technology and National Research Foundation of South Africa (grant 98766) and a Vetenskapsrådet grant in Sweden (grant 621-2014-5137).
Conflicts of Interest
The authors declare no conflict of interest.
Appendix A
Table A1.
Sustainable Development Goal indicators and classification across Social-Ecological System features.
References
- Liu, J.; Mooney, H.A.; Hull, V.; Davis, S.J.; Gaskell, J.C.; Hertel, T.W.; Lubchenco, J.; Seto, K.C.; Gleick, P.H.; Kremen, C.; et al. Systems integration for global sustainability. Science 2015, 347, 1258832. [Google Scholar] [CrossRef] [Scilit] [PubMed]
- Adams, W.M.; Aveling, R.; Brockington, D.; Dickson, B.; Elliott, J.; Hutton, J.; Roe, D.; Vira, B.; Wolmer, W. Biodiversity conservation and the eradication of poverty. Science 2004, 306, 1146–1149. [Google Scholar] [CrossRef] [Scilit] [PubMed]
- Motesharrei, S.; Rivas, J.; Kalnay, E.; Asrar, G.R.; Busalacchi, A.J.; Cahalan, R.F.; Cane, M.A.; Colwell, R.R.; Feng, K.; Franklin, R.S.; et al. Modeling sustainability: Population, inequality, consumption, and bidirectional coupling of the Earth and Human Systems. Natl. Sci. Rev. 2016, 3, 470–494. [Google Scholar] [CrossRef] [Scilit]
- Hamann, M.; Berry, K.; Chaigneau, T.; Curry, T.; Heilmayr, R.; Henriksson, P.J.G.; Hentati-Sundberg, J.; Jina, A.; Lindkvist, E.; Lopez-Maldonado, Y.; et al. Inequality and the Biosphere. Annu. Rev. Environ. Resour. 2018, 43, 61–83. [Google Scholar] [CrossRef] [Scilit]
- Costello, A.; Abbas, M.; Allen, A.; Ball, S.; Bell, S.; Bellamy, R.; Friel, S.; Groce, N.; Johnson, A.; Kett, M.; et al. Managing the health effects of climate change. Lancet 2009, 373, 1693–1733. [Google Scholar] [CrossRef] [Scilit]
- Looke, D.F.M.M.; Gottlieb, T.; Jones, C.A. The global challenges of infectious diseases. Med. J. Aust. 2015, 202, 225–226. [Google Scholar] [CrossRef] [Scilit] [PubMed]
- Wilting, H.C.; Schipper, A.M.; Bakkenes, M.; Meijer, J.R.; Huijbregts, M.A.J. Quantifying biodiversity losses due to human consumption: A global-scale footprint analysis. Environ. Sci. Technol. 2017, 51, 3298–3306. [Google Scholar] [CrossRef] [Scilit] [PubMed]
- Lenzen, M.; Moran, D.; Kanemoto, K.; Foran, B.; Lobefaro, L.; Geschke, A. International trade drives biodiversity threats in developing nations. Nature 2012, 486, 109–112. [Google Scholar] [CrossRef] [Scilit] [PubMed]
- Steffen, W.; Broadgate, W.; Deutsch, L.; Gaffney, O.; Ludwig, C. The trajectory of the Anthropocene: The Great Acceleration. Anthr. Rev. 2015, 2, 81–98. [Google Scholar] [CrossRef] [Scilit]
- Fremier, A.K.; DeClerck, F.A.J.; Bosque-Pérez, N.A.; Carmona, N.E.; Hill, R.; Joyal, T.; Keesecker, L.; Klos, P.Z.; Martínez-Salinas, A.; Niemeyer, R.; et al. Understanding Spatiotemporal Lags in Ecosystem Services to Improve Incentives. Bioscience 2013, 63, 472–482. [Google Scholar] [CrossRef] [Scilit]
- Camill, P.; Clark, J.S. Long-term perspectives on lagged ecosystem responses to climate change: Permafrost in boreal peatlands and the grassland/woodland boundary. Ecosystems 2000, 3, 534–544. [Google Scholar] [CrossRef] [Scilit]
- Peters, D.P.C.; Groffman, P.M.; Nadelhoffer, K.J.; Grimm, N.B.; Collins, S.L.; Michener, W.K.; Huston, M.A. Living in an increasingly connected world: A framework for continental-scale environmental science. Front. Ecol. Environ. 2008, 6, 229–237. [Google Scholar] [CrossRef] [Scilit]
- Kohlheb, N.; Krausmann, F. Land use change, biomass production and HANPP: The case of Hungary 1961–2005. Ecol. Econ. 2009, 69, 292–300. [Google Scholar] [CrossRef] [Scilit]
- Liu, J.; Yang, W.; Li, S. Framing ecosystem services in the telecoupled Anthropocene. Front. Ecol. Environ. 2016, 14, 27–36. [Google Scholar] [CrossRef] [Scilit]
- Liu, J.; Dou, Y.; Batistella, M.; Challies, E.; Connor, T.; Friis, C.; Millington, J.D.A.; Parish, E.; Romulo, C.L.; Silva, R.F.B.; et al. Spillover systems in a telecoupled Anthropocene: Typology, methods, and governance for global sustainability. Curr. Opin. Environ. Sustain. 2018, 33, 58–69. [Google Scholar] [CrossRef] [Scilit]
- Bruckner, M.; Fischer, G.; Tramberend, S.; Giljum, S. Measuring telecouplings in the global land system: A review and comparative evaluation of land footprint accounting methods. Ecol. Econ. 2015, 114, 11–21. [Google Scholar] [CrossRef] [Scilit]
- Stoll, J.S.; Crona, B.I.; Fabinyi, M.; Farr, E.R. Seafood Trade Routes for Lobster Obscure Teleconnected Vulnerabilities. Front. Mar. Sci. 2018, 5, 239. [Google Scholar] [CrossRef] [Scilit]
- Eakin, H.; DeFries, R.; Kerr, S.; Lambin, E.F.; Liu, J.; Marcotullio, P.J.; Messerli, P.; Reenberg, A.; Rueda, X.; Swaffield, S.R.; et al. Significance of Telecoupling for Exploration of Land-Use Change. In Rethinking Global Land Use in an Urban Era; Seto, K.C., Reenberg, A., Eds.; MIT Press: Cambridge, MA, USA, 2014; pp. 141–161. ISBN 9780262026901. [Google Scholar]
- Nilsson, M.; Griggs, D.; Visbeck, M. Policy: Map the interactions between Sustainable Development Goals. Nature 2016, 534, 320–322. [Google Scholar] [CrossRef] [Scilit] [PubMed]
- Griggs, D.; Stafford-Smith, M.; Gaffney, O.; Rockström, J.; Ohman, M.C.; Shyamsundar, P.; Steffen, W.; Glaser, G.; Kanie, N.; Noble, I.; et al. Policy: Sustainable development goals for people and planet. Nature 2013, 495, 305–307. [Google Scholar] [CrossRef] [Scilit] [PubMed]
- Reyers, B.; Stafford-Smith, M.; Erb, K.-H.H.; Scholes, R.J.; Selomane, O. Essential Variables help to focus Sustainable Development Goals monitoring. Curr. Opin. Environ. Sustain. 2017, 26–27, 97–105. [Google Scholar] [CrossRef] [Scilit]
- Reyers, B.; Folke, C.; Moore, M.-L.; Biggs, R.; Galaz, V. Social-Ecological Systems Insights for Navigating the Dynamics of the Anthropocene. Annu. Rev. Environ. Resour. 2018, 43, 267–289. [Google Scholar] [CrossRef] [Scilit]
- Costanza, R.; Kubiszewski, I.; Giovannini, E.; Lovins, H.; McGlade, J.; Pickett, K.E.; Ragnarsdóttir, K.V.; Roberts, D.; De Vogli, R.; Wilkinson, R. Time to leave GDP behind. Nature 2014, 505, 283–285. [Google Scholar] [CrossRef] [Scilit] [PubMed]
- Dullinger, S.; Essl, F.; Rabitsch, W.; Erb, K.-H.K.-H.; Gingrich, S.; Haberl, H.; Hulber, K.; Jarosik, V.; Krausmann, F.; Kuhn, I.; et al. Europe’s other debt crisis caused by the long legacy of future extinctions. Proc. Natl. Acad. Sci. USA 2013, 110, 7342–7347. [Google Scholar] [CrossRef] [Scilit] [PubMed]
- Folke, C.; Jansson, Å.; Rockström, J.; Olsson, P.; Carpenter, S.R.; Stuart Chapin, F.; Crépin, A.-S.S.; Daily, G.; Danell, K.; Ebbesson, J.; et al. Reconnecting to the biosphere. Ambio 2011, 40, 719–738. [Google Scholar] [CrossRef] [Scilit] [PubMed]
- Carpenter, S.R.; Folke, C.; Norström, A.; Olsson, O.; Schultz, L.; Agarwal, B.; Balvanera, P.; Campbell, B.; Castilla, J.C.; Cramer, W.; et al. Program on ecosystem change and society: An international research strategy for integrated social–ecological systems. Curr. Opin. Environ. Sustain. 2012, 4, 134–138. [Google Scholar] [CrossRef] [Scilit]
- Reyers, B.; Selomane, O. Social-ecological systems approaches: Revealing and navigating the complex trade-offs of sustainable development. In Ecosystem Services and Poverty Alleviation: Trade-Offs and Governance; Schreckenberg, K., Mace, G., Poudyal, M., Eds.; Routledge: London, UK; New York, NY, USA, 2018; pp. 39–54. [Google Scholar]
- UN. Transforming Our World: The 2030 Agenda for Sustainable Development; United Nations: New York, NY, USA, 2015. [Google Scholar]
- Barbier, E.; Burgess, J. The Sustainable Development Goals and the systems approach to sustainability. Economics 2017, 11, 1–22. [Google Scholar] [CrossRef] [Scilit]
- Young, O.R.; Underdal, A.; Kanie, N.; Andresen, S.; Bernstein, S.; Biermann, F.; Gupta, J.; Haas, P.M.; Iguchi, M.; Kok, M.; et al. Earth System Challenges and a Multi-Layered Approach for the Sustainable Development Goals; POST2015/UNU-IAS Policy Brief #1; United Nations University Institute for the Advanced Study of Sustainability: Tokyo, Japan, 2014. [Google Scholar]
- Lim, M.M.L.; Søgaard Jørgensen, P.; Wyborn, C.A. Reframing the sustainable development goals to achieve sustainable development in the anthropocene—A systems approach. Ecol. Soc. 2018, 23, art22. [Google Scholar] [CrossRef] [Scilit]
- Lucas, P.; Kok, M.; Nilsson, M.; Alkemade, R. Integrating Biodiversity and Ecosystem Services in the Post-2015 Development Agenda: Goal Structure, Target Areas and Means of Implementation. Sustainability 2013, 6, 193–216. [Google Scholar] [CrossRef] [Scilit]
- Griggs, D.; Smith, M.S.; Rockström, J.; Öhman, M.C.; Gaffney, O.; Glaser, G.; Kanie, N. An integrated framework for sustainable development goals. Ecol. Soc. 2014, 19, 49. [Google Scholar] [CrossRef] [Scilit]
- Pradhan, P.; Costa, L.; Rybski, D.; Lucht, W.; Kropp, J.P. A Systematic Study of Sustainable Development Goal (SDG) Interactions. Earth’s Future 2017, 5, 1169–1179. [Google Scholar] [CrossRef] [Scilit]
- SDSN. Indicators and a Monitoring Framework for Sustainable Development Goals: Launching a Data Revolution for the SDGs; Sustainable Development Solutions Network: New York, NY, USA; Paris, France, 2015. [Google Scholar]
- Costanza, R.; Fioramonti, L.; Kubiszewski, I. The UN Sustainable Development Goals and the dynamics of well-being. Front. Ecol. Environ. 2016, 14, 59. [Google Scholar] [CrossRef] [Scilit]
- Levin, S.A. Complex Adaptive Systems: Exploring the known, the unknown and the unknowable. Bull. Am. Math. Soc. 2002, 40, 3–19. [Google Scholar] [CrossRef] [Scilit]
- Duit, A.; Galaz, V. Governance and Complexity—Emerging Issues for Governance Theory. Governance 2008, 21, 311–335. [Google Scholar] [CrossRef] [Scilit]
- Schoon, M.; van der Leeuw, S. Dossier: «À propos des relations natures/sociétés»—The shift toward social-ecological systems perspectives: Insights into the human-nature relationship. Nat. Sci. Soc. 2015, 23, 166–174. [Google Scholar] [CrossRef] [Scilit]
- Leach, M.; Reyers, B.; Bai, X.; Brondizio, E.S.; Cook, C.; Díaz, S.; Espindola, G.; Scobie, M.; Stafford-Smith, M.; Subramanian, S.M. Equity and sustainability in the Anthropocene: A social–ecological systems perspective on their intertwined futures. Glob. Sustain. 2018, 1, e13. [Google Scholar] [CrossRef] [Scilit]
- Liu, J.; Dietz, T.; Carpenter, S.R.; Alberti, M.; Folke, C.; Moran, E.; Pell, A.N.; Deadman, P.; Kratz, T.; Lubchenco, J.; et al. Complexity of coupled human and natural systems. Science 2007, 317, 1513–1516. [Google Scholar] [CrossRef] [Scilit] [PubMed]
- UN. Report of the Interagency and Expert Group on Sustainable Development Goal Indicators; United Nations Economic and Social Council: New York, NY, USA, 2016. [Google Scholar]
- Biggs, R.; Schlüter, M.; Schoon, M.L. Principles for Building Resilience, Sustaining Ecosystem Services in Social-Ecological System; Cambridge University Press: Cambridge, UK, 2015; ISBN 978-1-107-08265-6. [Google Scholar]
- Preiser, R.; Biggs, R.; De Vos, A.; Folke, C. Social-ecological systems as complex adaptive systems: Organizing principles for advancing research methods and approaches. Ecol. Soc. 2018, 23, art46. [Google Scholar] [CrossRef] [Scilit]
- Fischer-Kowalski, M.; Weisz, H. The Archipelago of Social Ecology and the Island of the Vienna School. In Social Ecology. Society–Nature Relations across Time and Space; Springer Int’l Publishing: Cham, Switzerland, 2016; pp. 3–28. ISBN 978-3-319-33324-3. [Google Scholar]
- Berryman, A.A. The Conceptual Foundations of Ecological Dynamics. Bull. Ecol. Soc. Am. 1989, 70, 230–236. [Google Scholar]
- Hull, V.; Tuanmu, M.N.; Liu, J. Synthesis of human-nature feedbacks. Ecol. Soc. 2015, 20, 17. [Google Scholar] [CrossRef] [Scilit]
- Claessens, L.; Schoorl, J.M.; Verburg, P.H.; Geraedts, L.; Veldkamp, A. Modelling interactions and feedback mechanisms between land use change and landscape processes. Agric. Ecosyst. Environ. 2009, 129, 157–170. [Google Scholar] [CrossRef] [Scilit]
- Armsworth, P.R.; Daily, G.C.; Kareiva, P.; Sanchirico, J.N. Land market feedbacks can undermine biodiversity conservation. Proc. Natl. Acad. Sci. USA 2006, 103, 5403–5408. [Google Scholar] [CrossRef] [Scilit] [PubMed]
- Miller, B.W.; Caplow, S.C.; Leslie, P.W. Feedbacks between Conservation and Social-Ecological Systems. Conserv. Biol. 2012, 26, 218–227. [Google Scholar] [CrossRef] [Scilit] [PubMed]
- Sundkvist, Å.; Milestad, R.; Jansson, A. On the importance of tightening feedback loops for sustainable development of food systems. Food Policy 2005, 30, 224–239. [Google Scholar] [CrossRef] [Scilit]
- Tilman, D. Global environmental impacts of agricultural expansion: The need for sustainable and efficient practices. Proc. Natl. Acad. Sci. USA 1999, 96, 5995–6000. [Google Scholar] [CrossRef] [Scilit] [PubMed]
- Bennett, E.M.; Carpenter, S.R.; Caraco, N.F. Human Impact on Erodable Phosphorus and Eutrophication: A Global Perspective. Bioscience 2001, 51, 227. [Google Scholar] [CrossRef] [Scilit]
- Hamann, M.; Biggs, R.; Reyers, B. Mapping social-ecological systems: Identifying “green-loop” and “red-loop” dynamics based on characteristic bundles of ecosystem service use. Glob. Environ. Chang. 2015, 34, 218–226. [Google Scholar] [CrossRef] [Scilit]
- Folke, C. Resilience (Republished). Ecol. Soc. 2016, 21, art44. [Google Scholar] [CrossRef] [Scilit]
- Carson, M.; Perterson, G. Arctic Council 2016. Arctic Resilience Report; Carson, M., Peterson, G., Eds.; Stockholm Environment Institute & Stockholm Resilience Centre: Stockholm, Sweden, 2016; ISBN 9789186125455. [Google Scholar]
- Polasky, S.; Bryant, B.; Hawthorne, P.; Johnson, J.; Keeler, B.; Pennington, D. Inclusive Wealth as a Metric of Sustainable Development. Annu. Rev. Environ. Resour. 2015, 40, 445–466. [Google Scholar] [CrossRef] [Scilit]
- Adger, W.N.; Vincent, K. Uncertainty in adaptive capacity. C. R. Geosci. 2005, 337, 399–410. [Google Scholar] [CrossRef] [Scilit]
- Engle, N.L.; Lemos, M.C. Unpacking governance: Building adaptive capacity to climate change of river basins in Brazil. Glob. Environ. Chang. 2010, 20, 4–13. [Google Scholar] [CrossRef] [Scilit]
- Fazey, I.; Fazey, J.A.; Fischer, J.; Sherren, K.; Warren, J.; Reed, F.; Dovers, S.R.; Noss, R.F. Adaptive leverage capacity for and learning to learn as leverage for social–ecological resilience. Front. Ecol. Environ. 2007, 5, 375–380. [Google Scholar] [CrossRef] [Scilit]
- Berkes, F.; Folke, C. Linking Social and Ecological Systems: Management Practices and Social Mechanisms for Building Resilience; Cambridge University Press: Cambridge, UK, 1998; ISBN 0521785626. [Google Scholar]
- Quinlan, A.E.; Berbés-Blázquez, M.; Haider, L.J.; Peterson, G.D. Measuring and assessing resilience: Broadening understanding through multiple disciplinary perspectives. J. Appl. Ecol. 2016, 53, 677–687. [Google Scholar] [CrossRef] [Scilit]
- Cundill, G.; Leitch, A.; Schultz, L.; Armitage, D.; Peterson, G. Principle 5—Encourage Learning. In Principles for Building Resilience: Sustaining Ecosystem Services in Social-Ecological Systems; Biggs, R., Schluter, M., Schoon, M., Eds.; Cambridge University Press: Cambridge, UK, 2015; pp. 174–192. ISBN 9781107082656. [Google Scholar]
- Leitch, A.; Cundill, G.; Schultz, L. 8 Principle 6–Broaden participation. In Principles for Building Resilience: Sustaining Ecosystem Services in Social-Ecological Systems; Biggs, R., Schluter, M., Schoon, M., Eds.; Cambridge University Press: Cambridge, UK, 2015; pp. 201–225. [Google Scholar]
- Schoon, M.L.; Robards, M.D.; Meek, C.L.; Galaz, V. Principle 7—Promote polycentric governance systems. In Principles for Building Resilience: Sustaining Ecosystem Services in Social-Ecological Systems; Biggs, R., Schluter, M., Schoon, M.L., Eds.; Cambridge University Press: Cambridge, UK, 2015; pp. 226–250. ISBN 9781316014240 | 9781107082656. [Google Scholar]
- Norberg, J.; Cumming, G.S. Complexity Theory for a Sustainable Future; Columbia University Press: New York, NY, USA, 2008; ISBN 0231508867. [Google Scholar]
- Scholes, R.J.; Biggs, R. A biodiversity intactness index. Nature 2005, 434, 45–49. [Google Scholar] [CrossRef] [Scilit] [PubMed]
- Loh, J.; Green, R.E.; Ricketts, T.; Lamoreux, J.F.; Jenkins, M.; Kapos, V.; Randers, J. The Living Planet Index: Using species population time series to track trends in biodiversity. Philos. Trans. R. Soc. Lond. B. Biol. Sci. 2005, 360, 289–295. [Google Scholar] [CrossRef] [Scilit] [PubMed]
- Mudaca, J.D.; Tsuchiya, T.; Yamada, M.; Onwona-Agyeman, S. Household participation in Payments for Ecosystem Services: A case study from Mozambique. For. Policy Econ. 2015, 55, 21–27. [Google Scholar] [CrossRef] [Scilit]
- Baker, T.J.; Cullen, B.; Debevec, L.; Abebe, Y. A socio-hydrological approach for incorporating gender into biophysical models and implications for water resources research. Appl. Geogr. 2015, 62, 325–338. [Google Scholar] [CrossRef] [Scilit]
- Lau, J.D.; Hicks, C.C.; Gurney, G.G.; Cinner, J.E. Disaggregating ecosystem service values and priorities by wealth, age, and education. Ecosyst. Serv. 2018, 29, 91–98. [Google Scholar] [CrossRef] [Scilit]
- Anand, S.; Sen, A.K. Human Development Index: Methodology and Measurement; Human Development Report Office: New York, NY, USA, 1994; 370p. [Google Scholar]
- Alkire, S.; Santos, M.E. Measuring Acute Poverty in the Developing World: Robustness and Scope of the Multidimensional Poverty Index. World Dev. 2014, 59, 251–274. [Google Scholar] [CrossRef] [Scilit]
- Raudsepp-Hearne, C.; Peterson, G.D.; Bennett, E.M. Ecosystem service bundles for analyzing tradeoffs in diverse landscapes. Proc. Natl. Acad. Sci. USA 2010, 107, 5242–5247. [Google Scholar] [CrossRef] [Scilit] [PubMed]
- Hamann, M.; Biggs, R.; Reyers, B. An exploration of human well-being bundles as identifiers of ecosystem service use patterns. PLoS ONE 2016, 11, e0163476. [Google Scholar] [CrossRef] [Scilit] [PubMed]
- Kotschy, K.; Biggs, R.; Daw, T.; Folke, C. 3 Principle 1—Maintain diversity and redundancy. In Principles for Building Resilience: Sustaining Ecosystem Services in Social-Ecological Systems; Biggs, R., Schluter, M., Schoon, M., Eds.; Cambridge University Press: Cambridge, UK, 2015; p. 290. ISBN 978-1-107-08265-6. [Google Scholar]
- Tilman, D.; Wedin, D.; Knops, J. Productivity and sustainability influenced by biodiversity in grassland ecosystems. Nature 1996, 379, 718–720. [Google Scholar] [CrossRef] [Scilit]
- Worm, B.; Barbier, E.B.; Beaumont, N.J.; Duffy, J.E.; Folke, C.; Halpern, B.S.; Jackson, J.B.C.; Lotze, H.K.; Micheli, F.; Palumbi, S.R.; et al. Impacts of biodiversity loss on ocean ecosystem services. Science 2006, 314, 787–790. [Google Scholar] [CrossRef] [Scilit] [PubMed]
- Tengö, M.; Hill, R.; Malmer, P.; Raymond, C.M.; Spierenburg, M.; Danielsen, F.; Elmqvist, T.; Folke, C. Weaving knowledge systems in IPBES, CBD and beyond—Lessons learned for sustainability. Curr. Opin. Environ. Sustain. 2017, 26–27, 17–25. [Google Scholar] [CrossRef] [Scilit]
- Sterling, E.J.; Filardi, C.; Toomey, A.; Sigouin, A.; Betley, E.; Gazit, N.; Newell, J.; Albert, S.; Alvira, D.; Bergamini, N.; et al. Biocultural approaches to well-being and sustainability indicators across scales. Nat. Ecol. Evol. 2017, 1, 1798–1806. [Google Scholar] [CrossRef] [Scilit] [PubMed]
- Díaz, S.; Pascual, U.; Stenseke, M.; Martín-López, B.; Watson, R.; Molnár, Z.; Hill, R.; Chan, K.; Baste, I.; Brauman, K.; et al. An inclusive approach to assess nature’s contributions to people. Science 2018, 359, 270–272. [Google Scholar] [CrossRef] [Scilit] [PubMed]
- Xiao, Y.; Drucker, J. Does economic diversity enhance regional disaster resilience? J. Am. Plan. Assoc. 2013, 79, 148–160. [Google Scholar] [CrossRef] [Scilit]
- Kent, R.; Dorward, A. Livelihood responses to Lantana camara invasion and biodiversity change in southern India: Application of an asset function framework. Reg. Environ. Chang. 2014, 15, 353–364. [Google Scholar] [CrossRef] [Scilit]
- Leslie, P.; McCabe, J.T. Response Diversity and Resilience in Social-Ecological Systems. Curr. Anthropol. 2013, 54, 114–143. [Google Scholar] [CrossRef] [Scilit] [PubMed]
- Daw, T.M.; Coulthard, S.; Cheung, W.W.L.; Brown, K.; Abunge, C.; Galafassi, D.; Peterson, G.D.; McClanahan, T.R.; Omukoto, J.O.; Munyi, L. Evaluating taboo trade-offs in ecosystems services and human well-being. Proc. Natl. Acad. Sci. USA 2015, 112, 6949–6954. [Google Scholar] [CrossRef] [Scilit] [PubMed]
- Hicks, C.C.; Cinner, J.E. Social, institutional, and knowledge mechanisms mediate diverse ecosystem service benefits from coral reefs. Proc. Natl. Acad. Sci. USA 2014, 111, 17791–17796. [Google Scholar] [CrossRef] [Scilit] [PubMed]
- Selomane, O.; Reyers, B.; Biggs, R.; Tallis, H.; Polasky, S. Towards integrated social-ecological sustainability indicators: Exploring the contribution and gaps in existing global data. Ecol. Econ. 2015, 118, 140–146. [Google Scholar] [CrossRef] [Scilit]
- Kaijser, A.; Kronsell, A. Climate change through the lens of intersectionality. Env. Politics 2014, 23, 417–433. [Google Scholar] [CrossRef] [Scilit]
- Kawarazuka, N.; Locke, C.; McDougall, C.; Kantor, P.; Morgan, M. Bringing analysis of gender and social–ecological resilience together in small-scale fisheries research: Challenges and opportunities. Ambio 2017, 46, 201–213. [Google Scholar] [CrossRef] [Scilit] [PubMed]
- Pickett, S.T.A.; Cadenasso, M.L. The Ecosystem as a Multidimensional Concept: Meaning, Model, and Metaphor. Ecosystems 2002, 5, 1–10. [Google Scholar] [CrossRef] [Scilit]
- Alkire, S. Dimensions of Human Development. World Dev. 2002, 30, 181–205. [Google Scholar] [CrossRef] [Scilit]
- Barbier, E.B.; Koch, E.W.; Silliman, B.R.; Hacker, S.D.; Wolanski, E.; Primavera, J.; Granek, E.F.; Polasky, S.; Aswani, S.; Cramer, L.A.; et al. Coastal ecosystem-based management with nonlinear ecological functions and values. Science 2008, 319, 321–323. [Google Scholar] [CrossRef] [Scilit] [PubMed]
- Rial, J.A.; Sr. Pielke, R.A.; Beniston, M.; Claussen, M.; Canadell, J.; Cox, P.; Held, H.; de Noblet-Ducoudré, N.; Prinn, R.; Reynolds, J.F.; et al. Nonlinearities, Feedbacks and Critical Thresholds within the Earth’s Climate System. Clim. Chang. 2004, 65, 11–38. [Google Scholar] [CrossRef] [Scilit]
- Drazin, P.G. Nonlinear Systems; Cambridge University Press: Cambridge, UK, 1992; ISBN 9781139172455. [Google Scholar]
- Pascual, U.; Palomo, I.; Adams, W.M.; Chan, K.M.A.; Daw, T.M.; Garmendia, E.; Gómez-Baggethun, E.; de Groot, R.S.; Mace, G.M.; Martín-López, B.; et al. Off-stage ecosystem service burdens: A blind spot for global sustainability. Environ. Res. Lett. 2017, 12, 075001. [Google Scholar] [CrossRef] [Scilit]
- Scheffer, M.; Carpenter, S.R. Catastrophic regime shifts in ecosystems: Linking theory to observation. Trends Ecol. Evol. 2003, 18, 648–656. [Google Scholar] [CrossRef] [Scilit]
- Schlüter, M.; McAllister, R.R.J.; Arlinghaus, R.; Bunnefeld, N.; Eisenack, K.; Hölker, F.; Milner-Gulland, E.J.; Müller, B.; Nicholson, E.; Quaas, M.; et al. New horizons for managing the environment: A review of coupled social-ecological systems modeling. Nat. Resour. Model. 2012, 25, 219–272. [Google Scholar] [CrossRef] [Scilit]
- Barabasi, A.-L.; Albert, R. Emergence of scaling in random networks. Science 1999, 286, 509–512. [Google Scholar] [CrossRef] [Scilit] [PubMed]
- Biggs, R.; Carpenter, S.R.; Brock, W.A. Turning back from the brink: Detecting an impending regime shift in time to avert it. Proc. Natl. Acad. Sci. USA 2009, 106, 826–831. [Google Scholar] [CrossRef] [Scilit] [PubMed]
- Kinzig, A.P.; Ryan, P.; Etienne, M.; Allison, H.; Elmqvist, T.; Walker, B.H. Resilience and regime shifts:assessing cascading effects. Ecol. Soc. 2006, 11, 20. [Google Scholar] [CrossRef] [Scilit]
- Scheffer, M.; Carpenter, S.R.S.; Foley, J.A.; Folke, C.; Walker, B. Catastrophic shifts in ecosystems. Nature 2001, 413, 591–596. [Google Scholar] [CrossRef] [Scilit] [PubMed]
- Spanbauer, T.L.; Allen, C.R.; Angeler, D.G.; Eason, T.; Fritz, S.C.; Garmestani, A.S.; Nash, K.L.; Stone, J.R. Prolonged instability prior to a regime shift. PLoS ONE 2014, 9, e108936. [Google Scholar] [CrossRef] [Scilit] [PubMed]
- Lade, S.J.; Gross, T. Early warning signals for critical transitions: A generalized modeling approach. PLoS Comput. Biol. 2012, 8, e1002360. [Google Scholar] [CrossRef] [Scilit] [PubMed]
- Scheffer, M.; Carpenter, S.R.; Lenton, T.M.; Bascompte, J.; Brock, W.; Dakos, V.; Van De Koppel, J.; Van De Leemput, I.A.; Levin, S.A.; Van Nes, E.H.; et al. Anticipating critical transitions. Science 2012, 338, 344–348. [Google Scholar] [CrossRef] [Scilit] [PubMed]
- Wang, R.; Dearing, J.A.; Langdon, P.G.; Zhang, E.; Yang, X.; Dakos, V.; Scheffer, M. Flickering gives early warning signals of a critical transition to a eutrophic lake state. Nature 2012, 492, 419–422. [Google Scholar] [CrossRef] [Scilit] [PubMed]
- Rockström, J.; Steffen, W.; Noone, K.; Persson, A.; Chapin, F.S.; Lambin, E.F.; Lenton, T.M.; Scheffer, M.; Folke, C.; Schellnhuber, H.J.; et al. A safe operating space for humanity. Nature 2009, 461, 472–475. [Google Scholar] [CrossRef] [Scilit] [PubMed]
- Steffen, W.; Richardson, K.; Rockström, J.; Cornell, S.E.; Fetzer, I.; Bennett, E.M.; Biggs, R.; Carpenter, S.R.; de Vries, W.; de Wit, C.A.; et al. Planetary boundaries: Guiding human development on a changing planet. Science 2015, 347, 1259855. [Google Scholar] [CrossRef] [Scilit] [PubMed]
- Tharme, R.E. A global perspective on environmental flow assessment: Emerging trends in the development and application of environmental flow methodologies for rivers. River Res. Appl. 2003, 19, 397–441. [Google Scholar] [CrossRef] [Scilit]
- Raworth, K. Oxfam Discussion Papers: A Safe and Just Space for Humanity: Can We Live within the Doughnut (Oxfam Discussion Paper); Oxfam: Oxford, UK, 2012; Volume 461. [Google Scholar]
- Nussbaum, M.; Sen, A. (Eds.) The Quality of Life; Oxford University Press: Oxford, UK, 1993; ISBN 9780198287971. [Google Scholar]
- Adger, W.N.; Brown, K.; Tompkins, E.L. The Political Economy of Cross-Scale Networks in Resource Co-Management. Ecol. Soc. 2005, 10. [Google Scholar] [CrossRef] [Scilit]
- Cash, D.W.; Adger, W.N.; Berkes, F.; Garden, P.; Lebel, L.; Olsson, P.; Pritchard, L.; Young, O. Scale and Cross-Scale Dynamics: Governance and Information in a Multilevel World. Ecol. Soc. 2006, 11, art8. [Google Scholar] [CrossRef] [Scilit]
- Grimm, N.B.; Foster, D.; Groffman, P.; Grove, J.M.; Hopkinson, C.S.; Nadelhoffer, K.J.; Pataki, D.E.; Peters, D.P. The changing landscape: Ecosystem responses to urbanization and pollution across climatic and societal gradients. Front. Ecol. Environ. 2008, 6, 264–272. [Google Scholar] [CrossRef] [Scilit]
- Keys, P.W.; Wang-Erlandsson, L.; Gordon, L.J. Revealing Invisible Water: Moisture Recycling as an Ecosystem Service. PLoS ONE 2016, 11, e0151993. [Google Scholar] [CrossRef] [Scilit] [PubMed]
- Barnett, J.; Evans, L.S.; Gross, C.; Kiem, A.S.; Kingsford, R.T.; Palutikof, J.P.; Pickering, C.M.; Smithers, S.G. From barriers to limits to climate change adaptation: Path dependency and the speed of change. Ecol. Soc. 2015, 20, art5. [Google Scholar] [CrossRef] [Scilit]
- Dearing, J.A.; Yang, X.; Dong, X.; Zhang, E.; Chen, X.; Langdon, P.G.; Zhang, K.; Zhang, W.; Dawson, T.P. Extending the timescale and range of ecosystem services through paleoenvironmental analyses: The example of the lower Yangtze basin. Proc. Natl. Acad. Sci. USA 2012, 109, E1111–E1120. [Google Scholar] [CrossRef] [Scilit] [PubMed]
- Zhang, K.; Dearing, J.A.; Dawson, T.P.; Dong, X.; Yang, X.; Zhang, W. Poverty alleviation strategies in eastern China lead to critical ecological dynamics. Sci. Total Environ. 2015, 506–507, 164–181. [Google Scholar] [CrossRef] [Scilit] [PubMed]
- Davidson, J.L.; Jacobson, C.; Lyth, A.; Dedekorkut-Howes, A.; Baldwin, C.L.; Ellison, J.C.; Holbrook, N.J.; Howes, M.J.; Serrao-Neumann, S.; Singh-Peterson, L.; et al. Interrogating resilience: Toward a typology to improve its operationalization. Ecol. Soc. 2016, 21, art27. [Google Scholar] [CrossRef] [Scilit]
- Leslie, H.M.; Basurto, X.; Nenadovic, M.; Sievanen, L.; Cavanaugh, K.C.; Cota-Nieto, J.J.; Erisman, B.E.; Finkbeiner, E.; Hinojosa-Arango, G.; Moreno-Báez, M.; et al. Operationalizing the social-ecological systems framework to assess sustainability. Proc. Natl. Acad. Sci. USA 2015, 112, 5979–5984. [Google Scholar] [CrossRef] [Scilit] [PubMed]
- Haug, M.R. Measurement in Social Stratification. Annu. Rev. Sociol. 1977, 3, 51–77. [Google Scholar] [CrossRef] [Scilit]
- Daw, T.; Brown, K.; Rosendo, S.; Pomeroy, R. Applying the ecosystem services concept to poverty alleviation: The need to disaggregate human well-being. Environ. Conserv. 2011, 38, 370–379. [Google Scholar] [CrossRef] [Scilit]
- Unterhalter, E. Poverty, education, gender and the Millennium Development Goals: Reflections on boundaries and intersectionality. Theory Res. Educ. 2012, 10, 253–274. [Google Scholar] [CrossRef] [Scilit]
- Dawson, N.; Martin, A. Assessing the contribution of ecosystem services to human wellbeing: A disaggregated study in western Rwanda. Ecol. Econ. 2015, 117, 62–72. [Google Scholar] [CrossRef] [Scilit]
- Butchart, S.H.M.; Walpole, M.; Collen, B.; van Strien, A.; Scharlemann, J.P.W.; Almond, R.E.A.; Baillie, J.E.M.; Bomhard, B.; Brown, C.; Bruno, J.; et al. Global biodiversity: Indicators of recent declines. Science 2010, 328, 1164–1168. [Google Scholar] [CrossRef] [Scilit] [PubMed]
- WWF. Living Planet Report: Risk and Resilience in a New Era; WWF International: Gland, Switzerland, 2016; ISBN 9783946211068. [Google Scholar]
- Boonstra, W.J.; Björkvik, E.; Haider, L.J.; Masterson, V. Human responses to social-ecological traps. Sustain. Sci. 2016, 11, 877–889. [Google Scholar] [CrossRef] [Scilit] [PubMed]
- Winter, K.; Lincoln, N.; Berkes, F.; Winter, K.B.; Lincoln, N.K.; Berkes, F. The Social-Ecological Keystone Concept: A Quantifiable Metaphor for Understanding the Structure, Function, and Resilience of a Biocultural System. Sustainability 2018, 10, 3294. [Google Scholar] [CrossRef] [Scilit]
- Nelson, G.C. Untangling the Environmentalist’s Paradox: Better Data, Better Accounting, and Better Technology Will Help. Bioscience 2011, 61, 9–10. [Google Scholar] [CrossRef] [Scilit]
- Ang, F.; Van Passel, S. Beyond the Environmentalist’s Paradox and the Debate on Weak versus Strong Sustainability. Bioscience 2012, 62, 251–259. [Google Scholar] [CrossRef] [Scilit]
- Dallimer, M.; Davies, Z.G.; Diaz-Porras, D.F.; Irvine, K.N.; Maltby, L.; Warren, P.H.; Armsworth, P.R.; Gaston, K.J. Historical influences on the current provision of multiple ecosystem services. Glob. Environ. Chang. 2015, 31, 307–317. [Google Scholar] [CrossRef] [Scilit]
- Galaz, V.; Moberg, F.; Olsson, E.K.; Paglia, E.; Parker, C. Institutional and political leadership dimensions of cascading ecological crises. Public Adm. 2011, 89, 361–380. [Google Scholar] [CrossRef] [Scilit]
- Galaz, V.; Tallberg, J.; Boin, A.; Ituarte-Lima, C.; Hey, E.; Olsson, P.; Westley, F. Global Governance Dimensions of Globally Networked Risks: The State of the Art in Social Science Research. Risk Hazards Cris. Public Policy 2017, 8, 4–27. [Google Scholar] [CrossRef] [Scilit]
- Sachs, J.D.; McArthur, J.W. The Millennium Project: A plan for meeting the Millennium Development Goals. Lancet 2005, 365, 347–353. [Google Scholar] [CrossRef] [Scilit]
- Wilcock, S.; Hossain, S.; Poppy, G.M. Managing Complex Systems To Enhance Sustainability. In Stressors in the Marine Environment; Oxford University Press: Oxford, UK, 2016; pp. 301–312. [Google Scholar]
- De Groot, R.S. A typology for the classification, description and valuation of ecosystem functions, goods and services. Ecol. Econ. 2002, 41, 393–408. [Google Scholar] [CrossRef] [Scilit]
- Müller, F.; Burkhard, B. The indicator side of ecosystem services. Ecosyst. Serv. 2012, 1, 26–30. [Google Scholar] [CrossRef] [Scilit]
- Tallis, H.; Mooney, H.A.; Sandy, A.; Balvanera, P.; Cramer, W.; Daniel, K.; Polasky, S.; Reyers, B.; Ricketts, T.; Running, S.; et al. A global system for monitoring ecosystem service change. Bioscience 2012, 62, 977–986. [Google Scholar] [CrossRef] [Scilit]
- Reyers, B.; Biggs, R.; Cumming, G.S.; Elmqvist, T.; Hejnowicz, A.P.; Polasky, S. Getting the measure of ecosystem services: A social-ecological approach. Front. Ecol. Environ. 2013, 11, 268–273. [Google Scholar] [CrossRef] [Scilit]
- Erb, K.H. How a socio-ecological metabolism approach can help to advance our understanding of changes in land-use intensity. Ecol. Econ. 2012, 76, 8–14. [Google Scholar] [CrossRef] [Scilit] [PubMed]
- Kennedy, C.A.; Cuddihy, J.; Engel-Yan, J. The changing metabolism of cities. J. Ind. Ecol. 2007, 11, 43–59. [Google Scholar] [CrossRef] [Scilit]
- Binder, C.R.; Hinkel, J.; Bots, P.W.G.; Claudia, P.-W.; Pahl-Wostl, C.; Claudia, P.-W. Comparison of Frameworks for Analyzing Social-ecological Systems. Ecol. Soc. 2013, 18, 26. [Google Scholar] [CrossRef] [Scilit]
- Scholz, R.W. Environmental Literacy in Scienceand Society From Knowledge to Decisions; Cambridge University Press: Cambridge, UK, 2011; ISBN 0095-3628. [Google Scholar]
- Plahte, E.; Thomas, M.; Omholt, S.W. Feedback loops, stability and multistationarity in dynamical systems. J. Biol. Syst. 1995, 3, 409–413. [Google Scholar] [CrossRef] [Scilit]
- Dawson, N.; Grogan, K.; Martin, A.; Mertz, O.; Pasgaard, M.; Vang Rasmussen, L. Environmental justice research shows the importance of social feedbacks in ecosystem service trade-offs. Ecol. Soc. 2017, 22. [Google Scholar] [CrossRef] [Scilit]
- Biggs, R.; Schlüter, M.; Biggs, D.; Bohensky, E.L.; BurnSilver, S.; Cundill, G.; Dakos, V.; Daw, T.M.; Evans, L.S.; Kotschy, K.; et al. Toward Principles for Enhancing the Resilience of Ecosystem Services. Annu. Rev. Environ. Resour. 2012, 37, 421–448. [Google Scholar] [CrossRef] [Scilit]
- Poppy, G.M.; Chiotha, S.; Eigenbrod, F.; Harvey, C.A.; Honzák, M.; Hudson, M.D.; Jarvis, A.; Madise, N.J.; Schreckenberg, K.; Shackleton, C.M.; et al. Food security in a perfect storm: Using the ecosystem services framework to increase understanding. Philos. Trans. R. Soc. Lond. B. Biol. Sci. 2014, 369, 20120288. [Google Scholar] [CrossRef] [Scilit] [PubMed]
- Kafumbata, D.; Jamu, D.; Chiotha, S. Riparian ecosystem resilience and livelihood strategies under test: Lessons from Lake Chilwa in Malawi and other lakes in Africa. Philos. Trans. R. Soc. Lond. B. Biol. Sci. 2014, 369, 20130052. [Google Scholar] [CrossRef] [Scilit] [PubMed]
- Folke, C.; Biggs, R.; Norstrom, A.V.; Reyers, B.; Rockstrom, J. Social-ecological resilience and biosphere-based sustainability science. Ecol. Soc. 2016, 21, 41. [Google Scholar] [CrossRef] [Scilit]
- Goodwin, H. Measuring and Reporting the Impact of Tourism on Poverty. In Developments in Tourism Research; Elsevier: Amsterdam, The Netherlands, 2011; pp. 1–13. [Google Scholar] [CrossRef]
- Cockburn, J.; Palmer, C.; Biggs, H.; Rosenberg, E. Navigating Multiple Tensions for Engaged Praxis in a Complex Social-Ecological System. Land 2018, 7, 129. [Google Scholar] [CrossRef] [Scilit]
- Talbot, M.; van den Broeck, D. Shifting from Individual to Collective Action: Living Land’s experience in the Baviaanskloof, South Africa. In Land Restoration: Reclaiming Landscapes for a Sustainable Future; Elsevier: Amsterdam, The Netherlands, 2015; pp. 521–531. ISBN 9780128013533. [Google Scholar]
- Swilling, M.; Hajer, M. Governance of urban transitions: Towards sustainable resource efficient urban infrastructures. Environ. Res. Lett. 2017, 12, 125007. [Google Scholar] [CrossRef] [Scilit]
- Wilson, S.; Pearson, L.J.; Kashima, Y.; Lusher, D.; Pearson, C. Separating Adaptive Maintenance (Resilience) and Transformative Capacity of Social-Ecological Systems. Ecol. Soc. 2013, 18, art22. [Google Scholar] [CrossRef] [Scilit]
- Brown, K.; Westaway, E. Agency, Capacity, and Resilience to Environmental Change: Lessons from Human Development, Well-Being, and Disasters. Annu. Rev. Environ. Resour. 2011, 36, 321–342. [Google Scholar] [CrossRef] [Scilit]
- Marshall, N.A.; Park, S.E.; Adger, W.N.; Brown, K.; Howden, S.M. Transformational capacity and the influence of place and identity. Environ. Res. Lett. 2012, 7, 034022. [Google Scholar] [CrossRef] [Scilit]
- Raworth, K. Doughnut Economics: Seven Ways to Think Like a 21st Century Economist; Random House Business Books: London, UK, 2017; ISBN 9781473517813. [Google Scholar]
- Parlee, B.L.; Geertsema, K.; Willier, A. Social-ecological thresholds in a changing boreal landscape: Insights from cree knowledge of the Lesser Slave Lake region of Alberta, Canada. Ecol. Soc. 2012, 17, art20. [Google Scholar] [CrossRef] [Scilit]
- Warner, K. Global environmental change and migration: Governance challenges. Glob. Environ. Chang. 2010, 20, 402–413. [Google Scholar] [CrossRef] [Scilit]
- Mace, G.; Baillie, J.E.M. The 2010 Biodiversity Indicators: Challenges for Science and Policy. Conserv. Biol. 2007, 21, 1406–1413. [Google Scholar] [CrossRef] [Scilit] [PubMed]
- Stafford-Smith, M.; Griggs, D.; Gaffney, O.; Ullah, F.; Reyers, B.; Kanie, N.; Stigson, B.; Shrivastava, P.; Leach, M.; O’Connell, D. Integration: The key to implementing the Sustainable Development Goals. Sustain. Sci. 2017, 12, 911–919. [Google Scholar] [CrossRef] [Scilit] [PubMed]
- Kim, R.E. The emergent network structure of the multilateral environmental agreement system. Glob. Environ. Chang. 2013, 23, 980–991. [Google Scholar] [CrossRef] [Scilit]
- Haider, L.J.; Iribarrem, A.; Gardner, T.; Latawiec, A.E.; Alves-Pinto, H.; Strassburg, B. 2 Understanding Indicators And Monitoring For Sustainability in the Context of Complex Social-Ecological Systems. In Sustainability Indicators in Practice; Latawiec, A.E., Agol, D., Eds.; De Gruyter: Boston, MA, USA, 2015. [Google Scholar]


© 2019 by the authors. Licensee MDPI, Basel, Switzerland. This article is an open access article distributed under the terms and conditions of the Creative Commons Attribution (CC BY) license (http://creativecommons.org/licenses/by/4.0/).