A Multi-Criteria Decision Maker for Grid-Connected Hybrid Renewable Energy Systems Selection Using Multi-Objective Particle Swarm Optimization

 ,
, 
 ,
,  ,
,
Abstract
1. Introduction
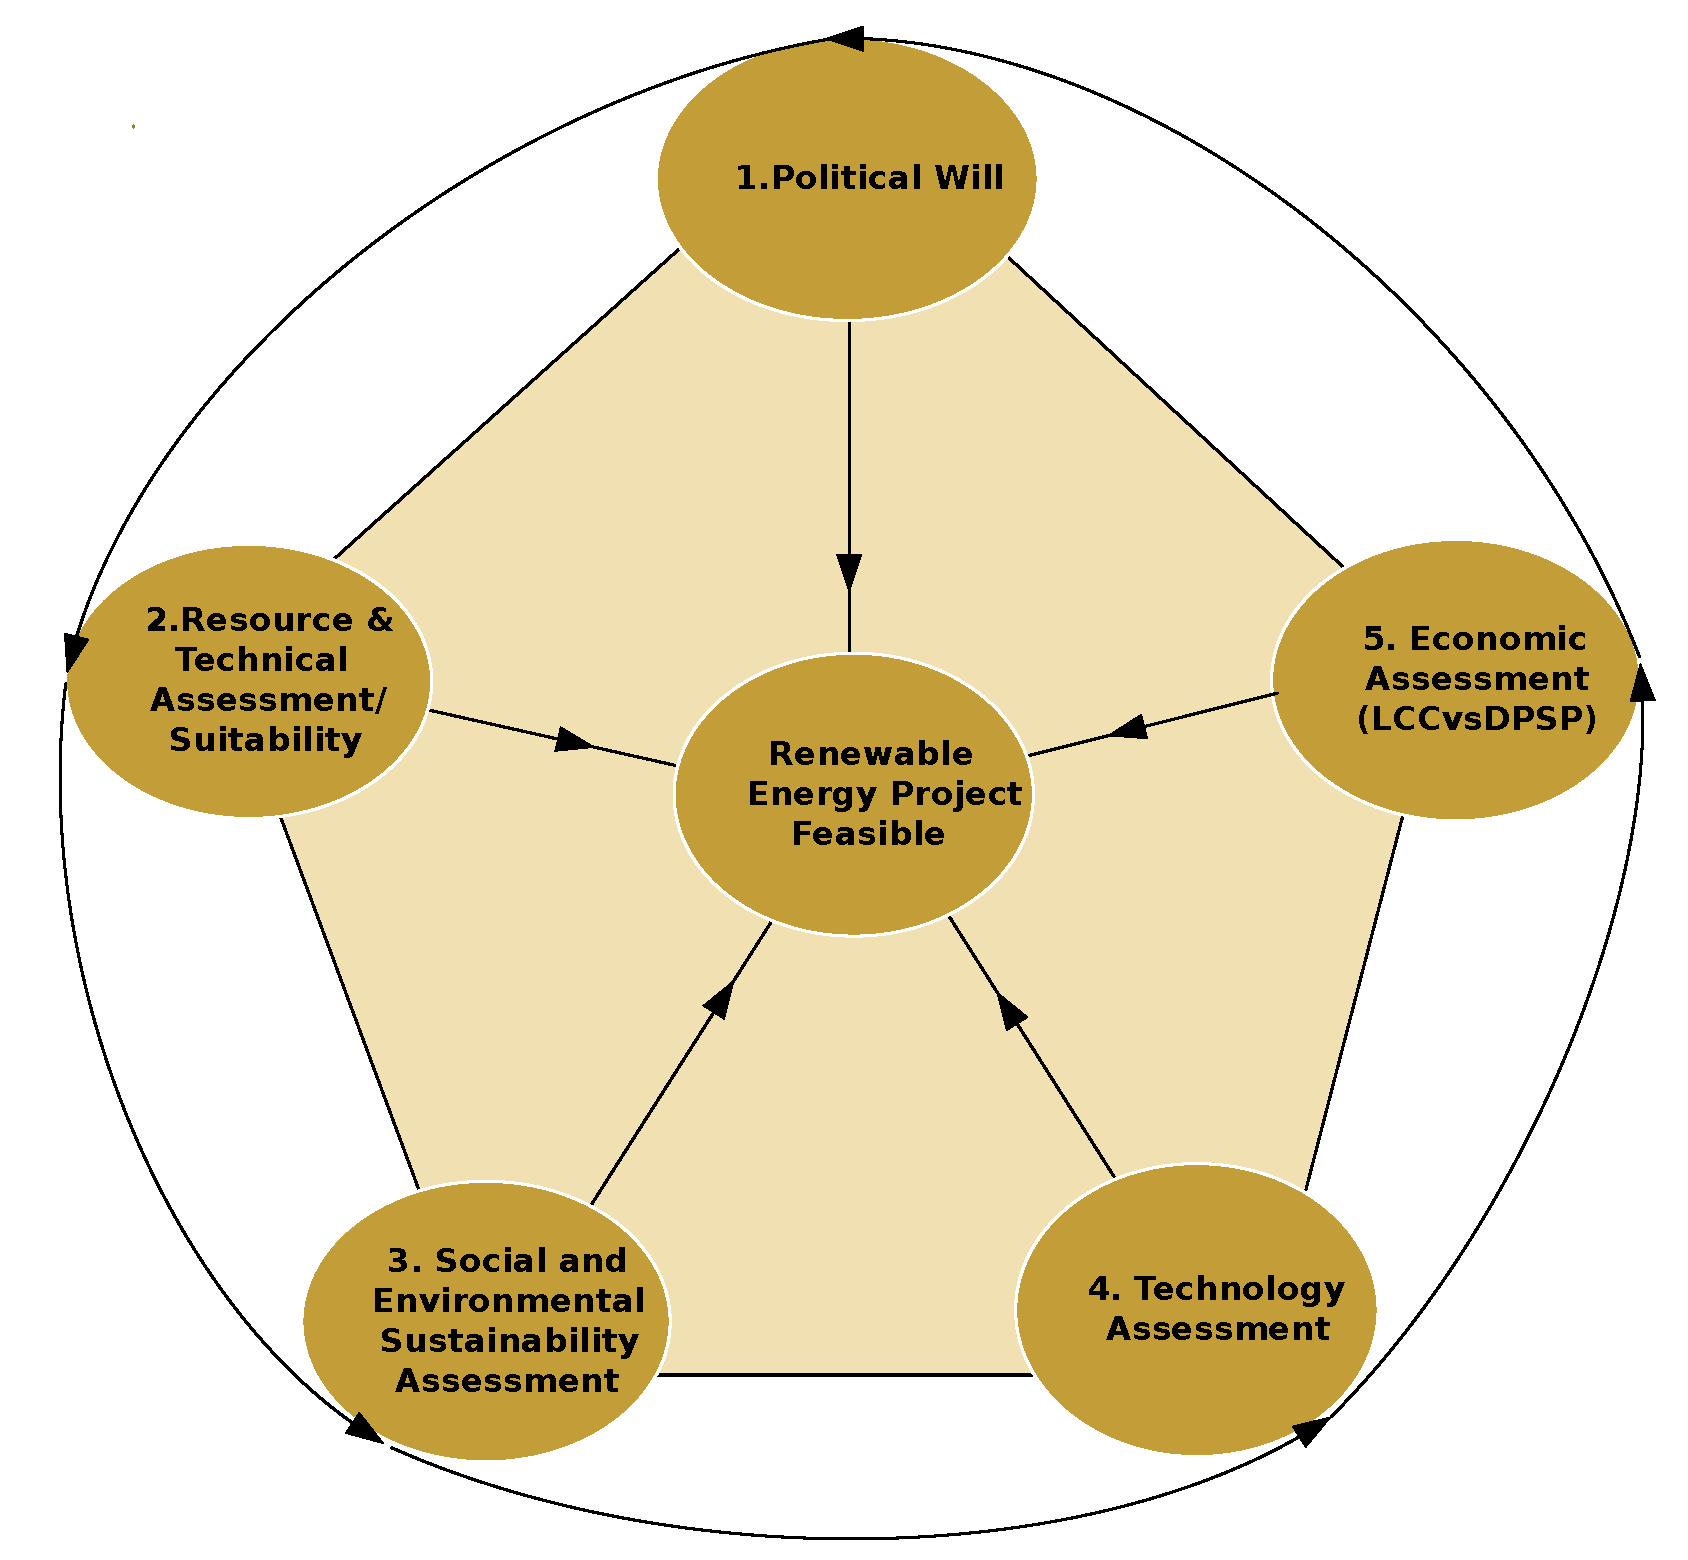
2. Methodology
- Political willUsually in developing countries, public service providers and legal systems often lack the firmness and reliability over the medium to long term to institute and enforce policies governing private sector and supportive incentives for the integration of renewable energy. Therefore, the need for governments to give their political backing through the promulgation of energy policies with the necessary regulatory framework that would also encourage the private sector to invest in renewable energy systems for power delivery has become imminent [29]. The components of such policies include provision of long term investment security, drive upgrades of existing national grids and accelerate roll-out of mini-grids, address needs of non-electrical energy forms in productive sectors, energy efficiency improvement measures, and as much as possible, apart from operational and deployment activities, enhance domestic renewable energy technology manufacturing and assembly [30].
- Resource assessment and suitabilityThe availability and suitability of any resource ensures that there is sufficient generating capacity to support the demand for targeted level of reliability with minimal cost. Hence carrying out critical assessment to determine the capacity factor of variable, uncertain and spatially diverse renewable energy resource using well-known methods, such as the Weibull distribution for wind assessment [31], is key to establishing the project viability. Data collection and identification of potential constraints that includes assessing of climatic factors, biographical factors, and geographical features such as altitude, temperature, densed urban areas, protected areas, large water bodies, etc. are also essential components in determining the suitability of the project [32].
- Social and environmental sustainability assessmentThis aspect involves the identification of mitigation measures that will not affect the livelihood of the project area negatively; keeping renewable harvest rates within regeneration rates; keeping emissions to a bare minimum; ensuring that sources of raw materials needed by humanity should not be exhausted for electricity generation especially with regards biomass and hydro power generation; ensuring job creation [33]; and ensuring that livelihood of the inhabitants of the project area is improved.
- Technology assessmentRenewable Energy Technologies (RETs) exist in a wide range of options for electricity generation; wind power generation can either be onshore or offshore; solar energy has solar heating, Concentrated Solar Power (CSP) and PV; hydro power has reservoir and run-of-the-river; and biomass power has combustion plants, biogas technology, grate technology, Bubbling Fluidized Bed (BFB) and Circulating Fluidized Bed (CFB), etc. This implies that selection of the preferred technology based on the resources available requires careful considerations ranging from type, fuel flexibility, load ramping capability, investment cost, and plant size [34] and thus the adoption of Clean Energy Technology Assessment Methodology (CETAM) [35].
- Economic assessmentMany tools designed to allow policy makers to assess Cost Of Energy (COE) and Levelised Cost Of Energy (LCOE), cost-based incentive rates can be employed across global, regional, local, and project bases; National Renewable Energy Laboratory (NREL) models for economic evaluation of energy systems can be adopted; System Advisor Model (SAM); Cost of Renewable Energy Spreadsheet Tool (CREST), Job and Economic Development Impact (JEDI) Model, etc. [36].
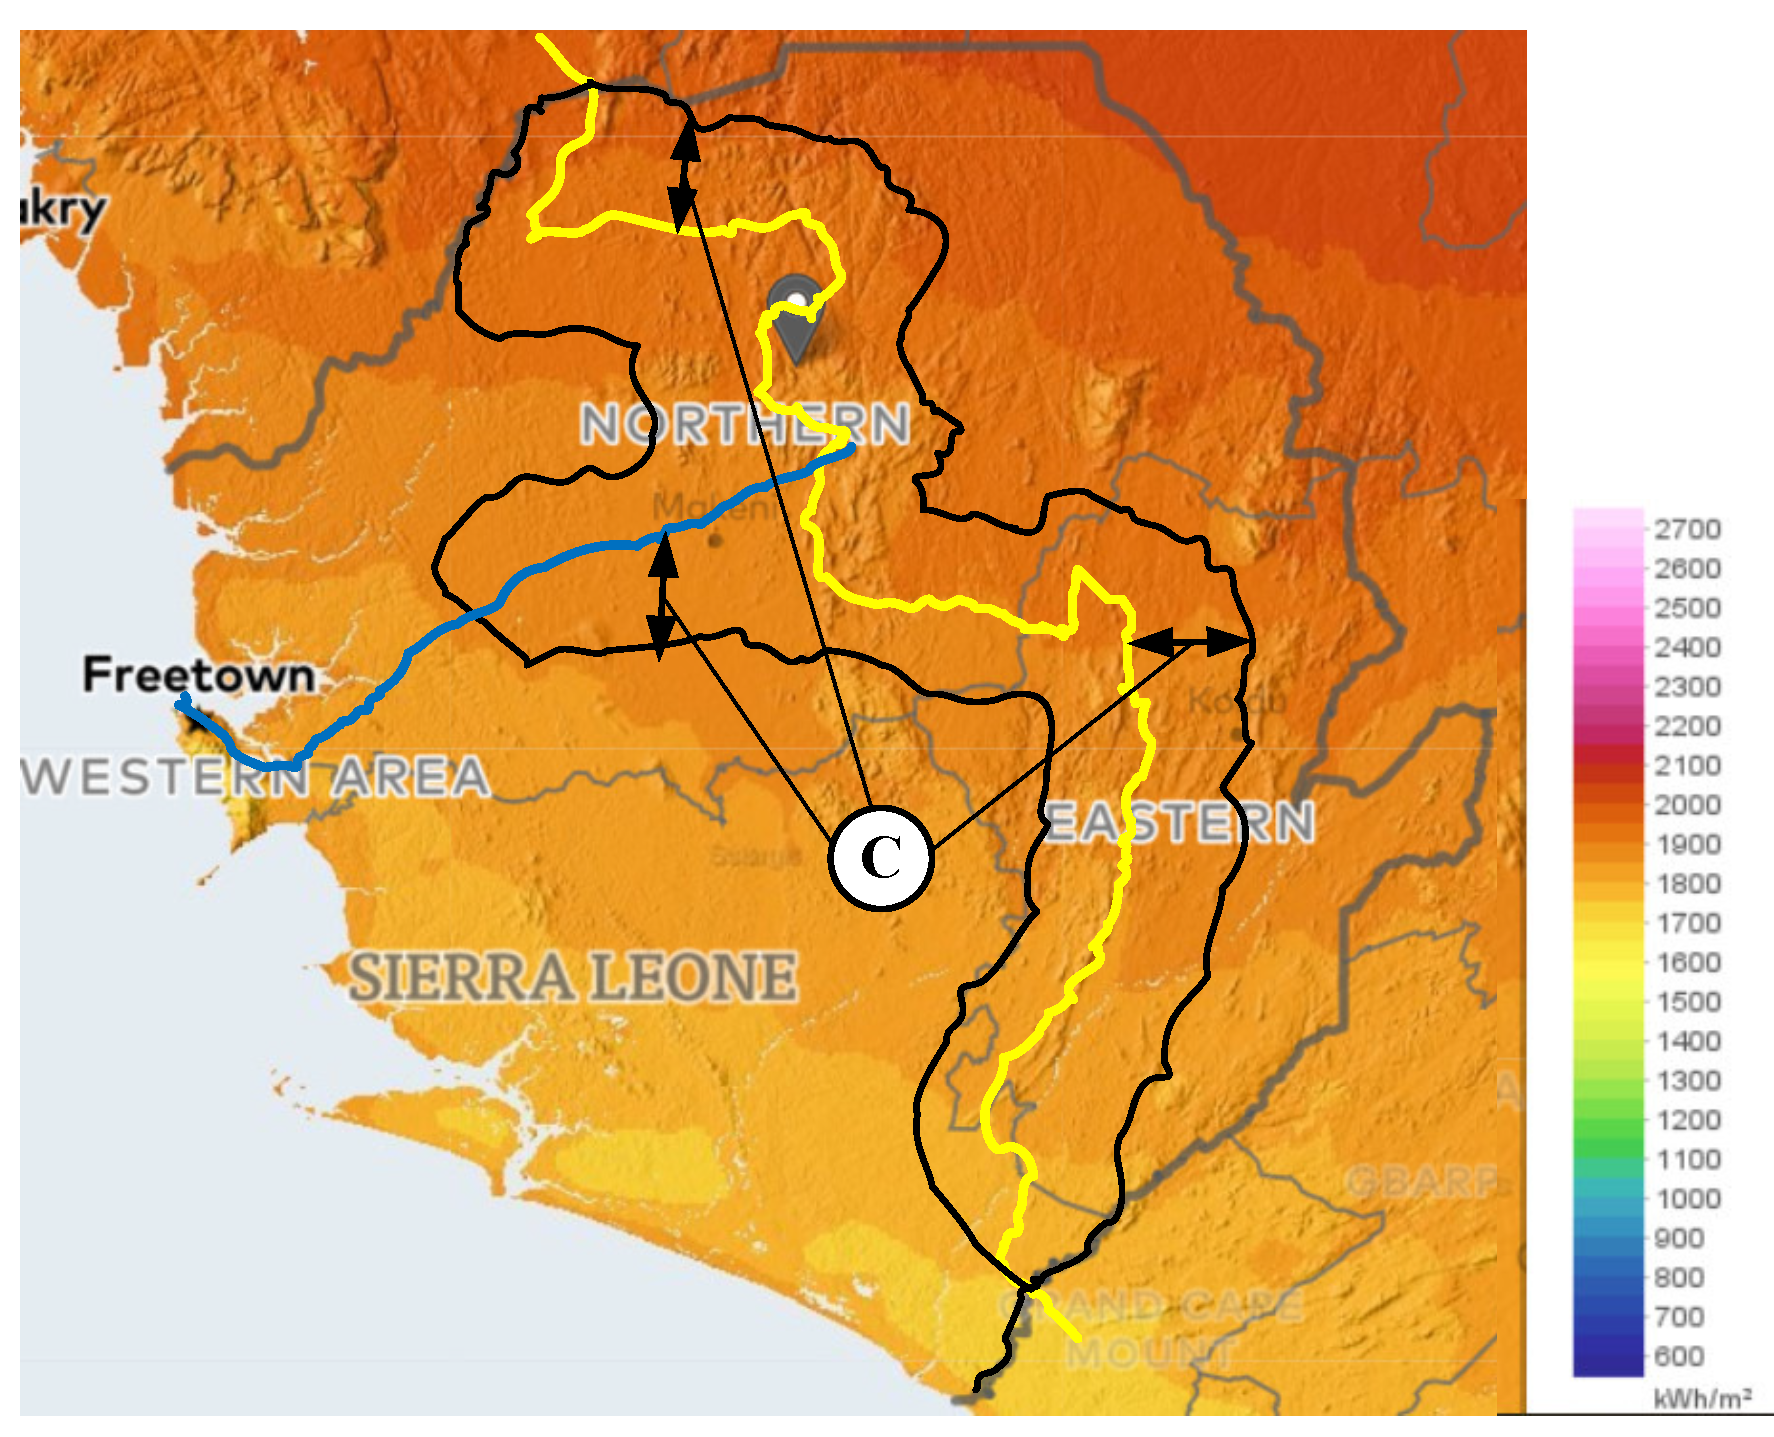
2.1. Study Area
2.2. Resource Assessment
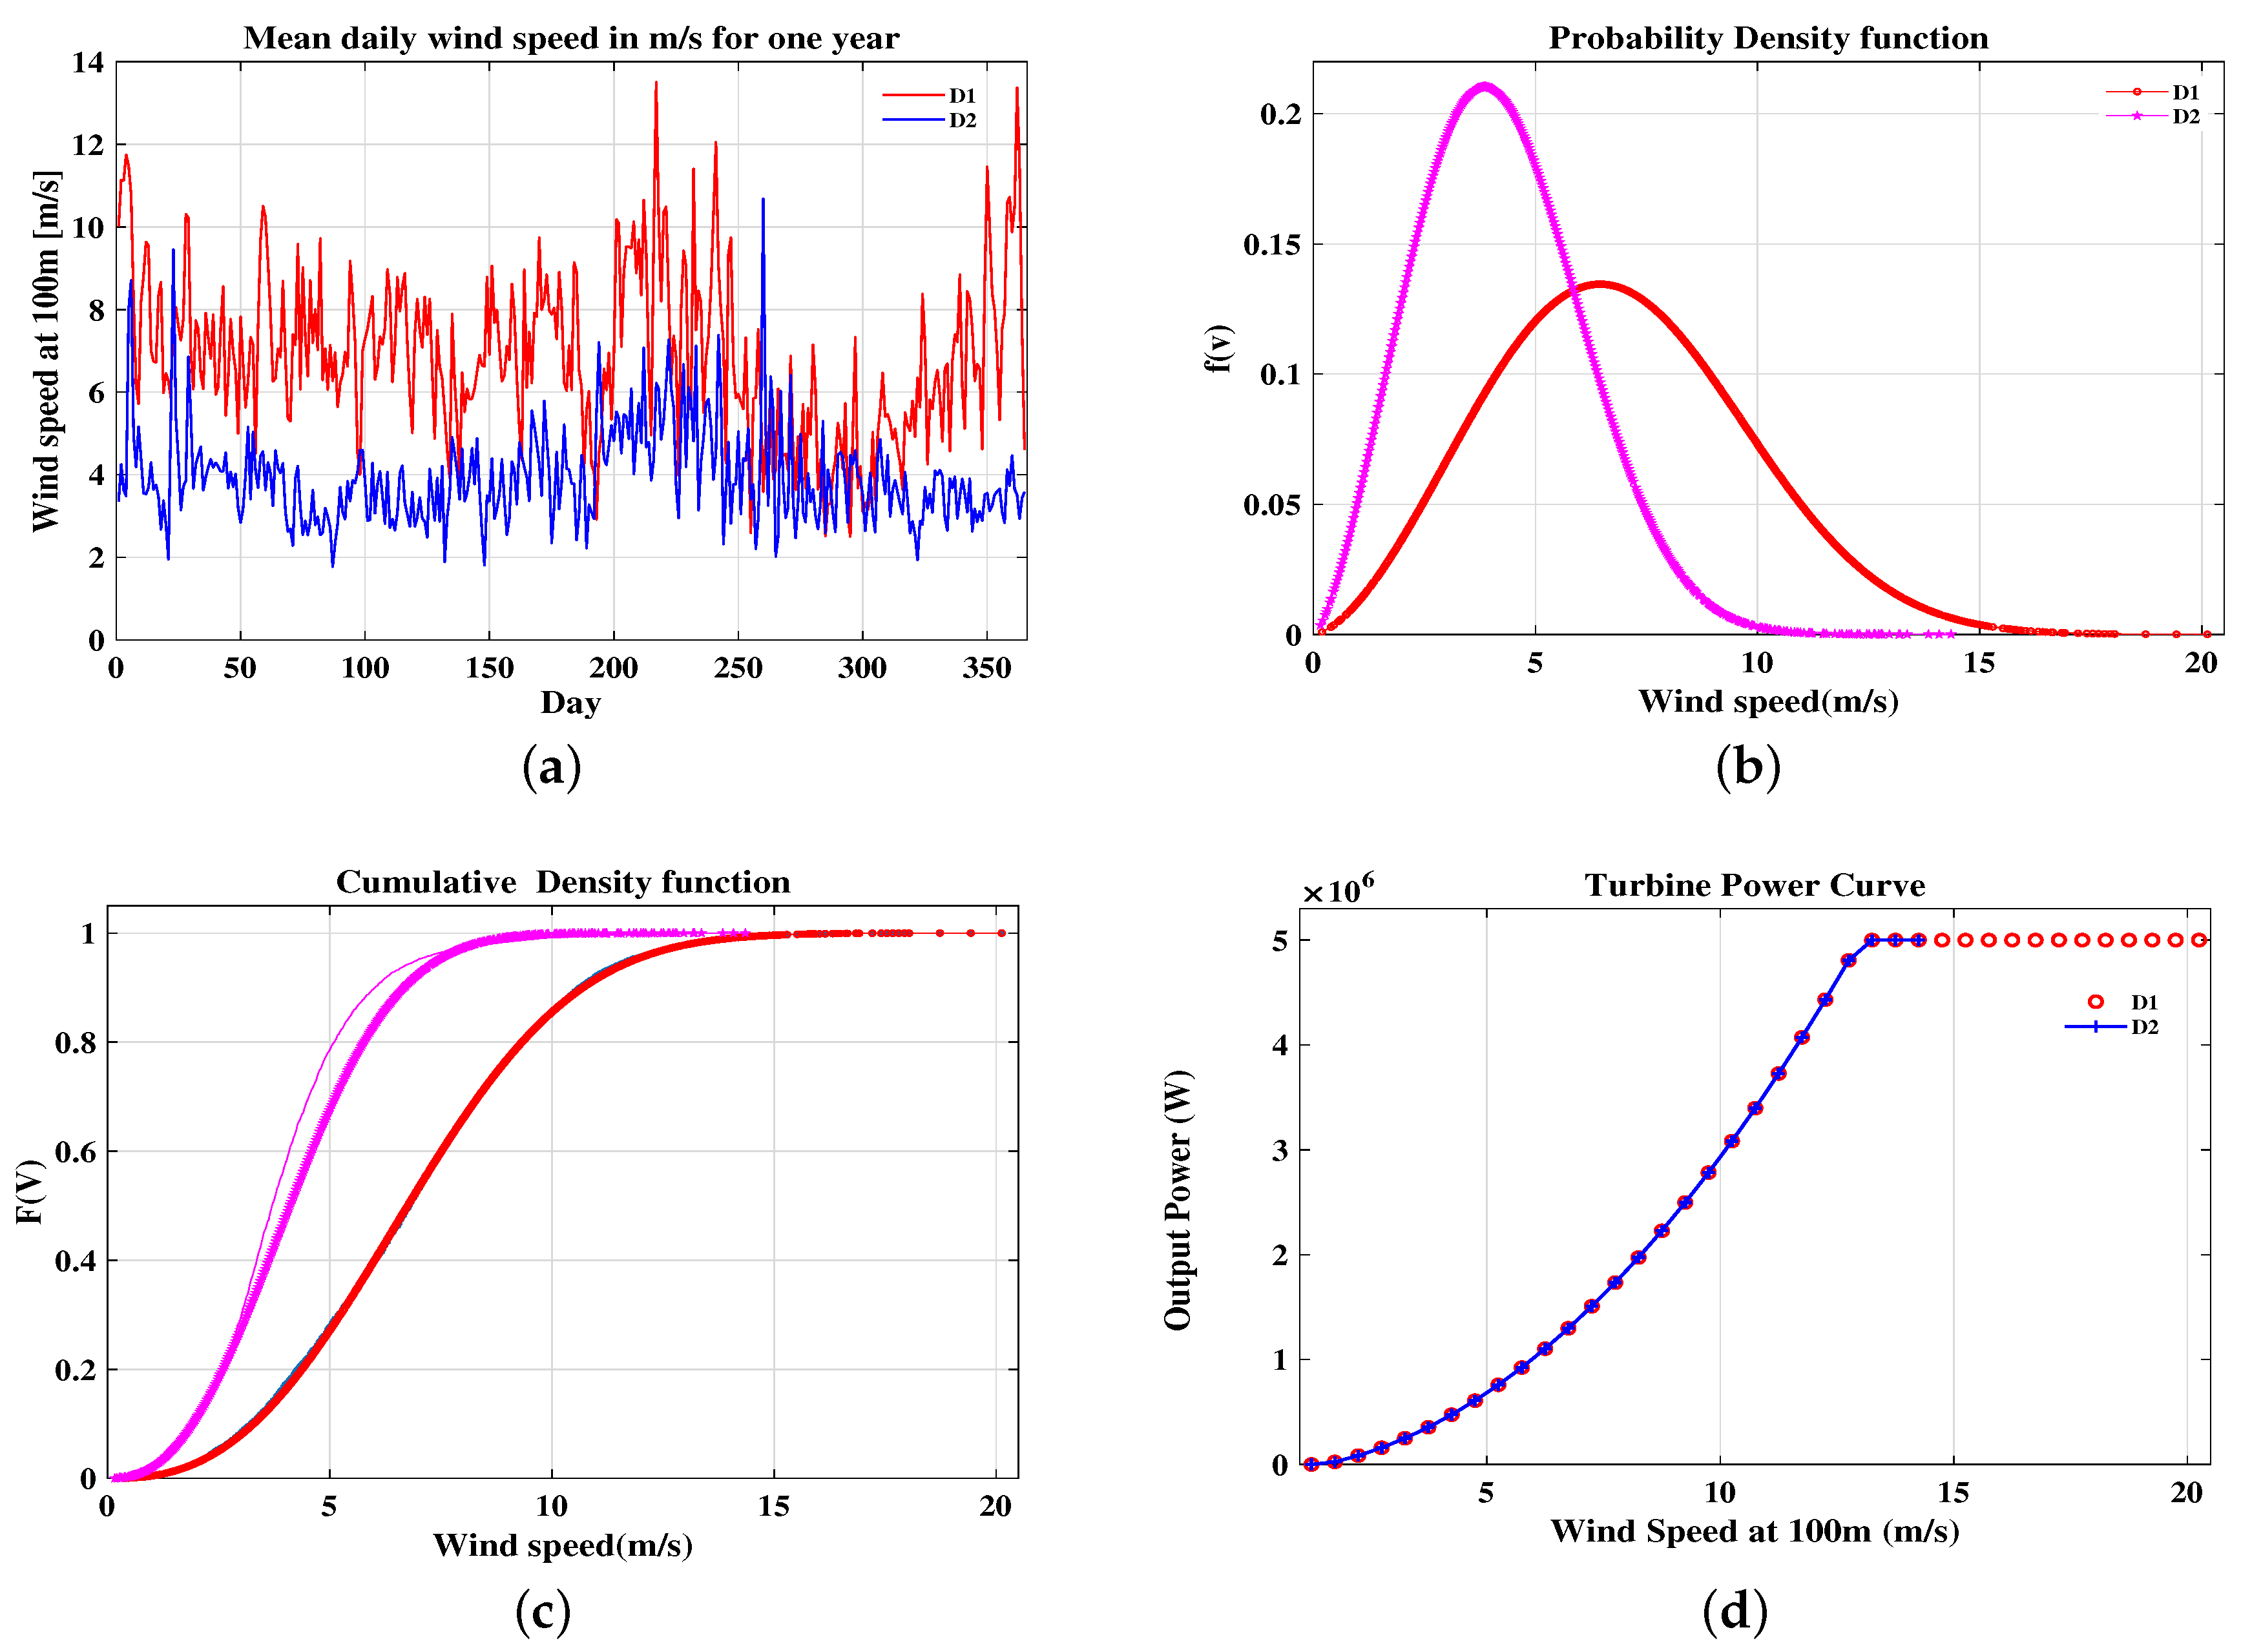
2.2.1. Wind Resource Assessment
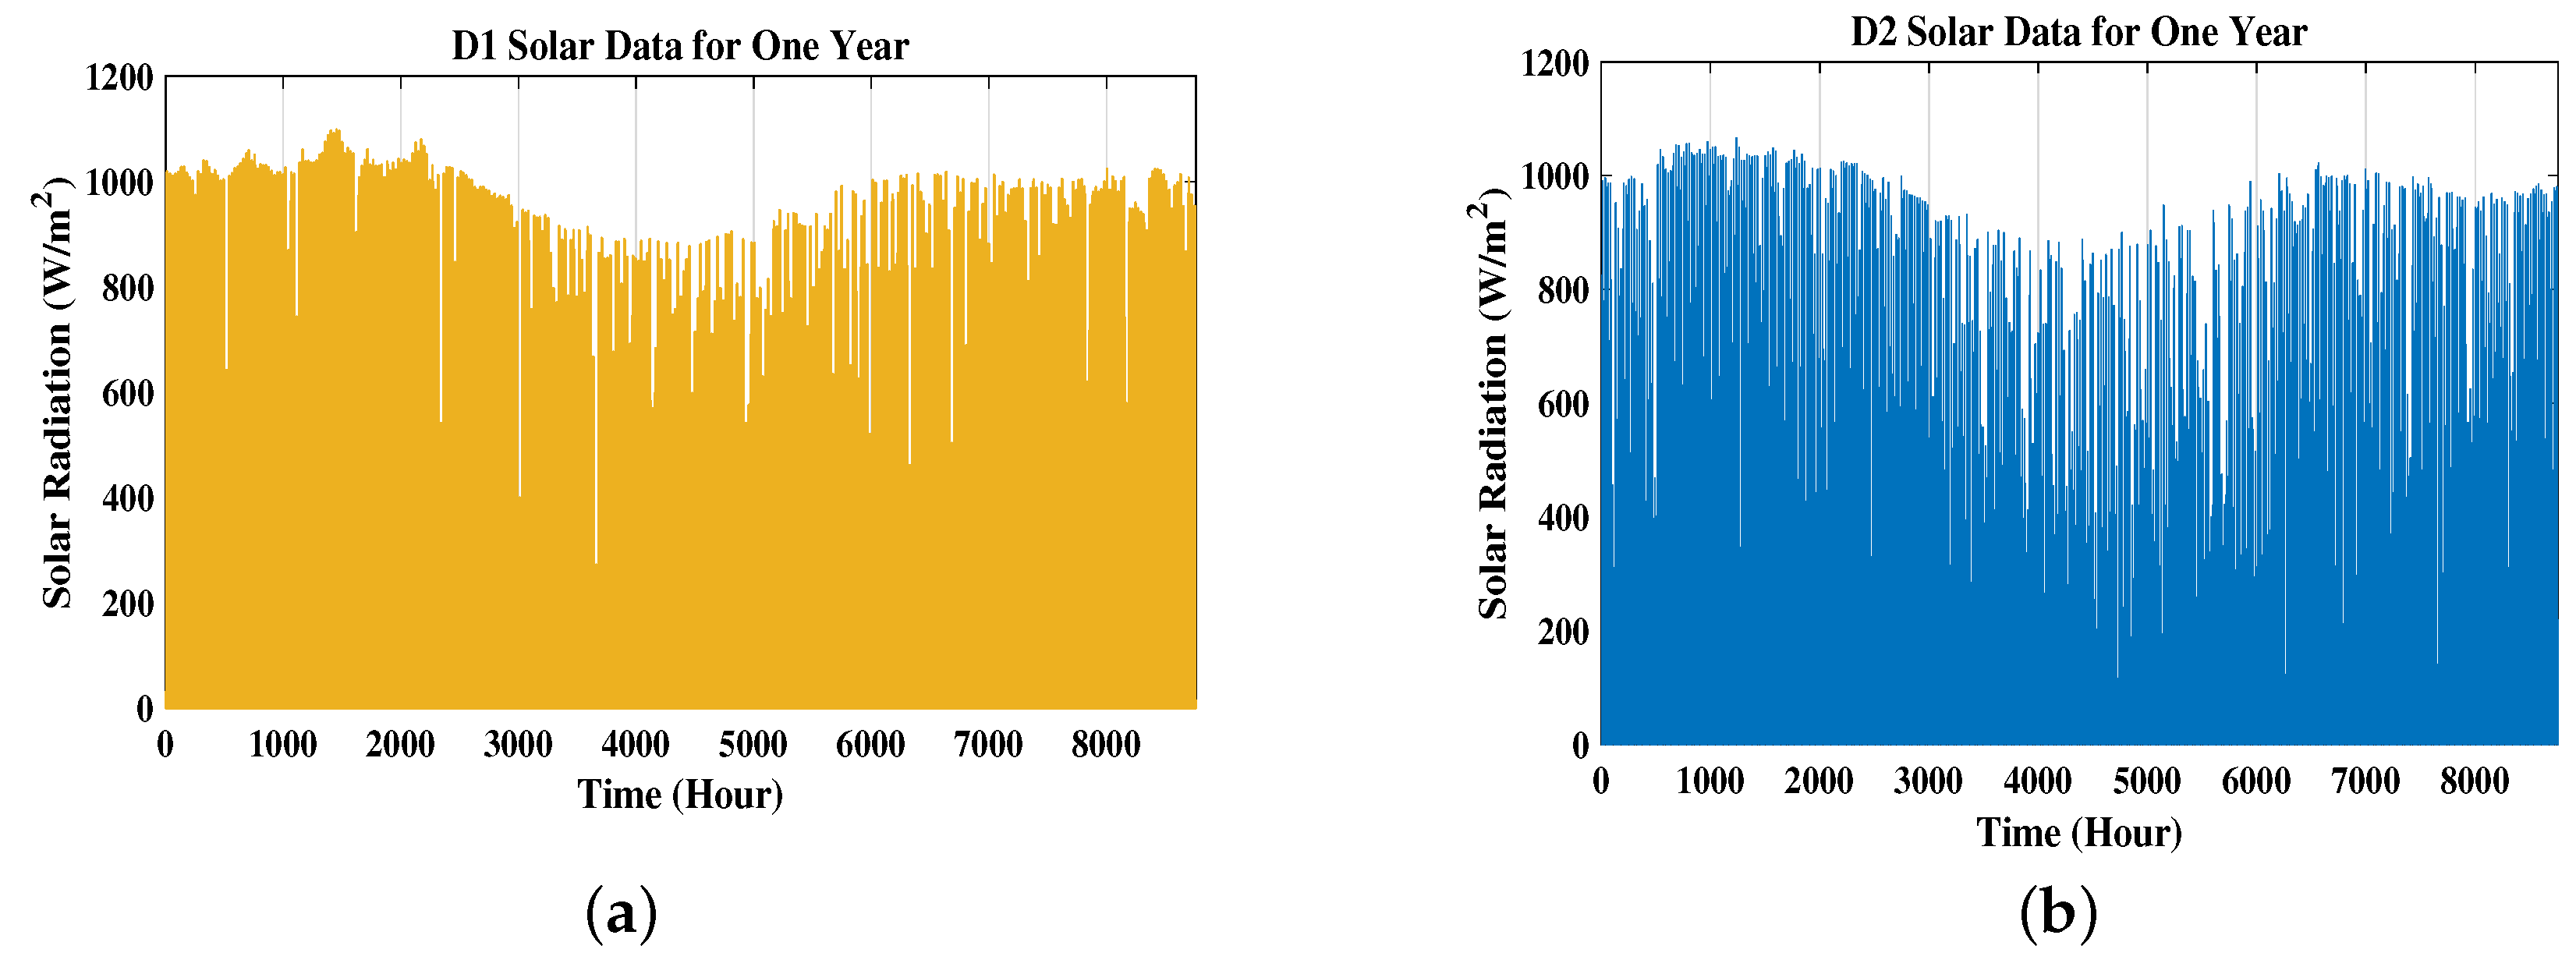
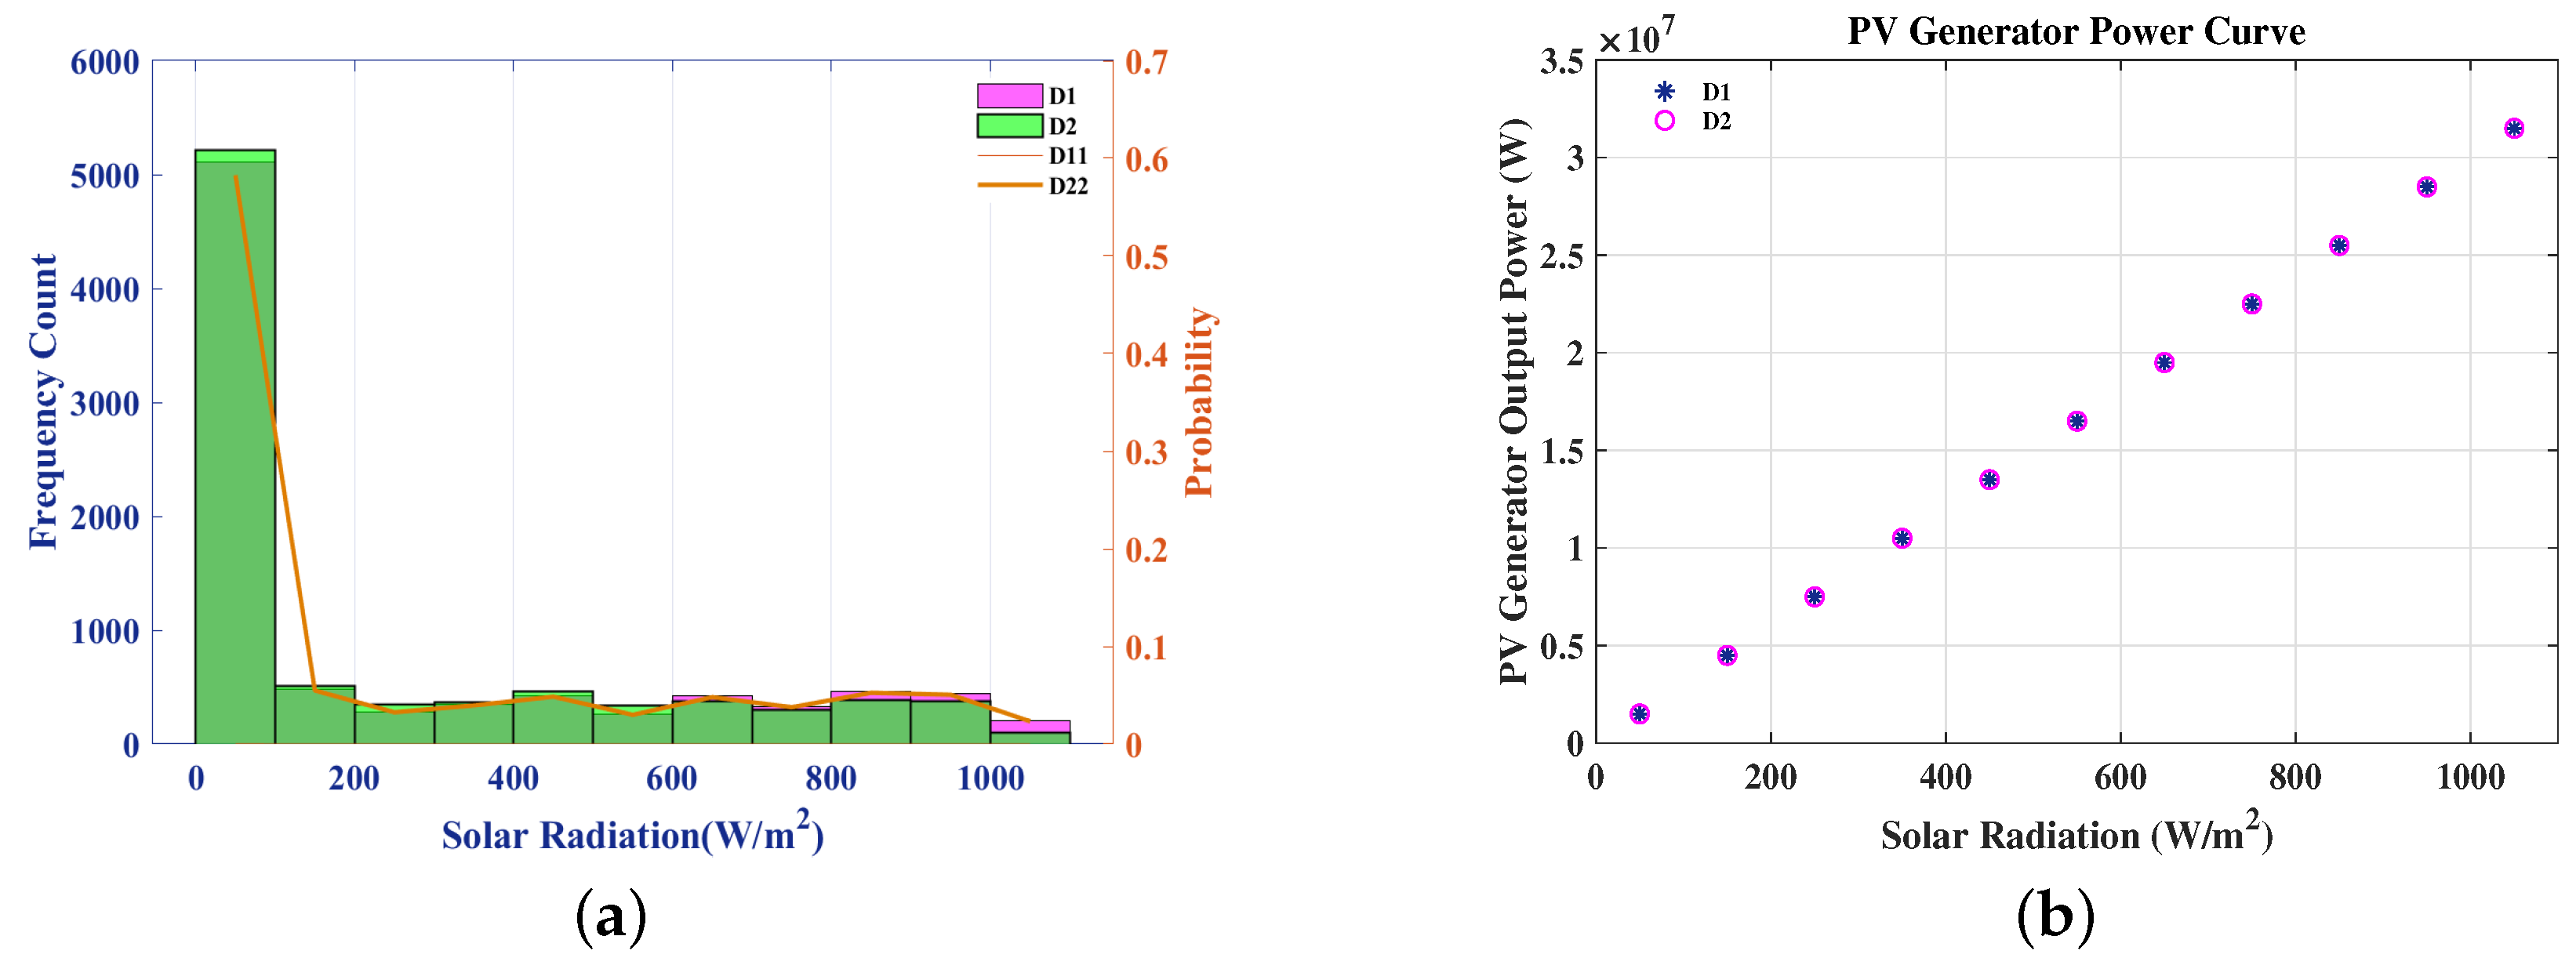
2.2.2. Solar Resource Assessment
2.2.3. Biomass Resource Assessment
3. Configuration and Scheme of Hybrid Systems
4. Problem Formulation
4.1. Physical System Criterion
4.1.1. Wind System Model
4.1.2. PV System Model
4.1.3. Biomass System Model
4.1.4. DG System Model
4.1.5. BESS Model
4.2. Economic System Criterion
4.2.1. Wind System Model
4.2.2. PV System Model
4.2.3. Biomass System Model
4.2.4. DG System Model
4.2.5. BESS System Model
4.3. Environmental Criterion
4.4. Hybrid Systems Reliability Criterion
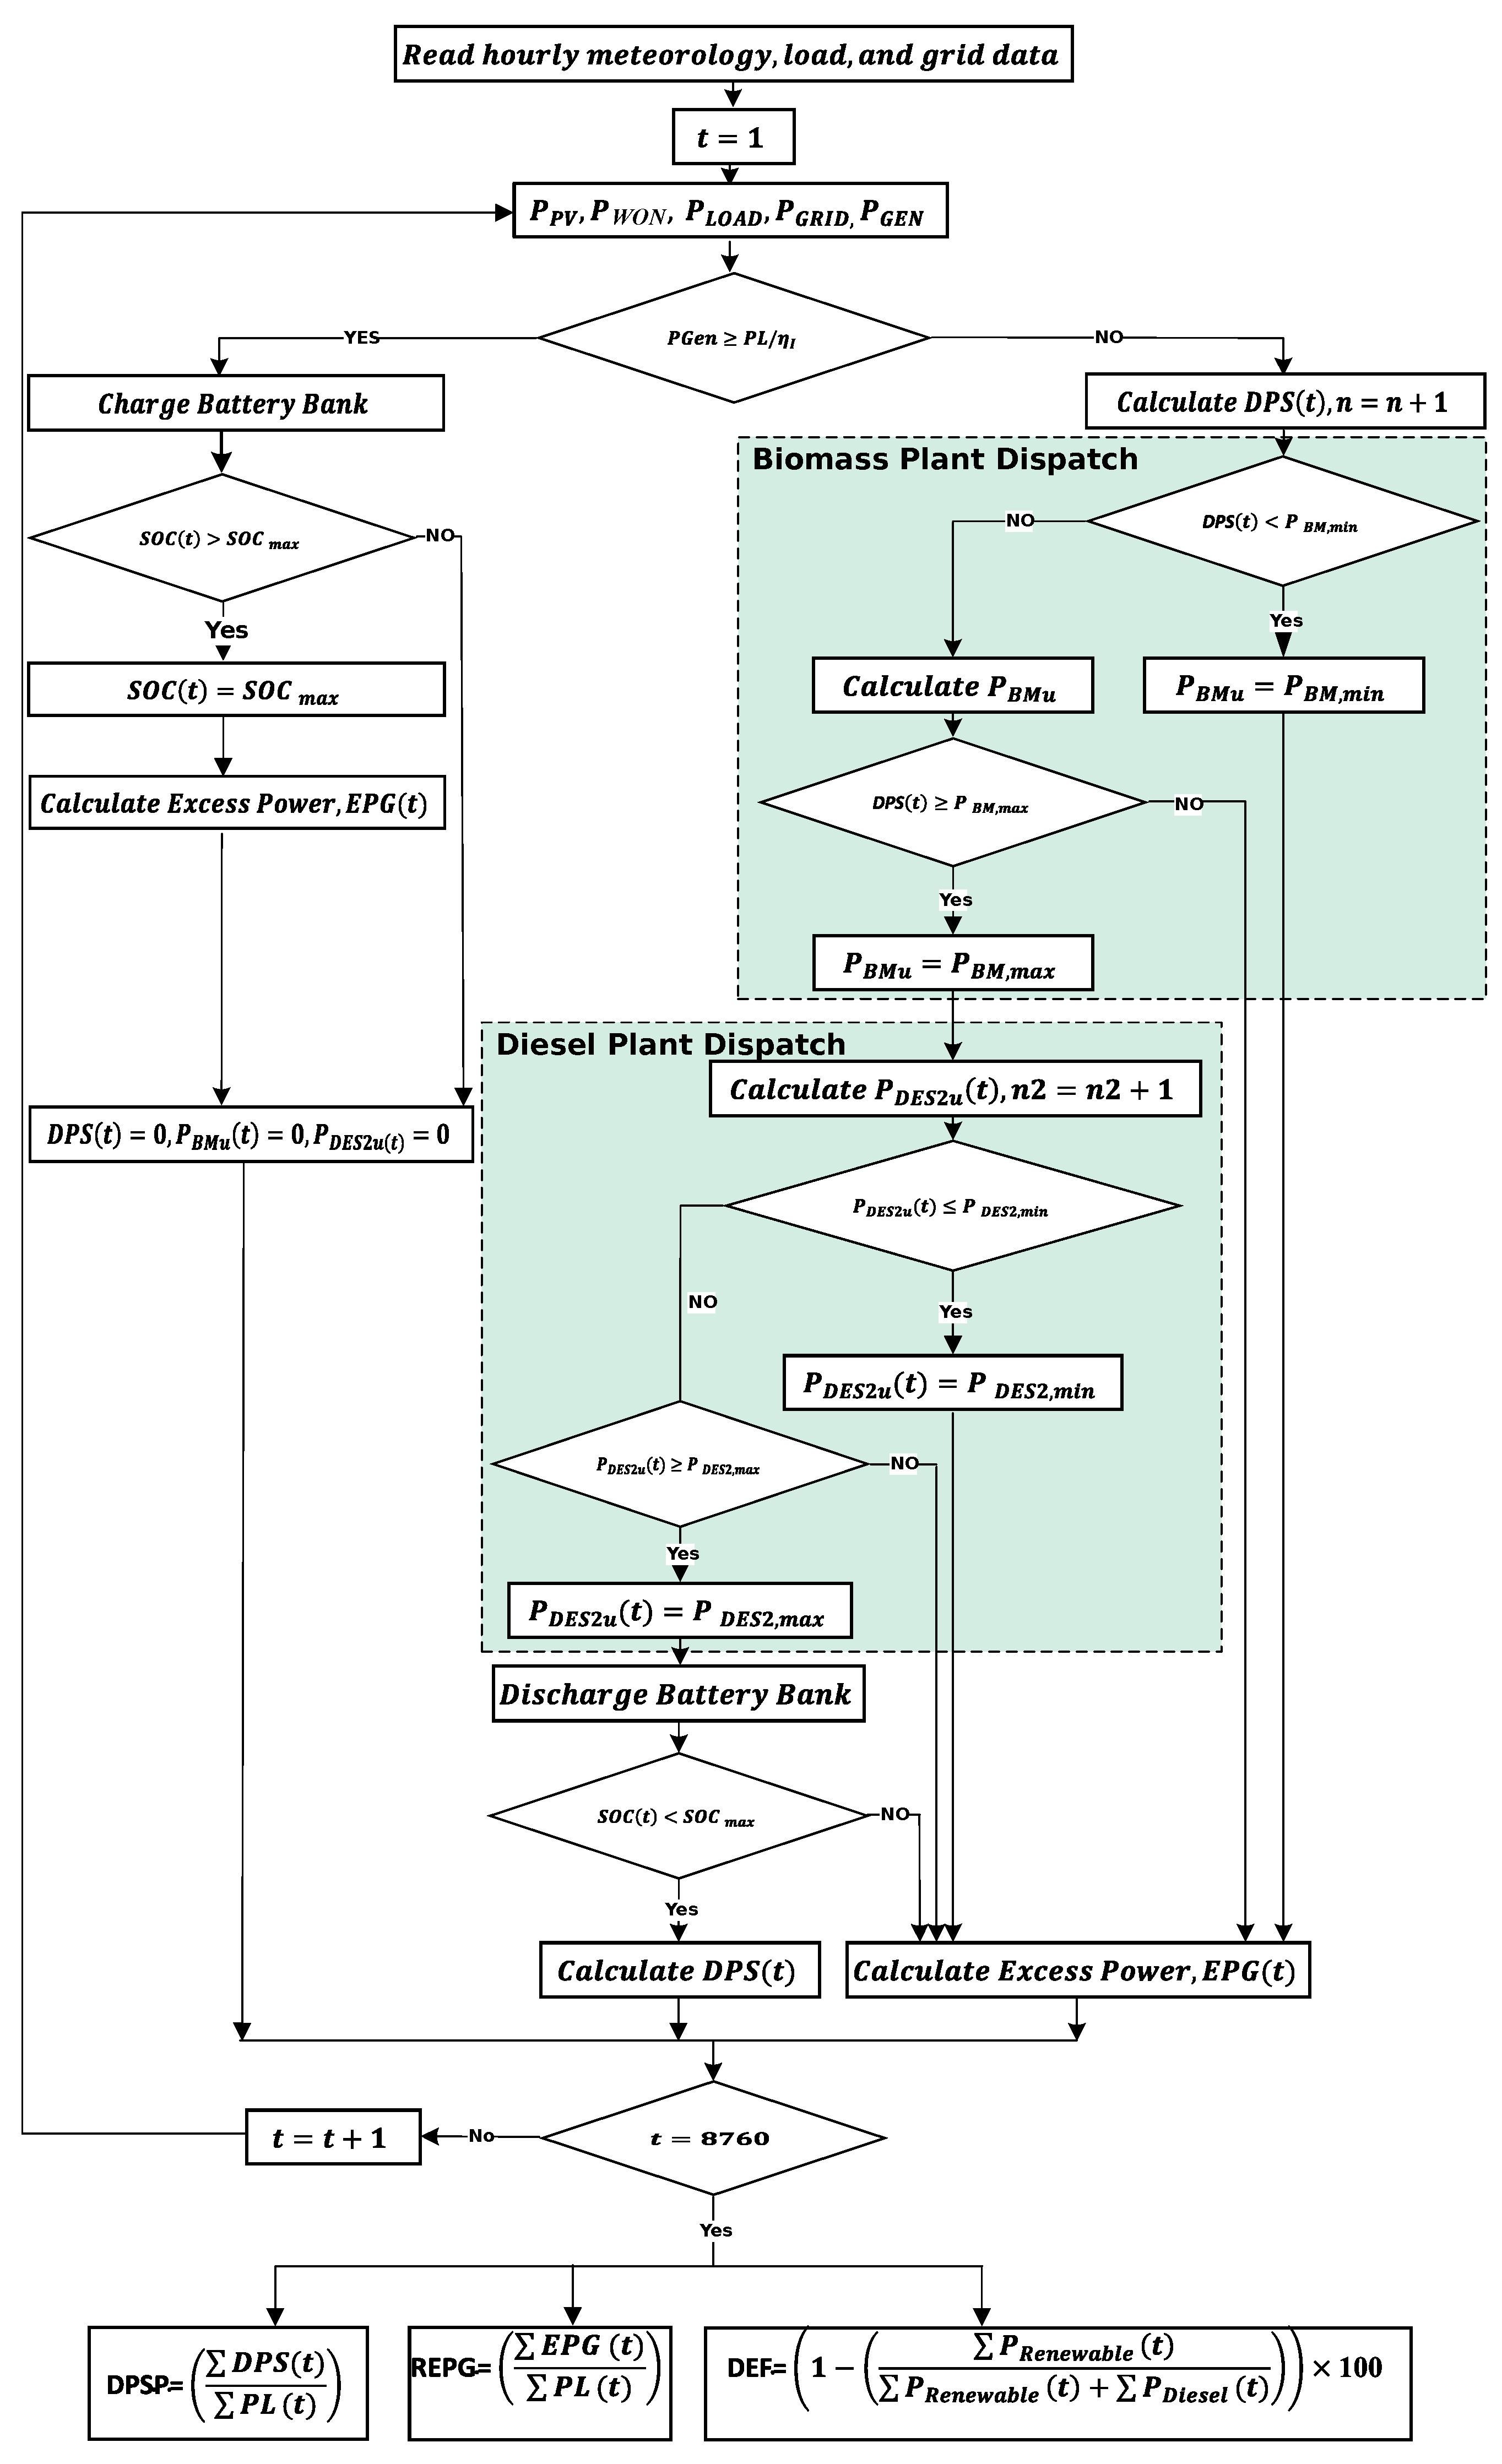
- If the generated power, , from the injected renewables (PV and Wind) is greater than the load demand, , for a given time (t), the excess power is used to charge the battery bank as shown in Equation (19), until the . The new excess power, , is unused.
- If is greater than the energy generated from PV and wind injection, the deficiency of power, , is calculated and biomass power, , is used to meet the deficit until the maximum intended capacity of is obtained. If the deficit is less than the intended minimum injection of biomass , then the capacity of is taken to be . However, if the deficit is greater than the intended maximum biomass power, , then the capacity of biomass power is taken to be . The new deficit is calculated and diesel generation, , is used to meet the deficit. The minimum and maximum diesel generation, and , respectively, are used to constrain the diesel generation in the same manner as described for the biomass injection.
- When the calculated , this implies there is still deficit. In this case the battery bank is discharged according to Equation (20) to satisfy the demand. If the the new deficit, , is calculated. Otherwise, is calculated. The excess and deficient power for any given hour, t, are thus expressed as follows:
4.5. Summary of Objectives
5. Case Study and Discussion of Results
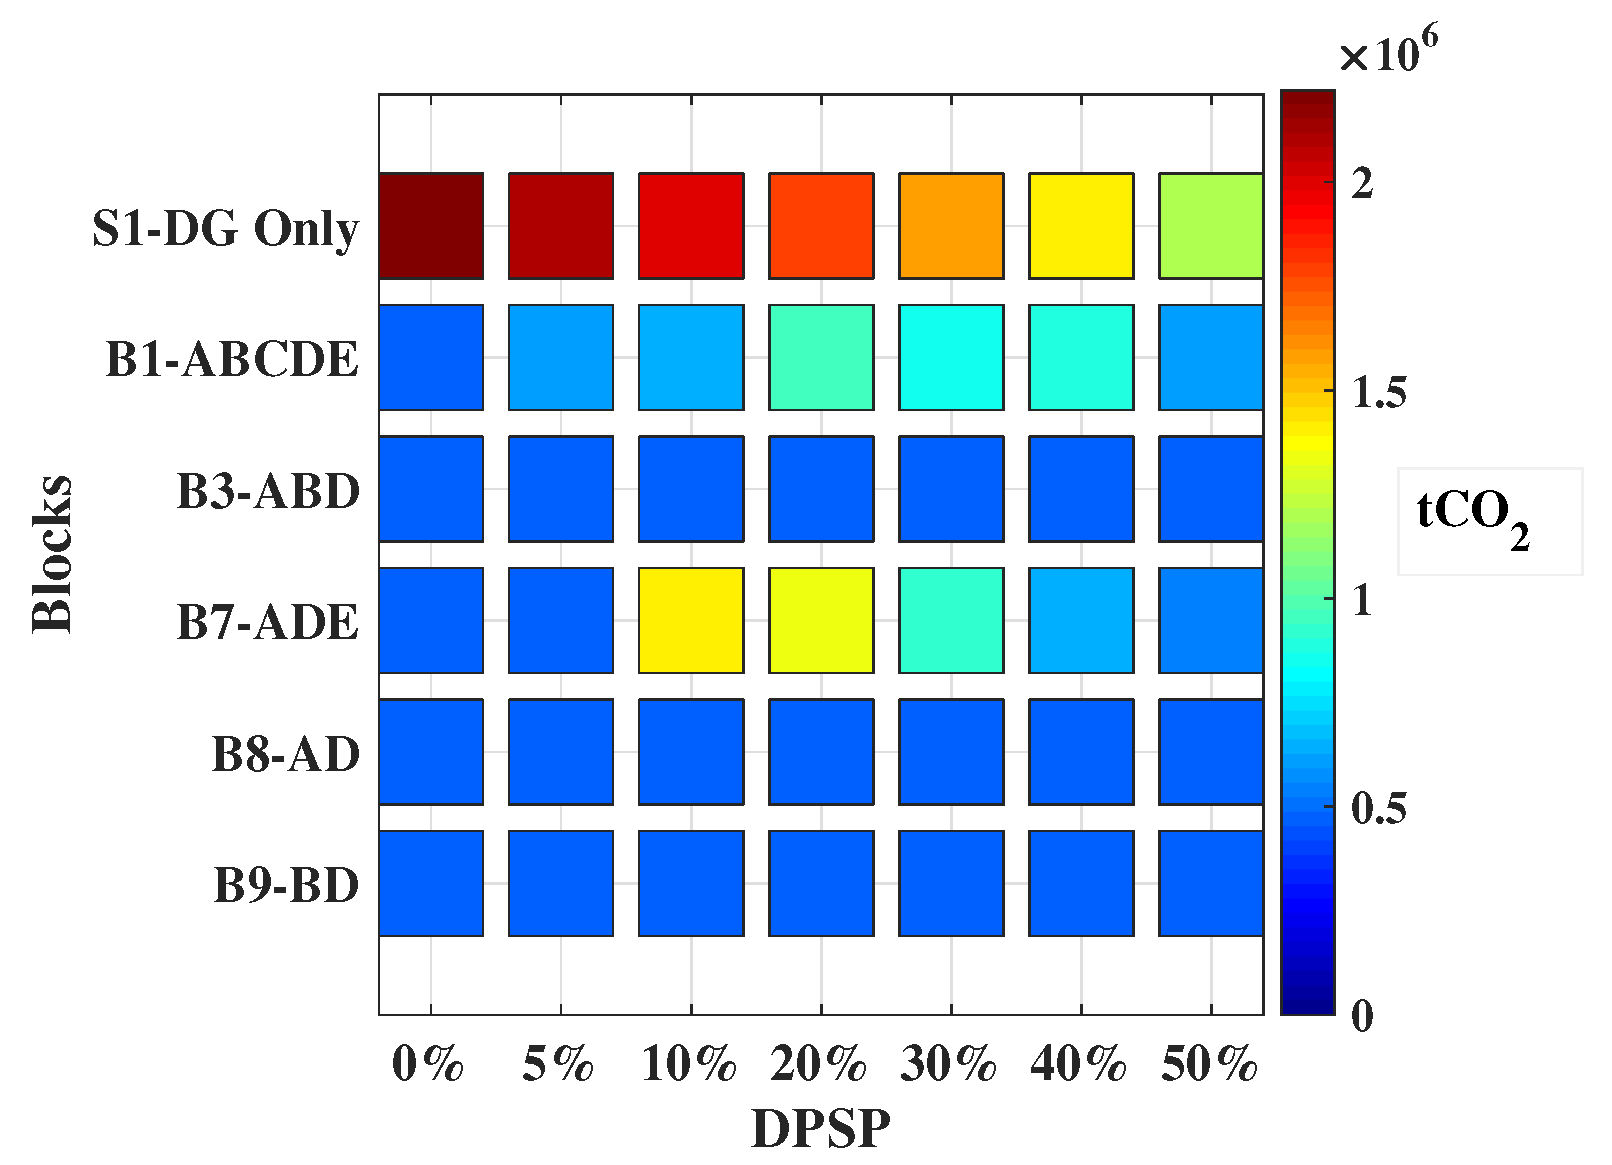
5.1. Annual Avoided CO Emissions on Varying Reliability Options for Each Combination
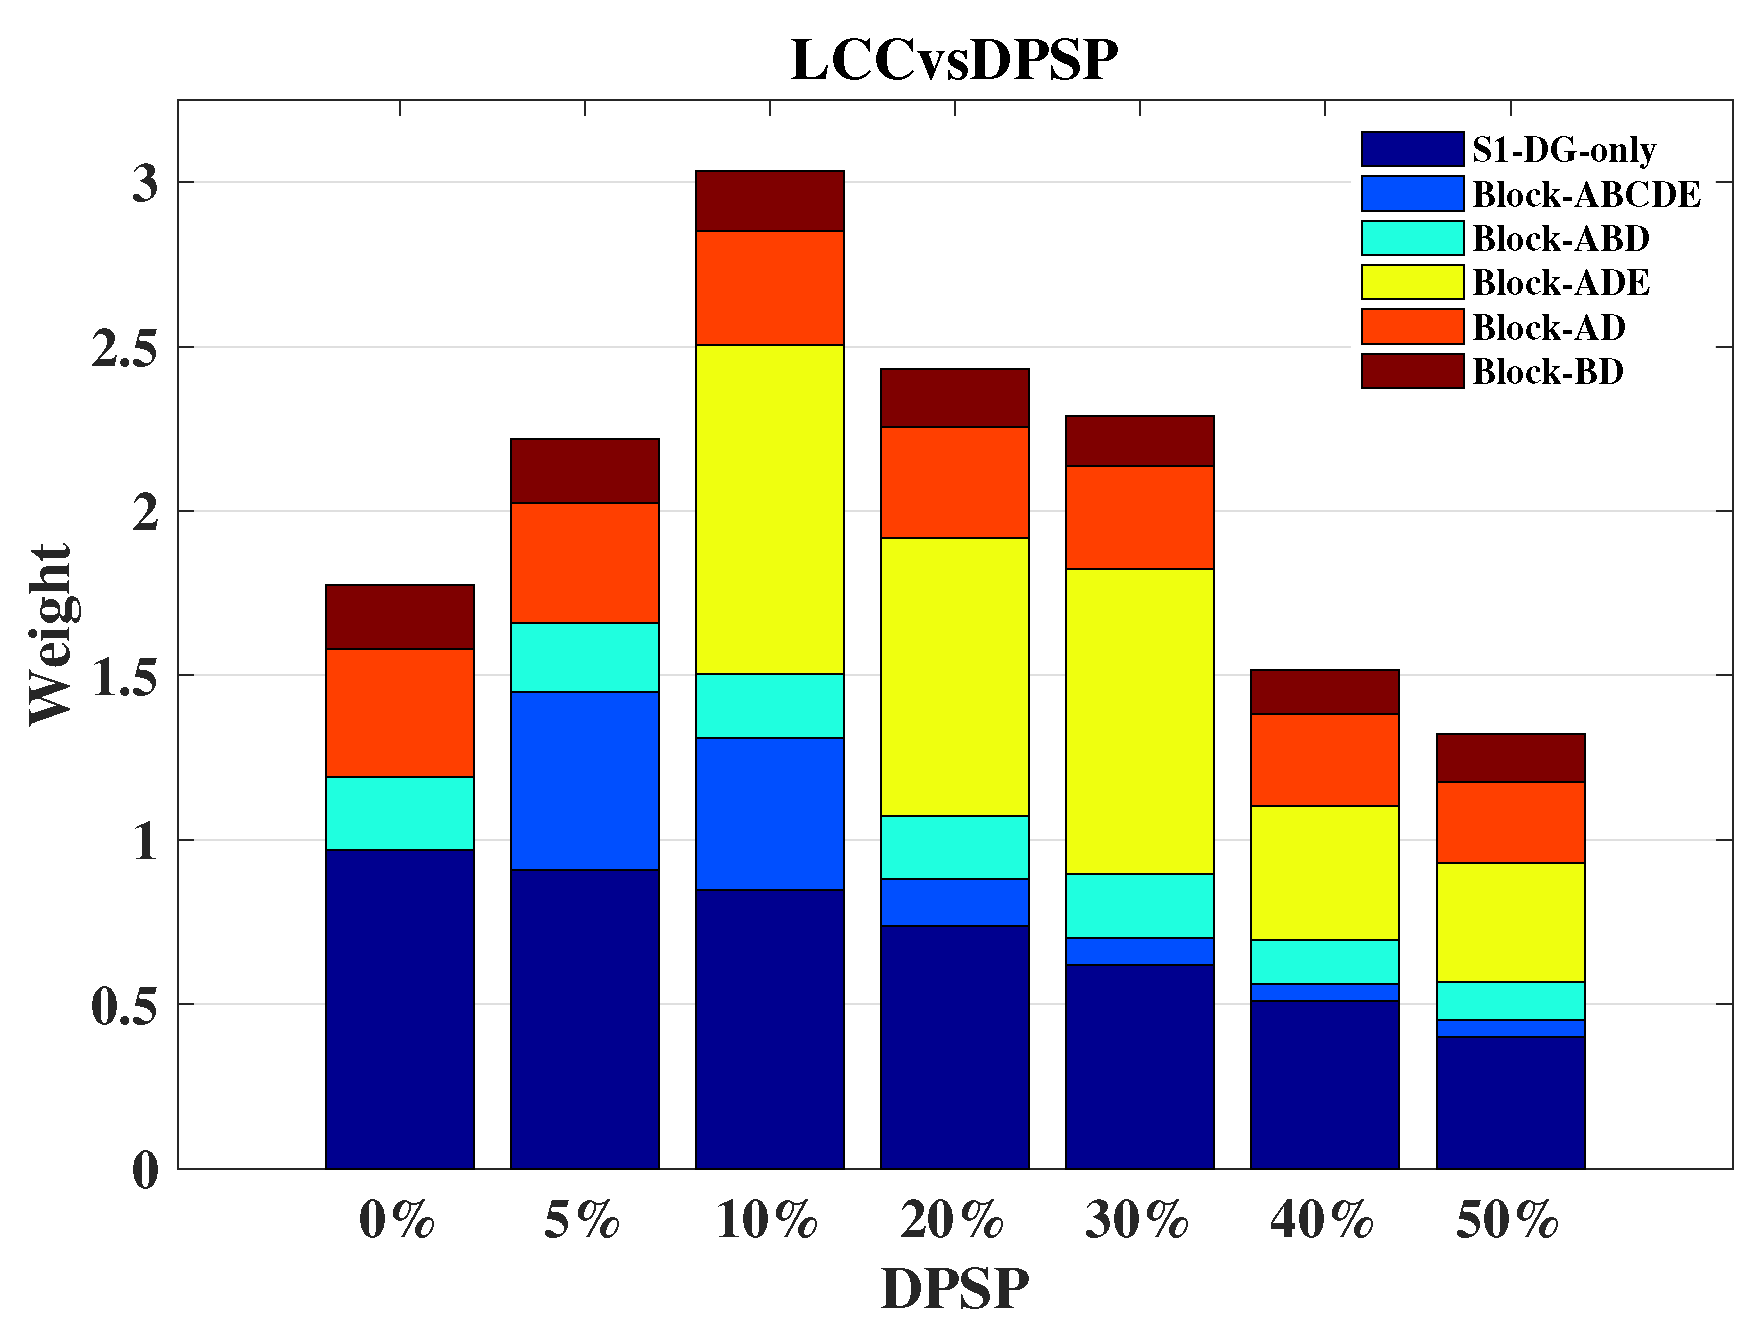
5.2. LCC Outcomes on Varying Reliability Options for Each Combination
6. Conclusions
Author Contributions
Acknowledgments
Conflicts of Interest
Abbreviations
| k | unitless Weibull shape parameter. |
| c | Weibull scale parameter. |
| v | observed wind speed. |
| probability of occurrence. | |
| maximum wind speed. | |
| maximum frequency of wind speed. | |
| air density. | |
| A | swept area. |
| gamma function. | |
| output power of wind tubine. | |
| rated power of turbine. | |
| cut-in wind speed. | |
| rated wind speed. | |
| cut-off wind speed. | |
| average output power of wind turbine. | |
| capacity factor. | |
| generated power from PV panel. | |
| PV generator capacity. | |
| solar radiation data set. | |
| standard solar radiation (1000 W/m). | |
| radiation threshold (180 W/m). | |
| capacity factor of PV. | |
| total number of hours in a year. | |
| mean value of the solar radiation data set. | |
| standard deviation of the solar radiation data set. | |
| amount of sugarcane bagasse (tons) available for energy production. | |
| annual production of sugarcane. | |
| ratio of sugarcane baggase to primary sugarcane. | |
| accessibility coefficient. | |
| harvest coefficient. | |
| unused fraction. | |
| power coefficient. | |
| efficiency of the wind turbine. | |
| total area swept by the wind turbine blades. | |
| wind speed at 100 m hub height. | |
| wind speed at 10 m height. | |
| reference hub height (10 m). | |
| roughness length index. | |
| the total area of PV system. | |
| efficiency of the PV module. | |
| plant capacity of biomass. | |
| net calorific value of baggase. | |
| efficiency of the biomass plant. | |
| T | yearly operating time. |
| diesel generation. | |
| total number of DG units. | |
| minimum plant unit of diesel generator. | |
| state of charge of battery. | |
| hourly self discharge | |
| load demand. | |
| efficiency of inverter. | |
| battery charging efficiency. | |
| battery discharge efficiency. | |
| minimum SOC. | |
| maximum SOC. | |
| depth of discharge. | |
| initial cost of turbine. | |
| captial cost of investment. | |
| net present value of annual operation and maintenance cost of wind turbine. | |
| operation and maintenance cost of wind tubine. | |
| NPV | net present value |
| NPV of the resale price of wind turbine. | |
| resale price. | |
| total cost recovered from resale. | |
| N | total yearly running hours. |
| LCC of wind power system. | |
| NPV of the replacement cost of wind turbine. | |
| total cost of supplying the baggase at the plant site. | |
| cost of baggase. | |
| cost of storage. | |
| cost of loading. | |
| tansport cost. | |
| capital cost of investment of biomass plant. | |
| initial cost of biamass plant. | |
| NPV of the total operation and maintenance cost. | |
| annual growth rate of the BM cost. | |
| annual growth rate of the BM cost. | |
| annual operation and maintenance cost of BM. | |
| NPV of the resale price of biomass plant. | |
| total cost recovered from resale. | |
| initial cost of biomass plant. | |
| life cylce cost of biomass power plant. | |
| NPV of the total operation and maintenance cost of biomass plant. | |
| NPV of the replacement cost of biomass plant. | |
| capital cost of the DG power plant. | |
| initial cost of DG. | |
| NPV of the total operation and maintenance cost of DG. | |
| operation and maintenance cost of DG. | |
| annual growth rate of the DG cost. | |
| NPV of the resale price of DG. | |
| total resale price of DG at the end of the project life. | |
| initial cost of DG plant. | |
| life cylce cost of DG. | |
| capital cost of investment of DG. | |
| NPV of the total operation and maintenance cost of DG. | |
| replacement cost of DG. | |
| captial cost of battery system. | |
| initial cost of battery system. | |
| nominal capacity of battery. | |
| replacement cost of battery. | |
| initial cost of battery. | |
| life cylce cost of battery. | |
| capital cost of investment of battery. | |
| NPV of the total operation and maintenance cost of battery. | |
| NPV of the resale price of battery energy storage. | |
| the total renewable generation. | |
| quantity of the ith fuel burnt annually. | |
| weighted average emission factor of the ith fuel. | |
| weighted average net calorific value. | |
| weighted average CO emissions factor. | |
| Avoided amount of CO emission. | |
| reference emissions. | |
| block emissions. | |
| new excess power. | |
| generated electric power. | |
| deficiency of power. | |
| MOPSO | multi-objective particle swarm optimization. |
| DG | diesel generator. |
| DEF | diesel energy fraction. |
| DPSP | defficiency of power supply probability. |
| LCC | life cycle cost. |
| PV | photovoltaic. |
| RDG | renewable distributed generator. |
| GHG | green house gas emissions. |
| GA | genetic algorithm. |
| PSO | particle swarm optimization. |
| RET | renewable energy technology. |
| CFB | circulating fluidized bed. |
| WAPP | west african power pool. |
| AfDB | african development bank. |
| GHI | global horizontal irradiance. |
| SSA | sub-saharan africa. |
| HFO | heavy fuel oil. |
| DO | diesel oil. |
Appendix A

| Fuel Consumption for Existing DG units Considered | |||
|---|---|---|---|
| DG unit | Fuel Operation | Number of Units | Consumption (l/h) |
| A | Diesel Oil | 20 | 240 |
| B1 | Diesel Oil | 3 | 350 |
| B2 | Diesel Oil | 5 | 240 |
| K | Heavy Fuel oil | 2 | 700 |
| Diesel Oil | 620 | ||
| L | Heavy Fuel oil | 3 | 470 |
| Diesel Oil | 430 | ||
| N1 and N2 | Heavy Fuel oil | 2 | 1024 |
| Diesel Oil | 981 | ||
| W1 and W2 | Heavy Fuel oil | 2 | 1300 |
| Diesel Oil | 1230 | ||
| M | Diesel Oil | 2 | 300 |
| LO | Diesel Oil | 1 | 300 |
| MA | Diesel Oil | 1 | 240 |
| Physical and Environmental Parameters | |||
|---|---|---|---|
| Technology Type | Variable | Notation | Value |
| Wind Turbine GAMESA G128-5.0 MW/G132-5.0 MW | Rated Power | (kW) | 5000 |
| Cut-in speed | (m/s) | 1.5 | |
| Rated Speed | (m/s) | 13 | |
| Cut-off speed | 27 | ||
| H (m) | 100 | ||
| Wind Turbine lifetime | 20 | ||
| PV Panel Sun Power X Series | Maximum Power | (W) | 360 |
| Efficiency of Panel | 22.2 | ||
| Area of PV panel | (m) | 1.63 | |
| PV lifetime | 20 | ||
| Biomass CFB Combustion Plant | Net calorific value of Baggase | (MJ/Kg) | 16 |
| Baggase Emissions Factor | (mmBtu/kg) | 0.0161 | |
| Efficiency of Plant | 0.42 | ||
| Lifetime of Biomass plant | 20 | ||
| Diesel Generator (DG) Nigatta Dual Fuel Diesel Plant | Unit Plant Capacity | 10,000 | |
| Lifetime of DG plant | 20 | ||
| Net calorific value of Heavy Fuel Oil (HFO) | (mmBtu/gal) | 0.15 | |
| Net calorific value of Diesel Oil (DO) | (mmBtu/gal) | 0.148 | |
| HFO Emissions Factor | (kgCO/mmBtu) | 75.1 | |
| DO Emissions Factor | (kgCO/mmBtu) | 74.92 | |
| Battery Bank Lithium Ion | Hourly Self Discharge | 0 | |
| Battery charging efficiency | 0.9 | ||
| Battery Discharging efficiency | 0.9 | ||
| Nominal Capacity of Battery (kWh) | 1200 | ||
| Lifetime of Battery Bank | 10 | ||
| Economic Parameters | |||
| Project lifetime | N | 20 | |
| Interest rate | i (%) | 10 | |
| Inflation rate | (%) | 4 | |
| Escalation rate | (%) | 5 | |
| Inverter efficiency | (%) | 90 | |
| Wind Turbine | Capital cost of Wind Turbine | ($/m | 544 |
| Yearly Operations and Maintenance Cost | 1.5 | ||
| Reselling Price | 30 | ||
| PV Panel | Capital cost of PV Panel | ($/kW) | 519.7 |
| Yearly Operations and Maintenance Cost | 1 | ||
| Reselling Price | 25 | ||
| Biomass Plant | Capital cost of Biomass Plant | ($/kW) | 1440 |
| Cost of Bagasse | ($/ton) | 25 | |
| Cost of Storage | ($/ton) | 12 | |
| Cost of loading | ($/ton) | 5 | |
| Cost of Transportation | ($/ton/km) | 0.057 | |
| Yearly Operations and Maintenance Cost | 0.017 | ||
| Reselling Price | 30 | ||
| Diesel Generator | Capital cost of DG plant | ($/kW) | 1000 |
| Cost of HFO | ($/litre) | 0.45 | |
| Cost of DO | ($/litre) | 0.607 | |
| HFO Consumption | (litre/hour) | 1024 | |
| DO Consumption | (litre/hour) | 981 | |
| Yearly Operations and Maintenance Cost | ($/kWh) | 0.032 | |
| Reselling Price | 30 | ||
| Battery Bank | Capital Cost of Battery | ($/kW) | 283 |
| Replacement Cost | - | ||

References
- Lee, J.T.; Callaway, D.S. The cost of reliability in decentralized solar power systems in sub-Saharan Africa. Nat. Energy 2018, 3, 960–968. [Google Scholar] [CrossRef]
- Special Report: Energy Access Outlook; International Energy Agency: France, 2017; Available online: http://www.iea.org (accessed on 10 August 2018).
- Sierra Leone Unemployment Rate. The Statistics Portal. Available online: https://www.statista.com (accessed on 30 August 2018).
- Sierra Leone Sustainable Energy For All (SE4ALL) Country Action Agenda: Sustainable Energy For All. 30 July 2015. Available online: https://www.se4all-africa.org (accessed on 30 August 2018 ).
- Tolba, M.; Rezk, H.; Tulsky, V.; Diab, A.; Abdelaziz, A.; Vanin, A. Impact of Optimum Allocation of Renewable Distributed Generations on Distribution Networks Based on Different Optimization Algorithms. Energies 2018, 11, 245. [Google Scholar] [CrossRef]
- González, A.; Riba, J.R.; Rius, A. Optimal Sizing of a Hybrid Grid-Connected Photovoltaic–Wind–Biomass Power System. Sustainability 2015, 7, 12787–12806. [Google Scholar] [CrossRef]
- Nižetić, S.; Papadopoulos, A.; Tina, G.; Rosa-Clot, M. Hybrid energy scenarios for residential applications based on the heat pump split air-conditioning units for operation in the Mediterranean climate conditions. Energy Build. 2017, 140, 110–120. [Google Scholar] [CrossRef]
- Vishnupriyan, J.; Manoharan, P. Multi-criteria decision analysis for renewable energy integration: A southern India focus. Renew. Energy 2018, 121, 474–488. [Google Scholar] [CrossRef]
- Theodorou, S.; Florides, G.; Tassou, S. The use of multiple criteria decision making methodologies for the promotion of RES through funding schemes in Cyprus, A review. Energy Policy 2010, 38, 7783–7792. [Google Scholar] [CrossRef]
- Usman, M.; Khan, M.T.; Rana, A.S.; Ali, S. Techno-economic analysis of hybrid solar-diesel-grid connected power generation system. J. Electr. Syst. Inf. Technol. 2018, 5, 653–662. [Google Scholar] [CrossRef]
- Saiprasad, N.; Kalam, A.; Zayegh, A. Techno-economic and environmental analysis of hybrid energy systems for a university in Australia. Aust. J. Electr. Electron. Eng. 2018, 15, 168–174. [Google Scholar] [CrossRef]
- Alharthi, Y.Z.; Siddiki, M.K.; Chaudhry, G.M. Resource Assessment and echno-Economic Analysis of a Grid-Connected Solar PV-Wind Hybrid System for Different Locations in Saudi Arabia. Sustainability 2018, 10, 3690. [Google Scholar] [CrossRef]
- Adaramola, M.; Oyewola, O.; Paul, S. Technical and Economic Assessment of Hybrid Energy Systems in South-West Nigeria. Energy Explor. Exploit. 2012, 30, 533–551. [Google Scholar] [CrossRef]
- Barakat, S.; Samy, M.; Eteiba, M.; Wahba, W. Feasibility Study of Grid Connected PV-Biomass Integrated Energy System in Egypt. Int. J. Emerg. Electr. Power Syst. 2016, 17. [Google Scholar] [CrossRef]
- Eichman, J.; Mueller, F.; Tarroja, B.; Smith Schell, L.; Samuelsen, S. Exploration of the integration of renewable resources into California’s electric system using the Holistic Grid Resource Integration and Deployment (HiGRID) tool. Energy 2013, 50, 353–363. [Google Scholar] [CrossRef]
- Yimen, N.; Hamandjoda, O.; Meva’a, L.; Ndzana, B.; Nganhou, J. Analyzing of a Photovoltaic/Wind/Biogas/Pumped-Hydro Off-Grid Hybrid System for Rural Electrification in Sub-Saharan Africa—Case Study of Djoundé in Northern Cameroon. Energies 2018, 11, 2644. [Google Scholar] [CrossRef]
- Ou, T.C.; Hong, C.M. Dynamic operation and control of microgrid hybrid power systems. Energy 2014, 66, 314–323. [Google Scholar] [CrossRef]
- Ismail, M.; Moghavvemi, M.; Mahlia, T. Genetic algorithm based optimization on modeling and design of hybrid renewable energy systems. Energy Convers. Manag. 2014, 85, 120–130. [Google Scholar] [CrossRef]
- Robles Rodriguez, C.; Bideaux, C.; Guillouet, S.; Gorret, N.; Roux, G.; Molina-Jouve, C.; Aceves-Lara, C. Multi-objective particle swarm optimization (MOPSO) of lipid accumulation in Fed-batch cultures. In Proceedings of the 2016 24th Mediterranean Conference on Control and Automation (MED), Athens, Greece, 21–24 June 2016; pp. 979–984. [Google Scholar] [CrossRef]
- Comparison of Three Evolutionary Algorithms: GA, PSO, adn DE. Ind. Eng. Manag. Syst. 2012, 11, 215–223. [CrossRef]
- Ting Li, B.Y. A Review of Multi-objective Particle Swarm Optimization Algorithms in Power System Economic Dispatch. Int. J. Simul. Syst. Sci. Technol. 2016, 17, 1–5. [Google Scholar] [CrossRef]
- Theo, W.L.; Lim, J.S.; Ho, W.S.; Hashim, H.; Lee, C.T. Review of distributed generation (DG) system planning and optimisation techniques: Comparison of numerical and mathematical modelling methods. Renew. Sustain. Energy Rev. 2017, 67, 531–573. [Google Scholar] [CrossRef]
- Adewuyi, O.B.; Shigenobu, R.; Senjyu, T.; Lotfy, M.E.; Howlader, A.M. Multiobjective mix generation planning considering utility-scale solar PV system and voltage stability: Nigerian case study. Electr. Power Syst. Res. 2019, 168, 269–282. [Google Scholar] [CrossRef]
- Konneh, D.A.; Lotfy, M.E.; Shigenobu, R.; Senjyu, T. Optimal Sizing of Grid-connected Renewable Energy System in Freetown Sierra Leone. IFAC-PapersOnLine 2018, 51, 191–196. [Google Scholar] [CrossRef]
- Knight, O. Assessing and Mapping Renewable Energy Resources; World Bank: Washington, DC, USA; Available online: http://www.esmap.org (accessed on 15 September 2018).
- Hermann, S.; Miketa, A.; Fichaux, N.F. Estimating the Renewable Energy Potential in Africa; International Renewable Energy Agency: Abu Dhabi, UAE, 2014; Available online: http://www.irena.org (accessed on 20 September 2018).
- Løken, E. Use of multicriteria decision analysis methods for energy planning problems. Renew. Sustain. Energy Rev. 2007, 11, 1584–1595. [Google Scholar] [CrossRef]
- Wang, J.J.; Jing, Y.Y.; Zhang, C.F.; Zhao, J.H. Review on multi-criteria decision analysis aid in sustainable energy decision-making. Renew. Sustain. Energy Rev. 2009, 13, 2263–2278. [Google Scholar] [CrossRef]
- Fischer, R.; Lopez, J.; Suh, S. Barriers and Drivers to Renewable Energy Investment in Sub-Saharan Africa. J. Environ. Investig. 2011, 2, 54–80. [Google Scholar]
- A Framework for Transforming Africa towards a Renewable Energy Powered Future With Access for All. Africa Renewable Energy Initiative (AREI), 2015. Available online: https://www.arei.org (accessed on 10 October 2018).
- Arslan, T.; Bulut, Y.M.; Altın Yavuz, A. Comparative study of numerical methods for determining Weibull parameters for wind energy potential. Renew. Sustain. Energy Rev. 2014, 40, 820–825. [Google Scholar] [CrossRef]
- Lee, N.; Roberts, B. Technical Potential Assessment for the Renewable Energy Zone (REZ) Process: A GIS-Based Approach; National Renewable Energy Laboratory; United State Department of Energy: USA, 2018. Available online: https://www.nrel.gov/docs/fy18osti/71004.pdf (accessed on 15 October 2018).
- Dorji, G. Environmental Aspect of Electric Energy Generation; Available online: https://www.researchgate.net/publication/296672956_Environmental_aspect_of_electric_energy_generation (accessed on 23 February 2019).
- Glenting, C.; Jakobsen, N. Converting Biomass to Energy: A Guide for Developers and Investors (English); World Bank Group: Washington, DC, USA, 2017; Available online: http://documents.worldbank.org (accessed on 20 October 2018).
- Brown, A.; Simone Landolina, E.M.; Sung, J. The Clean Energy Technology Assessment Methodology: International Energy Agency Laboratory; OECD/IEA: Paris, France, 2016; Available online: https://www.iea.org (accessed on 25 October 2018).
- Economic and Financial Analysis Tools: National Renewable Energy Laboratory. Available online: https://www.nrel.gov/analysis/economic-financial-tools.html (accessed on 25 October 2018).
- BCS. Mining Industry Energy Bandwidth Study. 2007. Available online: https://www.energy.gov/eere/amo/ downloads/ us-mining-industry-energy-bandwidth-study (accessed on 27 October 2018).
- Sierra Rutile Limited. Ruidow Conference 2016. 2016. Available online: https://sierrarutile.iluka.com/reports (accessed on 27 October 2018).
- Project Appraisal Document; World Bank Group; Report No: 103305-SL; 2016; Available online: https://www.worldbank.org (accessed on 25 October 2018).
- Ministry of Energy Progress Report; Government of Sierra Leone, 2017. Available online: https://www.energy.gov.sl/wp-content/uploads/.../ProgressReportMoE.pdf (accessed on 25 October 2018).
- Asami Miketa (IRENA), Bruno Merven (Energy Research Center). West African Power Pool: Planning and Prospects for Renewable Energy. 2013. Available online: https://www.irena.org (accessed on 25 October 2018).
- Estimating the Renewable Energy Potential in Africa: A GIS-Based Approach. 2014. Available online: https://www.irena.org (accessed on 31 October 2018).
- Akdağ, S.A.; Dinler, A. A new method to estimate Weibull parameters for wind energy applications. Energy Convers. Manag. 2009, 50, 1761–1766. [Google Scholar] [CrossRef]
- Ajayi, O.O.; Fagbenle, R.O.; Katende, J.; Ndambuki, J.M.; Omole, D.O.; Badejo, A.A. Wind Energy Study and Energy Cost of Wind Electricity Generation in Nigeria: Past and Recent Results and a Case Study for South West Nigeria. Energies 2014, 7, 8508–8534. [Google Scholar] [CrossRef]
- Obando Montaño, A. An Approach to Determine the Weibull Parameters for Wind Energy Analysis: The Case of Galicia (Spain). Energies 2014, 7, 2676–2700. [Google Scholar]
- Keyhani, A.; Ghasemi-Varnamkhasti, M.; Khanali, M.; Abbaszadeh, R. An assessment of wind energy potential as a power generation source in the capital of Iran, Tehran. Energy 2010, 35, 188–201. [Google Scholar] [CrossRef]
- Caballero, F.; Sauma, E.; Yanine, F. Business optimal design of a grid-connected hybrid PV (photovoltaic)-wind energy system without energy storage for an Easter Island’s block. Energy 2013, 61, 248–261. [Google Scholar] [CrossRef]
- National Renewable Energy Laboratory New Transparent Cost Data Base. Available online: https://openei.org/apps/TCDB/#blank (accessed on 3 November 2018).
- Abreu, E.F.; Canhoto, P.; Prior, V.; Melicio, R. Solar resource assessment through long-term statistical analysis and typical data generation with different time resolutions using GHI measurements. Renew. Energy 2018, 127, 398–411. [Google Scholar] [CrossRef]
- Zawilska, E.; Brooks, M. An assessment of the solar resource for Durban, South Africa. Renew. Energy 2011, 36, 3433–3438. [Google Scholar] [CrossRef]
- US Energy Information Administration: Today in Energy. 2015. Available online: https://www.eia.gov/todayinenergy/detail.php?id=22832 (accessed on 5 November 2018).
- Global Solar Atlas. Available online: https://www.globalsolaratlas.info/ (accessed on 10 November 2018).
- Fischer, G.; Prieler, S.; Velthuizen, H.; Lensink, S.M.; Londo, M.; de Wit, M. Biofuel production potentials in Europe: Sustainable use of cultivated land and pastures. Part I: Land productivity potentials. Biomass Bioenergy 2010, 34, 159–172. [Google Scholar] [CrossRef]
- Renewable Energy Cost Analysis—Biomass for Power Generation. 2012. Available online: https://www.irena.org (accessed on 12 November 2018).
- Silva, D.A.L.; Delai, I.; Montes, M.L.D.; Ometto, A.R. Life cycle assessment of the sugarcane bagasse electricity generation in Brazil. Renew. Sustain. Energy Rev. 2014, 32, 532–547. [Google Scholar] [CrossRef]
- Magbity, I. Prospect of Bio-fuels in Sierra Leone. Available online: https://www.grin.com/ (accessed on 10 November 2018).
- Sierra Leone: Sugar Cane, Production Quantity. Available online: http://www.factfish.com (accessed on 12 November 2018).
- Mohamad Izdin Hlal, A.; Ramachandaramurthya, K.V.; Sanjeevikumar, P.; Pouryekta, A.; Hamid Reza Kaboli, C.; Tuan Ab Rashid Bin Tuan Abdullah, D. NSGA-II and MOPSO based optimization for sizing of hybrid PV/wind/ battery energy storage system. Int. J. Power Electron. Drive Syst. 2019, 10, 463–478. [Google Scholar] [CrossRef]
- González, A.; Riba, J.R.; Rius, A.; Puig, R. Optimal sizing of a hybrid grid-connected photovoltaic and wind power system. Appl. Energy 2015, 154, 752–762. [Google Scholar] [CrossRef]
- Singh, J.; Chauhan, A. Assessment of biomass resources for decentralized power generation in Punjab. Int. J. Appl. Eng. Res. 2014, 9, 869–876. [Google Scholar]
- Kawashima, A.; Morais, M.; Martins, L.; Guerrero, V.; Abou Rafee, S.; Capucim, M.; Martins, J. Estimates and Spatial Distribution of Emissions from Sugar Cane Bagasse Fired Thermal Power Plants in Brazil. J. Geosci. Environ. Prot. 2015, 3, 72–76. [Google Scholar] [CrossRef]
- Electricity Storage and Renewables (2017): Costs and Markets to 2030. Available online: https://www.irena.org (accessed on 10 November 2018).
- Cost estimates for Thermal Peaking Plants (2008): Parsons Brinckerhoff New Zealand Ltd. Available online: https://www.electricitycommission.govt.nz (accessed on 12 November 2018).
- Emission Factors for Greenhouse Gas Inventories (2018): Parsons Brinckerhoff New Zealand Ltd. Available online: https://www.epa.gov (accessed on 15 November 2018).
- CO2 Emission Factors for Fossil Fuels. Available online: https://www.umweltbundesamt.de/en/publikationen/co2-emission-factors-for-fossil-fuels (accessed on 15 November 2018).
- Khiareddine, A.; Ben Salah, C.; Rekioua, D.; Mimouni, M. Sizing methodology for hybrid photovoltaic /wind/hydrogen/battery integrated to energy management strategy for pumping system. Energy 2018, 153, 743–762. [Google Scholar] [CrossRef]
- Daniel, M.; Kammen, K.K.; Fripp, M. Putting Renewables to Work: How Many Jobs Can the Clean Energy Industry Generate? Energy Policy 2010, 38, 919–931. [Google Scholar]
- Singh, V.; Fehrs, J. The Work That Goes Into Renewable Energy. 2001. Available online: http://www.globalurban.org (accessed on 5 August 2018).


| No. | Source | Capacity (MW) | Location |
|---|---|---|---|
| Existing Sources | |||
| 1 | Bumbuna Hydro | 50 | Bumbuna |
| 2 | Goma Hydro | 6 | Kenema |
| 3 | Charlotte Hydro | 2 | Western Area |
| 4 | Bankasoka Hydro | 2 | Port Loko |
| 5 | Diesel (Goverment) | 27.6 | Western Area |
| 6 | Diesel (Goverment) | 26.7 | Provincial |
| 7 | Diesel (IPP1) | 20 | Western Area |
| 8 | Diesel (IPP3) | 4.8 | Provincial |
| 9 | Addax Bio-energy | 15 | Makeni(Low availability) |
| 10 | Total Diesel | 139.1 | |
| 11 | Total Hydro | 60 | |
| 12 | Total Biomass | 15 | |
| 13 | Total Generation | 154.1 | |
| Projected National Mining Power Demand [MW] (Approximated) | |||
| 1 | Sierra Rutile | 23(15) | Moyamba |
| 2 | Octea mining | 8 | Kono |
| 3 | London Mining | 50 | Marampa |
| 4 | Stella Diamonds | 3 | Tongo |
| 5 | African minerals/Shandong Iron and steel group | 20 (150 PhaseII) | Tonkolili |
| 6 | Gold Mining and Others | 20 | Various locations |
| 7 | Total Expected Generation | 296 | |
| Research Scope [MW] | |||
| 2 | Approximated Industrial Demand | 380 | |
| 3 | Approximated Commercial Demand | 150 | |
| 4 | Approximated Domestic Demand | 120 | |
| Weibull Distribution Parameters | ||||
|---|---|---|---|---|
| Location | c | k | PD (W/m) | CF |
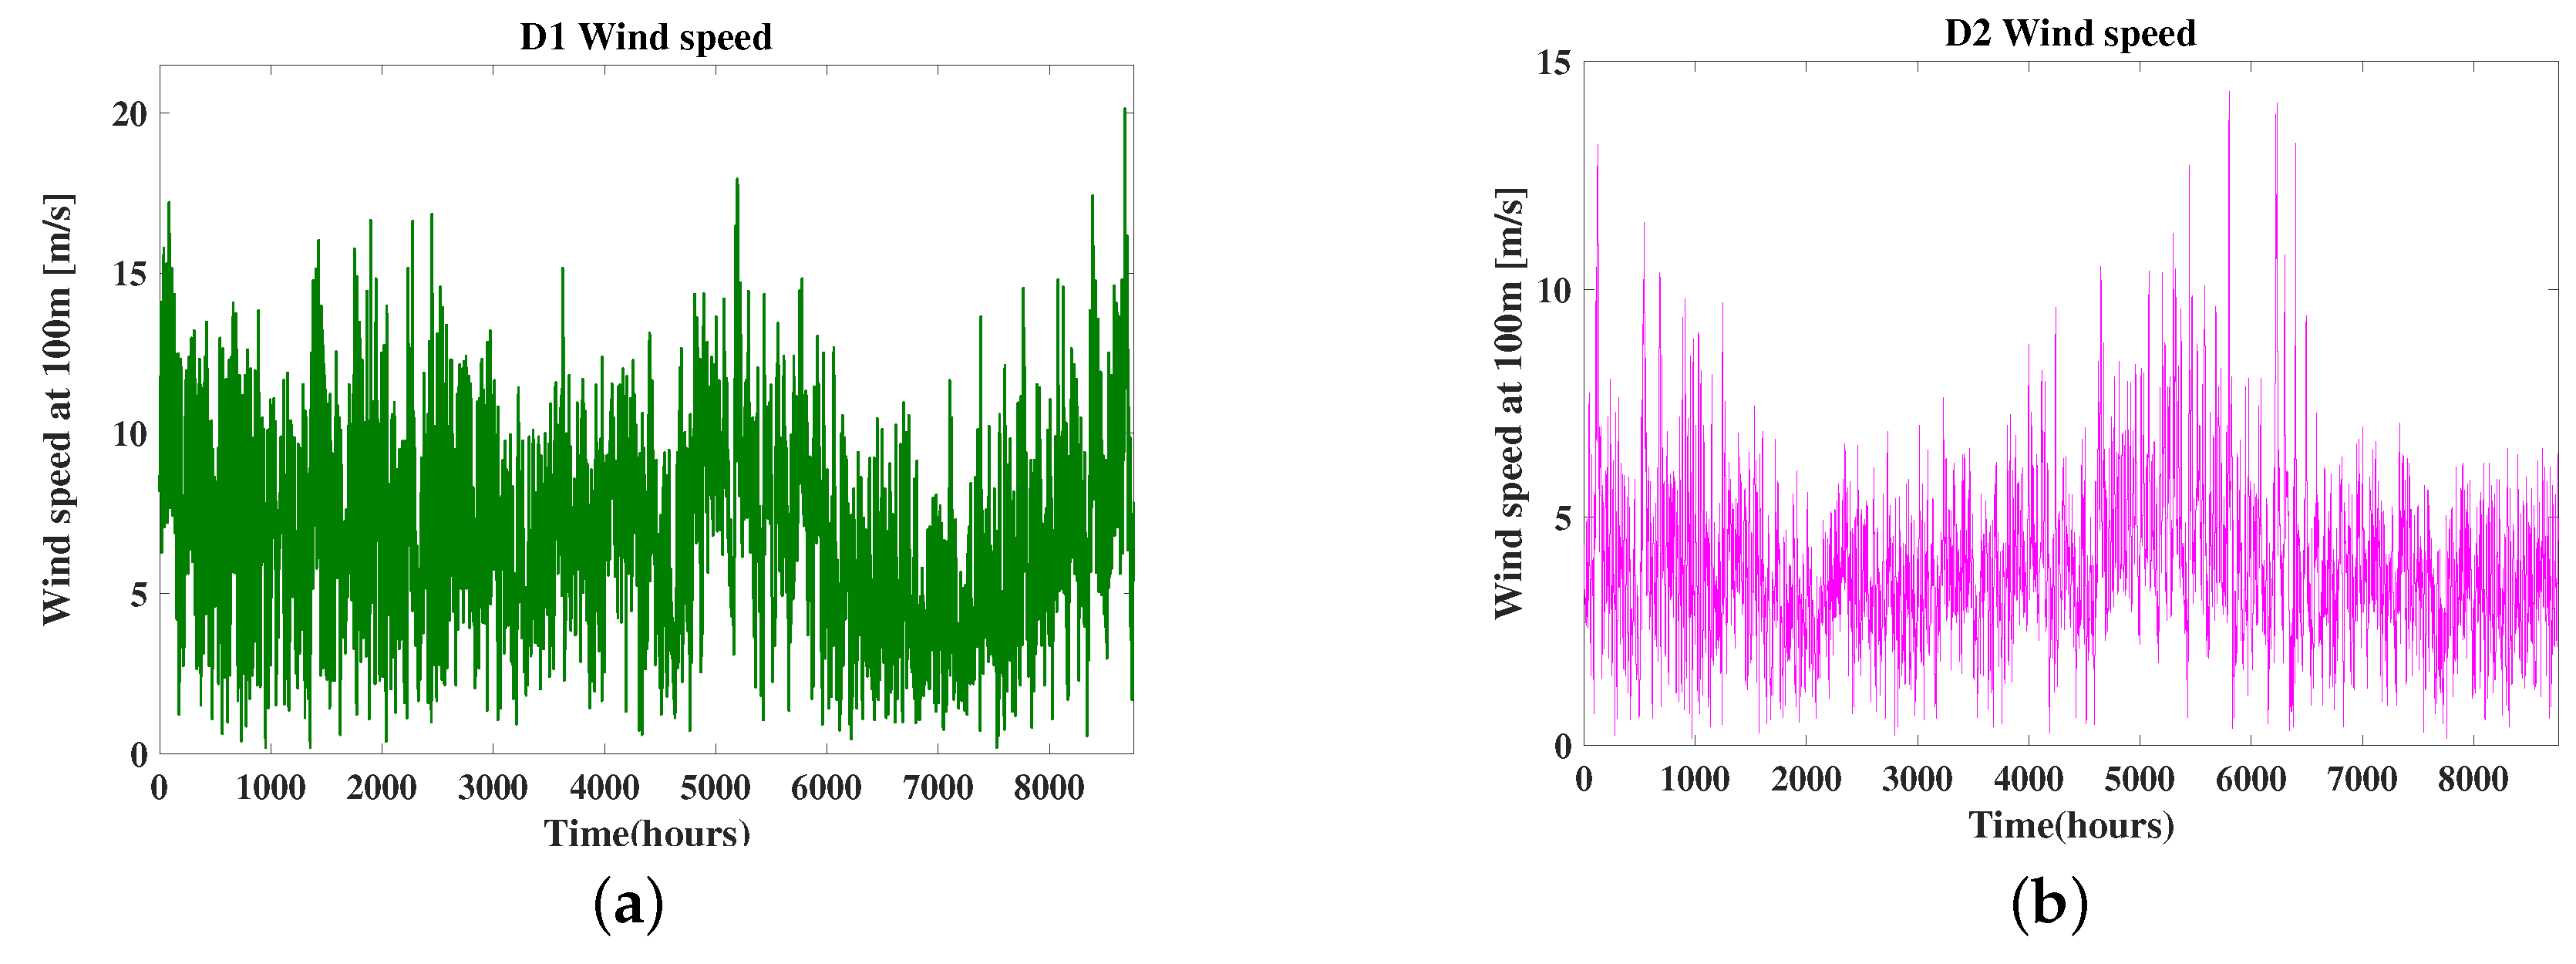
| D1 | 7.70 | 2.61 | 531.45 | 31.6 |
| D2 | 4.75 | 2.40 | 189.40 | 9.95 |
| Biomass Feedstock Parameters | ||||
|---|---|---|---|---|
| Fuel Type | NCV (MJ/kg) | Bulk Density (kg/m) | Ash Content (%Dry Bulk) | Moisture Content (%) |
| Baggase briquette | 16.7 | 650 | 6 | 8 |
| Corncobs | 14 | 185 | 15 | 14 |
| Rice straw | 14 | 100 | 20.25 | 10 |
| Palm kernel shells | 18.85 | 450 | 5 | N/A |
| BLOCK | Parameter | DPSP | ||||||
|---|---|---|---|---|---|---|---|---|
| 0% | 5% | 10% | 20% | 30% | 40% | 50% | ||
| DG Only | 1.53 | 1.33 | ||||||
| B1-ABCDE | ||||||||
| B3-ABD | ||||||||
| B7-ADE | ||||||||
| B8-AD | ||||||||
| B9-BD | ||||||||
| Block | Parameter | DPSP | ||||||
|---|---|---|---|---|---|---|---|---|
| 0% | 5% | 10% | 20% | 30% | 40% | 50% | ||
| DG Only | 63 | 59 | 55 | 48 | 40 | 33 | 26 | |
| DEF | 95 | 94.4 | 94 | 93.3 | 92.4 | 91 | 89.3 | |
| LCC | ||||||||
| B1-ABCDE | - | |||||||
| - | ||||||||
| - | ||||||||
| - | 14.0 | 12.5 | 19.6 | 13.0 | 13.0 | 1.0 | ||
| - | 35 | 54.7 | 56.5 | 10 | 10 | 97.2 | ||
| DEF | - | 7.2 | 13.2 | 37.2 | 37.7 | 55.2 | 22.5 | |
| REPG | - | 0.44 | 0.25 | 0.12 | 0.06 | 0.00 | 0.02 | |
| LCC | - | |||||||
| B3-ABD | ||||||||
| 372.13 | 280.1778 | 118.0276 | 126.0121 | 174.812 | 90.516 | 181.9352 | ||
| DEF | 18.7 | 18.9 | 19.2 | 19.6 | 20.1 | 22.2 | 23.8 | |
| REPG | 0.14 | 0.14 | 0.15 | 0.11 | 0.06 | 0.04 | 0.01 | |
| LCC | ||||||||
| B7-ADE | - | - | l | |||||
| - | - | 35 | 24 | 11 | 4 | 1 | ||
| - | - | 130 | 128 | 125 | 120 | 120 | ||
| DEF | - | - | 19.8124 | 21.2465 | 15.0873 | 20.9012 | 19.5347 | |
| REPG | - | - | 0.86 | 0.66 | 0.77 | 0.14 | 0.10 | |
| LCC | - | - | ||||||
| B8-AD | ||||||||
| 773.8 | 577 | 470.8 | 523.2 | 430.8 | 319.5 | 156.3 | ||
| DEF | 19.6 | 19.8 | 20.2 | 20.9 | 21.7 | 23.0 | 23.9 | |
| REPG | 0.01 | 0.06 | 0.07 | 0.01 | 0.00 | 0.01 | 0.01 | |
| LCC | ||||||||
| B9-BD | ||||||||
| 840 | 799.3 | 765.7 | 737.8 | 541.8 | 410 | 548.5 | ||
| DEF | 55.4 | 55.2 | 55.7 | 56.1 | 56.5 | 56.8 | 57.3 | |
| REPG | 0.32 | 0.36 | 0.28 | 0.22 | 0.18 | 0.16 | 0.11 | |
| LCC | ||||||||
© 2019 by the authors. Licensee MDPI, Basel, Switzerland. This article is an open access article distributed under the terms and conditions of the Creative Commons Attribution (CC BY) license (http://creativecommons.org/licenses/by/4.0/).
Share and Cite
Konneh, D.A.; Howlader, H.O.R.; Shigenobu, R.; Senjyu, T.; Chakraborty, S.; Krishna, N. A Multi-Criteria Decision Maker for Grid-Connected Hybrid Renewable Energy Systems Selection Using Multi-Objective Particle Swarm Optimization. Sustainability 2019, 11, 1188. https://doi.org/10.3390/su11041188
Konneh DA, Howlader HOR, Shigenobu R, Senjyu T, Chakraborty S, Krishna N. A Multi-Criteria Decision Maker for Grid-Connected Hybrid Renewable Energy Systems Selection Using Multi-Objective Particle Swarm Optimization. Sustainability. 2019; 11(4):1188. https://doi.org/10.3390/su11041188
Chicago/Turabian StyleKonneh, David Abdul, Harun Or Rashid Howlader, Ryuto Shigenobu, Tomonobu Senjyu, Shantanu Chakraborty, and Narayanan Krishna. 2019. "A Multi-Criteria Decision Maker for Grid-Connected Hybrid Renewable Energy Systems Selection Using Multi-Objective Particle Swarm Optimization" Sustainability 11, no. 4: 1188. https://doi.org/10.3390/su11041188
APA StyleKonneh, D. A., Howlader, H. O. R., Shigenobu, R., Senjyu, T., Chakraborty, S., & Krishna, N. (2019). A Multi-Criteria Decision Maker for Grid-Connected Hybrid Renewable Energy Systems Selection Using Multi-Objective Particle Swarm Optimization. Sustainability, 11(4), 1188. https://doi.org/10.3390/su11041188