Structure Dynamics and Risk Assessment of Water-Energy-Food Nexus: A Water Footprint Approach

 ,
,
Abstract
:1. Introduction
1.1. Water-Energy-Food Nexus
1.2. Theory of Virtual Water and Water Footprint
1.3. Necessity of Combination of WEF-Nexus and Water Footprint
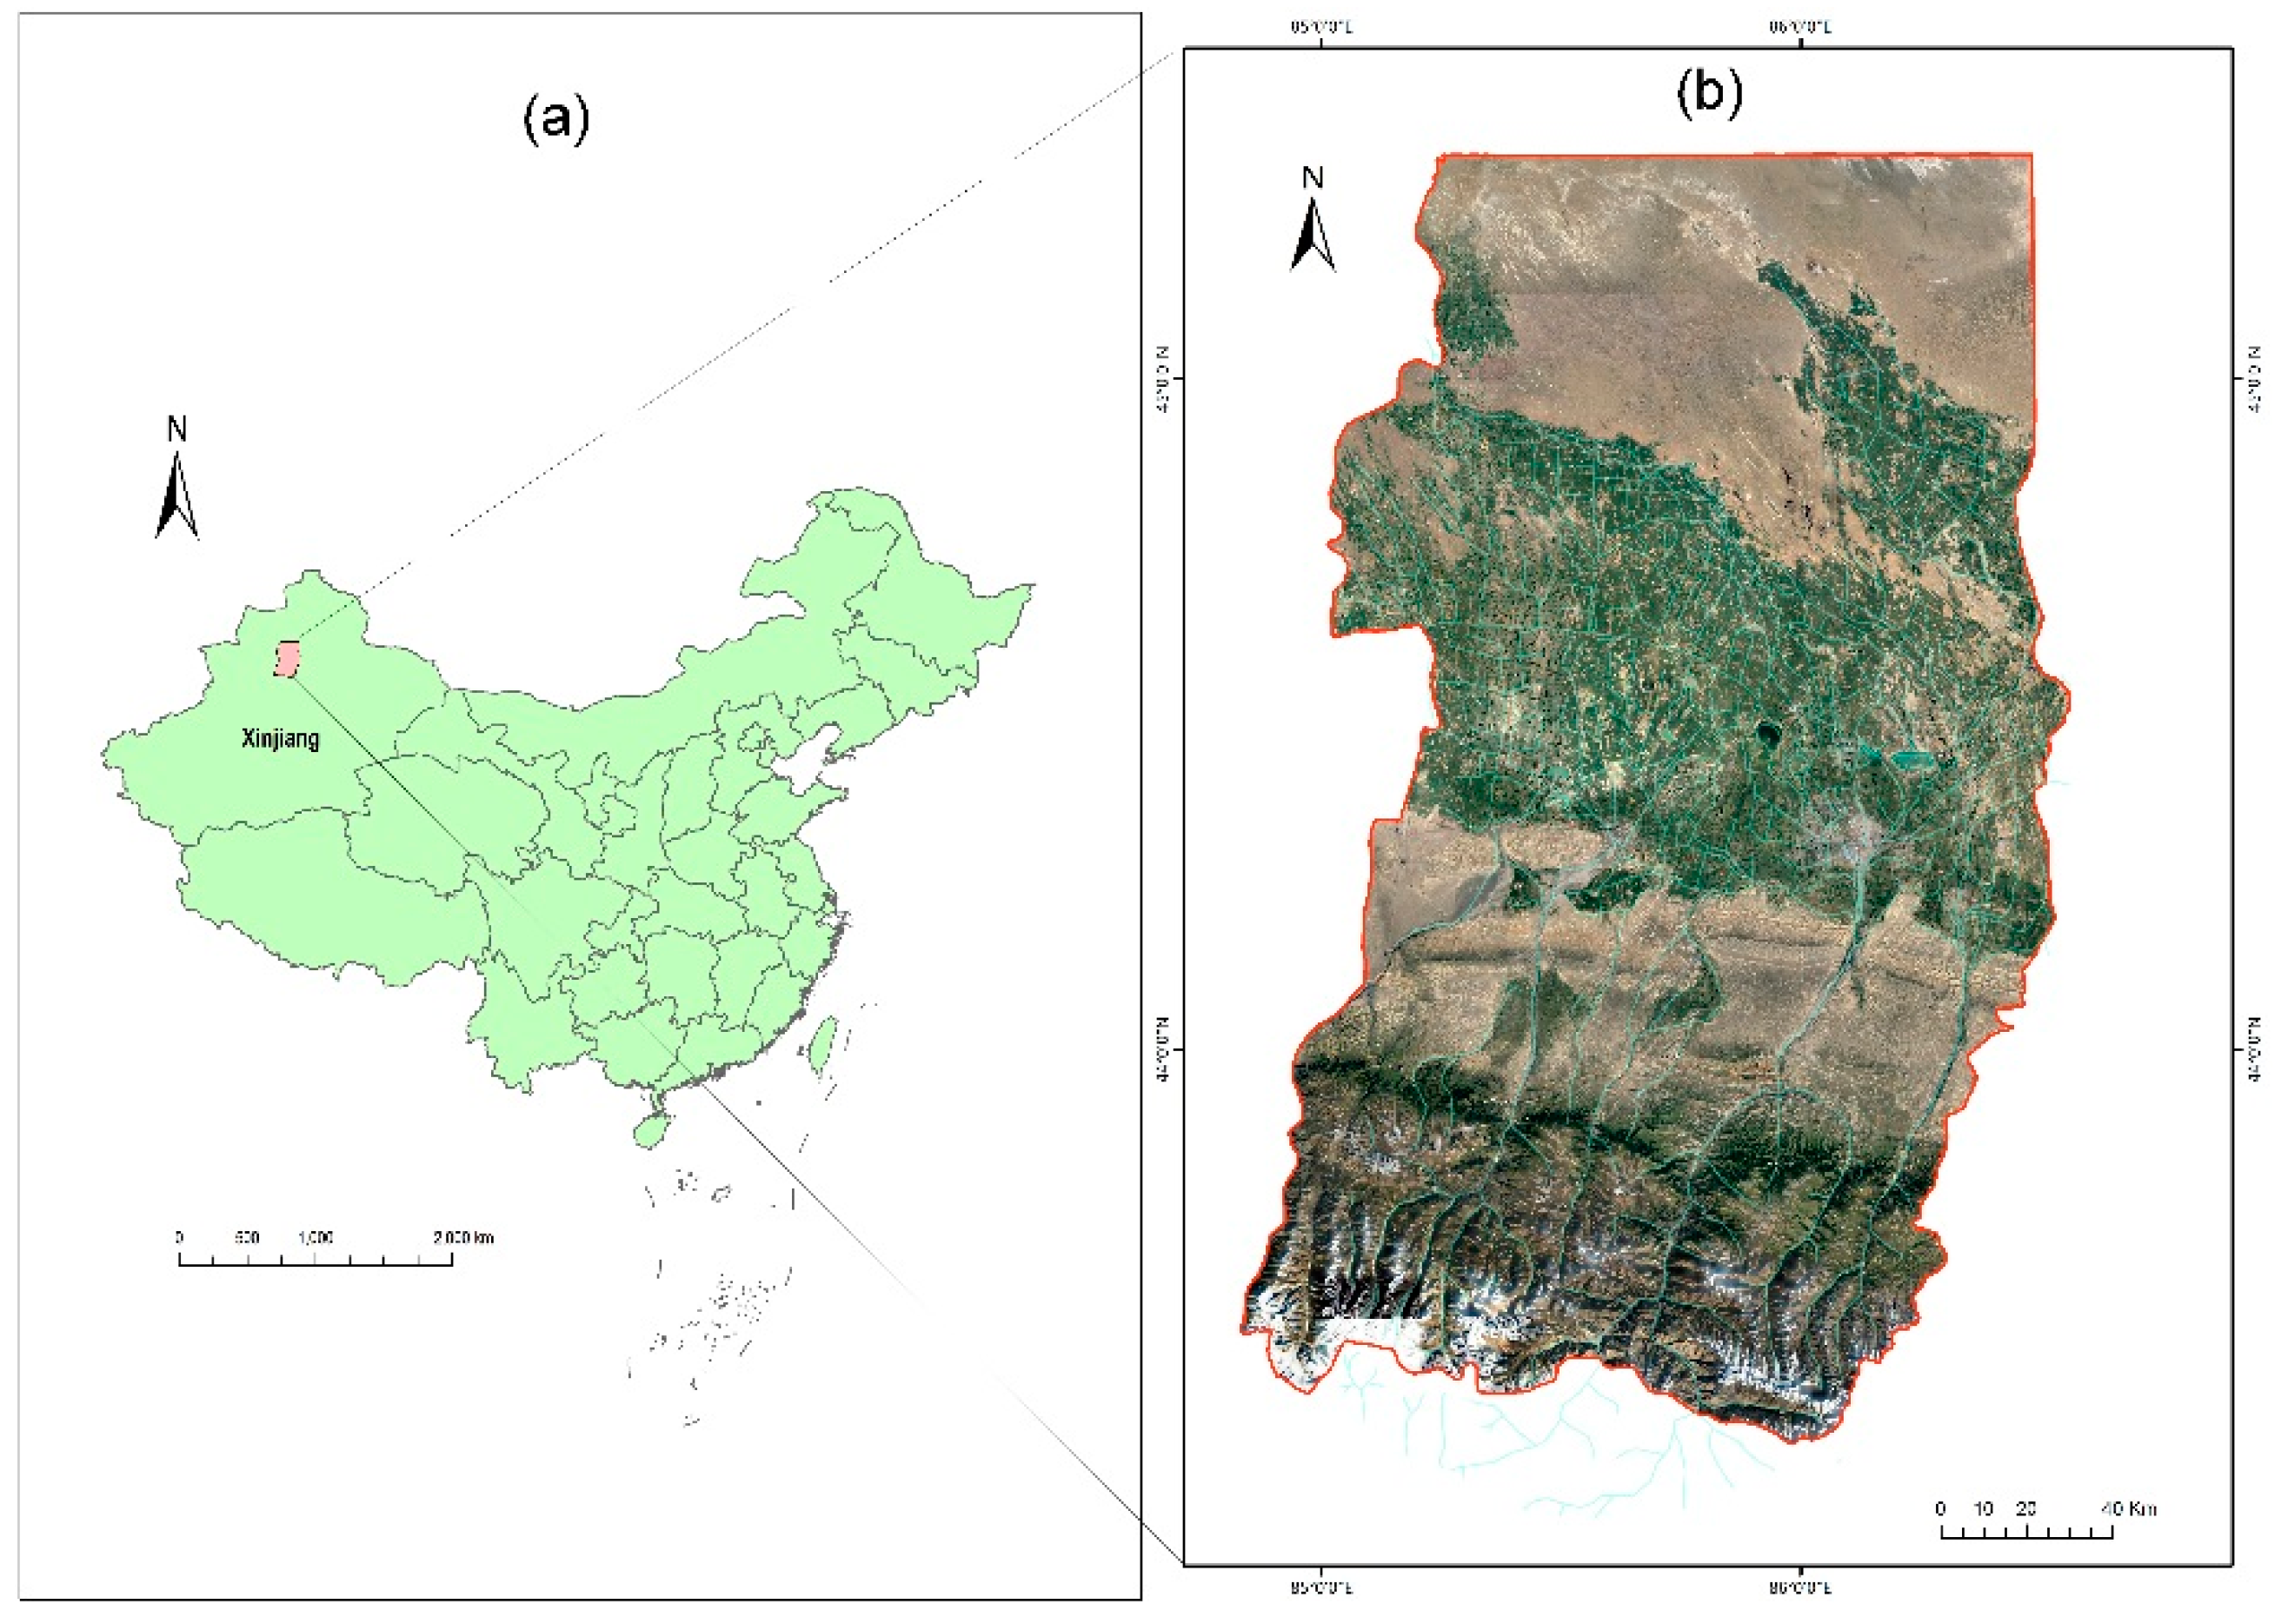
2. Study Area
3. Materials and Methods
3.1. Data Sources
3.2. Water Footprint Calculation and Risk Assessment Methods
3.2.1. Calculation of Virtual Water and Water Footprint of Crop Products
3.2.2. Calculation of Virtual Water and Water Footprint of Livestock Products
3.2.3. Calculation of Virtual Water and Water Footprint of Energy
3.2.4. Structural Risk Assessment of the WEF System Based on Water Footprint
4. Results
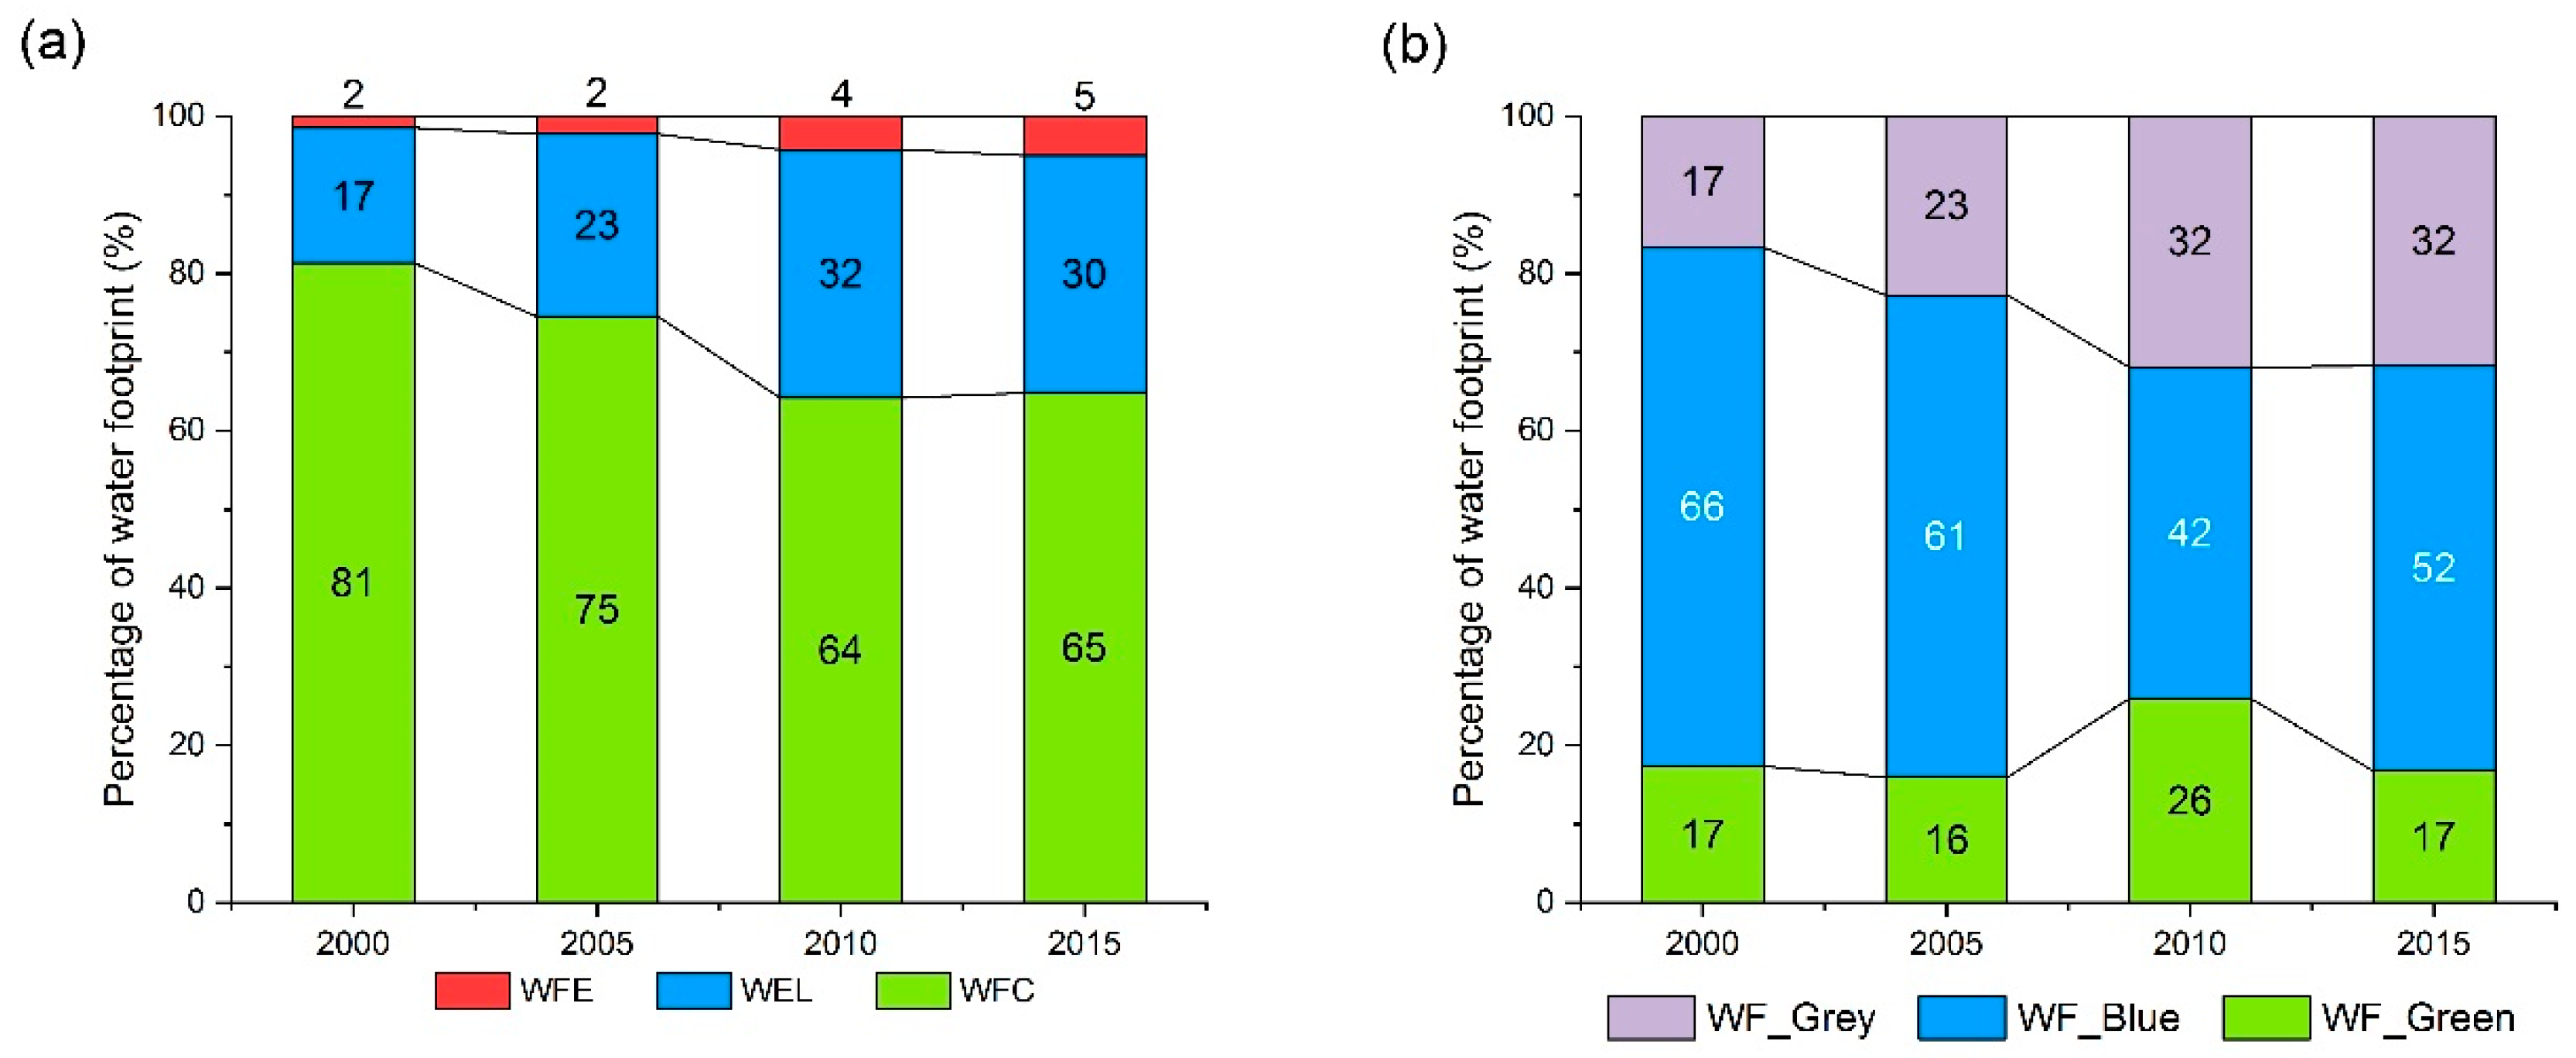
4.1. Structural Characteristics of the Water Footprint of the Basin WEF System
4.2. Changes and Dynamics of Water Footprint in the WEF System of the Basin
4.2.1. General Change of Water Footprint of the Basin
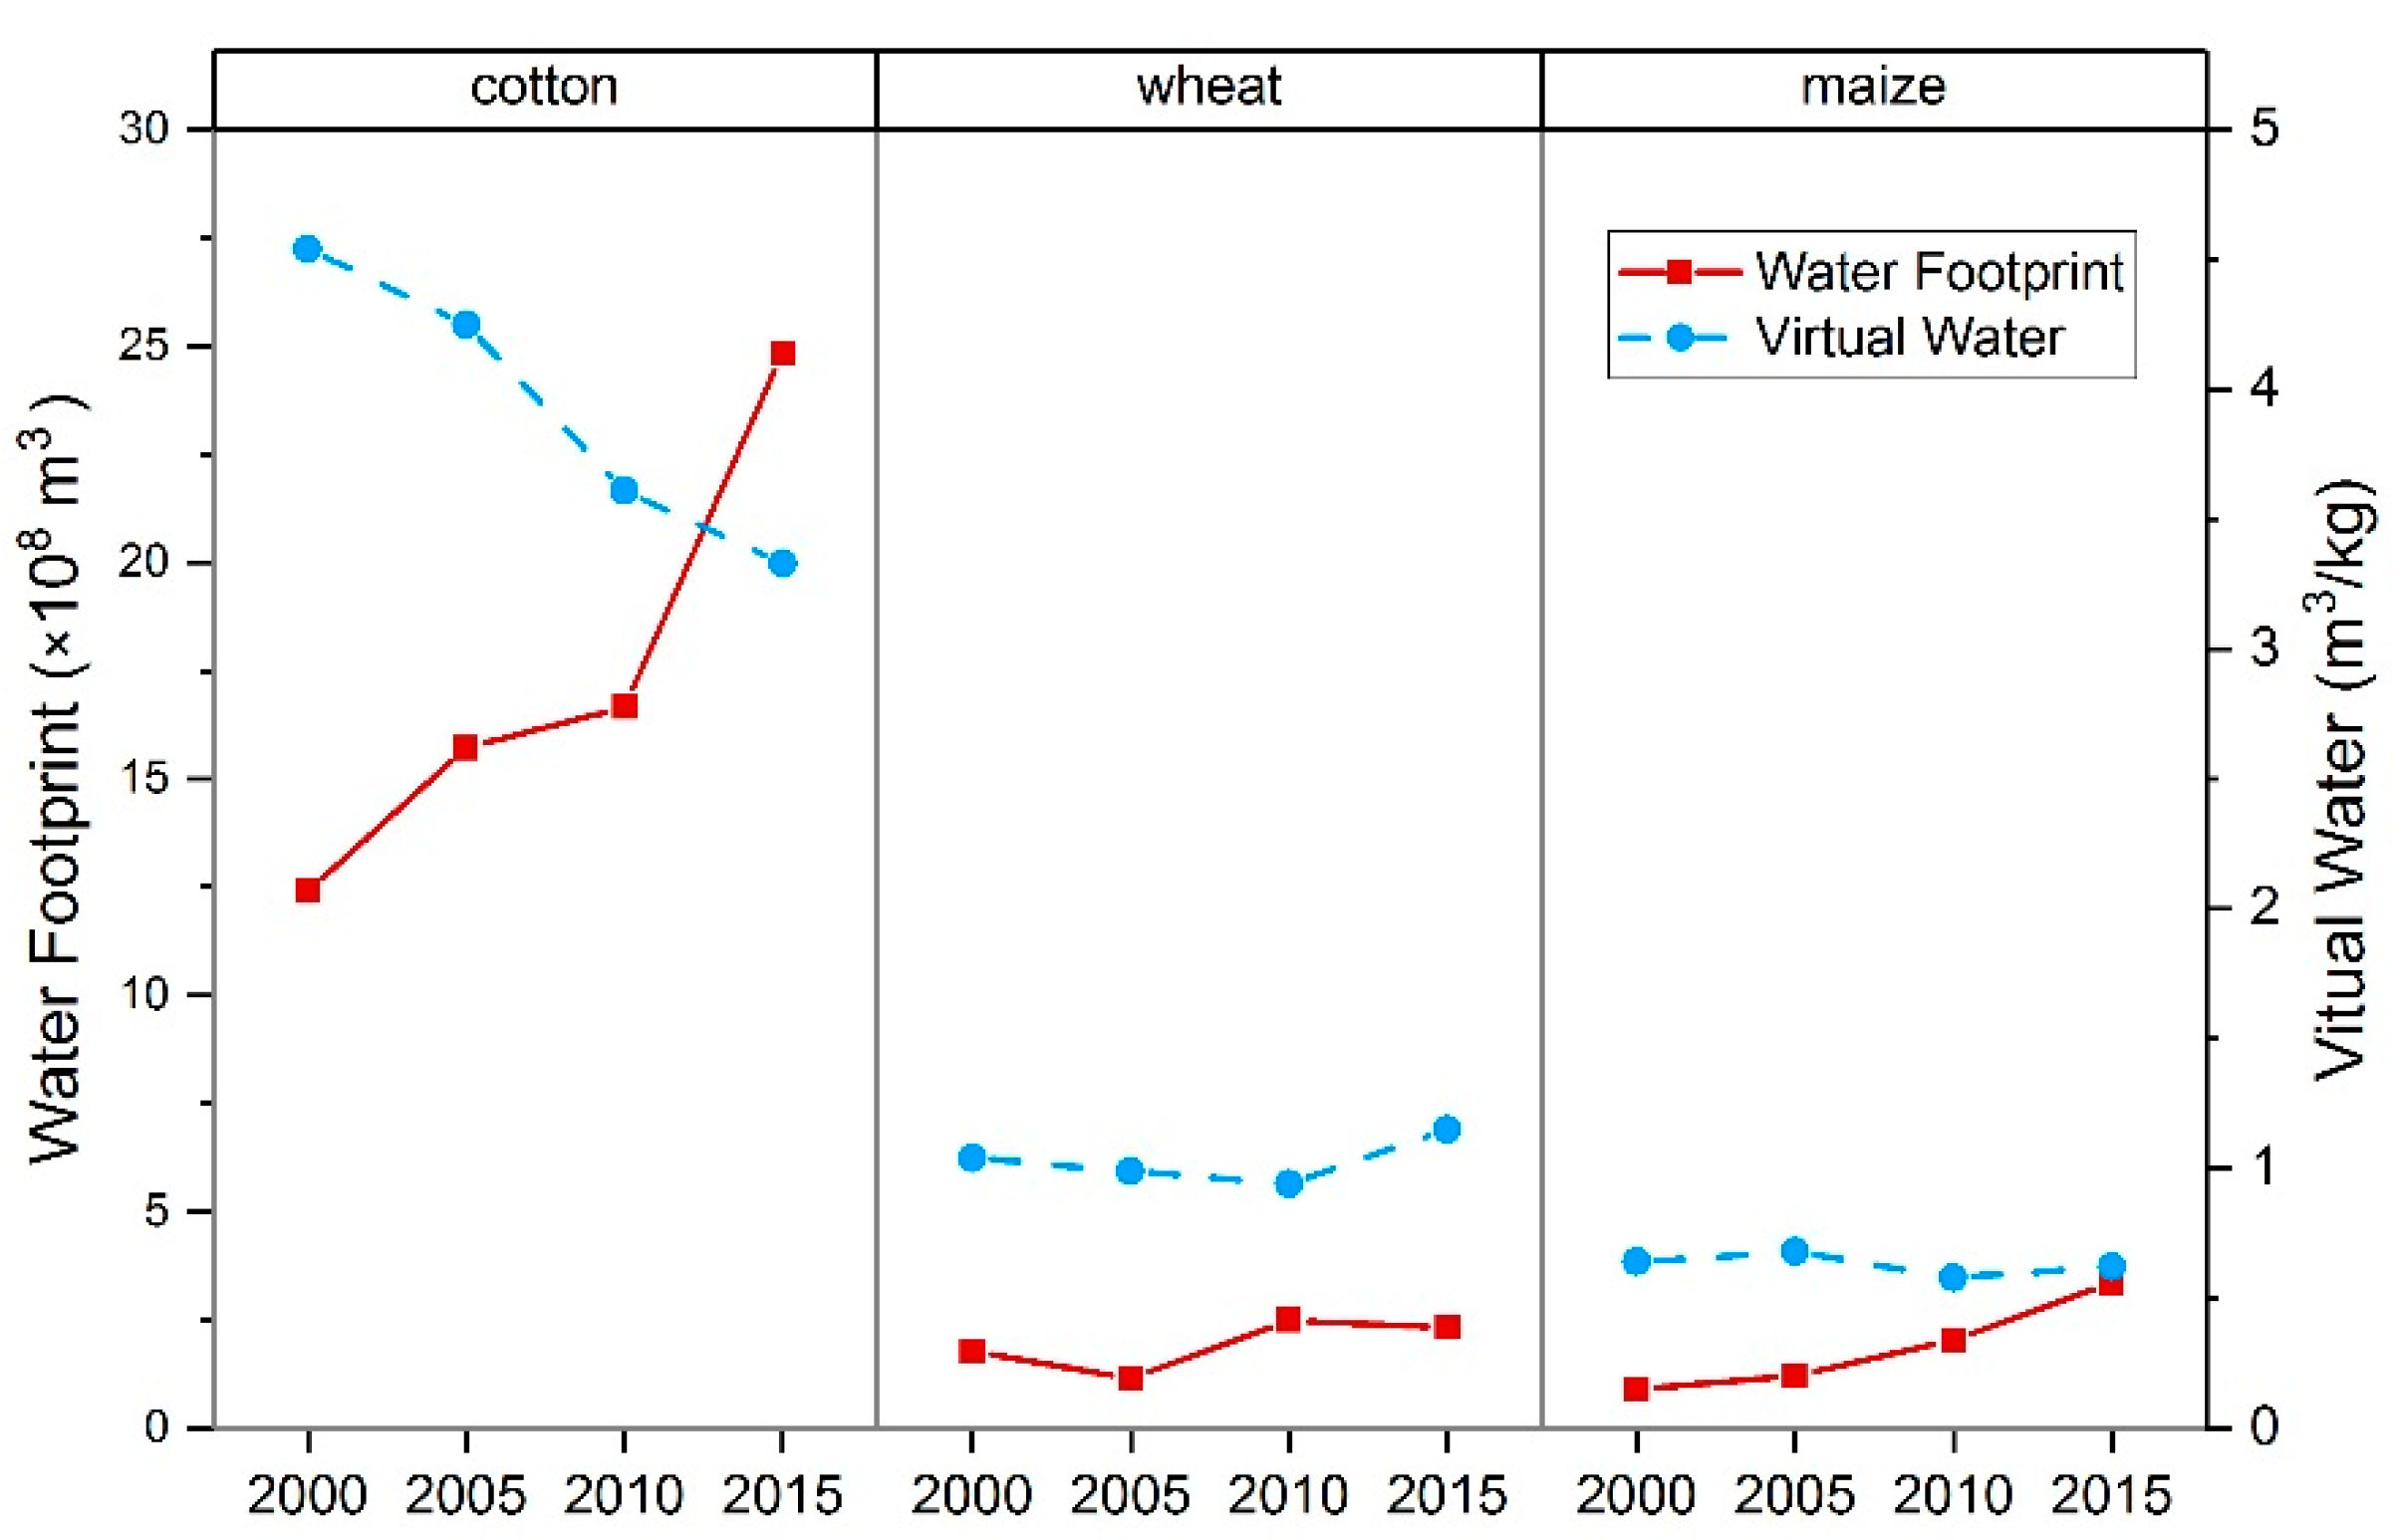
4.2.2. Water Footprint Changes of Main Crop Products
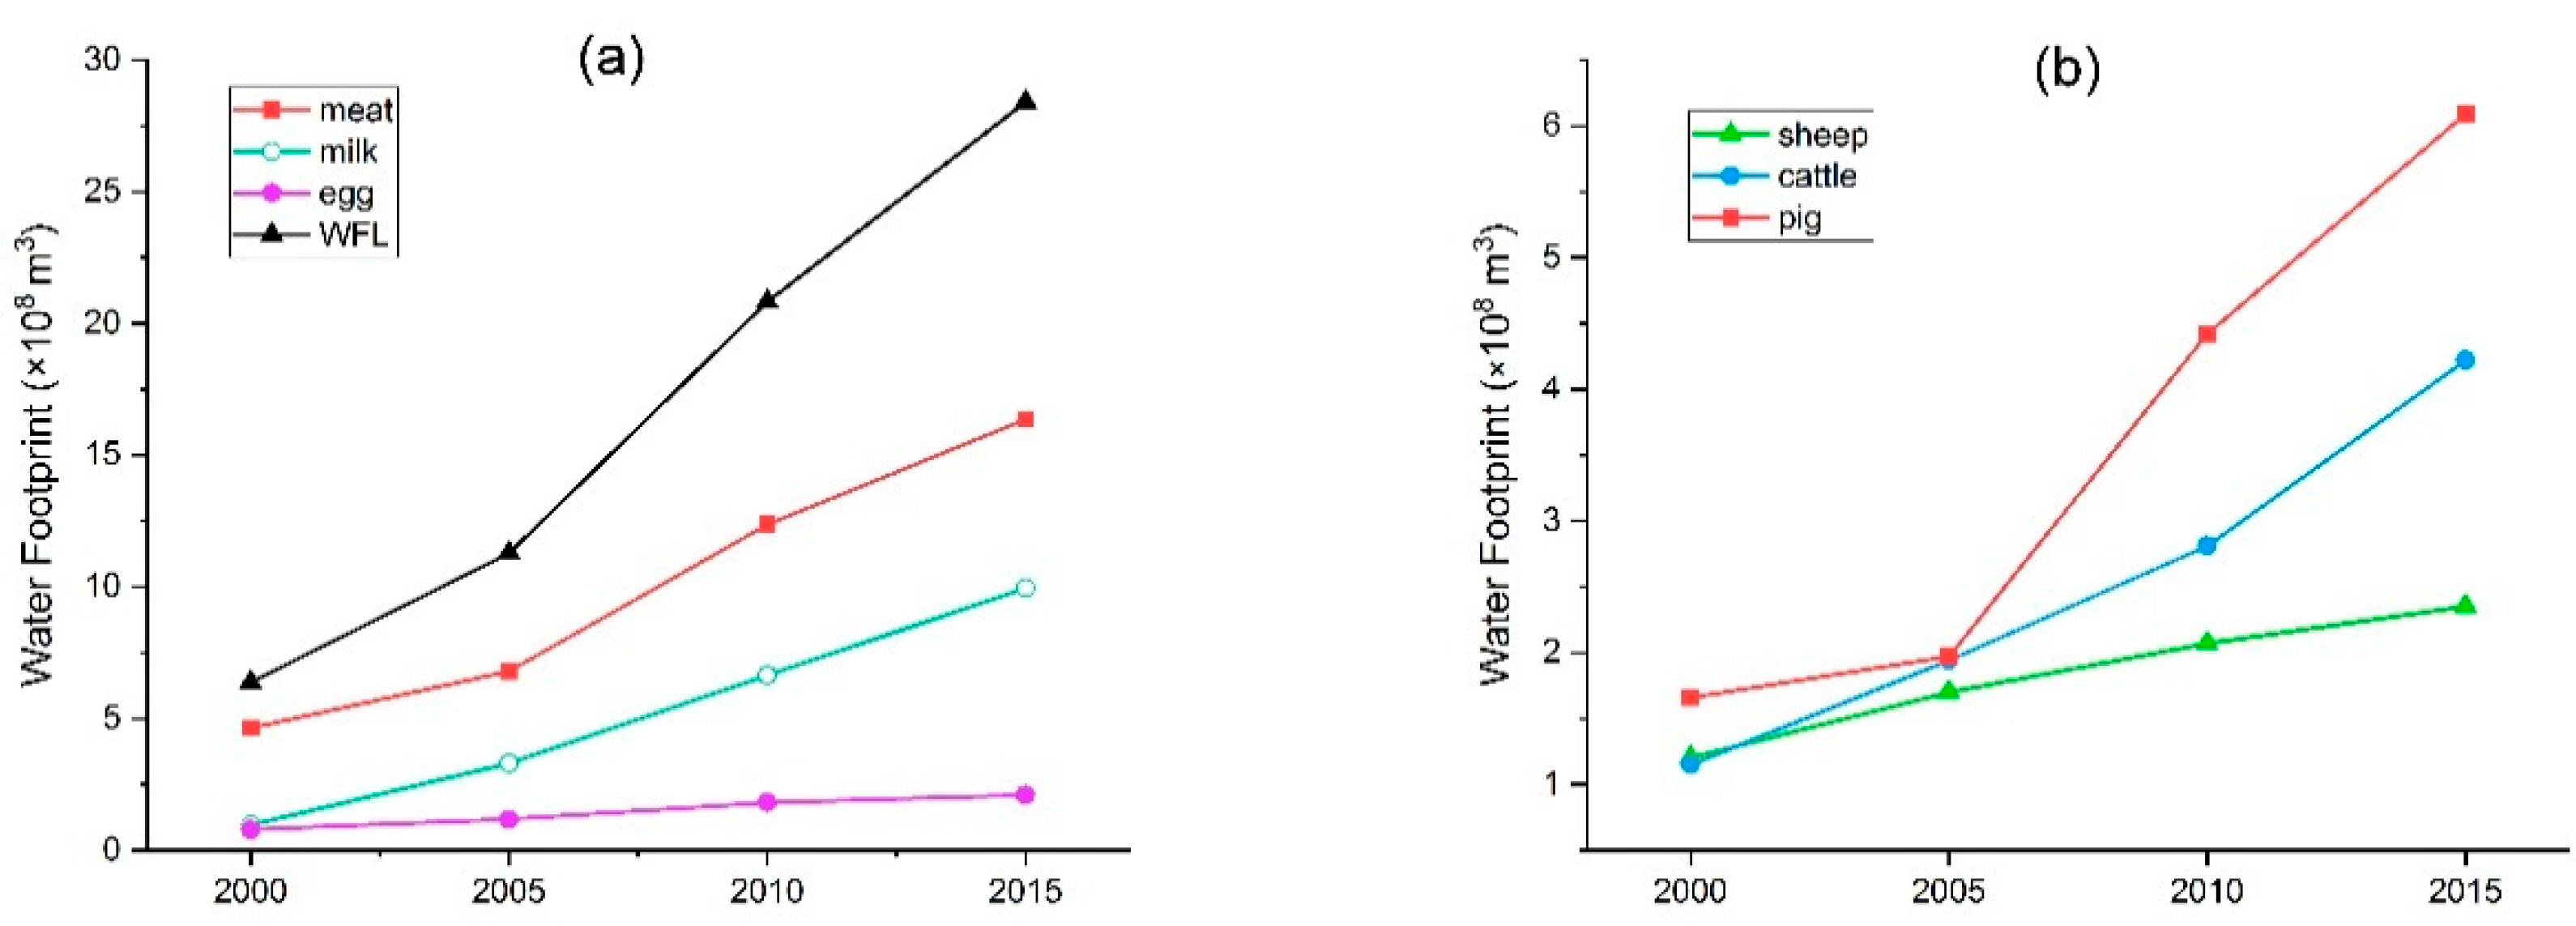
4.2.3. Water Footprint Changes of Main Livestock Products
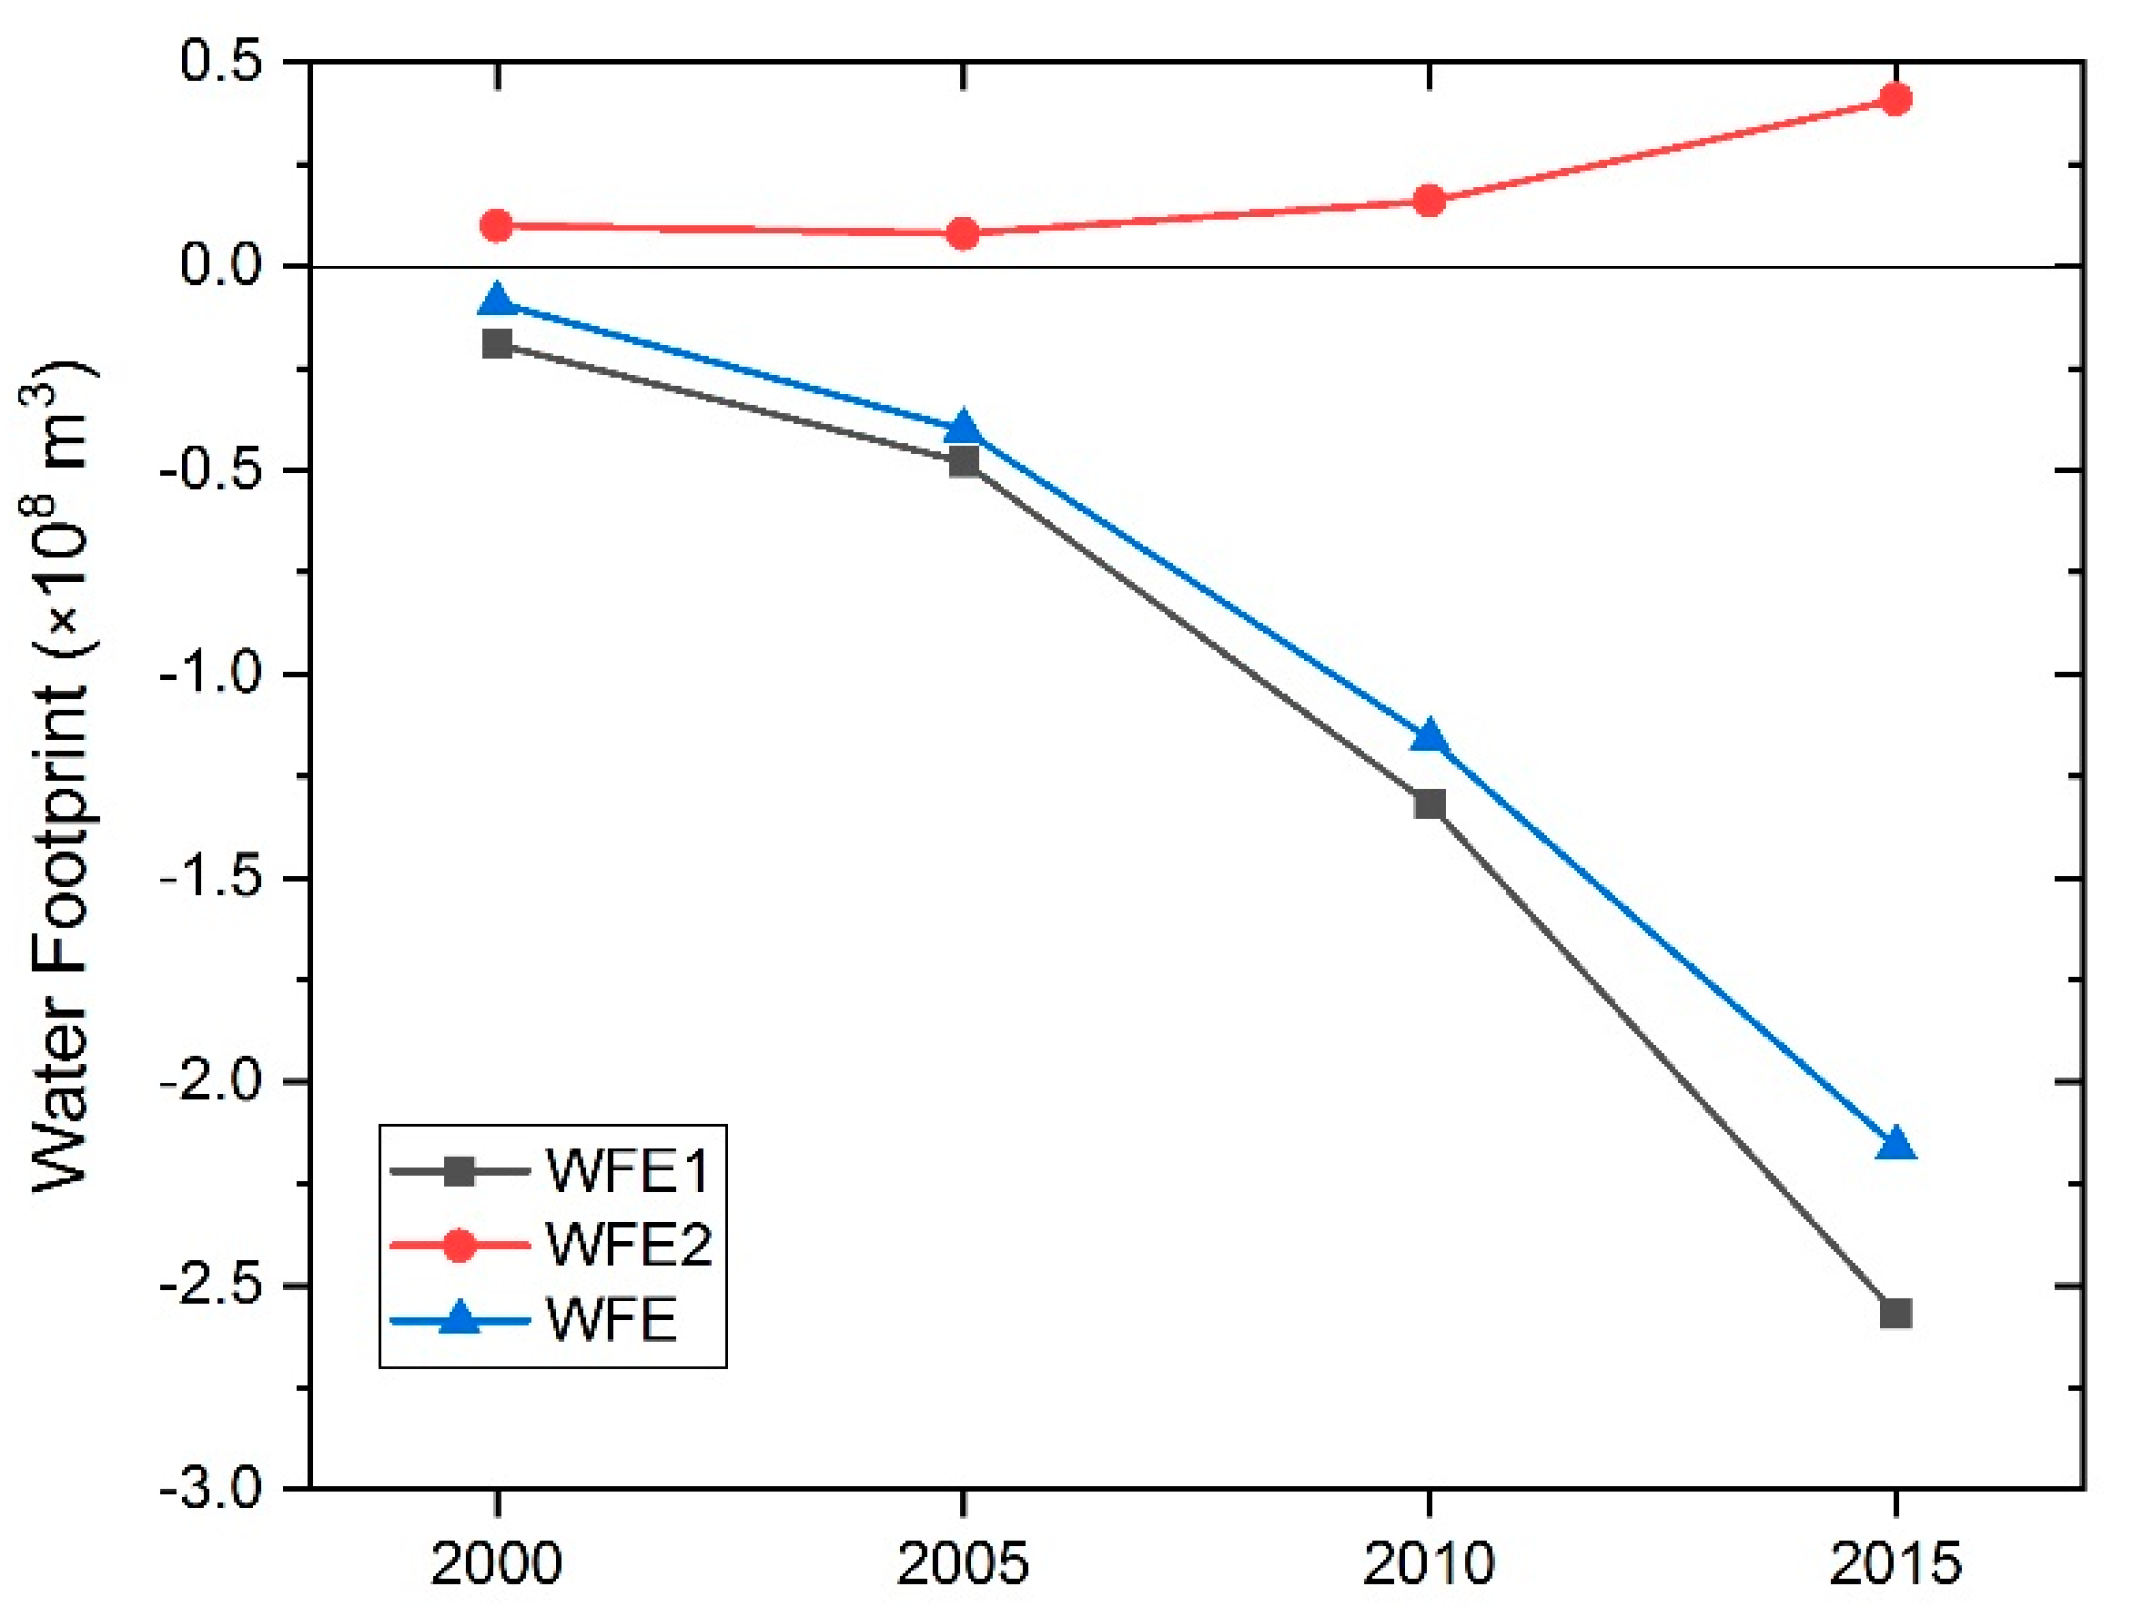
4.2.4. Water Footprint Changes of Energy
4.3. Risk Assessment of WEF System Based on the Water Footprint in the Basin
5. Discussion
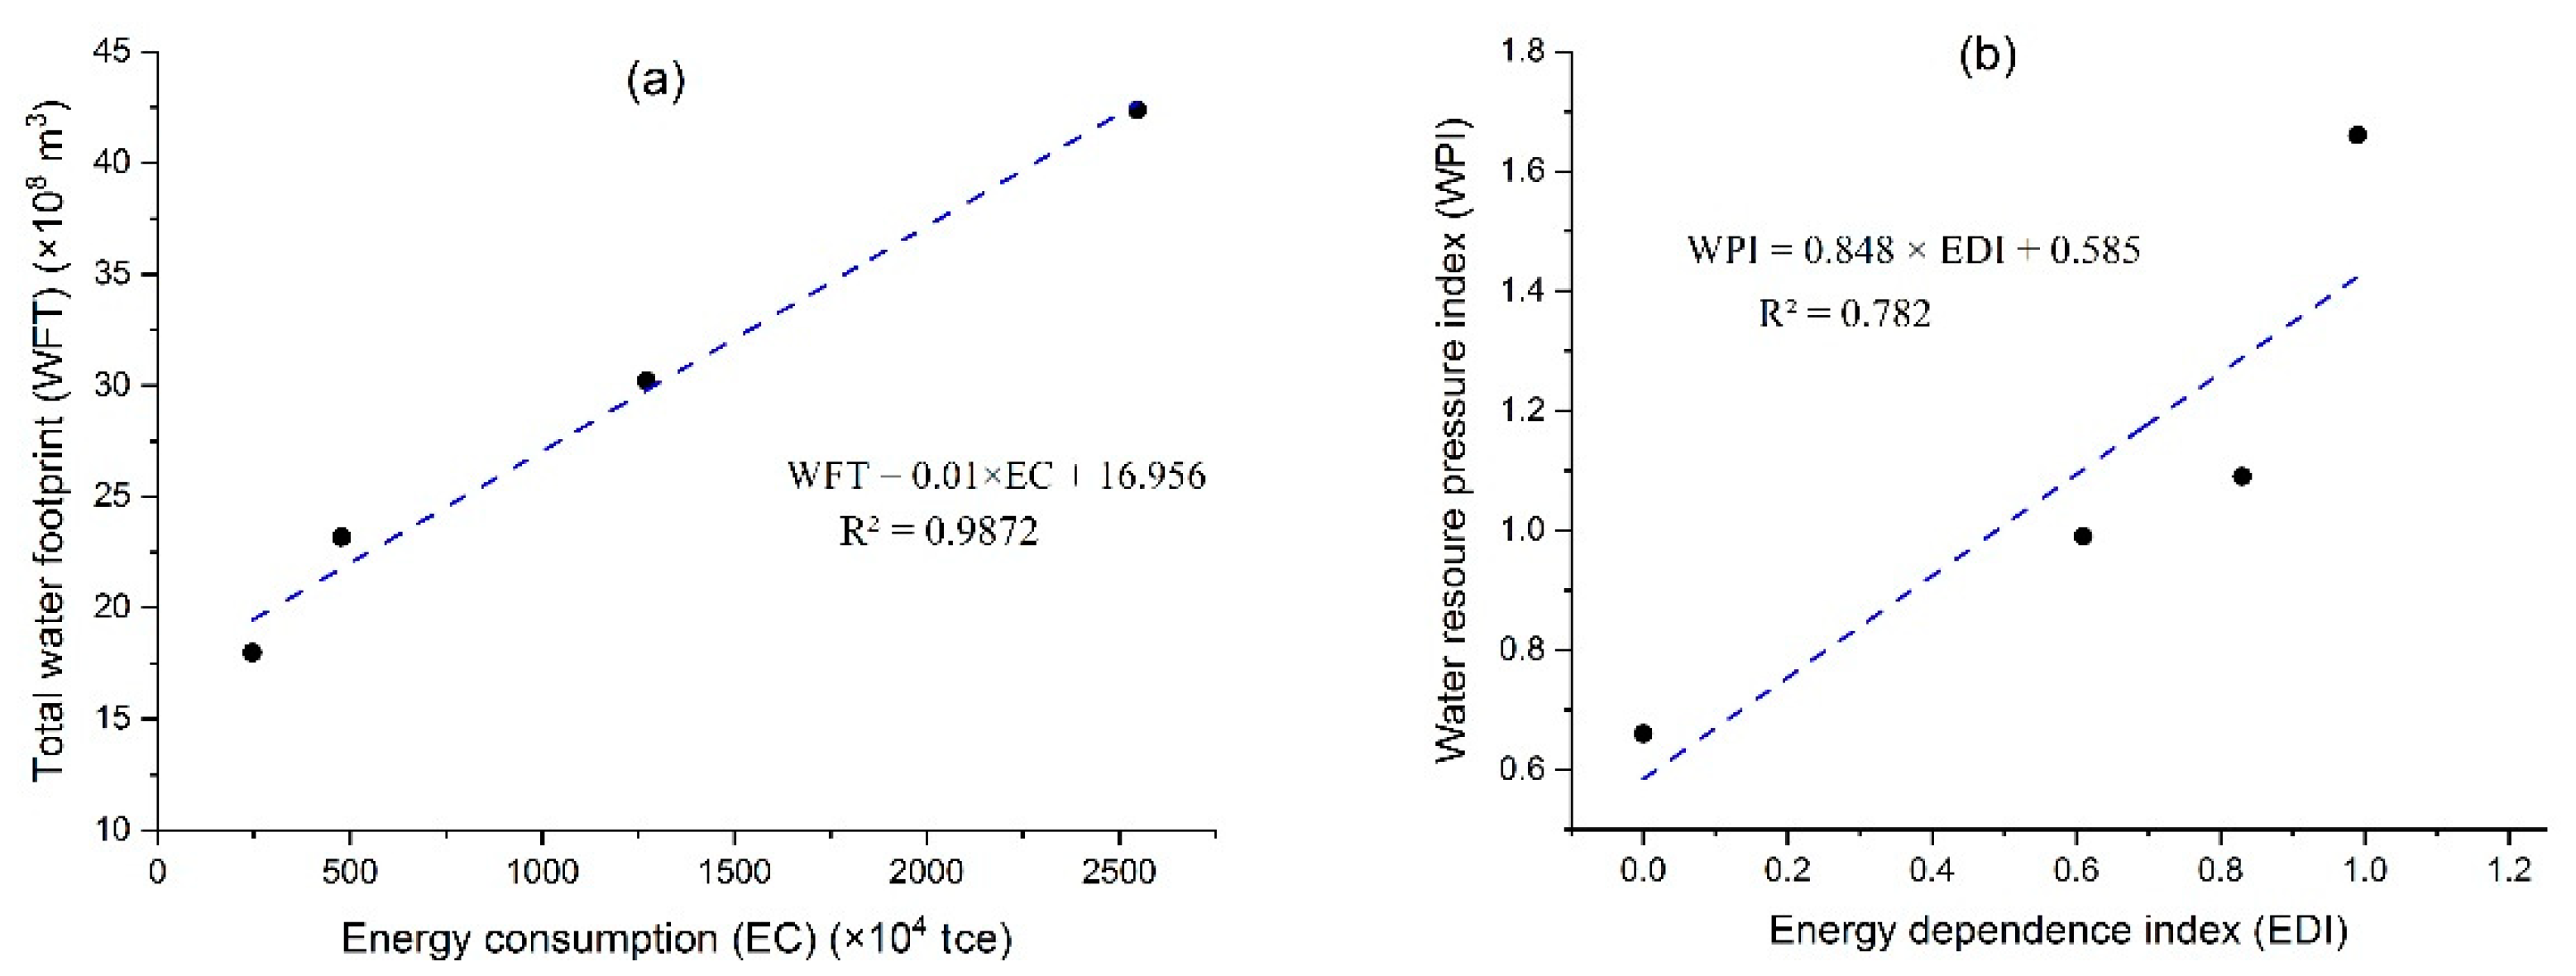
5.1. Tradeoffs and Synergies of the Water-Energy-Food Nexus
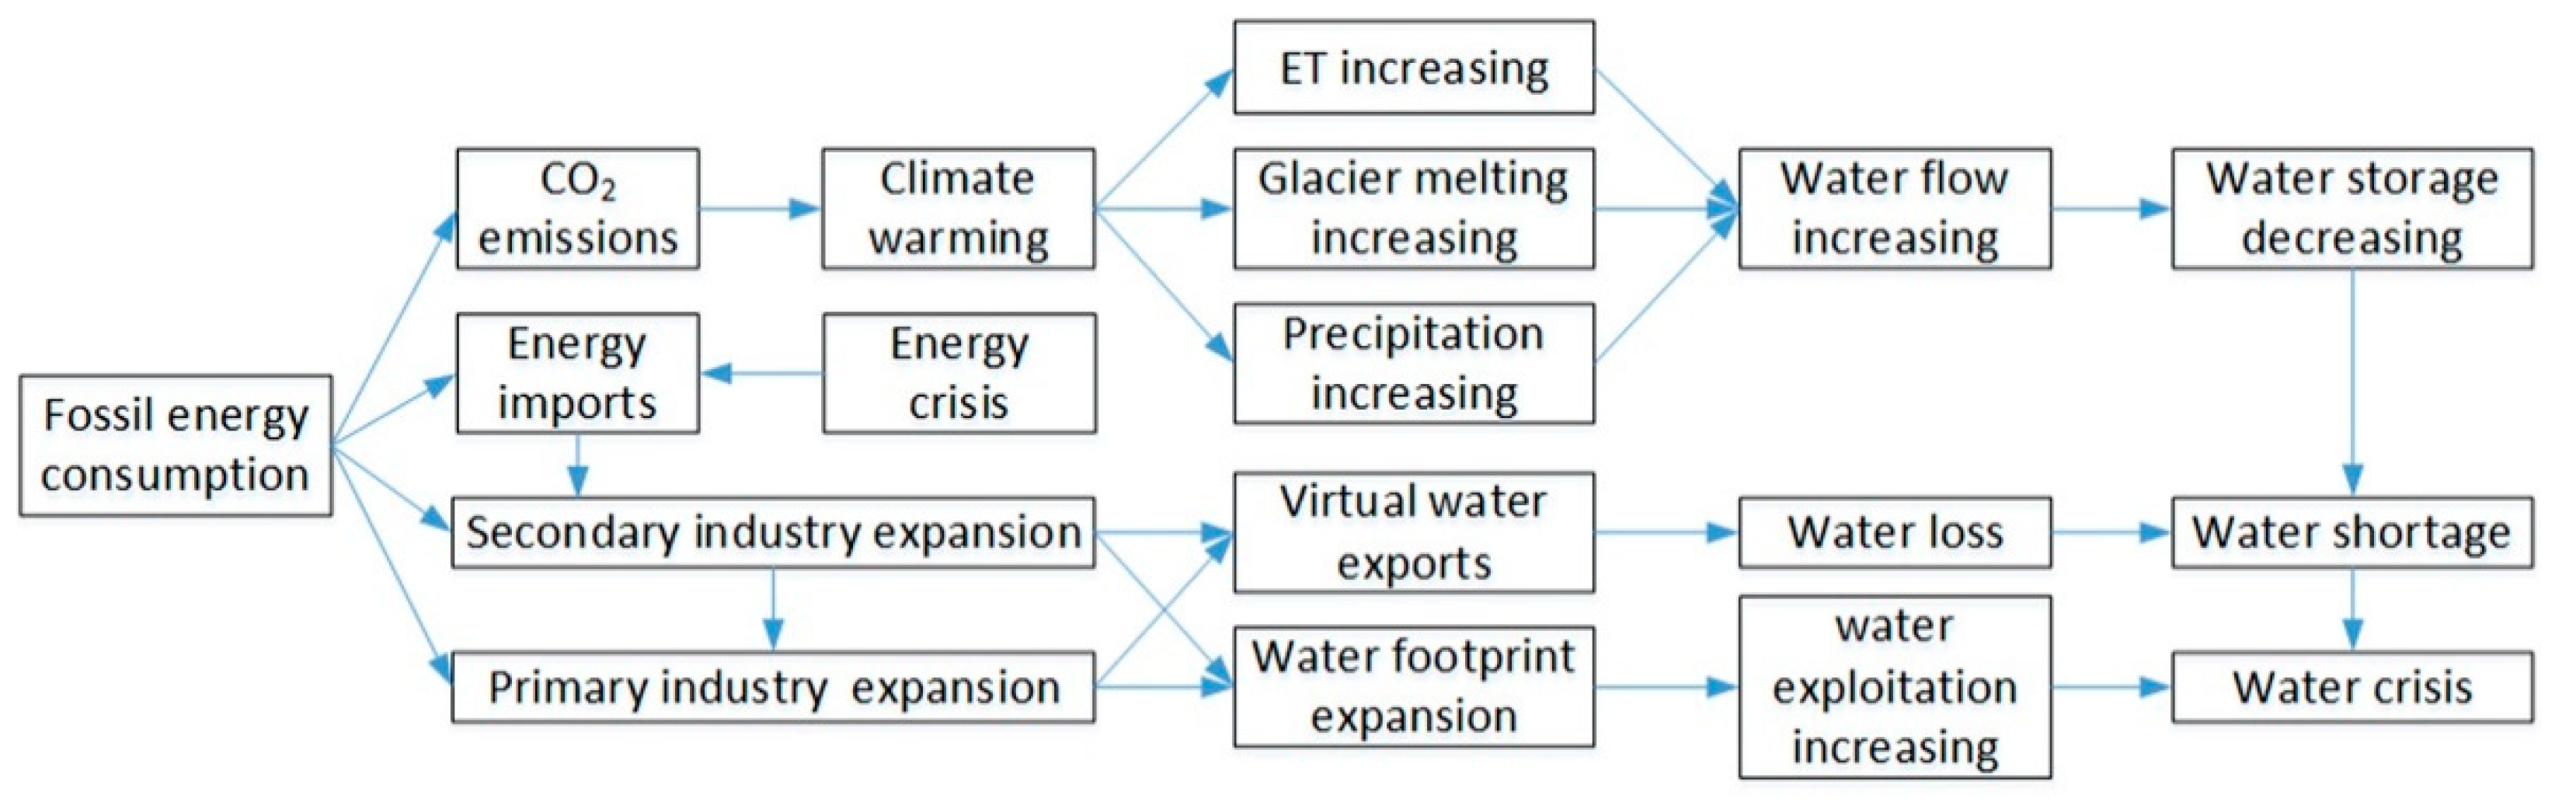
5.2. Risk Transfer Chains of the Water-Energy-Food System
6. Conclusions
Author Contributions
Funding
Acknowledgments
Conflicts of Interest
References
- Chang, Y.; Xia, P.; Wang, J.P. The implications of water-food-energy nexus for China. Water Conserv. Dev. Res. 2016, 16, 67–70. (In Chinese) [Google Scholar]
- Sahin, O.; Stewart, R.A.; Richards, R.G. Addressing the water-energy-climate nexus conundrum: A systems approach. Proc. Int. Congr. Environ. Model. Softw. 2014, 101, 7367–7373. [Google Scholar]
- Luis, S.P. Water, agriculture and food: Challenges and issues. Water Resour Manag. 2017, 31, 2985–2999. [Google Scholar]
- Li, G.J.; Li, Y.L.; Jia, X.J.; Du, L.; Huang, D.H. Establishment and Simulation Study of System Dynamic Model on Sustainable Development of Water-Energy-Food Nexus in Beijing. Manag. Rev. 2016, 28, 11–26. (In Chinese) [Google Scholar]
- Li, G.J.; Huang, D.H.; Li, Y.L. Water-energy-food nexus (WEF-nexus): New perspective on regional sustainable development. J. Cent. Univ. Financ. Econ. 2016, 12, 76–90. (In Chinese) [Google Scholar]
- Li, G.J.; Huang, D.H.; Li, Y.L. Evaluation on the Efficiency of the Input and Output of Water-Energy-Food in Different Regions of China. Comp. Econ. Soc. Syst. 2017, 3, 138–148. (In Chinese) [Google Scholar]
- Pukšec, T.; Leahy, P.; Foley, A.; Markovska, N.; Duić, N. Sustainable development of energy, water and environment systems 2016. Renew. Sustain. Energy Rev. 2018, 82, 1685–1690. [Google Scholar] [CrossRef]
- Charles, E. Global Risks 2011 Report (6th Edition): An initiative of the Risk Response Network; World Economic Forum: Cologny, Switzerland, 2011. [Google Scholar]
- Hoff, H. Understanding the Nexus. Background Paper for the Bonn 2011 Conference: The Water Energy and Food Security Nexus; Stockholm Environment Institute: Stockholm, Sweden, 2011. [Google Scholar]
- Taniguchi, M.; Endo, A.; Gurdak, J.; Swarzenski, P. Water-food-energy nexus in Asia and the Pacific Region. J. Hydrol. Reg. Stud. 2017, 11, 1–8. [Google Scholar] [CrossRef]
- FAO. The Water-Energy-Food Nexus: A New Approach in Support of Food Security and Sustainable Agriculture; Food and Agriculture Organization of the United Nations: Rome, Italy, 2014. [Google Scholar]
- Ringler, C.; Bhaduri, A.; Lawford, R. The nexus across Water, Energy, Land and Food (WELF): Potential for improved resource use efficiency? Curr. Opin. Environ. Sustain. 2013, 5, 617–624. [Google Scholar] [CrossRef]
- De, S.L.; Lipponen, A.; Howells, M.; Stec, S.; Bréthaut, C. A methodology to assess the water energy food ecosystems nexus in transboundary river basins. Water 2016, 8, 59. [Google Scholar]
- Vora, N.; Shah, A.; Bilec, M.M.; Khanna, V. Food-energy-water nexus: Quantifying embodied energy and GHG emissions from irrigation through virtual water transfers in food trade. ACS Sustain. Chem. Eng. 2017, 5, 2119–2128. [Google Scholar] [CrossRef]
- Sherwood, J.; Clabeaux, R.; Carbajales, D.A. An extended environmental input-output lifecycle assessment model to study the urban food-energy-water nexus. Environ. Res. Lett. 2017, 12, 105003. [Google Scholar] [CrossRef]
- Li, L.; Bi, J.; Zhou, Y.C.; Liu, M.M. Research progress of regional environmental risk management: From the perspectives of food-energy-water nexus. China Popul. Resour. Environ. 2018, 28, 85–92. (In Chinese) [Google Scholar]
- Peng, S.M.; Zheng, X.K.; Wang, Y.; Jiang, G.Q. Study on water-energy-food collaborative optimization for Yellow River basin. Adv. Water Sci. 2017, 28, 681–690. (In Chinese) [Google Scholar]
- Allan, J.A. Fortunately There Are Substitutes for Water Otherwise Our Hydro-Political Futures Would Be Impossible; Prioritied for Water Resources Allocation and Management: London, UK, 1993; pp. 13–26. [Google Scholar]
- Allan, J.A. Virtual water: A strategic resource global solutions to regional deficit. Ground Water 1998, 36, 545–546. [Google Scholar] [CrossRef]
- Hoekstra, A.Y.; Hung, P.Q. Globalisation of water resources: International virtual water flows in relation to crop trade. Glob. Environ. Chang. Part A 2005, 15, 45–56. [Google Scholar] [CrossRef]
- Cucek, L.; Klemes, J.J.; Kravanja, Z. A review of footprint analysis tools for monitoring impacts on sustainability. J. Clean. Prod. 2012, 34, 9–20. [Google Scholar] [CrossRef]
- Su, J.J.; Tian, A.M.; Liu, B.G.; Tian, A.J. Overview of virtual water research. Shandong Chem. Ind. 2016, 45, 54–59. (In Chinese) [Google Scholar]
- Feng, C.Y. Evaluating the Water Footprint of the Energy Supply of China and Researching for Synergy Effects of Energy-Water Policy. Master’s Thesis, China University of Petroleum, Beijing, China, 2014. (In Chinese). [Google Scholar]
- Muller, M. The “nexus” as a step back towards a more coherent water resource management paradigm. Water Altern. 2015, 8, 675–694. [Google Scholar]
- Howells, M.; Rogner, H. Assessing integrated systems. Nat. Clim. Chang. 2014, 4, 246–247. [Google Scholar] [CrossRef]
- Liu, J.G.; Mooney, H.; Hull, V.; Davis, S.J.; Gaskell, J.; Hertel, T.; Lubchenco, J.; Seto, K.C.; Gleick, P.; Kremen, C.; et al. Systems integration for global sustainability. Science 2015, 347, 963. [Google Scholar] [CrossRef] [PubMed]
- Yuan, G.Y. Conservation and rational utilization of agricultural eco-environmental resources in Manas River Basin, Xinjiang, China. J. Arid Land Resour. Environ. 1993, 1, 463–465. (In Chinese) [Google Scholar]
- Zhang, X.S. Ecological restoration and sustainable agricultural paradigm of mountain-oasis-ecotone-desert system in the north of the Tianshan Mountains. Acta Bot. Sin. 2001, 43, 1294–1299. (In Chinese) [Google Scholar]
- Cheng, W.M.; Zhou, C.H.; Liu, H.J.; Zhang, Y.; Jiang, Y.; Zhang, Y.C.; Yao, Y.H. The oasis expansion and eco-environment change over the last 50 years in Manas River Valley, Xinjiang. Sci. China Ser. D Earth Sci. 2006, 49, 163–175. [Google Scholar] [CrossRef]
- Tang, X.Y. Research on Landscape Pattern and the Responses of the Runoff Variation in the Upstream of Manas River Basin during the last 40 Years. Master’s Thesis, Shihezi University, Xinjiang, China, 2016. (In Chinese). [Google Scholar]
- Cheng, G. Study on Agricultural Development and Oasis Ecosystem Evolution in Shihezi Reclamation Zone—Based on the Analysis about the Ecosystem Service Function. Master’s Thesis, Shihezi University, Xinjiang, China, 2013. (In Chinese). [Google Scholar]
- Feng, L.; Tian, X.M. The change of water resource distribution and its ecological effects caused by the agriculture development in Manasi River Valley in modern time. Agric. Hist. China 2006, 1, 119–126. (In Chinese) [Google Scholar]
- Gao, S.F.; Chen, D.H.; Wang, X.G.; Ma, Y.X. Analysis on Water Footprint of Shihezi City in 2008. J. Anhui Agri. Sci. 2010, 38, 20302–20303. (In Chinese) [Google Scholar]
- Ma, J.; Peng, J. Research progress on water footprint. Acta Ecol. Sin. 2013, 33, 5458–5466. (In Chinese) [Google Scholar]
- Aldaya, M.M.; Allan, J.A.; Hoekstra, A.Y. Strategic importance of green water in international crop trade. Ecol. Econ. 2010, 69, 887–894. [Google Scholar] [CrossRef]
- Falkenmark, M.; Rockstrom, J. The new blue and green water paradigm: Breaking new ground for water resources planning and management. J. Water Resour. Plan. Manag. 2006, 132, 129–132. [Google Scholar] [CrossRef]
- Chapagain, A.K.; Hoekstra, A.Y.; Savenije, H.; Gautam, R. The water footprint of cotton consumption: An assessment of the impact of worldwide consumption of cotton products on the water resources in the cotton producing countries. Ecol. Econ. 2005, 60, 186–203. [Google Scholar] [CrossRef]
- Chapagain, A.K.; Hoekstra, A.Y. Water trade: A qualification of virtual water flows between nations in relation to international trade of live-stock and livestock products. In Proceedings of the International Expert Meeting on Virtual Water Trade, Delft, The Netherlands, 12–13 December 2002; pp. 49–76. [Google Scholar]
- Cao, Y.T.; Li, Y.Y.; Zhang, W.S.; Xu, P.B.; Liu, J.G. Research background, methodological issues and significance on virtual water of crop and livestock production. Adv. Water Sci. 2004, 15, 829–834. (In Chinese) [Google Scholar]
- Huang, D.Y.; Yang, H. A study on water use of Xinjiang animal husbandry development from the perspective of water footprint. Water Sav. Irrig. 2018, 4, 96–98, 104. (In Chinese) [Google Scholar]
- Wang, H.R.; Wang, J.H. Virtual water content of livestock products in China. Environ. Sci. 2006, 4, 609–615. (In Chinese) [Google Scholar]
- Li, Y.J.; Zhao, J. Virtual water calculation and strategy research of agricultural and livestock products. Yellow River 2012, 34, 59–62. (In Chinese) [Google Scholar]
- Hou, X.M. Water Footprint and Influence Factors of Livestock Husbandry in Jilin Province. Master’s Thesis, Northeast Normal University, Shaanxi, China, 2016. (In Chinese). [Google Scholar]
- Chai, F.C.; Cheng, B.; Tan, Z.L. Research on water footprint of farm and animal products in Shihezi. China Rural Water Hydropower 2015, 11, 70–72. (In Chinese) [Google Scholar]
- Gu, J.C. Study of Water Footprint of Coal-Based Fuels with Life Cycle Assessment. Master’s Thesis, Shanghai Jiao Tong University, Shanghai, China, 2015. (In Chinese). [Google Scholar]
- Zhao, B.F. Research on Water Resources Characteristics and Its Rational Development Pattern for Arid Areas—A Case of Manas River Basin. Ph.D. Thesis, Chang’an University, Shaanxi, China, 2010. (In Chinese). [Google Scholar]
- Ma, L.J. Research on Hydro-Eco and Ecological Water Demand for Arid Areas—A Case of Manas River Basin. Master’s Thesis, Chang’an University, Shaanxi, China, 2011. (In Chinese). [Google Scholar]
- Department of Water Resources of Xinjiang Uygur Autonomous Region. Briefly Describe the Development and Utilization of Water Resources in Xinjiang. Available online: http://www.xjslt.gov.cn/2017/05/26/rdwd/56705.html (accessed on 26 May 2017).
- UNESCO. The United Nations World Water Development Report 2: Water, a Shared Responsibility; UNESCO: Paris, France, 2006. [Google Scholar]
- Conway, D.; van Garderen, E.A.; Deryng, D.; Dorling, S.; Krueger, T.; Landman, W.; Lankford, B.; Lebek, K.; Osborn, T.; Ringler, C.; et al. Climate and southern Africa’s water–energy–food nexus. Nat. Clim. Chang. 2015, 5, 837–846. [Google Scholar] [CrossRef]
- Smajgl, A.; Ward, J.; Pluschke, L. The water-food-energy nexus-realising a new paradigm. J. Hydrol. 2016, 533, 533–540. [Google Scholar] [CrossRef]
- Scanlon, B.R.; Ruddell, B.L.; Reed, P.M.; Hook, R.I.; Zheng, C.; Tidwell, V.C.; Siebert, S. The food-energy-water nexus: Transforming science for society. Water Resour. Res. 2017, 53, 3550–3556. [Google Scholar] [CrossRef]
- Jalilov, S.M.; Keskinen, M.; Varis, O.; Amer, S.; Ward, F.A. Managing the water-energy-food nexus: Gains and losses from new water development in Amu Darya River basin. J. Hydrol. 2016, 539, 648–661. [Google Scholar] [CrossRef]
- Hermann, S.; Welsch, M.; Segerstrom, R.E.; Howells, M.I.; Young, C.; Alfstad, T.; Rogner, H.-H.; Steduto, P. Climate, land, energy and water interlinkages in Burkina Faso: An analysis of agricultural intensification and bioenergy production. Nat. Resour. Forum 2012, 36, 245–262. [Google Scholar] [CrossRef]
- Shifflett, S.C.; Turner, J.L. Conflict of water-energy-food, both in China and America. China Econ. Rep. 2014, 37, 109–111. (In Chinese) [Google Scholar]
- Wang, X.J.; Miao, S.Y. An empirical analysis of the relationship between energy consumption and economic growth in Shihezi city. Xinjiang State Farms Econ. 2012, 11, 20–24. (In Chinese) [Google Scholar]
- Gulati, M.; Jacobs, I.; Jooste, A.; Naidoo, D.; Fakir, S. The water energy food security nexus: Challenges and opportunities for food security in South Africa. Aquat. Procedia 2013, 1, 150–164. [Google Scholar] [CrossRef]
- Rasul, G.; Sharma, B. The nexus approach to water-energy-food security: An option for adaptation to climate change. Clim. Policy 2015, 40, 895–910. [Google Scholar] [CrossRef]
- Jiang, L. Analysis on the trend of climate and runoff changes of Manas River Basin upstream. Environ. Prot. Xinjiang 2016, 38, 44–48. (In Chinese) [Google Scholar]
- Jiang, Y. Characteristics of climate change in the Manas River Basin and its impact on runoff. Heilongjiang Sci. Technol. Water Conserv. 2014, 42, 131–133. (In Chinese) [Google Scholar]
- Lu, P. Snow Monitoring and Snowmelt Runoff Simulation in Manas River Basin, Xinjiang Based on MODIS Data. Master’s Thesis, China University of Geosciences, Beijing, China, 2005. (In Chinese). [Google Scholar]


| Year | Cotton | Maize | Wheat | Meat | Eggs | Milk | Coal | Electricity |
|---|---|---|---|---|---|---|---|---|
| 2000 | 27.33 | 14.05 | 17.12 | 5.73 | 2.23 | 4.30 | 246.82 | 48.58 |
| 2005 | 36.95 | 17.73 | 11.62 | 8.39 | 3.35 | 15.01 | 478.92 | 57.09 |
| 2010 | 46.16 | 35.40 | 26.53 | 15.27 | 5.17 | 30.18 | 1271.17 | 148.16 |
| 2015 | 74.55 | 54.44 | 20.10 | 20.19 | 6.00 | 45.27 | 2548.69 | 445.11 |
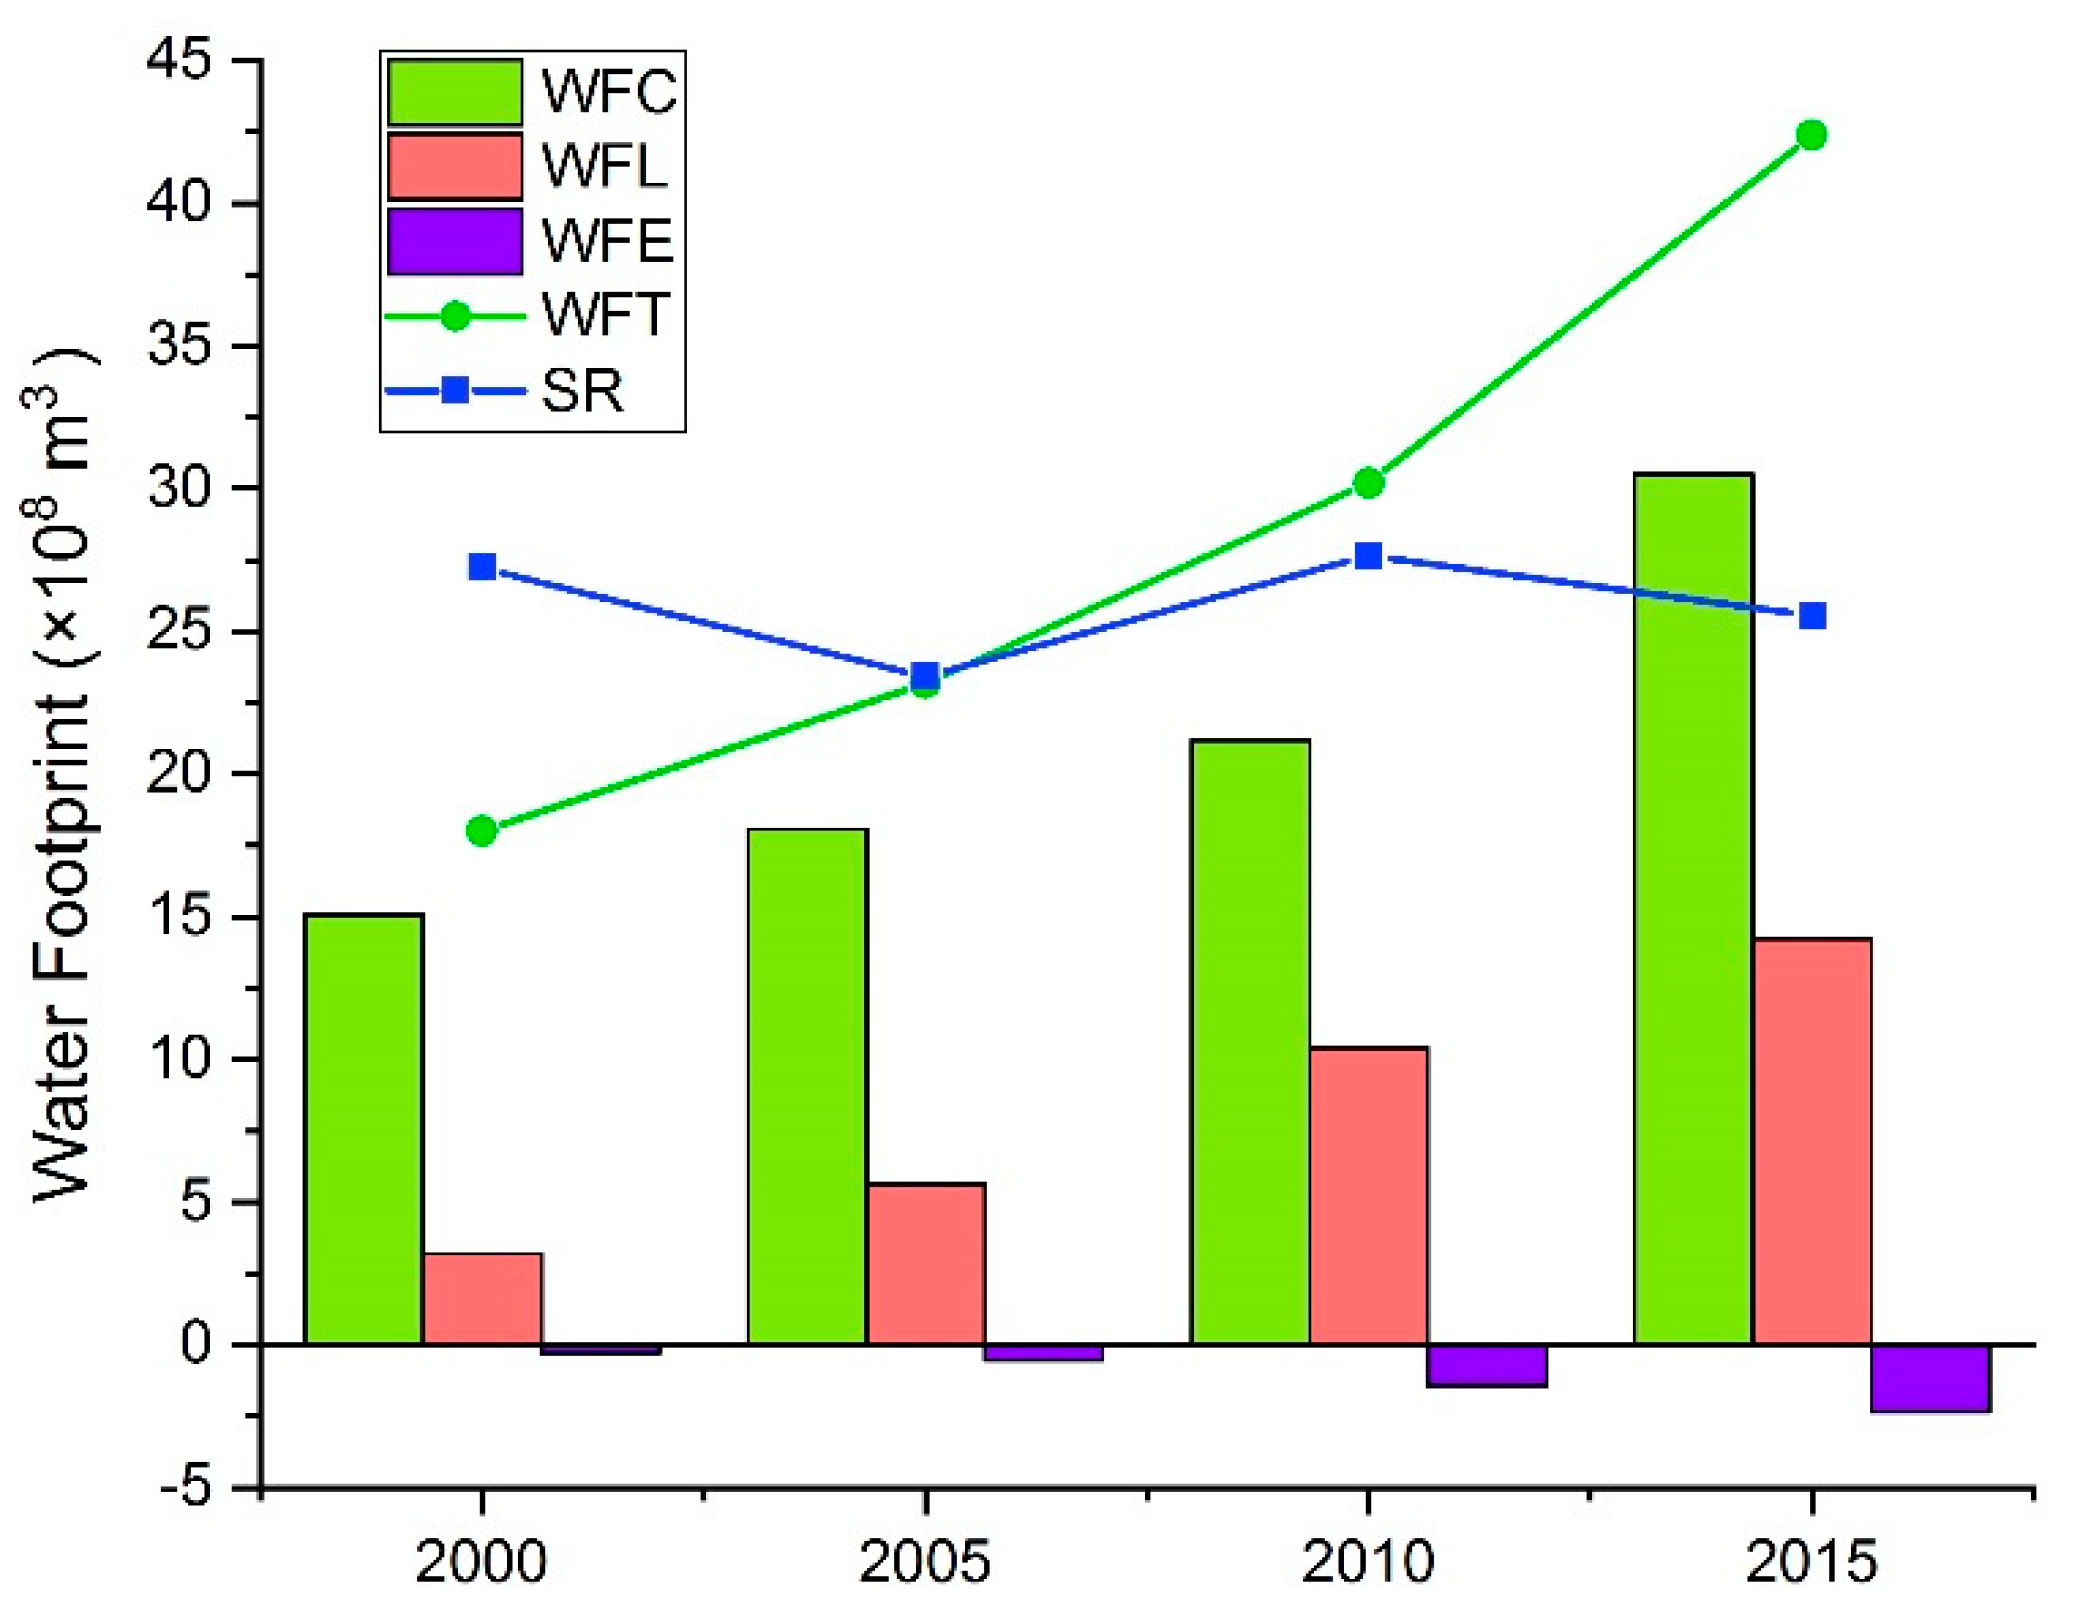
| Year | WFC | WFL | WFE | WFT | SR | WD |
|---|---|---|---|---|---|---|
| 2000 | 15.08 | 3.19 | −0.35 | 17.92 | 27.22 | −9.30 |
| 2005 | 18.08 | 5.64 | −0.63 | 23.09 | 23.41 | −0.33 |
| 2010 | 21.19 | 10.41 | −1.62 | 29.98 | 27.65 | 2.33 |
| 2015 | 30.52 | 14.21 | −2.98 | 41.75 | 25.54 | 16.21 |
| Year | Virtual Water (m3/kg) | Water Footprint (× 108 m3) | |||||
|---|---|---|---|---|---|---|---|
| Cotton | Wheat | Maize | Cotton | Wheat | Maize | WFC | |
| 2000 | 4.5 | 1.0 | 0.6 | 12.40 | 1.78 | 0.91 | 15.08 |
| 2005 | 4.3 | 1.0 | 0.7 | 15.72 | 1.15 | 1.21 | 18.08 |
| 2010 | 3.6 | 0.9 | 0.6 | 16.67 | 2.49 | 2.04 | 21.19 |
| 2015 | 3.3 | 1.2 | 0.6 | 24.84 | 2.32 | 3.37 | 30.52 |
| Year | Coal Production | Coal Consumption | Total Water Footprint | Surface Runoff | EDI | WPI |
|---|---|---|---|---|---|---|
| 2000 | 54.61 | 54.61 | 17.99 | 27.22 | 0.01 | 0.66 |
| 2005 | 72.77 | 188.95 | 23.17 | 23.41 | 0.61 | 0.99 |
| 2010 | 94.51 | 562.67 | 30.19 | 27.65 | 0.83 | 1.09 |
| 2015 | 11.55 | 2012.26 | 42.38 | 25.54 | 0.99 | 1.66 |
© 2019 by the authors. Licensee MDPI, Basel, Switzerland. This article is an open access article distributed under the terms and conditions of the Creative Commons Attribution (CC BY) license (http://creativecommons.org/licenses/by/4.0/).
Share and Cite
Zhang, P.; Xu, Z.; Fan, W.; Ren, J.; Liu, R.; Dong, X. Structure Dynamics and Risk Assessment of Water-Energy-Food Nexus: A Water Footprint Approach. Sustainability 2019, 11, 1187. https://doi.org/10.3390/su11041187
Zhang P, Xu Z, Fan W, Ren J, Liu R, Dong X. Structure Dynamics and Risk Assessment of Water-Energy-Food Nexus: A Water Footprint Approach. Sustainability. 2019; 11(4):1187. https://doi.org/10.3390/su11041187
Chicago/Turabian StyleZhang, Peng, Zihan Xu, Weiguo Fan, Jiahui Ren, Ranran Liu, and Xiaobin Dong. 2019. "Structure Dynamics and Risk Assessment of Water-Energy-Food Nexus: A Water Footprint Approach" Sustainability 11, no. 4: 1187. https://doi.org/10.3390/su11041187
APA StyleZhang, P., Xu, Z., Fan, W., Ren, J., Liu, R., & Dong, X. (2019). Structure Dynamics and Risk Assessment of Water-Energy-Food Nexus: A Water Footprint Approach. Sustainability, 11(4), 1187. https://doi.org/10.3390/su11041187