Article

Mode of Commuting TO and FROM School: A Similar or Different Pattern?

by
Manuel Herrador-Colmenero
1,2,*,
Manuel Escabias
3,
Francisco B. Ortega
1,
Noreen C. McDonald
4 and
Palma Chillón
1
1
PROFITH’ PROmoting FITness and Health through physical activity’ research group, Department of Physical Education and Sport, Faculty of Sport Sciences, University of Granada, Granada 18011, Spain
2
La Inmaculada Teacher Training Centre, University of Granada, Granada 18013, Spain
3
Department of statistics and Operation Research, University of Granada, Granada 18071, Spain
4
Department of City and Regional Planning, University of North Carolina at Chapel Hill, Chapel Hill, NC 27599-3140, USA
*
Author to whom correspondence should be addressed.
Sustainability 2019, 11(4), 1026; https://doi.org/10.3390/su11041026
Submission received: 15 January 2019 / Revised: 11 February 2019 / Accepted: 12 February 2019 / Published: 16 February 2019
(This article belongs to the Special Issue Education for Sustainability in Physical Education)

Abstract

:
Aims: The aims of this study were: a) to analyse the association between the mode of commuting to go and come back from school and b) to analyse the association between the usual mode of commuting and weekly counts of school trips by mode of commuting to and from school. Methods: A total of 5960 students (7–20 year old) participated in the study fulfilling the Mode and Frequency of Commuting to and from School Questionnaire. This is a self-reported questionnaire that included questions about personal data and the usual and weekly mode of commuting to go and come back from school. Results: There were differences between the modes of commuting to and from school in commuting by car and on foot in children and adolescents and by bus only in adolescents (all p ≤ 0.001). Reporting a usual mode of commuting indicated 7.7 travels/week (the maximum number of journeys is 10) using that same mode. Conclusion: Our results show the importance of assessing the mode of commuting in both directions and only one recall period (i.e., usual or the weekly mode of commuting).

1. Introduction

Active commuting to and from school (i.e., mainly walking and biking) has several health benefits. This behaviour has been associated in young people with higher levels of physical activity [1,2] and cardiorespiratory fitness, especially when biking [1,3,4]. Furthermore, a study concluded that active commuting might positively influence cognitive performance in adolescent girls [5].
Regarding the multiple health implications of active commuting to school, it is of interest to study the assessment of this behaviour. The most used method to assess active commuting to school in the scientific literature was a questionnaire [6,7]. However, a review examined the questions used for assessing the mode of commuting to and from school in 158 scientific studies and it concluded that these questions differ consistently between studies, regarding mainly two issues: the trip direction (i.e., to school, from school, or both) and the recall period (i.e., usual, last week…) [7].
Focusing on the trip direction, a 57% of the identified studies in the review asked for the mode of commuting to and from school and 37% of them asked only for the mode of commuting to school [7]. However, most of the studies who asked the two trip directions reported only one direction (i.e., mode of commuting to school) as the main outcome [7]. The specific association between the mode of commuting to and from school was not known. Only one study in this review assessed the association between the mode of commuting to and from school and they reported a high correlation [8]. However, since the mode of commuting is related to the geographical [9] and built environment [10,11,12], more studies in different populations are needed to verify this association.
Focusing on the recall period, “usual” has been the period most used in the questionnaires among the scientific literature [7]. Other recall periods have been asking about a specific day (i.e., yesterday, today), a typical week, or the past week [7]. Moreover, a self-reported travel to and from work over the previous seven days has been shown to be accurate and less susceptible to recall bias [13,14]. Consequently, the authors from the review and after analysing the literature, proposed and validated the “Mode and Frequency of Commuting to School Questionnaire” [15] to assess the mode of commuting to and from school, including both usual and weekly-day recall periods. Studies comparing both usual and weekly modes of commuting to and from school are lacking in the scientific literature.
Therefore, studies examining in detail the questions used for assessing the mode of commuting to and from school are lacking. It is of interest to analyse the questions regarding the trip direction and the recall period and set common, feasible, and standard questions in the scientific literature. This may help practitioners and researchers (from the health, environment, education, or urban fields), to easily evaluate the mode of commuting to school in the population and furthermore, it will facilitate inter-studies comparisons to guarantee a progressive knowledge within this research area. Consequently, a public health implication of this work is based on assessing the patterns of mode of commuting to school within a community or city as a main starting point, in order to invest more effectively in decreasing the use of cars and increasing the use of active modes of commuting. Additionally, the use of self-reported measures to assess this behaviour implies an investment of effort, time and money and it is more effective to use a previously valid and tested measure to obtain accurate and understandable data. The novelty of this study is to ensure an accurate method to assess the mode of commuting to and from school through analysing different trip directions and recall periods. Therefore, this study aimed: (a) to analyse the association between the mode of commuting to and from school and (b) to analyse the association between the usual and weekly mode of commuting to and from school.

2. Methods

2.1. Participants and Study Design

A total of 6004 students from 7 to 20 years old belonging to 41 schools selected by convenience, located in 25 cities within 4 provinces of the south of Spain (Almería, Granada, Jaén and Murcia) participated in this cross-sectional study. They completed the Mode and Frequency of Commuting to and from School Questionnaire [7,15]. The inclusion criterion was to have complete data on the questionnaire.
The research ethics committee from the University of Granada approved the study (case no. 817). Each school involved in the study was informed about the purpose and the nature of the study and had the student´s acceptance. Additionally, to take part in the study, participants had to present an informed parental consent signed by their parents or legal guardians. With the help of the teacher, students fulfilled the questionnaire in their classroom during school time. Finally, every school received from the research team a report with the data about the mode of commuting to school.

2.2. Mode of Commuting to and from School

The Mode and Frequency of Commuting to and from School Questionnaire is a valid tool [15] to assess the mode of commuting to and from school and it is a self-reported questionnaire suggested in the scientific literature [7]. The questionnaire included personal data (gender, age, educational stage, town, city and home address) and four questions: (a) the usual mode of commuting to school, (b) the usual mode of commuting from school, (c) the weekly counts of school trips by mode of commuting to school (i.e., weekly mode of commuting to school) and (d) the weekly counts of school trips by mode of commuting from school (i.e., weekly mode of commuting from school). Each question provided these response options: walk, bike, motorbike, car, bus and other (in this case, the mode was required).

2.3. Statistical analysis
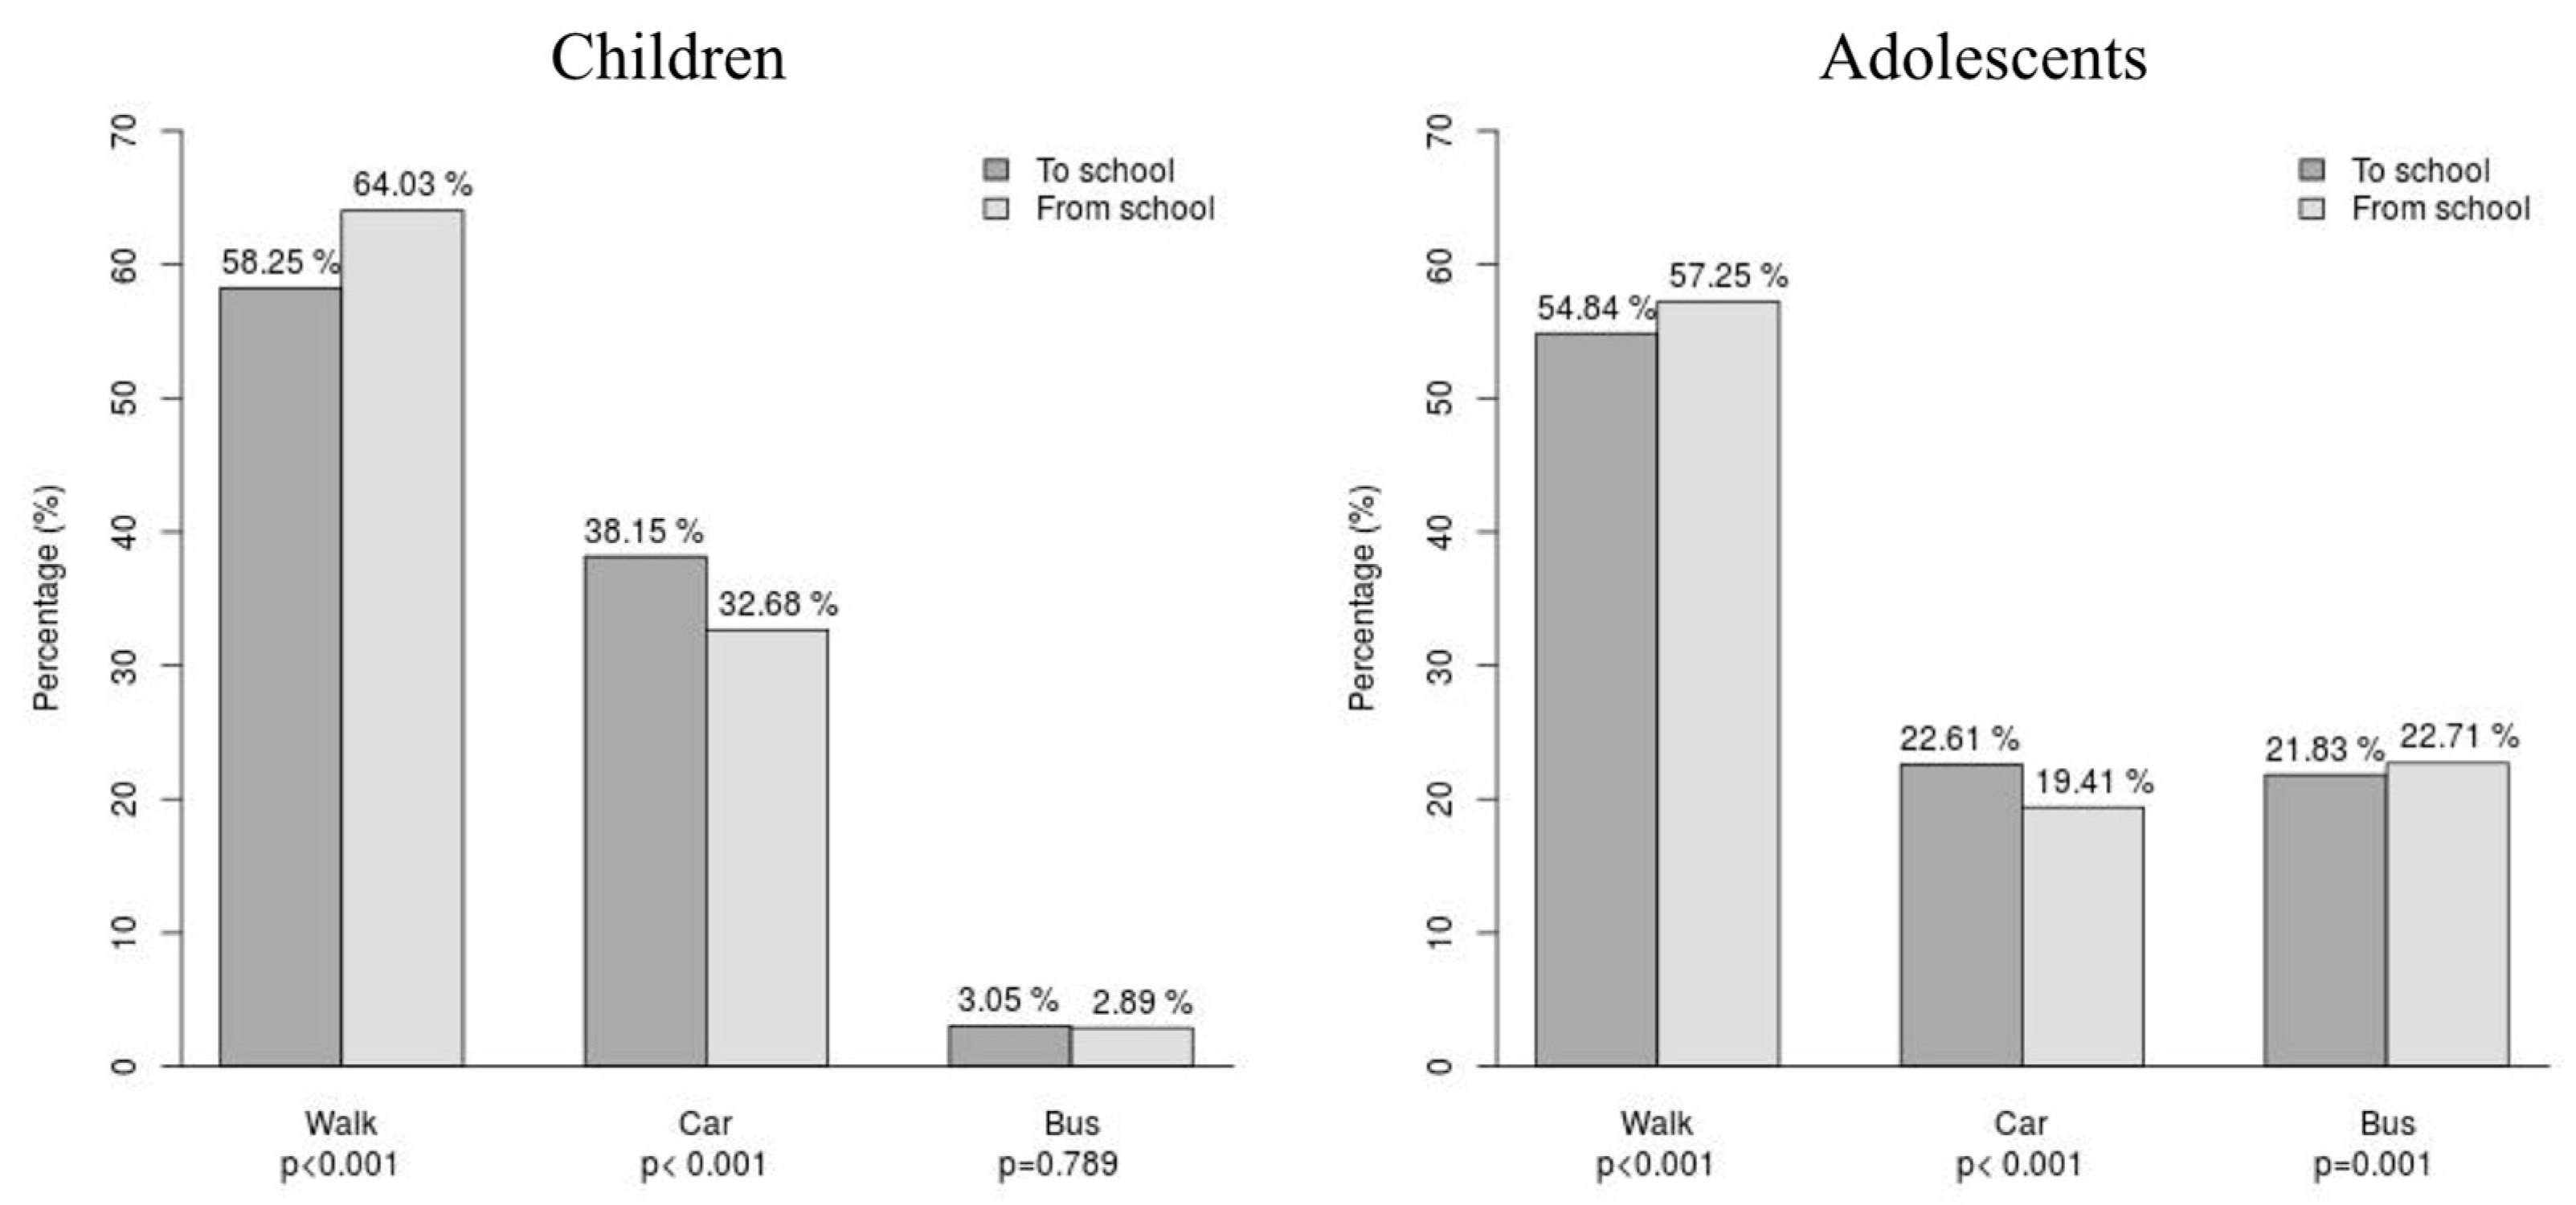
Descriptive analysis was undertaken in order to compare the modes of commuting from home to school and from school to home and they were summarized as percentages. A McNemar test was performed for each usual mode of commuting in order to test if there were differences between the proportion of students that used a specific mode of commuting to school and from school. Modes like bike and motorbike were omitted because of the low percentages obtained.
Descriptive data was used to analyse the association between the usual mode of commuting and the weekly mode of commuting. Data of the distribution, mean and standard deviation of the number of days per week for each usual mode of commuting were obtained. For example, for those students who marked walking as the usual mode of commuting to school, data were collected on how many of them reported walking 0, 1, 2, 3, 4, and 5 days in a week. Moreover, the mean and standard deviation of the number of days they walked was also obtained. These analyses were undertaken for each mode of commuting to school, from school, and total (regarding the 10 journeys of the week only for those participants who reported the same mode of commuting to go and back from school).
We used a one-tailed t-test to identify how many travels per week (0–5 for going and back and 0–10 for total) using a specific mode of commuting (i.e., walk, bike, car, motorcycle, bus) those participants reported with the same usual mode of commuting (i.e., walk, bike, car, motorcycle, bus). For each mode of commuting, we conducted 6 hypothesis tests (H0:µ = µ0 ; H1:µ > µ0) to go to school, 6 to come back from school and 11 to go and come back from school (i.e., total). For example, for the usual mode of walking to school we contrasted 6 null hypotheses (i.e., the mean number of travels per week that a student walked to school (µ) was equal to 0, 1, 2, 3, 4 and 5) against the alternative hypothesis (i.e., the mean number of travels per week that a student walked to school was greater than 0, 1, 2, 3, 4 and 5 respectively).
All the analyses were performed using R software, version 3.0.2 for x86_64-pc-linux-gnu (64-bit). The level of significance was set at p < 0.05.

3. Results

A total of 6004 students took part in the study and 33 students did not meet the inclusion criterion. Additionally, those students who answered the mode of commuting as “other” without writing the mode (n = 11, less than 1% of the total) were removed from the study because it was not possible to know the specific mode. The final sample size was 5960 students.
Table 1 showed descriptive data about the usual mode of commuting to and from school. Of the students who usually walked to school, a 94.74% of them also walked back from school. Of those students who usually used the car to school, 73.40% of them used the car from school and 20.97% walked from school. Of those students who usually used the bus to go to school, a 94.16% of them used the bus back from school.
Significant differences between the modes of commuting to and from school were displayed in the Figure 1. More than 55% of the students usually walked to and from school, more than 22% usually used the car to and from school, and around 18% of the students usually used the bus to and from school. There were statistically significant differences between the most used modes of commuting (i.e., walk, car, and bus, all p < 0.05). Percentages for walking (p < 0.001) and bus (p = 0.003) increased from school compared to going to school; however, percentages for car (p < 0.001) decreased in the way from school compared to the way to school. Bike and motorbike modes of commuting displayed similar percentages for the way to and from school. However, the bike and motorbike modes were not compared with the McNemar test because of their low observed frequencies.
Table 2 showed the associations between the usual mode of commuting and the weekly mode of commuting. Mean values higher than 4 travels per week to and from school were found for each usual mode of commuting to and from school respectively. Walking and bus showed the highest mean (i.e., 4.8) for both ways of commuting independently. Mean values around 8 travels per week were found for each usual mode of commuting including both trip directions (i.e., total). Walking and bus showed the highest mean (i.e., 9.2 and 9.1 respectively) for the total. Bike and motorbike had a low sample size, so mean values were not included in Table 2.
T-tests between usual and weekly mode of commuting to and from school were not performed for the mode of commuting on a bike and motorcycle because of the low sample size (<30 participants). T-tests between usual and weekly mode were significant from 0 to 4 travels per week for every mode of commuting in the week to and back from school, for every mode of commuting and they were not significant for 5 travels per week in the way to and back from school (data not shown). T-tests between usual and weekly mode were significant from 0 to 9 travels per week for walking, from 0 to 7 for car, and from 0 to 8 for bus in total (i.e., going to and coming back from school) and they were not significant for 10 travels walking, from 8 to 10 travels by car, and from 9 to 10 travels by bus in the total (data not shown).

4. Discussion

There were significant differences between the mode of commuting to school and from school for walking, car, and bus; there was a higher use of walking and bus and a lower use of car on the way from school compared to the way to school. Regarding the recall period, both usual and weekly modes of commuting showed a common pattern and children who reported a usual mode of commuting to and from school indicated around 8 travels per week using that same mode.
The results reported 3% more walkers on the way from school compared to the way to school and 3% more car commuters on the way to school compared to the way from school. The difference in the percentage of bus commuters was lower (1%). It seems that some children are driven to school in the morning time by their parents and they go back home by walking. A similar trend was obtained for Canadian [16], Iranian [17], and North American [18,19,20] young people reporting 8%, 6%, and 4% respectively more walkers on the trip from school than on the trip to school. Moreover, the number of students driven home from school was almost 10% and 6% lower than those driven to school in Canada [16] and North America [18] respectively. Actually, Larsen et al. [16] found that almost 60% of students reported that the driver of their vehicle was going somewhere else (besides home) after the drop off. Parents´ convenience to drive children to school has been previously reported as a main correlate on the mode of commuting to school [21,22]. Together with the lack of time in the morning time, this could be another reason for explaining the difference on the mode of commuting to and from school.
The mode of commuting to school has commonly been assessed asking for both trip directions (i.e., going to and coming back from school) but most of the scientific studies only reported one of the trip directions in the results (i.e., going to school) [7]. Presumably, there were no differences in the correlates of commuting to school in the travel to school versus the travel from school, although this information was not actually reported in several studies [7]. Attending to the results obtained in the current study and in the literature [7], we recommend asking about both trip directions on the Mode and Frequency of Commuting to and from School Questionnaire [7,15] in order to identify a similar or different pattern on the mode of commuting to and from school and provide a more accurate measurement.
Regarding the association between both usual and weekly mode of commuting, results showed a consistent pattern on the mode of commuting to and from school. Participants who reported a usual mode of commuting to and from school, reported a mean value of around 8 travels per week (of a maximum of 10 travels/week) using that similar mode. The modes of walking and bus showed the higher means for weekly travels (i.e., 9.2 and 9.1 respectively).
The current results showed a clear consistency between the two recall periods of usual and weekly mode of commuting. Moreover, we may confirm that a usual mode of commuting means to use that mode 8 or more times per week, regarding the participants in this study. These results provide further knowledge regarding the real meaning of usual among young people, which may be helpful for investigators in order to analyse what period recall to use when assessing the mode of commuting to and from school using a questionnaire.
There is previous evidence of merging two different recall periods on the mode of commuting to and from school in the same study [23,24]. Costa et al. [23] merged usual and previous day. They conducted two school-based studies carried between 2002 and 2007 with Brazilian children. In 2002, they asked for the main mode of transportation to school on a usual weekday [23]. The authors then became aware of a validation study that showed an improved recall of food consumption when children were asked to recall what they ate yesterday rather than what they usually eat [25]. For this reason, in 2007, children were asked to indicate the mode of transport used on the previous day rather than how they usually travelled to school. Asking about a specific moment (i.e., previous day) seems to be more valid but maybe it might differ from the usual behaviour. Bere et al. [24] merged the recall periods of a week and usually, the same that were examined in the current study. They used a study focused on Dutch adolescents and another on Norwegians adolescents. In the first, participants were asked how many days of the week (0 to 5) they travelled to school walking, cycling, or by public transport or car. Those cycling three days/week or more (i.e., the majority of the school days) were categorized as cyclists. In the second study they were asked by what mode of transportation do you usually go to school and response alternatives were: bus, car, walking, cycling, rollerblades, and scooter. Adolescents who reported cycling to school were categorized as cyclists. These authors used a number of 3 or more week travels to school (in the first study focused on Dutch) to identify it as a usual mode for cyclists and they used it in the second study focused on Norwegians. In the current study, we identified 4 or more week travels to school as a usual mode, regardless of the mode of commuting. Moreover, regarding the t-tests performed in the statistical analysis (results not shown), the number of week travels associated with a usual mode to school or from school was higher than 4 week travels.
This study has provided practical implications for practitioners (e.g., Physical Education teachers), stakeholders and governments in order to set an appropriate, feasible, and standard assessment of the patterns of the mode of commuting to school. This accurate assessment will economize efforts, time, and money when implementing strategies with the aim of reducing motorized modes and increasing active modes of commuting to school. The results provided in the current study contribute to conducting accurate surveys about the mode of commuting to school within the population, including both questions about the usual mode of commuting to and from school. The novelty of this study is to provide an instrument, which seems to be an accurate method to assess the mode of commuting to and from school.
The main limitation in the current study is the use of self-reported measures without including objective data to be able to compare it with. The result obtained from the participants using a self-report tool might help to obtain the results that the researcher expects. However, the purpose of the study was focusing on a questionnaire, which had previously been validated [15], that support the validity of the obtained results. The strengths are the novelty analysis in order to have a better understanding of how the mode of commuting to and from school is assessed through the questionnaire and the large sample size including children and adolescents.

5. Conclusions

The heterogeneity of the questions for assessing mode of commuting makes it difficult to compare prevalence between studies or to investigate the relationship between active commuting and health-related outcomes. In the other hand, practitioners and researchers should use a unique and universal questionnaire in order to save efforts, time, and money and allow the inter-studies comparisons. For this reason and as a conclusion, we recommend assessing the mode of commuting using the current questionnaire by including both trip directions (i.e., to and from school) and choosing one recall period (i.e., usual or weekly).

Author Contributions

Conceptualization, P.C. and F.B.O.; Methodology, M.E. and P.C.; Data Collection, M.H.C. and F.B.O.; Statistical Analysis, M.E.; Writing—Original Draft Preparation, M.H.C.; Writing—Review & Editing, M.H.C., M.E., F.B.O., N.C.M. and P.C.; Supervision, N.C.M. and P.C.; Project Administration, M.H.C. and P.C.; Funding Acquisition, M.H.C., P.C. and F.B.O.

Funding

This study was supported by the Spanish Ministry of Economy, Industry and Competitiveness and the European Regional Development Fund (DEP2016-75598-R, MINECO/FEDER, UE) and by the Spanish Ministry of Education under grant [FPU13/01088]. Additionally, this study takes place thanks to funding from the University of Granada, Plan Propio de Investigación 2016, Excellence actions: Units of Excellence; Unit of Excellence on Exercise and Health (UCEES), and by the Junta de Andalucía, Consejeria de Conocimiento, Investigación y Universidades and European Regional Development Fund (ERDF) [SOMM17/6107/UGR].

Acknowledgments

We would like to thank the multiple school officials, students, their teachers, and parents for their unconditional participation in this study without whom this project would not have been possible. We also acknowledge everyone who helped with the data collection and all the members involved in the fieldwork for their effort, enthusiasm and support. This study is part of a PhD thesis conducted in the Biomedicine Doctoral Studies program of the University of Granada, Spain.

Conflicts of Interest

The authors declare that there is no conflict of interest.

References

  1. Larouche, R.; Saunders, T.J.; Faulkner, G.E.J.; Colley, R.; Tremblay, M. Associations between active school transport and physical activity, body composition, and cardiovascular fitness: a systematic review of 68 studies. J. Phys. Act. Health 2014, 11, 206–227. [Google Scholar] [CrossRef] [PubMed]
  2. Van Dijk, M.L.; De Groot, R.H.; Van Acker, F.; Savelberg, H.H.; Kirschner, P.A. Active commuting to school, cognitive performance, and academic achievement: An observational study in Dutch adolescents using accelerometers. BMC Public Health 2014, 14, 799. [Google Scholar] [CrossRef] [PubMed]
  3. Chillón, P.; Ortega, F.B.; Ruiz, J.R.; Veidebaum, T.; Oja, L.; Mäestu, J.; Sjöström, M. Active commuting to school in children and adolescents: An opportunity to increase physical activity and fitness. Scand. J. Public Health 2010, 38, 873–879. [Google Scholar] [CrossRef] [PubMed]
  4. Ostergaard, L.; Kolle, E.; Steene-Johannessen, J.; Anderssen, S.A.; Andersen, L.B. Cross sectional analysis of the association between mode of school transportation and physical fitness in children and adolescents. Int. J. Behav. Nutr. Phys. Act. 2013, 10, 91. [Google Scholar] [CrossRef] [PubMed] [Green Version]
  5. Martínez-Gómez, D.; Ruiz, J.R.; Gómez-Martínez, S.; Chillón, P.; Rey-López, J.P.; Díaz, L.E.; Castillo, R.; Veiga, O.L.; Marcos, A. Active commuting to school and cognitive performance in adolescents: The AVENA study. Arch. Pediatr. Adolesc. Med. 2011, 165, 300–305. [Google Scholar] [CrossRef] [PubMed]
  6. Davison, K.K.; Werder, J.L.; Lawson, C.T. Children ’s Active Commuting to School: Current Knowledge and Future Directions. Prev. Chronic Dis. 2008, 5, A100. [Google Scholar] [PubMed]
  7. Herrador-Colmenero, M.; Pérez-García, M.; Ruiz, J.; Chillón, P. Assessing Modes and Frequency of Commuting to School in Youngsters: A Systematic Review. Pediatr. Exerc. Sci. 2014, 26, 291–341. [Google Scholar] [CrossRef]
  8. van Sluijs, E.M.F.; Fearne, V.A.; Mattocks, C.; Riddoch, C.; Griffin, S.J.; Ness, A. The contribution of active travel to children’s physical activity levels: cross-sectional results from the ALSPAC study. Prev. Med. (Baltim). 2009, 48, 519–524. [Google Scholar] [CrossRef]
  9. Oyeyemi, A.L.; Larouche, R. Prevalence and Correlates of Active Transportation in Developing Countries. In Children’s Active Transportation; Larouche, R., Ed.; Elsevier: Oxford, UK, 2018; pp. 173–191. ISBN 978-0-12-811931-0. [Google Scholar]
  10. Rodríguez-López, C.; Salas-Fariña, Z.M.; Villa-González, E.; Borges-Cosic, M.; Herrador-Colmenero, M.; Medina-Casaubón, J.; Ortega, F.B.; Chillón, P. The Threshold Distance Associated With Walking From Home to School. Heal. Educ. Behav. 2017, 44, 857–866. [Google Scholar] [CrossRef]
  11. Pabayo, R.; Gauvin, L.; Barnett, T.A. Longitudinal changes in active transportation to school in Canadian youth aged 6 through 16 years. Pediatrics 2011, 128, e404–e413. [Google Scholar] [CrossRef]
  12. Molina-García, J.; García-Massó, X.; Estevan, I.; Queralt, A. Built Environment, Psychosocial Factors and Active Commuting to School in Adolescents: Clustering a Self-Organizing Map Analysis. Int. J. Environ. Res. Public Health 2018, 16, 83. [Google Scholar] [CrossRef] [PubMed]
  13. Panter, J.; Griffin, S.; Jones, A.; Mackett, R.; Ogilvie, D. Correlates of time spent walking and cycling to and from work: Baseline results from the commuting and health in Cambridge study. Int. J. Behav. Nutr. Phys. Act. 2011, 8, 124. [Google Scholar] [CrossRef] [PubMed]
  14. Shannon, T.; Giles-Corti, B.; Pikora, T.; Bulsara, M.; Shilton, T.; Bull, F. Active commuting in a university setting: Assessing commuting habits and potential for modal change. Transp. Policy 2006, 13, 240–253. [Google Scholar] [CrossRef]
  15. Chillón, P.; Herrador-Colmenero, M.; Migueles, J.H.; Cabanas-Sánchez, V.; Fernández-Santos, J.R.; Veiga, Ó.L.; Castro-Piñero, J.; Marcos, A.; Bandrés, F.; Martínez-Gómez, D.; et al. Convergent validation of a questionnaire to assess the mode and frequency of commuting to and from school. Scand. J. Public Health 2017, 45, 612–620. [Google Scholar] [CrossRef] [PubMed]
  16. Larsen, K.; Gilliland, J.; Hess, P.M. Route-Based Analysis to Capture the Environmental Influences on a Child’s Mode of Travel between Home and School. Ann. Assoc. Am. Geogr. 2012, 102, 1348–1365. [Google Scholar] [CrossRef]
  17. Samimi, A.; Ermagun, A. Students’ Tendency to Walk to School: Case Study of Tehran. J. Urban Plan. Dev. 2013, 139, 144–152. [Google Scholar] [CrossRef]
  18. Seraj, S.; Sidharthan, R.; Bhat, C.R.; Pendyala, R.M.; Goulias, K.G. Parental Attitudes Toward Children Walking and Bicycling to School: Multivariate Ordered Response Analysis. Transp. Res. Rec. J. Transp. Res. Board 2012, 46–55. [Google Scholar] [CrossRef]
  19. Zhu, X.; Lee, C. Correlates of Walking to School and Implications for Public Policies: Survey Results from Parents of Elementary School Children in Austin, Texas. J. Public Health Policy 2009, 30, S177–S202. [Google Scholar] [CrossRef]
  20. McDonald, N.C.; Steiner, R.L.; Lee, C.; Rhoulac Smith, T.; Zhu, X.; Yang, Y. Impact of the Safe Routes to School Program on Walking and Bicycling. J. Am. Plan. Assoc. 2014, 80, 153–167. [Google Scholar] [CrossRef]
  21. Panter, J.; Corder, K.; Griffin, S.J.; Jones, A.P.; van Sluijs, E.M. Individual, socio-cultural and environmental predictors of uptake and maintenance of active commuting in children: Longitudinal results from the SPEEDY study. Int. J. Behav. Nutr. Phys. Act. 2013, 10, 83. [Google Scholar] [CrossRef]
  22. McDonald, N.C.; Aalborg, A.E. Why Parents Drive Children to School: Implications for Safe Routes to School Programs. J. Am. Plan. Assoc. 2009, 75, 331–342. [Google Scholar] [CrossRef] [Green Version]
  23. Costa, F.F.; Silva, K.S.; Schmoelz, C.P.; Campos, V.C.; de Assis, M.A.A. Longitudinal and cross-sectional changes in active commuting to school among Brazilian schoolchildren. Prev. Med. (Baltim). 2012, 55, 212–214. [Google Scholar] [CrossRef] [PubMed]
  24. Bere, E.; Oenema, A.; Prins, R.G.; Seiler, S.; Brug, J. Longitudinal associations between cycling to school and weight status. Int. J. Pediatr. Obes. 2011, 6, 182–187. [Google Scholar] [CrossRef] [PubMed]
  25. de Assis, M.A.A.; Rolland-cachera, M.F.; Grosseman, S.; de Vasconcelos, F.A.G.; Luna, M.E.P. Obesity, overweight and thinness in schoolchildren of the city of Florianopolis, Southern Brazil. Eur. J. Clin. Nutr. 2005, 59, 1015–1021. [Google Scholar] [CrossRef] [PubMed]
Figure 1. Differences between the usual mode of commuting to school and the usual mode of commuting from school in children and adolescents.
Sustainability 11 01026 g001
Table 1. Prevalence of the usual mode of commuting to school and the usual mode of commuting from school in children (mean age = 10.01 ± 1.22 years old) and adolescents (mean age = 14.27 ± 1.34 years old).
Children (n = 1279)
To schoolFrom school
WalkBikeCarMotorbikeBus
n (%)n(%)n(%)n(%)n(%)
Walk709(55.43)0(0.00)33(2.58)2(0.16)1(0.08)
Bike1(0.08)0(0.00)1(0.08)0(0.00)0(0.00)
Car105(8.21)0(0.00)376(29.40)2(0.16)5(0.39)
Motorbike2(0.16)0(0.00)2(0.16)1(0.08)0(0.00)
Bus2(0.16)0(0.00)6(0.47)0(0.00)31(2.42)
Adolescents (n = 4681)
To schoolFrom school
WalkBikeCarMotorbikeBus
n(%)n(%)n(%)n(%)n(%)
Walk2429(51.89)0(0.00)116(2.48)4(0.09)18(0.38)
Bike1(0.02)14(0.30)2(0.04)0(0.00)0(0.00)
Car220(4.70)0(0.00)759(16.21)4(0.09)75(1.60)
Motorbike5(0.11)0(0.00)3(0.06)7(0.15)2(0.04)
Bus25(0.53)0(0.00)28(0.60)1(0.02)968(20.68)
Note: Percentages refer to the total of participants (e.g., 55.43% of the participants usually walked to and from school; 2.58% of the participants usually walked to school and used the car from school).
Table 2. Differences between usual and daily mode of commuting in the last week.
Children (n = 1279)
Usual Mode of CommutingDaily Mode of Commuting (Number of Journeys per Week)Total
012345n (M ± SD)
To schoolWalkn (%)2 (0.27)1 (0.13)4 (0.54)31 (4.16)37 (4.97)670 (89.93)745 (4.83 ± 0.57)
Carn (%)1 (0.20)4 (0.82)22 (4.51)33 (6.76)32 (6.56)396 (81.15)488 (4.62 ± 0.88)
Busn (%)1 (2.56)1 (2.56)1 (2.56)3 (7.69)1 (2.56)32 (82.05)39 (4.51 ± 1.19)
From schoolWalkn (%)4 (0.49)5 (0.61)15 (1.83)41 (5.01)46 (5.62)708 (86.45)819 (4.74 ± 0.76)
Carn (%)2 (0.48)2 (0.48)12 (2.87)32 (7.66)25 (5.98)345 (82.54)418 (4.66 ± 0.84)
Busn (%)0 (0.00)1 (2.70)1 (2.70)3 (8.11)3 (8.11)29 (78.38)37 (4.57 ± 0.96)
0-12-34-56-78-910
TotalWalkn (%)4 (0.56)13 (1.83)80 (11.28)37 (5.22)61 (8.60)514 (72.50)709 (8.91 ± 2.06)
Carn (%)2 (0.53)18 (4.79)70 (18.62)41 (10.9)24 (6.38)221 (58.78)376 (8.15 ± 2.52)
Busn (%)0 (0.00)2 (6.45)9 (29.03)1 (3.23)4 (12.90)15 (48.39)31 (7.74 ± 2.65)
Adolescents (n = 4681)
Usual Mode of CommutingDaily Mode of Commuting (Number of Journeys per Week)Total
012345n (M ± SD)
To schoolWalkn (%)12 (0.47)3 (0.12)12 (0.47)47 (1.83)68 (2.65)2425 (94.47)2567 (4.89 ± 0.52)
Carn (%)11 (1.04)2 (0.19)12 (1.13)32 (3.02)47 (4.44)954 (90.17)1058 (4.80 ± 0.72)
Busn (%)7 (0.68)3 (0.29)8 (0.78)15 (1.47)25 (2.45)964 (94.32)1022 (4.88 ± 0.60)
From schoolWalkn (%)6 (0.22)5 (0.19)16 (0.60)49 (1.83)99 (3.69)2505 (93.47)2680 (4.89 ± 0.49)
Carn (%)14 (1.54)6 (0.66)18 (1.98)43 (4.74)75 (8.26)752 (82.82)908 (4.66 ± 0.91)
Busn (%)2 (0.19)2 (0.19)8 (0.75)21 (1.98)37 (3.48)993 (93.41)1063 (4.89 ± 0.50)
0-12-34-56-78-910
TotalWalkn (%)7 (0.29)17 (0.70)292 (12.02)70 (2.88)155 (6.38)1888 (77.73)2429 (9.11 ± 1.87)
Carn (%)11 (1.45)13 (1.71)244 (32.15)44 (5.80)53 (6.98)394 (51.91)759 (7.77 ± 2.60)
Busn (%)2 (0.21)8 (0.83)75 (7.75)13 (1.34)38 (3.93)932 (85.95)968 (9.41 ± 1.63)
Note: M, mean; SD, standard deviation; Mean age for children is 10.01 ± 1.22 years old and for adolescents is 14.27 ± 1.34 years old.

