Computer-Based Concept Mapping as a Method for Enhancing the Effectiveness of Concept Learning in Technology-Enhanced Learning

Abstract
1. Introduction
- Can a computer-based mapping (CBCM) environment combined with Google Classroom reduce the students’ misconceptions?
- Can a computer-based mapping (CBCM) environment combined with Google Classroom improve the students’ problem solving skills?
- What are the students’ perceptions of the computer-based mapping (CBCM) environment combined with Google Classroom?
2. Theoretical Background
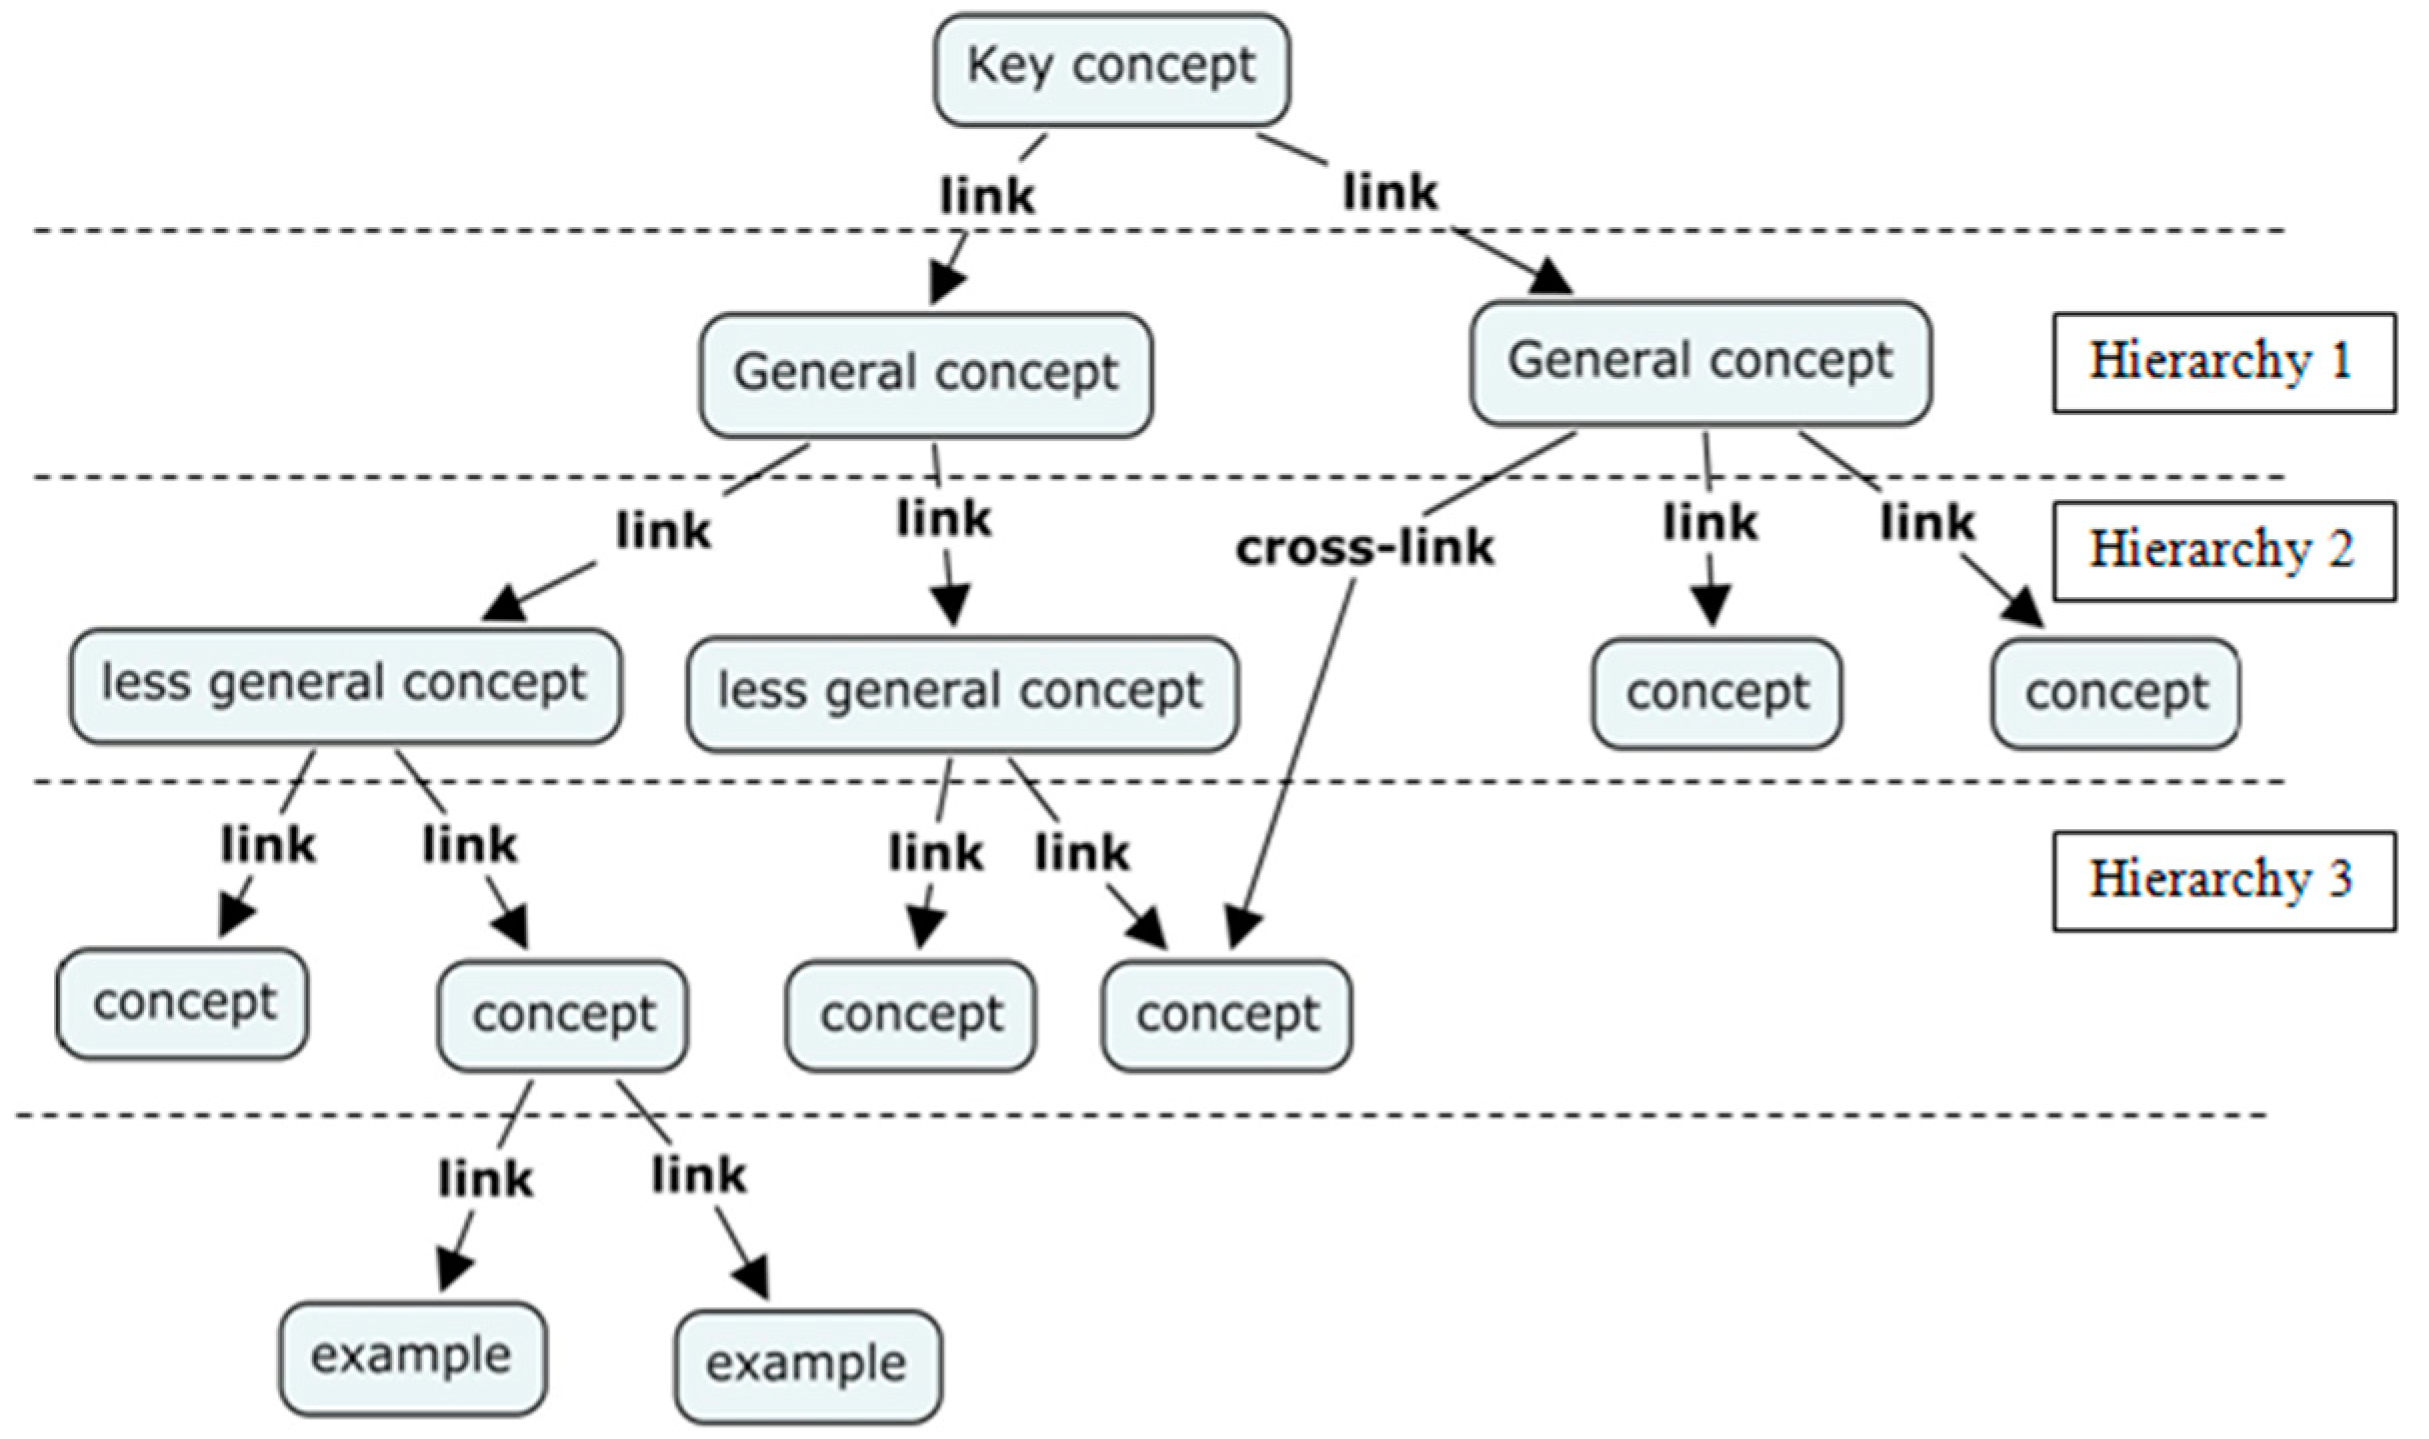
2.1. Concept Mapping
2.2. Computer-Based Concept Mapping
- they are user-friendly and corrections can be made more efficiently; the nodes can be quickly added, corrected, or deleted;
- the convenience of communication with peers: Students can obtain precise information by showing the concept maps on the screen to each other and then discussing them;
- they support the active learning strategies of feedback and evaluation and they can present common online tools for map history functions [34].
2.3. Problem Solving Skills
2.4. Google Classroom
3. Methodology
3.1. Research Design
3.2. Participants
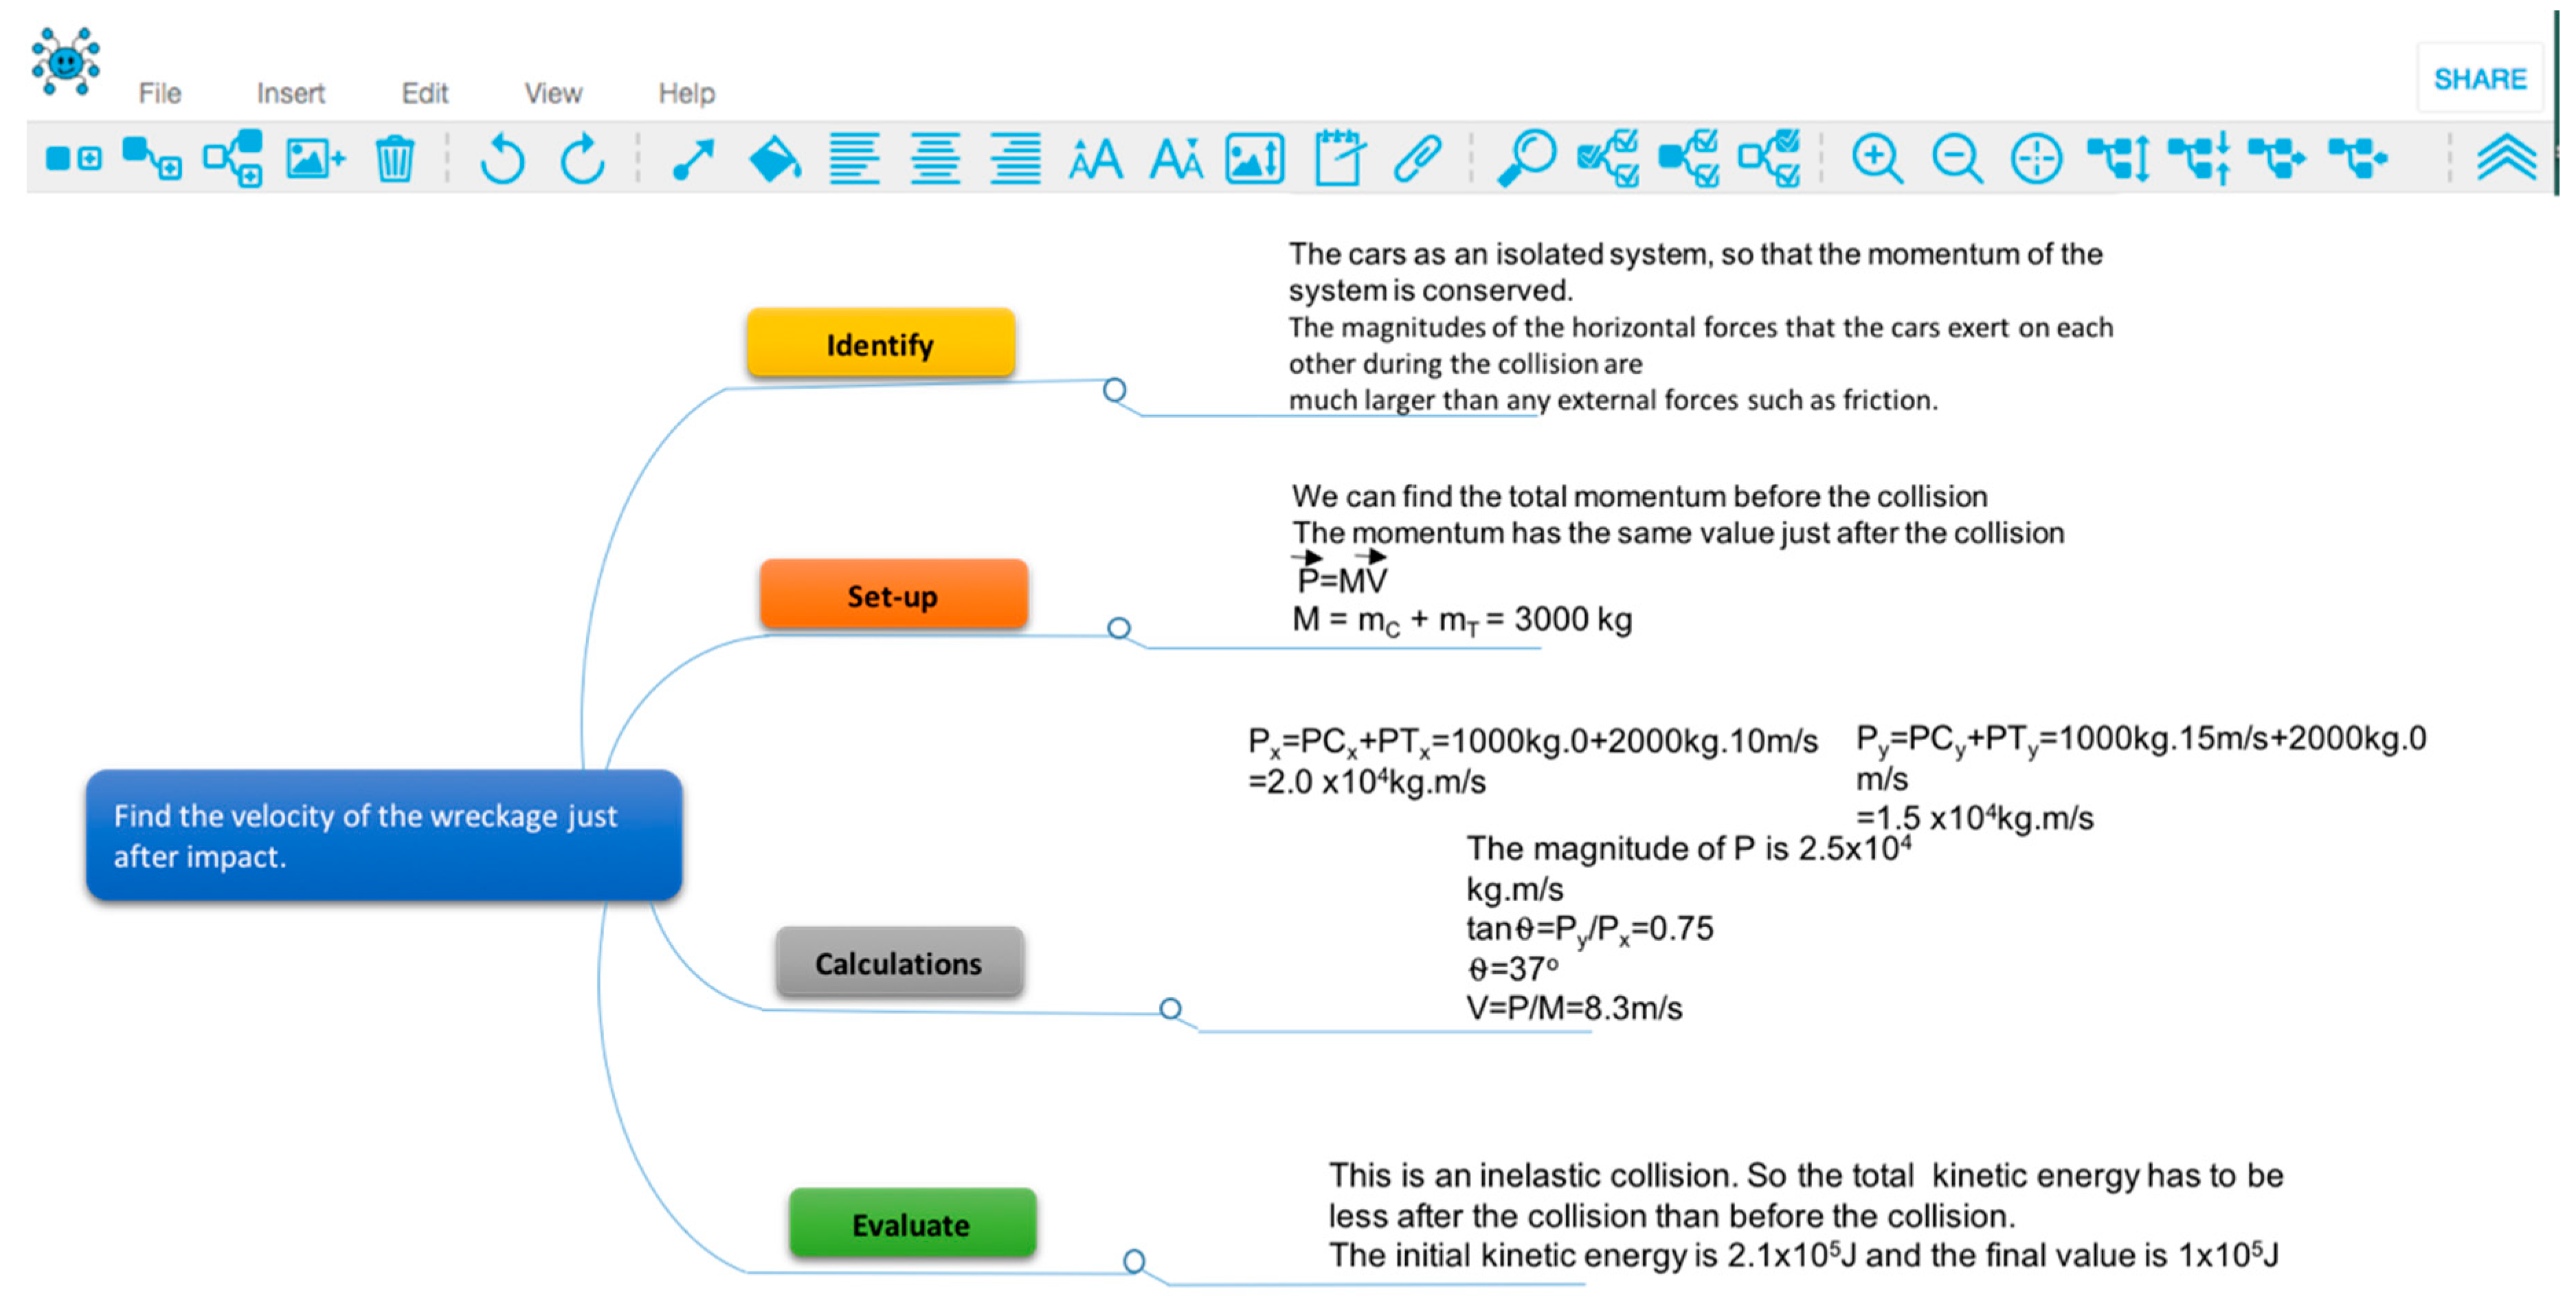
3.3. Concept Mapping Application
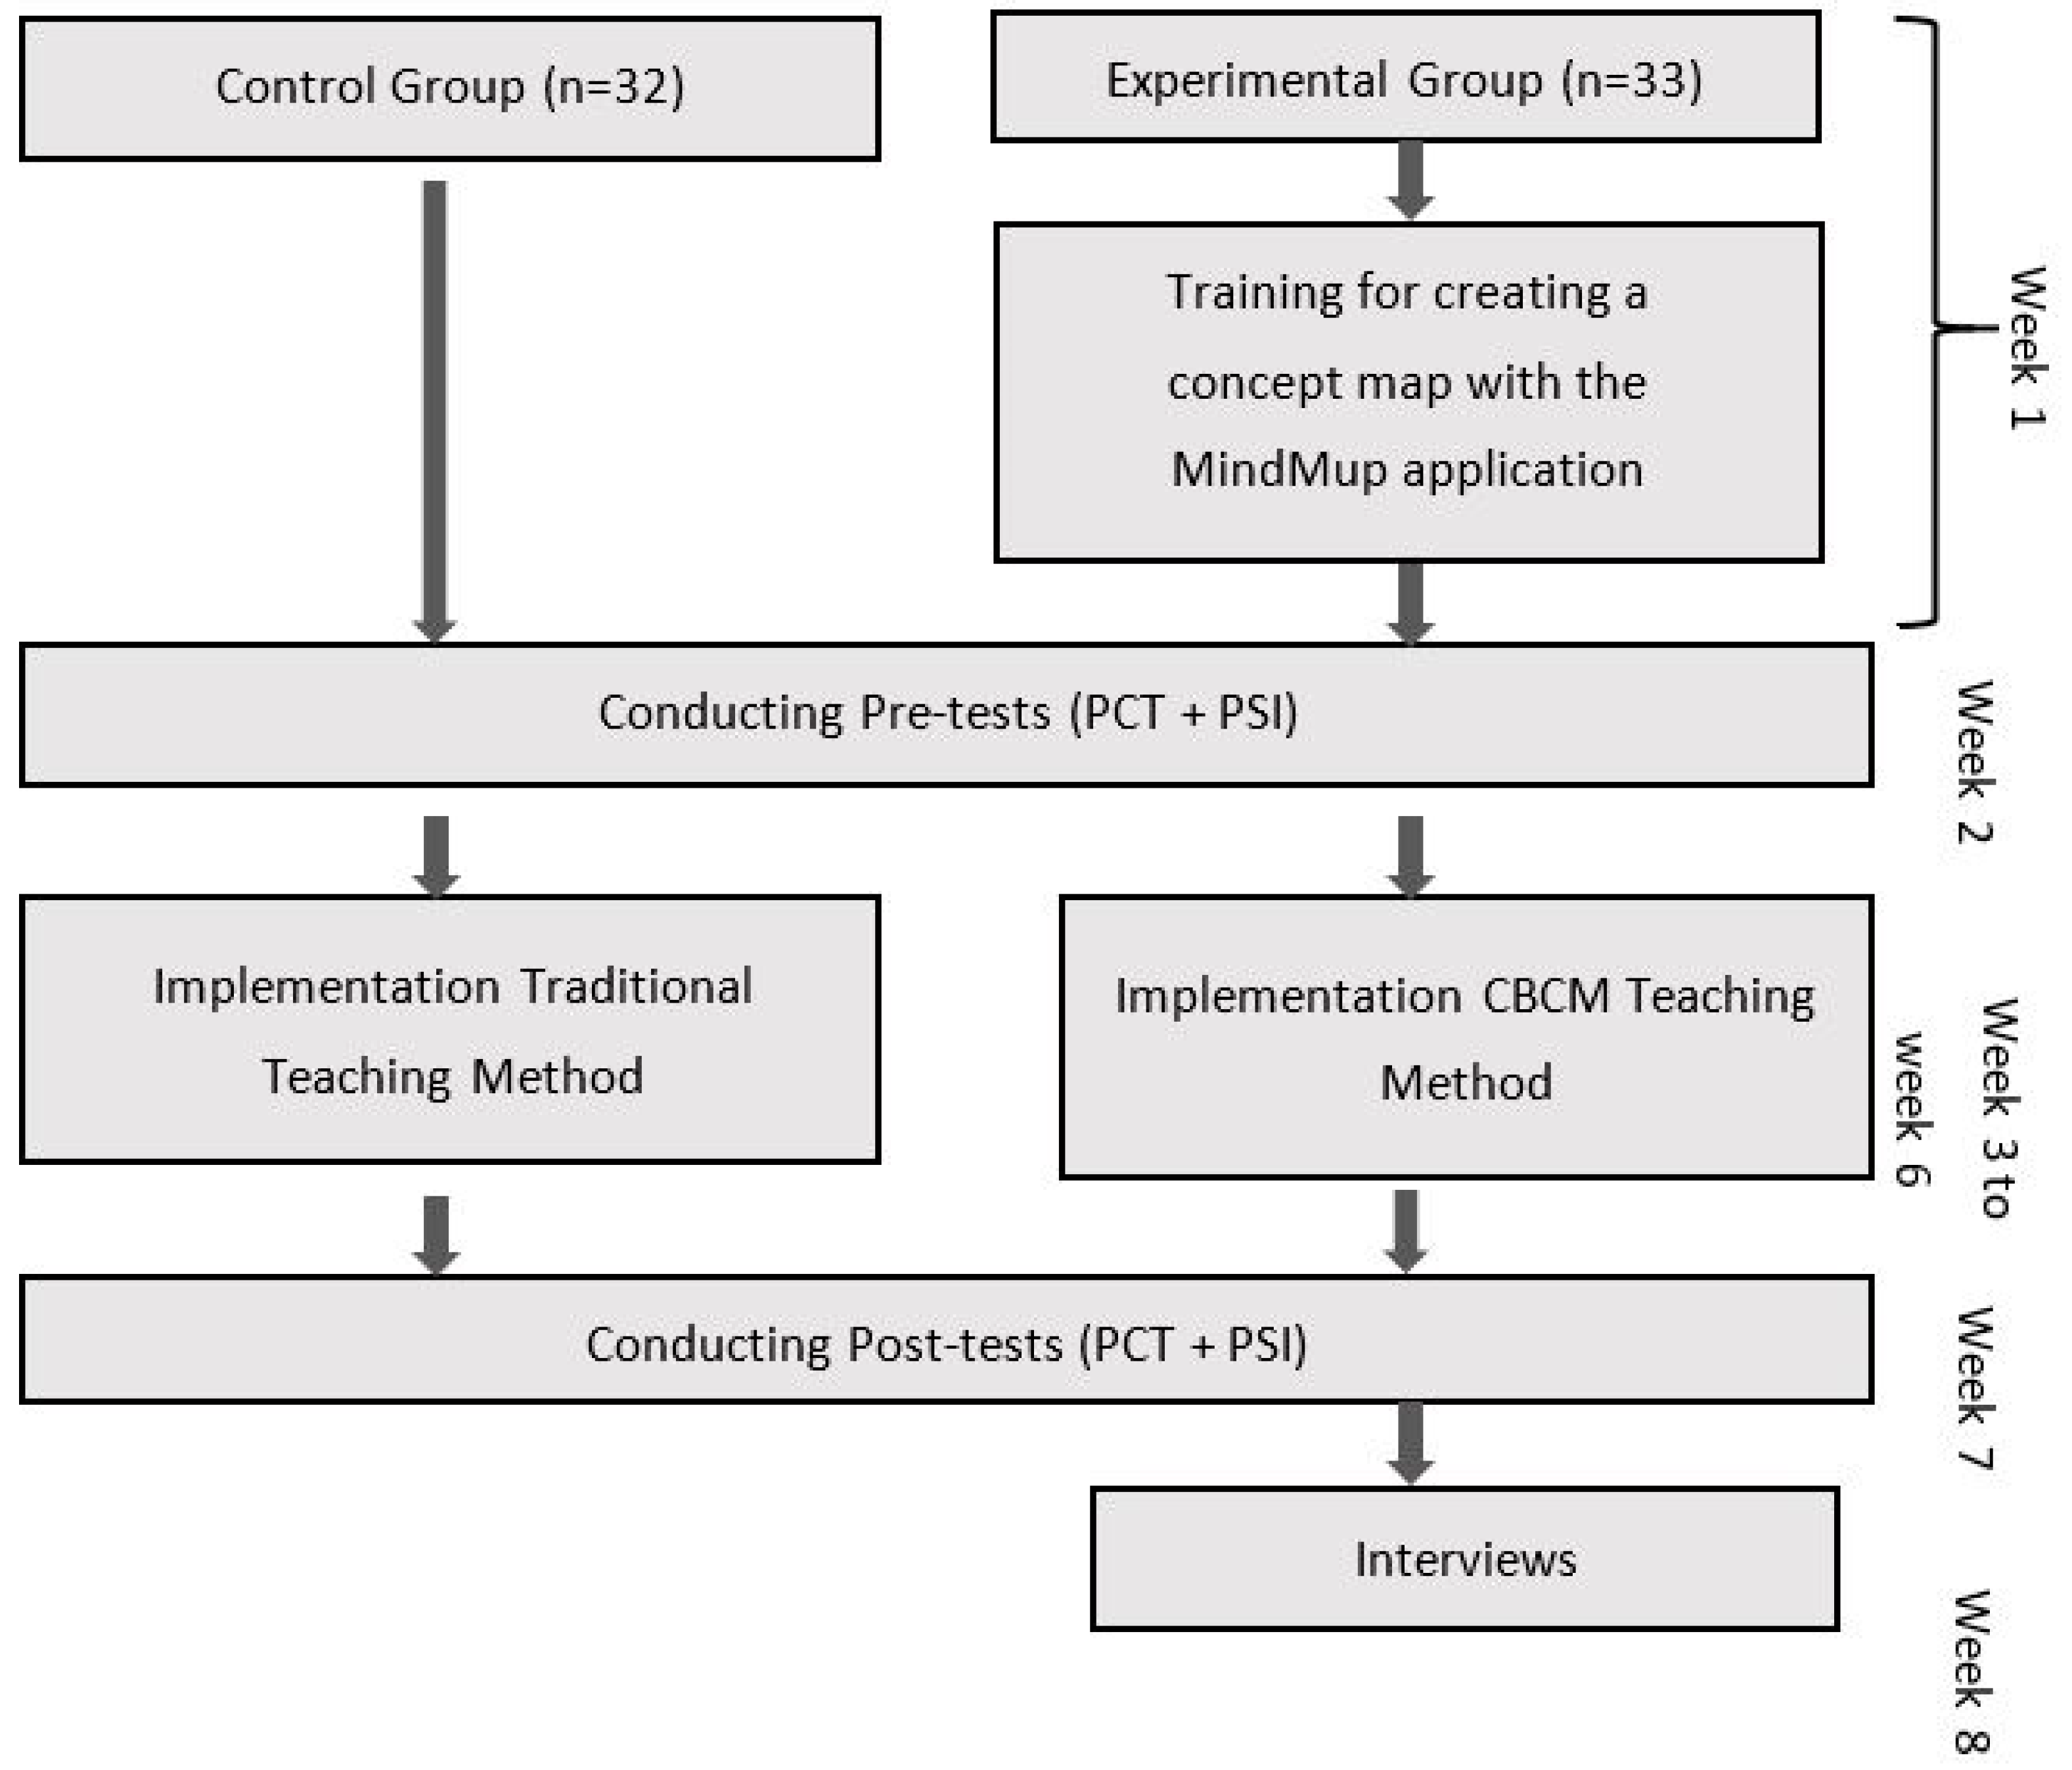
3.4. Experimental Procedure
3.5. Data-Collecting Tools
3.5.1. Physics Concept Test (PCT)
3.5.2. Problem Solving Inventory (PSI)
3.5.3. Semi-Structured Interview
3.6. Data Analysis
4. Results
4.1. Physics Conceptions
4.2. Problem Solving Skills
4.3. Students’ Perceptions
“It has enabled me to link my prior knowledge and new knowledge. Thus, more meaningful learning has occurred.”(S11)
“I always memorized information in physics classes. I did not know what the concepts actually meant. I used to solve problems by placing the variables into the formulas. I can understand the concepts with this approach.”(S4)
“I found out that some of the physics information that I learned in high school was wrong. Therefore, I corrected my wrong knowledge.”(S9)
5. Discussion and Conclusions
6. Limitations and Future Research
Funding
Acknowledgments
Conflicts of Interest
References
- Watson, M.K.; Pelkey, J.; Noyes, C.R.; Rodgers, M.O. Use of Concept Maps to Assess Student Sustainability Knowledge. In Proceedings of the American Society for Engineering Education Annual Conference and Exposition, Indianapolis, IN, USA, 15–18 June 2014. [Google Scholar]
- Hansmann, R.; Hansmann, R. “Sustainability Learning”: An Introduction to the Concept and Its Motivational Aspects. Sustainability 2010, 2, 2873–2897. [Google Scholar] [CrossRef]
- Daniela, L.; Visvizi, A.; Gutiérrez-Braojos, C.; Lytras, M.D. Sustainable Higher Education and Technology-Enhanced Learning (TEL). Sustainability 2018, 10, 3883. [Google Scholar] [CrossRef]
- Riche, R.D. Strategies for Assisting Students to Overcome Their Misconceptions in High School Physics; Memorial University of Newfoundland Education: St. John’s, NL, Canada, 2000; p. 6390. [Google Scholar]
- Ormrod, J.E. Educational Psychology, Developing Learners, 4th ed.; Merrill Prentice Hall: Upper Saddle River, NJ, USA, 2003. [Google Scholar]
- Sadanand, N.; Kess, J. Concepts in force and motion. Phys. Teach. 1990, 28, 530–533. [Google Scholar] [CrossRef]
- Wang, M.; Wu, B.; Kirschner, P.A.; Spector, J.M. Using cognitive mapping to foster deeper learning with complex problems in a computer-based environment. Comput. Hum. Behav. 2018, 87, 450–458. [Google Scholar] [CrossRef]
- Novak, J.D.; Musonda, D. A Twelve-Year Longitudinal Study of Science Concept Learning. Am. Educ. Res. J. 1991, 28, 117–153. [Google Scholar] [CrossRef]
- Novak, J.; Gowin, B. Learning How to Learn; Cambridge University Press: New York, NY, USA, 1984. [Google Scholar]
- Ausubel, D.P. The Psychology of Meaningful Verbal Learning; Grune & Stratton: New York, NY, USA, 1963. [Google Scholar]
- Novak, J.D. Learning, Creating, and Using Knowledge: Concept Maps as Facilitative Tools in Schools and Corporations, 2nd ed.; Routledge: Abingdon, UK, 2010. [Google Scholar]
- Visvizi, A.; Lytras, M.; Daniela, L. Education, innovation and the prospect of sustainable growth and development. In The Future of Innovation and Technology in Education: Policies and Practices for Teaching and Learning Excellence; Visvizi, A., Lytras, M., Daniela, L., Eds.; Emerald Publishing: Bingley, UK, 2018. [Google Scholar]
- Chang, K.E.; Yao-Ting, S.; Rey-Bin, C.; Shui-Cheng, L. A new assessment for computer-based concept mapping. J. Educ. Technol. Soc. 2005, 8, 138–148. [Google Scholar]
- Rautama, E. Extending the Delivery of Concept Maps. In Proceedings of the AAPS Project, ITiCSE2000, The 5th Annual Conference on Innovation and Technology in Computer Science Education, Helsinki, Finland, 11–13 July 2000. [Google Scholar]
- Shute, V.J.; Jeong, A.C.; Spector, J.M.; Seel, N.M.; Johnson, T.E. Model-based methods for assessment, learning and instruction: Innovative educational technology at Florida state university. In Educational Media and Technology Yearbook; Springer: Boston, MA, USA, 2009; pp. 61–79. [Google Scholar]
- Gijlers, H.; de Jong, T. Using concept maps to facilitate collaborative simulation-based inquiry learning. J. Learn. Sci. 2013, 22, 340–374. [Google Scholar] [CrossRef]
- Hwang, G.J.; Kuo, F.R.; Chen, N.S.; Ho, H.J. Effects of an integrated concept mapping and web-based problem-solving approach on students’ learning achievements, perceptions and cognitive loads. Comput. Educ. 2014, 71, 77–86. [Google Scholar] [CrossRef]
- Jonassen, D.H. Learning to Solve Problems. An Instructional Design Guide; John Wiley & Sons: San Francisco, CA, USA, 2004. [Google Scholar]
- Denton, P.; Madden, J.; Roberts, M.; Rowe, P. Students’ response to traditional and computer-assisted formative feedback: a comparative case study. Brit. J. Educ. Technol. 2008, 39, 486–500. [Google Scholar] [CrossRef]
- Wu, P.H.; Hwang, G.J.; Milrad, M.; Ke, H.R.; Huang, Y.M. An innovative concept map approach for improving students’ learning performance with an instant feedback mechanism. Brit. J. Educ. Technol. 2012, 43, 217–232. [Google Scholar] [CrossRef]
- Lin, Y.T.; Chang, C.H.; Hou, H.T.; Wu, K.C. Exploring the effects of employing Google Docs in collaborative concept mapping on achievement, concept representation, and attitudes. Interact. Learn. Environ. 2015, 24, 1–22. [Google Scholar] [CrossRef]
- Harini, L.P.I.; Nilakusmawati, D.P.; Astawa, I.G.S. Solve Miscellaneous Mathematical Problems using Mind Map. Global J. Pure Appl. Math. 2017, 13, 7441–7451. [Google Scholar]
- Hwang, G.J.; Chen, M.R.A.; Sung, H.Y.; Lin, M.H. Effects of integrating a concept mapping-based summarization strategy into flipped learning on students’ reading performances and perceptions in Chinese courses. Br. J. Educ. Technol. 2018. [Google Scholar] [CrossRef]
- Ruiz-Primo, M.A.; Schultz, S.E.; Li, M.; Shavelson, R.J. Comparison of the reliability and validity of scores from two concept-mapping techniques. J. Res. Sci. Teach. 2001, 38, 260–278. [Google Scholar] [CrossRef]
- Moon, B.; Hoffman, R.R.; Novak, J.; Canas, A. (Eds.) Applied Concept Mapping: Capturing, Analyzing, and Organizing Knowledge; CRC Press: Boca Raton, FL, USA, 2011. [Google Scholar]
- Dosanjh, N.K. The Effects of Three Concept Mapping Strategies on Seventh-Grade Students’ Science Achievement at An Urban Middle School. Ph.D. Thesis, The University of San Francisco, San Francisco, CA, USA, 2011. [Google Scholar]
- Nakipoglu, C.; Ertem, H. Comparison of the Structural, Relational and Proposition Accuracy Scoring Results of Concept Maps about Atom. J. Turk. Sci. Educ. 2010, 7, 60–77. [Google Scholar]
- Akinoglu, O.; Yasar, Z. The Effects of Note-Taking in Science Education Through the Mind Mapping Technique on Students’ attitudes, Academic Achievement and Concept Learning. J. Balt. Sci. Educ. 2007, 6, 34–43. [Google Scholar]
- Conradty, C.; Bogner, F.X. Implementation of concept mapping to novices: reasons for errors, a matter of technique or content? Educ. Stud. 2010, 36, 47–58. [Google Scholar] [CrossRef]
- Watson, M.K.; Pelkey, J.; Noyes, C.R.; Rodgers, M.O. Assessing conceptual knowledge using three concept map scoring methods. J. Eng. Educ. 2016, 105, 118–146. [Google Scholar] [CrossRef]
- Lin, Y.S.; Chang, Y.C.; Liew, K.H.; Chu, C.P. Effects of concept map extraction and a test-based diagnostic environment on learning achievement and learners’ perceptions. Br. J. Educ. Technol. 2016, 47, 649–664. [Google Scholar] [CrossRef]
- Chang, C.-C.; Liu, G.-Y.; Chen, K.-J.; Huang, C.-H.; Lai, Y.-M.; Yeh, T.-K. The Effects of a Collaborative Computer-based Concept Mapping Strategy on Geographic Science Performance in Junior High School Students. Eurasıa J. Math. Sci. Technol. Educ. 2017, 13, 5049–5060. [Google Scholar] [CrossRef]
- Mammen, J.R. Computer-assisted concept mapping: Visual aids for knowledge construction. J. Nurs. Educ. 2016, 55, 403–406. [Google Scholar] [CrossRef] [PubMed]
- Chiou, C.-C.; Lee, L.-T.; Tien, L.-C.; Wang, Y.-M. Analyzing the Effects of various Concept Mapping Techniques on Learning Achievement under different Learning Styles. Eurasıa J. Math. Sci. Technol. Educ. 2017, 13, 3687–3708. [Google Scholar] [CrossRef]
- Plotnick, E. Concept Mapping: A Graphical System for Understanding the Relationship Between Concepts. In ERIC Digest. Available online: https://files.eric.ed.gov/fulltext/ED407938.pdf (accessed on 22 July 2018).
- Liu, P.L.; Chen, C.J.; Chang, Y.J. Effects of a computer-assisted concept mapping learning strategy on EFL college students’ English reading comprehension. Comput. Educ. 2010, 54, 436–445. [Google Scholar] [CrossRef]
- Hwang, G.J.; Wu, P.H.; Ke, H.R. An interactive concept map approach to supporting mobile learning activities for natural science courses. Comput. Educ. 2011, 57, 2272–2280. [Google Scholar] [CrossRef]
- Chu, H.C.; Hwang, G.J.; Liang, Y.R. A cooperative computerized concept-mapping approach to improving students’ learning performance in web-based information-seeking activities. J. Comput. Educ. 2014, 1, 19–33. [Google Scholar] [CrossRef]
- Shamsuddin, I.M.; Aminu, I.; Shamsiyya, A.; Adamu, A.M. Influence of Computer Assisted Concept Mapping Instructional Strategy on Students Performance in Chemistry. Teach. Educ. Curric. Stud. 2017, 2, 86–92. [Google Scholar] [CrossRef]
- Altun, I. The perceived problem-solving ability and values of student nurses and midwives. Nurs. Educ. Today 2003, 23, 575–584. [Google Scholar] [CrossRef]
- Wu, T.; Custer, T.L.; Dyrenfurth, M.J. Technological and personal problem-solving styles: Is there a difference? J. Technol. Educ. 1996, 7, 55–71. [Google Scholar] [CrossRef]
- Ocak, G.; Eğmir, E. Investigation of pre-service teachers’ problem-solving skills in terms of different variables. Asian J. Instruct. 2014, 2, 27–45. [Google Scholar]
- Miller, M.; Nunn, G.D. Using group discussion to improve social problem solving and learning. Education 2001, 121, 470–475. [Google Scholar]
- Wang, M.; Derry, S.; Ge, X. Guest Editorial: Fostering deep learning in problem-solving contexts with the support of technology. Educ. Technol. Soc. 2017, 20, 162–165. [Google Scholar]
- González, H.; Palencia, A.; Umaña, L.; Galindo, L.; Villafrade, L. Mediated learning experience, and concept maps: A pedagogical tool for achieving meaningful learning in medical physiology students. Adv. Physiol. Educ. 2008, 32, 312–316. [Google Scholar] [CrossRef] [PubMed]
- Sarker, P. Use of concept maps for problem-solving in engineering. Global J. Eng. Educ. 2015, 17, 29–33. [Google Scholar]
- Keeler, A. 15 More Things You Can Do with Google Classroom. Available online: http://www.alicekeeler.com/teachertech/2014/09/22/15-more-things-you-can-do-with-google-classroom/ (accessed on 10 June 2018).
- Shaharanee, I.N.M.; Jamil, J.M.; Rodzi, S.S.M. Google Classroom as A Tool for Active Learning. AIP Conf. Proc. 2016, 1761, 020069. [Google Scholar] [CrossRef]
- Iftakhar, S. Google classroom: what works and how? J. Educ. Soc. Sci. 2016, 3, 12–18. Available online: http://jesoc.com/wp-content/uploads/2016/03/KC3_35.pdf (accessed on 29 July 2018).
- Young, H.D.; Freedman, R.A.; Ford, A.L. Sears and Zemansky’s University Physics with Modern Physics, 13th ed.; Pearson Education: San Francisco, CA, USA, 2010. [Google Scholar]
- Büyüköztürk, Ş. Data Analysis Handbook for Social Sciences, 7th ed.; Pegem A Publishing: Ankara, Turkey, 2007. [Google Scholar]
- Field, A. Discovering Statistics Using SPSS, 3rd ed.; Sage: London, UK, 2009. [Google Scholar]
- Heppner, P.P.; Petersen, C.H. The development and implications of a personal problem-solving inventory. J. Couns. Psychol. 1982, 29, 66–75. [Google Scholar] [CrossRef]
- Sahin, N.; Sahin, N.H.; Heppner, P.P. Psychometric properties of the problem-solving inventory in a group of Turkish university students. Cogn. Ther. Res. 1993, 17, 379–396. [Google Scholar] [CrossRef]
- Balim, A.G. The Effect of Mind-Mapping Applications on Upper Primary Students’ Success and Inquiry-Learning Skills in Science and Environment Education. Int. Res. Geogr. Environ. Educ. 2013, 22, 337–352. [Google Scholar] [CrossRef]
- Rye, J.; Landenberger, R.; Warner, T.A. Incorporating concept mapping in project-based learning: Lessons from watershed investigations. J. Sci. Educ. Technol. 2013, 22, 379–392. [Google Scholar] [CrossRef]
- Engelmann, T.; Hesse, F.W. How digital concept maps about the collaborators’ knowledge and information influence computer-supported collaborative problem-solving. Int. J. Comput.-Support. Collab. Learn. 2010, 5, 299–319. [Google Scholar] [CrossRef]
- Engelmann, T.; Tergan, S.-O.; Hesse, F.W. Evoking knowledge and information awareness for enhancing computer-supported collaborative problem-solving. J. Exp. Educ. 2010, 78, 1–20. [Google Scholar] [CrossRef]
- Kinchin, I.M. Concept Mapping in Biology. J. Biol. Educ. 2000, 34, 61–68. [Google Scholar] [CrossRef]
- Elias, M.J.; Weissberg, R.P. Primary prevention: Educational approaches to enhance social and emotional learning. J. Sch. Health. 2000, 70, 186–190. [Google Scholar] [CrossRef] [PubMed]
- Demirel, T.; Karakus Yilmaz, T. The Effects of Mind Games in Math and Grammar Courses on The Achievements and Perceived Problem-Solving Skills of Secondary School Students. Available online: https://onlinelibrary.wiley.com/doi/abs/10.1111/bjet.12624 (accessed on 20 October 2018).
- Varouchas, E.; Sicilia, M.Á.; Sánchez-Alonso, S. Academics’ Perceptions on Quality in Higher Education Shaping Key Performance Indicators. Sustainability 2018, 10, 4752. [Google Scholar] [CrossRef]
- Zhuhadar, L.; Yang, R.; Lytras, M.D. The impact of Social Multimedia Systems on cyberlearners. Comput. Hum. Behav. 2013, 29, 378–385. [Google Scholar] [CrossRef]
- Lytras, M.; Visvizi, A.; Daniela, L.; Sarirete, A.; Ordonez De Pablos, P. Social Networks Research for Sustainable Smart Education. Sustainability 2018, 10, 2974. [Google Scholar] [CrossRef]


| Group | N | Mean | SD | t | p |
|---|---|---|---|---|---|
| Experiment | 33 | 9.97 | 5.07 | 1.201 | 0.234 |
| Control | 32 | 8.56 | 4.33 |
| Group | N | Mean | SD | t | P |
|---|---|---|---|---|---|
| Experiment | 33 | 14.06 | 6.00 | 2.245 | 0.028 |
| Control | 32 | 11.00 | 4.92 |
| Dimension | Group | N | Pre-Test | Post-Test | ||
|---|---|---|---|---|---|---|
| Mean | SD | Mean | SD | |||
| Impulsive style | Experiment | 33 | 17.58 | 3.49 | 10.70 | 3.68 |
| Control | 32 | 17.94 | 3.27 | 17.84 | 4.75 | |
| Reflective style | Experiment | 33 | 11.64 | 2.07 | 14.18 | 3.58 |
| Control | 32 | 11.59 | 2.03 | 11.63 | 2.30 | |
| Problem solving confidence | Experiment | 33 | 12.70 | 2.78 | 12.73 | 2.57 |
| Control | 32 | 12.59 | 2.54 | 12.72 | 3.09 | |
| Avoidant style | Experiment | 33 | 8.91 | 2.36 | 5.36 | 1.90 |
| Control | 32 | 10.00 | 2.94 | 10.06 | 3.37 | |
| Monitoring | Experiment | 33 | 6.79 | 2.10 | 7.00 | 2.51 |
| Control | 32 | 6.19 | 2.12 | 6.28 | 2.48 | |
| Planfulness | Experiment | 33 | 8.64 | 2.43 | 8.70 | 2.44 |
| Control | 32 | 8.78 | 2.21 | 8.72 | 2.44 | |
| Total | Experiment | 33 | 66.24 | 9.31 | 58.67 | 10.92 |
| Control | 32 | 67.09 | 7.40 | 67.25 | 8.34 | |
| Dimension | Group | N | Mean | Adjusted Mean |
|---|---|---|---|---|
| Impulsive style | Experiment | 33 | 10.70 | 10.87 |
| Control | 32 | 17.84 | 17.67 | |
| Reflective style | Experiment | 33 | 14.18 | 14.16 |
| Control | 32 | 11.63 | 11.65 | |
| Problem solving confidence | Experiment | 33 | 12.73 | 12.69 |
| Control | 32 | 12.72 | 12.76 | |
| Avoidant style | Experiment | 33 | 5.36 | 5.83 |
| Control | 32 | 10.06 | 9.58 | |
| Monitoring | Experiment | 33 | 7.00 | 6.68 |
| Control | 32 | 6.28 | 6.62 | |
| Planfulness | Experiment | 33 | 8.70 | 8.76 |
| Control | 32 | 8.72 | 8.65 |
| Source of Variance | Dimension | Sum of Squares | SD | Mean of Squares | F | p |
|---|---|---|---|---|---|---|
| Controlled variable (PSI pre-test) | Impulsive style | 681.536 | 1 | 681.536 | 93.973 | 0.000 |
| Group | 747.983 | 1 | 747.983 | 103.135 | 0.000 | |
| Error | 449.652 | 62 | 7.252 | |||
| Total | 15,096.000 | 65 | ||||
| Controlled variable (PSI pre-test) | Reflective style | 374.662 | 1 | 374.662 | 116.292 | 0.000 |
| Group | 102.030 | 1 | 102.030 | 31.669 | 0.000 | |
| Error | 199.747 | 62 | 3.222 | |||
| Total | 11,536.000 | 65 | ||||
| Controlled variable (PSI pre-test) | Problem solving confidence | 305.843 | 1 | 305.843 | 93.331 | 0.000 |
| Group | 0.096 | 1 | 0.096 | 0.029 | 0.865 | |
| Error | 203.172 | 62 | 3.277 | |||
| Total | 11,031.000 | 65 | ||||
| Controlled variable (PSI pre-test) | Avoidant Style | 333.685 | 1 | 333.685 | 154.592 | 0.000 |
| Group | 219.689 | 1 | 219.689 | 101.779 | 0.000 | |
| Error | 133.826 | 62 | 2.158 | |||
| Total | 4657.000 | 65 | ||||
| Controlled variable (PSI pre-test) | Monitoring | 339.015 | 1 | 339.015 | 393.221 | 0.000 |
| Group | 0.055 | 1 | 0.055 | 0.63 | 0.802 | |
| Error | 53.453 | 62 | 0.862 | |||
| Total | 3272.000 | 65 | ||||
| Controlled variable (PSI pre-test) | Planfulness | 264.543 | 1 | 264.543 | 147.903 | 0.000 |
| Group | 0.182 | 1 | 0.182 | 0.102 | 0.751 | |
| Error | 110.895 | 62 | 1.789 | |||
| Total | 5304.000 | 65 |
| Context | Code | Frequency |
|---|---|---|
| Benefits | Enhanced sustainability of problem solving activities. | 16 |
| Enhanced sustainability in learning | 14 | |
| Enabling the correction of the old concepts that have been learned incorrectly | 13 | |
| Providing a link between prior and new information | 10 | |
| Making problem solving entertaining | 7 | |
| Increasing self-confidence towards the course. | 7 | |
| Difficulties | I did not experience any difficulty. | 13 |
| Difficulty in learning the MindMup application | 4 | |
| Not having previous experience in concept mapping | 3 | |
| Solution Recommendations | Being trained for the use of MindMup application for a longer time | 4 |
© 2019 by the author. Licensee MDPI, Basel, Switzerland. This article is an open access article distributed under the terms and conditions of the Creative Commons Attribution (CC BY) license (http://creativecommons.org/licenses/by/4.0/).
Share and Cite
Aşıksoy, G. Computer-Based Concept Mapping as a Method for Enhancing the Effectiveness of Concept Learning in Technology-Enhanced Learning. Sustainability 2019, 11, 1005. https://doi.org/10.3390/su11041005
Aşıksoy G. Computer-Based Concept Mapping as a Method for Enhancing the Effectiveness of Concept Learning in Technology-Enhanced Learning. Sustainability. 2019; 11(4):1005. https://doi.org/10.3390/su11041005
Chicago/Turabian StyleAşıksoy, Gülsüm. 2019. "Computer-Based Concept Mapping as a Method for Enhancing the Effectiveness of Concept Learning in Technology-Enhanced Learning" Sustainability 11, no. 4: 1005. https://doi.org/10.3390/su11041005
APA StyleAşıksoy, G. (2019). Computer-Based Concept Mapping as a Method for Enhancing the Effectiveness of Concept Learning in Technology-Enhanced Learning. Sustainability, 11(4), 1005. https://doi.org/10.3390/su11041005