1. Introduction
Policy makers are becoming increasingly aware of the environmental impacts of consumption. In fact, Goal 12 of the United Nations Sustainable Development Goals is “ensure sustainable consumption and production patterns” [
1]. The European Union (EU) has adopted a series of action plans and strategy documents to improve environmental performance of products and increase consumers’ awareness of sustainable production, use, and disposal of goods, setting eco-design requirements, and more [
2]. The Government Offices of Sweden published a strategy document in 2016 to guide work towards sustainable consumption in Sweden, identifying food, housing, and transportation as target areas [
3]. The Swedish Environmental Protection Agency (SEPA) and the Swedish Consumer Agency (SCA) have developed a service called “Hallå Konsument” (“Hello Consumer”), which, among other objectives, aims to advise consumers of the environmental impact of their consumption choices and to guide them in making more informed decisions [
4]. Moreover, Swedish municipalities are working towards meeting targets to reduce their consumption-based impact. For example, the city of Gothenburg, Sweden, has set a target of 3.5 tons of consumption-based carbon dioxide equivalents (CO
2-eq) emitted per capita by 2035, including both direct and indirect environmental impacts. This compares to current estimates of eight to twelve tons, and is based on the so-called two-degree target where per capita emissions must be reduced so that the global mean temperature does not rise more than two degrees above the pre-industrial level. In its Environmental Action Plan, the city has presented 189 measures intended to work towards this goal and others [
5]. However, due to cost restraints, it may not be feasible to introduce all of the identified measures and a method for effective prioritization of measures is therefore necessary.
The authors have previously proposed a hybrid material flow analysis (MFA)—a life cycle assessment (LCA) method that identifies so-called environmental hotspots of consumption, showing which product groups would offer the greatest opportunity for effective impact reduction in the studied area, in this case the municipality of Gothenburg [
6,
7]. There are other hotspot identification methods available, as described in the literature [
8]. The hotspots can be used to identify measures suitable for quantitative analysis. When assessing these measures, evaluation of multiple environmental impacts is necessary to prioritize cost effective options that also avoid burden shifting. Burden shifting occurs when an intended reduction in one aspect of the life cycle unintentionally increases the environmental impact of another [
9,
10]. Sweden has implemented the so-called “generational goal” which directs environmental policy to ensure that the consumption of goods and services has the lowest possible impact on the environment and human health [
11]. To meet this goal, planners must consider more than just reduction of CO
2 emissions. For Gothenburg, it was found by the authors that consumption of fossil fuel, vehicles, electronics, and machinery are the greatest contributors to the city’s consumption-based environmental impacts and were therefore identified as hotspots [
6].
The authors estimated that in Gothenburg, fossil fuel and vehicle consumption (including public, household, and industrial consumers) each contribute approximately 14% of the total impact on climate change, and consumption of electronics and machinery is estimated to contribute 36%. Targeting these hotspots could therefore provide the most leverage towards reducing several environmental impacts and achieving the climate change target. Gothenburg must reduce its per capita emissions of CO
2-eq by at least 4.5 tons by 2035, from the estimated current consumption-based environmental impact of 8 tons per capita to the aforementioned target of 3.5 tons CO
2-eq per capita [
6]. With this information in hand, policy makers then need to know how much impact policy measures will have on reaching the goals.
Previous studies have quantified the impacts of interventions, including a study in California that evaluated the extent to which carbon footprint reduction potential is within the reach of local governments, identifying which policies or policy types could have the largest impact [
12]. That study used generic interventions like urban infill, conservation, energy efficiency, and renewable energy with respect to transportation, energy, food/diet, and consumption to quantify several cities’ abatement potentials, while identifying on which interventions local governments have direct influence. The Sustainability Evaluation Metric for Policy Recommendation (SEMPRe) and Quantitative Evaluation of Settlement Sustainability Policy (QESSP) models developed by Fitzgerald et al. (2015) evaluate generic policy suggestions (e.g., “farmers markets”, “higher urban density”) in terms of sustainability indices, also applying policy quantification methodology to several settlements simultaneously, with the intention of determining where to promote population growth and identify beneficial policies [
13,
14]. Both methods use generalized policy options rather than municipality-specific suggestions and are intended to inform strategic planning rather than aiding decision makers in meeting local targets. There are a multitude of sustainability assessment, ranking and prioritization tools available based on multi-criteria decision analysis (MCDA), that allow for weighting and value judgments [
15,
16,
17]. These are particularly useful for reaching consensus and facilitating dialogues among multiple stakeholders, including researchers and policy makers [
18]. These tools can for example blend qualitative and quantitative data to identify the optimal policy for a specific goal [
19], measure the sustainability index of specific areas [
20], or evaluate energy strategies [
21]. While these types of analyses are helpful for strategic planning, they may not provide the level of detail (e.g., how will they impact specific targets) needed for prioritization of proposed measures, nor do they always involve the relevant authority tasked with implementing the measures.
In this paper, we present a method for policy quantification that can enable decision makers to prioritize proposed measures. We show this using the example of Gothenburg, Sweden, where we assess the extent to which the application of certain measures suggested by the city of Gothenburg regarding two of Gothenburg’s environmental hotspots, fuel and electronics, can support meeting the 3.5 tons consumption-based CO2 target. We use current data and region-specific projections in several scenarios developed together with the city’s policy-makers to identify the most effective one(s). The objectives of this paper are to:
Describe the development of the method;
Illustrate the method using a case study of Gothenburg municipality; and
Use the method to quantify how much reduction in consumption may be possible based on a selection of the proposed measures and estimate how close the municipality will get to the target of 3.5 tons of CO2-eq per capita using the developed scenarios.
2. Methods
In this section we first explain the general method, followed by a description of Gothenburg, Sweden. We then describe the scenario development for the hotspots evaluated in this study.
2.1. Method Description
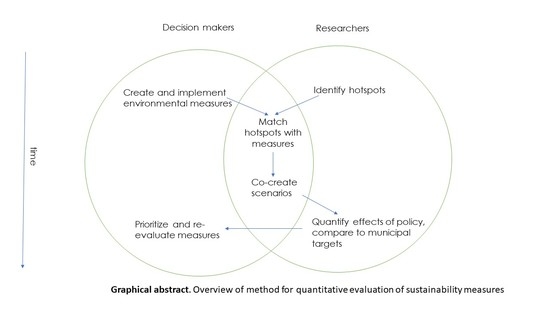
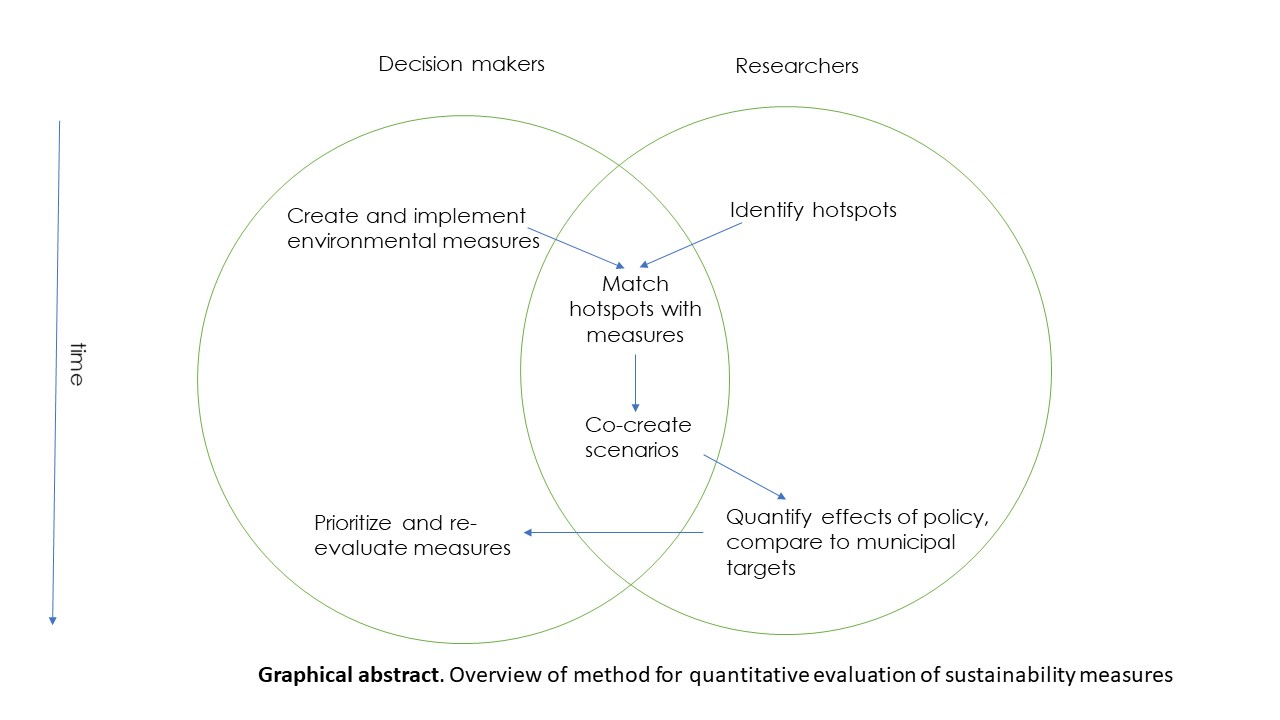
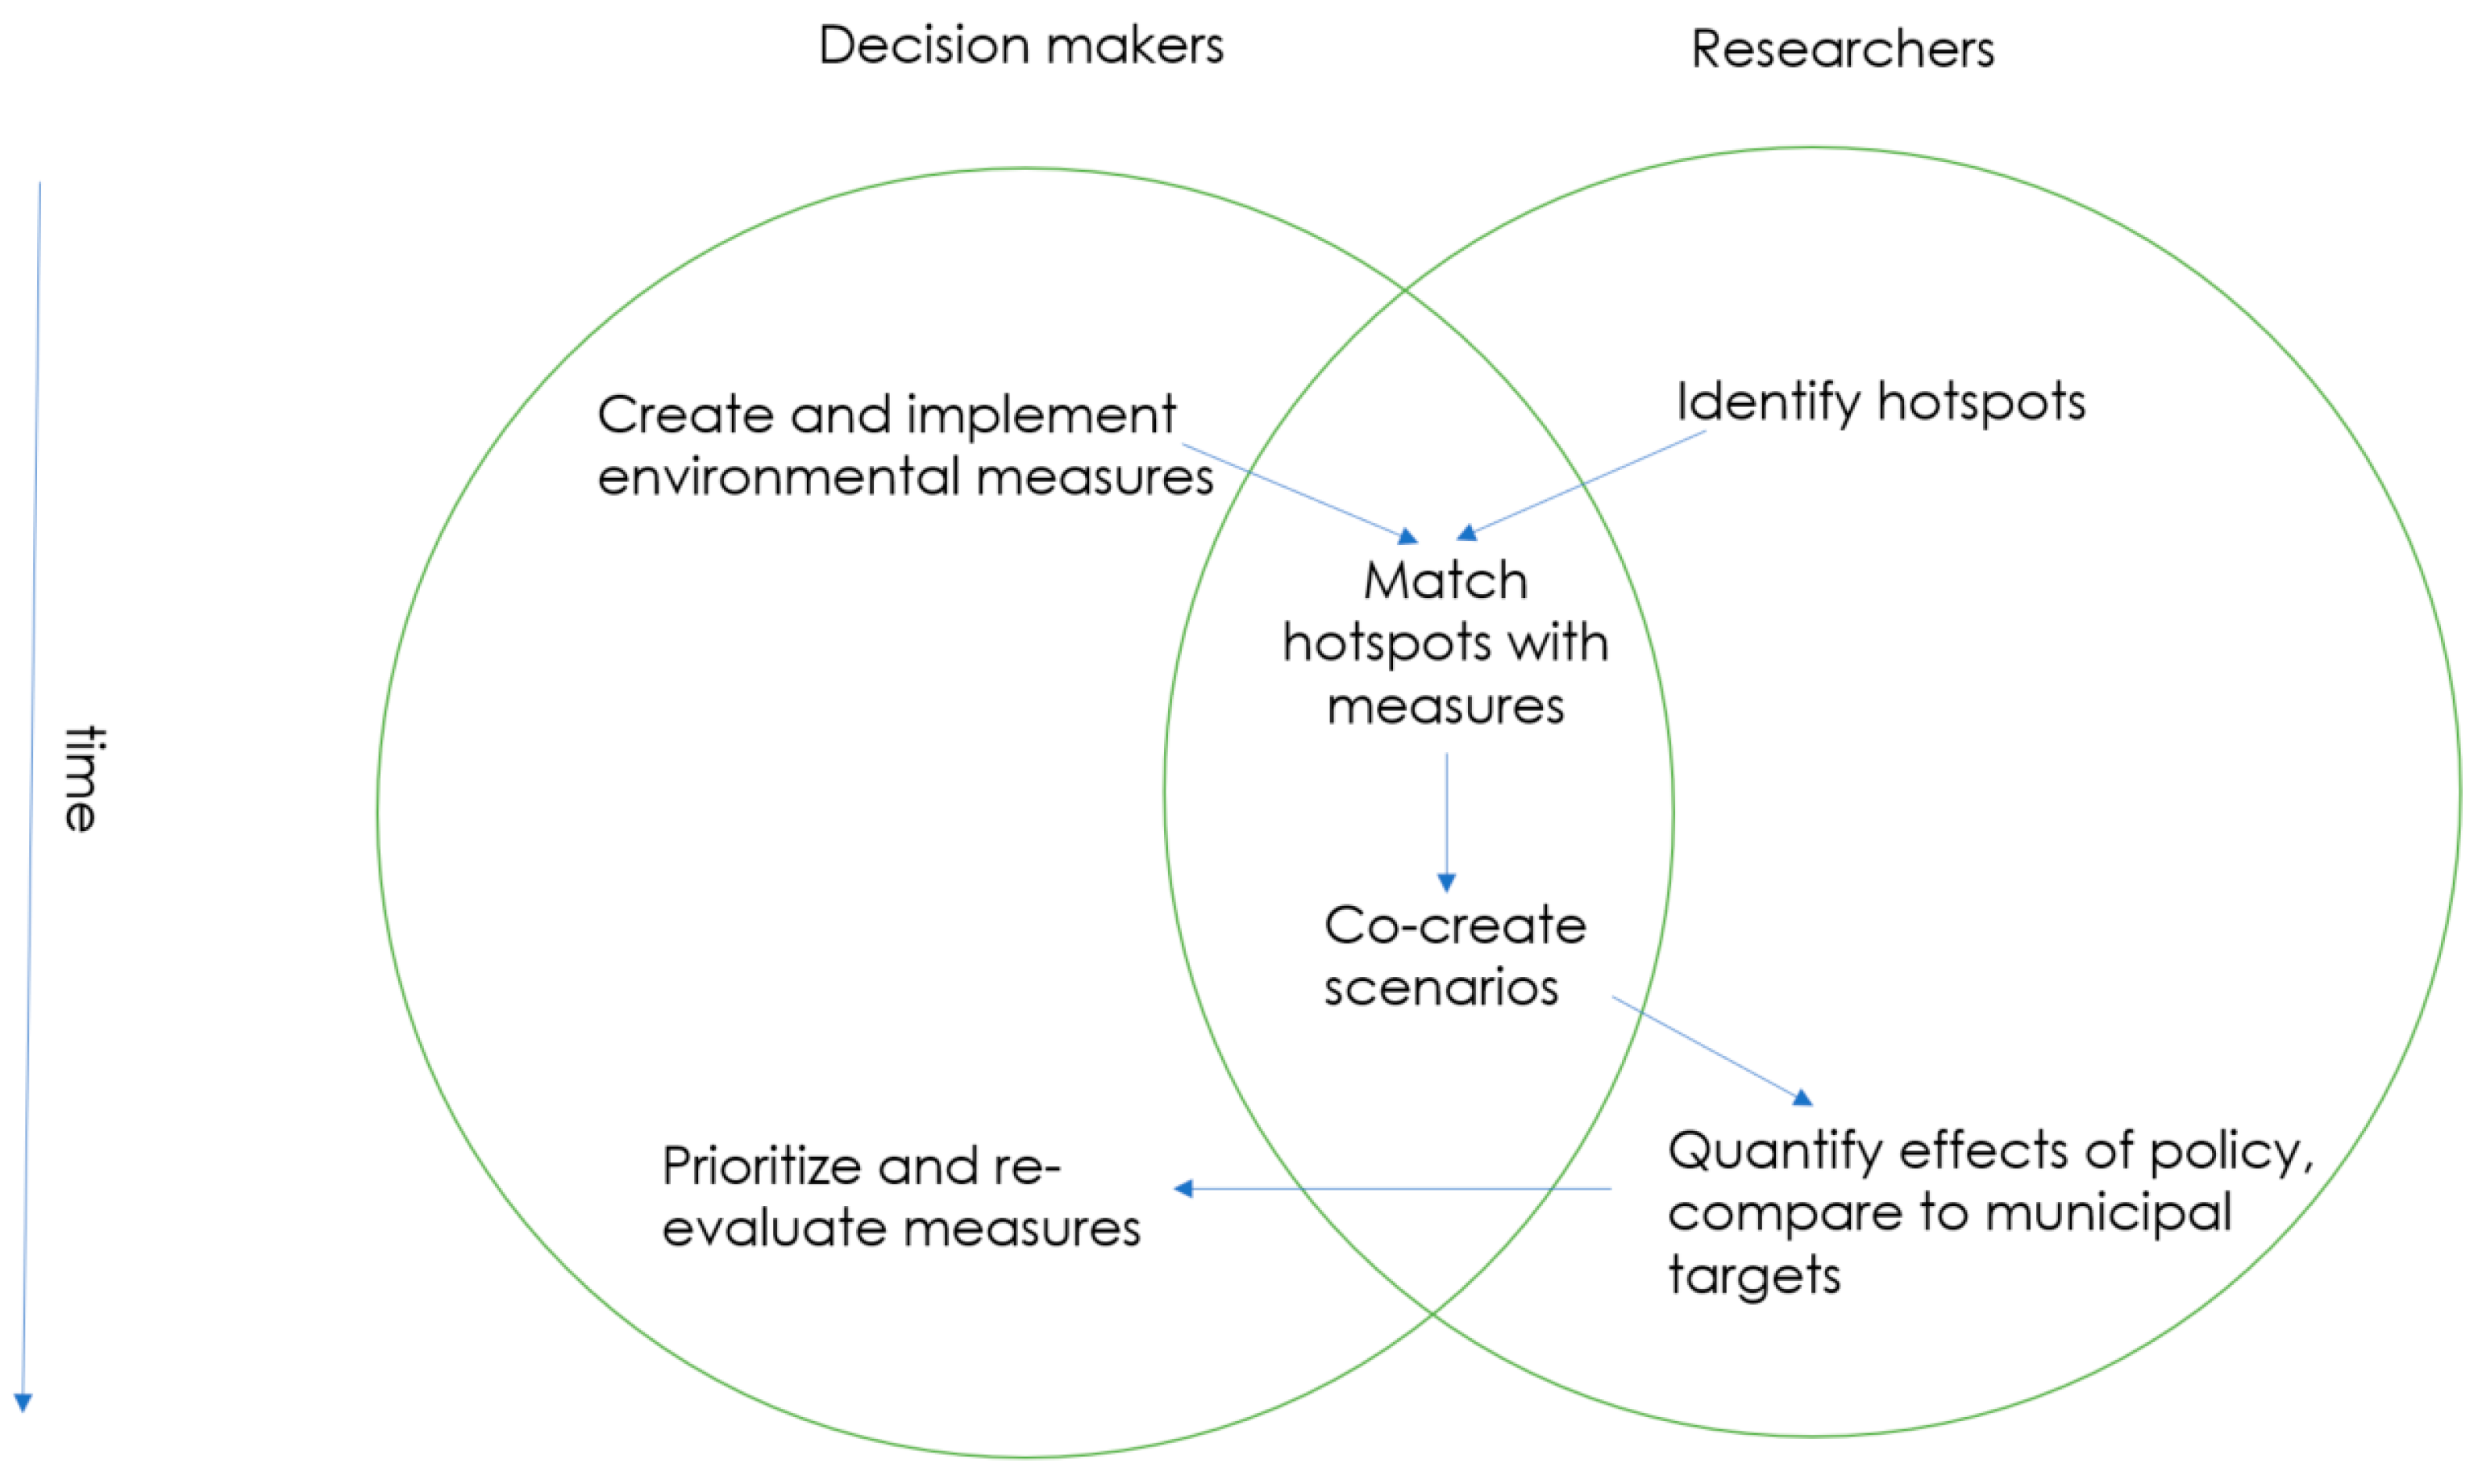
A brief overview of the method developed is presented in
Figure 1. In this hotspot-driven approach, a thorough analysis of proposed environmental measures in the studied area is made in order to define, quantify and compare scenarios against the set targets.
In the developed co-creation method, municipalities, or governing bodies in general, suggest a list of environmental measures. Such policy suggestions or action plans often already exist, e.g., the Gothenburg Environmental Action Plan or the Swedish Action Plan for Agenda 2030 [
5,
22].
Researchers identify hotspots specific to the study area using available methods [
8]. In our study we have used hybrid MFA-LCA; a detailed description of this method can be found in previously published and forthcoming work [
6,
7]. Briefly, MFA is a systematic assessment of the flows and stocks of materials within a system defined in space and time, which can provide results in physical units (tons) of products consumed in that given area in a given year [
23]. The selected hotspot identification method uses the MFA results of the region of interest to identify products that are representative of an entire product category. The environmental impact (e.g., climate change, eutrophication, and acidification) of each product category is then quantified based on existing LCA datasets (from e.g., EcoInvent, version 3.1, Zurich, Switzerland, or ThinkStep, Leinfelden-Echterdingen, Germany) for the representative products. An LCA is used to estimate the potential environmental impacts throughout a product’s lifespan; the assessment quantifies inputs and outputs of materials, energy, water, and emissions during the various phases of the product’s life, and is performed in accordance with ISO14040 and 14044 [
24,
25]. The LCA profiles used present results in terms of environmental impacts per kilogram of product. Hotspots (high impact product categories) are then identified according to set criteria (e.g., high impact results in multiple impact types) [
6]. There are other methods in the literature that may be used to identify hotspots, including ecological footprint, multi-regional input-output analysis, and environmentally extended input-output analysis, among others [
8].
The hotspots (i.e., the priority product groups) and the measures can then be connected by creating a database of the measures and asking basic questions for each measure like “can the measure be linked to a material flow or a product group?” and “if so, to a hotspot?”.
Scenarios are then co-created by researchers and the decision makers, a key step in the method. In these scenarios, relevant measures are bundled together and translated into potential outcomes that are considered to be realistic by the city offices responsible for the implementation and at the same time are consistent with future trends reported in the literature. The relevant city representative is asked how and if the measure is intended or expected to influence consumption or behavior and what could be the feasible means of its implementation. The scenarios’ results are intended to show a range of possible outcomes of the measures in terms of reductions of both material flows and impacts, and include a specific time frame. It is important to understand the scope of the measure. For example, measures can be internal, external or both. By internal, we mean practices within the governing body’s own offices (e.g., public procurement) and by external, we mean practices to enable residents to make more sustainable choices (e.g., providing charging stations for electric vehicles to encourage electric vehicles or providing a bicycle sharing system). The scenarios can be developed to compare high and low adoption rates of various interventions as well. Previously reported projections on population and other data that may be relevant for the scenarios may be used. For example, the Swedish Energy Agency’s projected future fuel efficiency of all vehicles can be applied to scenarios related to fuel [
26].
The scenarios’ potential effects on consumption of the hotspot material is estimated in the specific time span of interest. The environmental impacts are then quantified for each product affected by the scenarios. For example, the consumption levels can then be multiplied by an environmental impact factor (e.g., an LCA profile) and the results can be compared to the goal. In this case, we have used existing LCA datasets. The impact type chosen should be consistent with the goals set by decision makers, and does not necessarily need to be an LCA profile. The results can then be used to evaluate and prioritize measures.
In the case of Gothenburg, we selected for demonstration purposes two hotspots, fuel and electronics. Each measure in Gothenburg’s environmental plan is assigned to one or more administrative office. We analyzed the measures to see which ones were related to the chosen hotspots. The applicable offices were contacted, and the relevant coordinators were met with to discuss the measures and their connection to hotspots, and to develop the outcome scenarios. We were given access to relevant reports and studies that the city had produced or used. The final scenarios were approved by the respective coordinators to ensure that they were reasonable and in line with the municipality’s plans. Gothenburg already has several targets for the year 2035, and this was selected as a reasonable time frame. The scenarios for fuel included two approaches: changing the type of passenger cars purchased and driven, or reducing the distance driven due to altering the mode of transportation. The scenarios for electronics were limited to extending the lifespan of consumer electronics used daily, i.e., computers, mobile phones, tablets, and monitors. This was first tested considering only municipally-owned electronics, and then extended to the Gothenburg population at large. The specific scenarios evaluated in this study are described in full in
Section 2.3 and
Section 2.4.
2.2. Case Study Area
Gothenburg is Sweden’s second largest city with a population of approximately 560,000, or 1,000,000 if including surrounding commuter municipalities (the Metropolitan Gothenburg Region). There are currently 189 environmental measures in the Gothenburg Environmental Action Plan intended to reduce both direct (e.g., emissions taking place within the city boundaries) and indirect (e.g., emissions occurring elsewhere in the world but driven by consumption in the city boundaries) environmental impacts. The nineteen different administrative offices and seven municipally-owned companies in the city (e.g., the traffic office, recycling and water office) are tasked with effecting these measures. Of the 189 measures, 73 can be linked to the four hotspots identified by the authors: vehicles, fuel, electronics, and machinery. The city employs approximately 51,000 people, almost 10% of the population, and has the potential to affect consumption rates via public procurement as it is responsible for schools, elderly care, public housing, and more.
2.3. Fuel Scenario Development
In
Table 1, we present the measures from Gothenburg’s Environmental Action Plan [
5] that were used to develop the scenarios described in
Table 2 and in the text below.
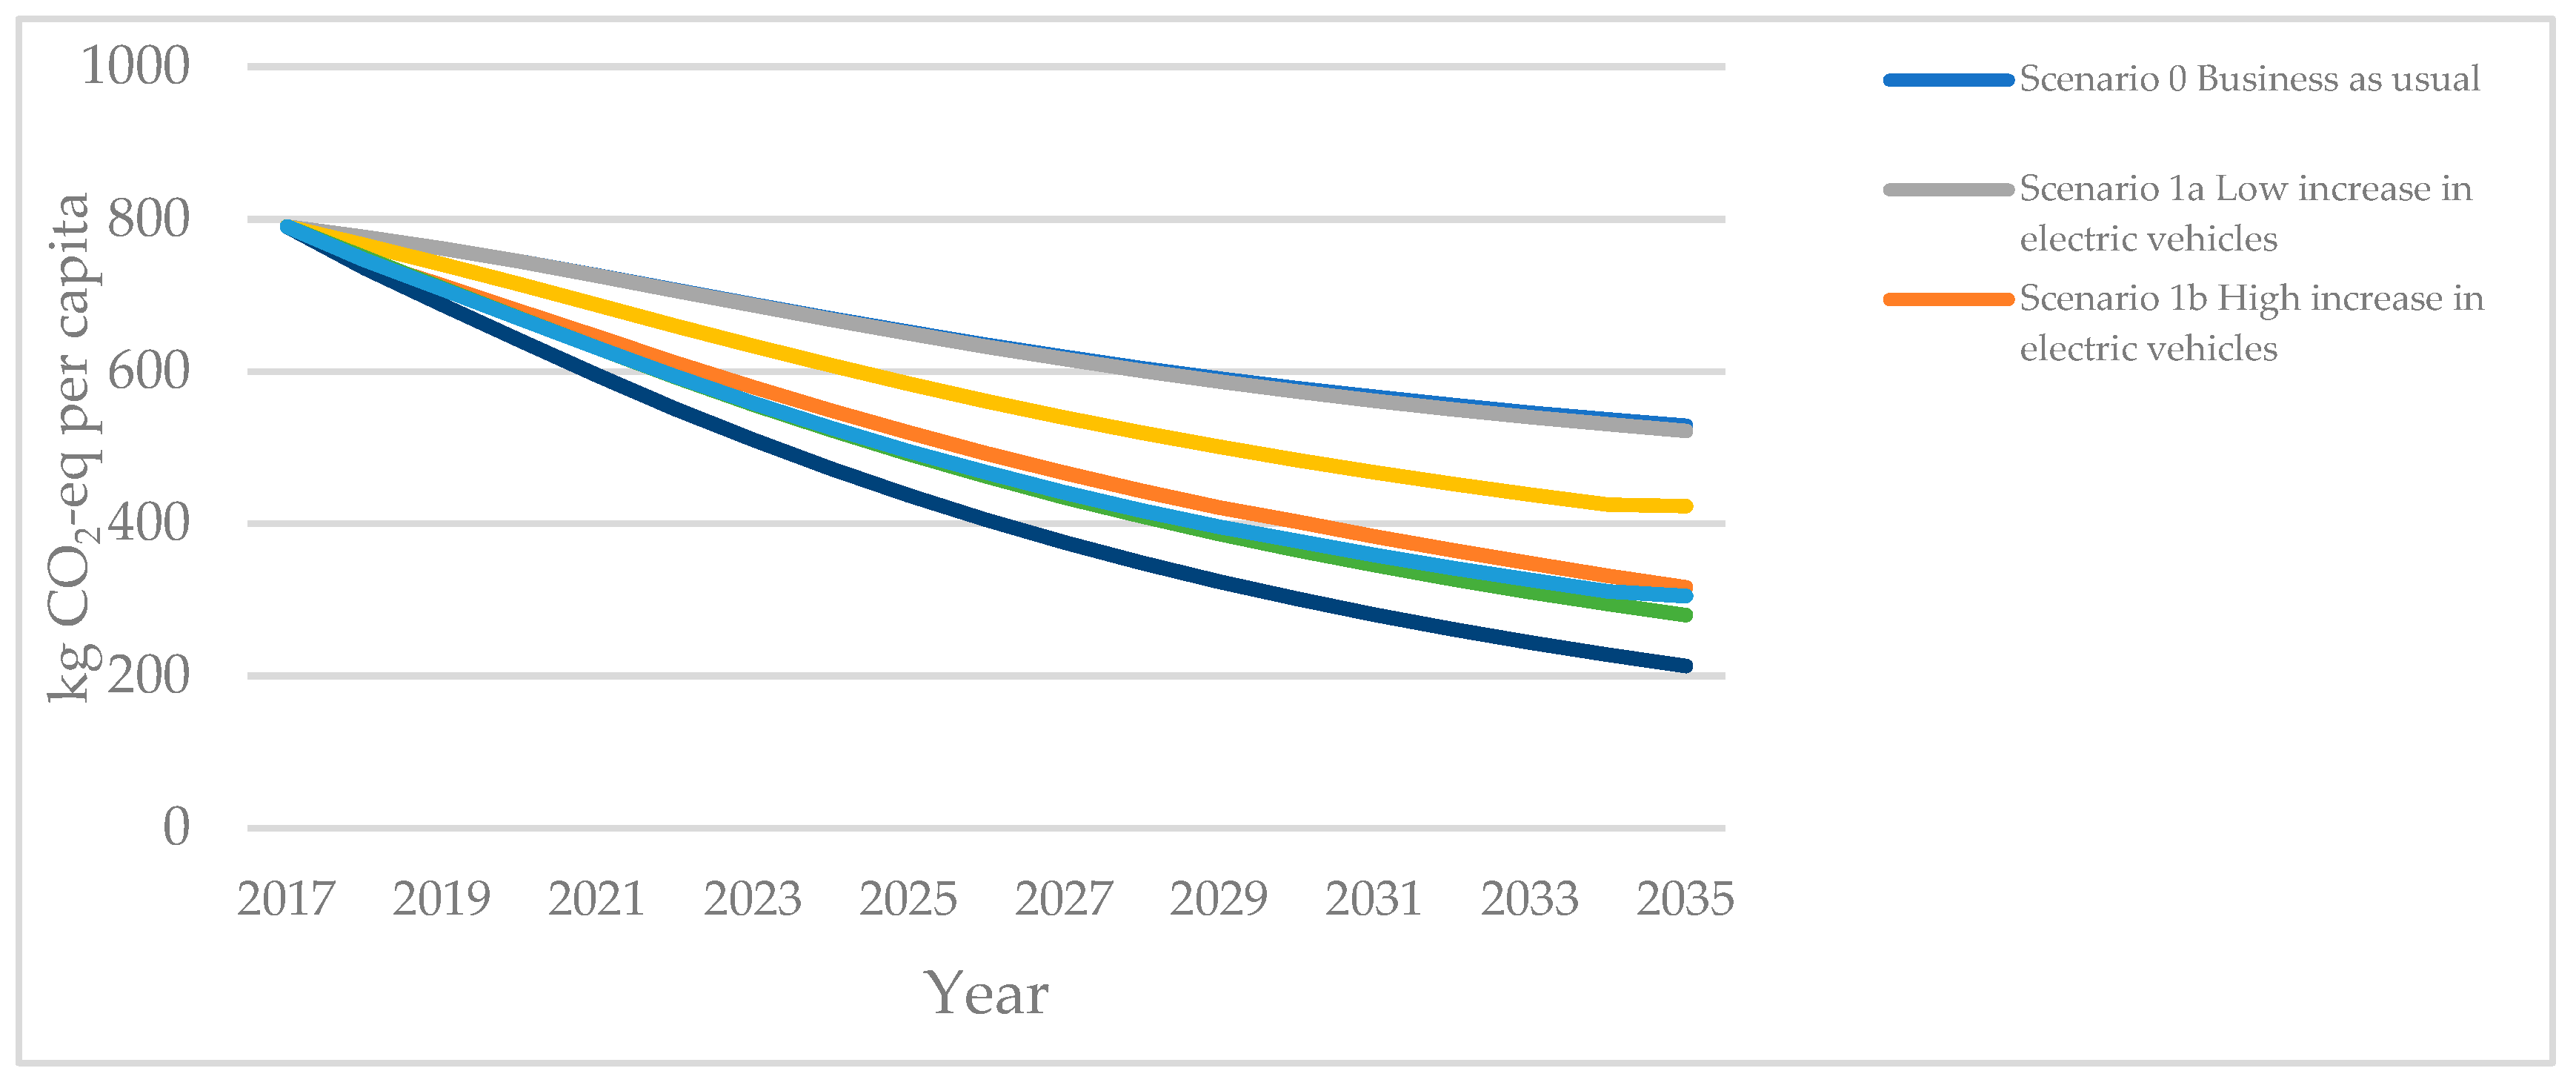
Scenario 0, “business as usual”, assumes that the current ratio (based on 2017) of vehicle types (i.e., diesel, gasoline, electric, and hybrid) remains constant over the modeled time span, but that the number of vehicles in the fleet increases in accordance with previously reported forecasts mainly due to population increases [
27,
28]. In this paper, we use the term “fleet” to describe all personal vehicles in use in the region, regardless of owner. Although the Swedish Transport Administration forecasts that the national personal vehicle fleet will increase by 2.5% annually [
29], regional rates are slightly lower, 1.1% [
30], which is the value we have selected. We assume that the fuel efficiency of the fleet improves in accordance with the Swedish Energy Agency’s projections (see
Supplementary Materials, Part A) [
26]. The annual kilometers (km) driven are based on municipal statistics that calculate the average driving distance to be 12,320 km per year per vehicle [
31].
Scenario 1 estimates the effect of changing the ratio of the different vehicle types based on previous analyses made by the Swedish Energy Agency (SEA) [
26] and the Swedish Transport Administration (STA) [
29]. We test two levels of electrification of the fleet; Scenario 1a is a lower rate of adoption based on the SEA estimates that electric and hybrid vehicles will replace gasoline and diesel vehicles to comprise approximately 58% of personal vehicle fleet by 2035, whereas Scenario 1b assumes a higher rate of adoption based on the STA estimate that by 2035, approximately 75% of the personal vehicle fleet will be electric or hybrid. The exact ratios are presented in
Supplementary Materials, Part A. The remaining assumptions (fuel efficiency per vehicle type and annual driven kilometers) remain the same as Scenario 0.
Scenario 2 estimates the effect of changing transportation mode rather than type of vehicle. In this scenario, we assume that the number of vehicles follows the projected increase as modeled in Scenario 0 and 1. However, the average annual driving distance is reduced. In Scenario 2a, we test a low reduction rate, based on the city of Gothenburg’s traffic strategy, which aims for a 20% reduction in personal vehicle use by 2035 when compared to 2013 levels [
32]. Based on the average annual driving distance of a car in Gothenburg in 2014, a 20% reduction would result in an average annual driving distance of 9904 km. This assumes a 1.2% annual reduction in driving distance. In Scenario 2b, we estimate a higher reduction rate, 3% per year.
In Scenario 3, we assume that the fleet stays constant between 2017 and 2035, but that vehicles are replaced at a rate of 3.8% annually, in line with current replacement rate due to end of service life [
29]. We have not created a scenario in which the total number of vehicles is reduced as this is seen as unlikely. Driving distances are reduced as in Scenario 2b. In Scenario 4, we assume a fast rate of electric vehicle adoption as in Scenario 1b, but a low reduction in annual driving distance, as in Scenario 2a.
Scenarios 0, 1, 2, and 4 are built upon Equation (1), and Scenario 3 is represented by Equation (2); both equations model years 2017 through 2035: The climate change impact is calculated by multiplying the number of expected vehicles in the fleet (either based on new registrations, Equation (1), or on the expected total fleet, Equation (2) by the respective type of vehicle fuel efficiency factor and the expected driving distance, through the climate impact factor per fuel type. Acidification and eutrophication are based on impacts per driven km and per vehicle type.
We can multiply the fuel consumption by the relevant life cycle impact factors presented in
Table 3 to find the annual climate change, acidification, and eutrophication impact due to personal vehicle fuel consumption. In this study, we have used the global warming potential in kg carbon dioxide equivalents (kg CO
2-eq). Electric vehicles are assumed to use 2 kilowatt hours (kWh) per km traveled [
26], and each kWh is assumed to generate 47 g of CO
2-eq [
33,
34]. Plug-in hybrid vehicles are assumed to run on fuel 50% of the time [
26]. To account for the potential impact of replacing combustion engine vehicles with electric or hybrid vehicles, impact factors for acidification and eutrophication were extrapolated from Messagie et al. (2010) [
35], as presented in
Table 2. Acidification is represented as kg hydrogen ion equivalents (kg H
+-eq), and eutrophication as kg phosphate ion equivalents (kg
-eq). These impacts are based on the average driving distance per vehicle per year (variable D in Equations (1) and (2)).
Equation (1): Scenarios 0 through 2 and 4
CI = Climate impact in kg of CO2-eq
D = average driven kilometers in km per vehicle
C = Car fleet in number of vehicles
NC = Cars added to the fleet in number of vehicles
E = Fuel efficiency in l/km per vehicle
I = Impact in the environment in kg of CO2-eq/l
y = year
n = type of vehicle
CI = Climate impact in kg of CO2-eq
D = average driven kilometers in km per vehicle
C = Car fleet in number of vehicles
NC = Cars added to the fleet in number of vehicles
DC = Cars deregistered from the fleet in number of vehicles
E = Fuel efficiency in l/km per vehicle
I = Impact in the environment in kg of CO2-eq/l
y = year
n = type of vehicle
2.4. Electronics Scenario Development
Scenarios for reducing consumption of electronics are based on the measures presented in
Table 4. These measures aim to reduce consumption by extending the lifespans of specific electronics based on information campaigns, both internally and externally.
A summary of the scenarios is presented in
Table 5. Scenario 0 assumes that lifespans of electronics remains the same as they are estimated to be today, based on previously reported data [
36]. Scenarios 1 and 2 extend the lifespans by the same amounts, but Scenario 1 only pertains to electronics owned and operated by Gothenburg municipality, while Scenario 2 applies this lifespan extension to electronics owned and operated by all Gothenburg residents. The number of electronics in use by municipal employees has been estimated based on numbers from the IT department in the city (personal communication, Gothenburg Intraservice, 7 November 2018). The number of electronic devices in use by Gothenburg residents is based on a report by SEPA that found that 45% of the population over the age of 12 have access to a computer, smart phone and tablet, 25% have access to a computer and smart phone and 5% have access to a computer and tablet [
37]. Scenario 2 solely includes personal use electronics and does not include electronics from the work place. The types of electronics evaluated in Scenario 1 and 2 are not identical, as the data available for the scenarios were not from the same source. Scenario 1 evaluates laptops, monitors, tablets and mobile telephones whereas Scenario 2 does not include monitors.
We assume the environmental impact of each unit is as presented in
Table 6. Impact factors used for electronics. Impact values in LCAs are based on a specific lifespan, so the values have been recalculated to show the annual impact of the product. The values in these tables are based on specific products available on the market and their corresponding open environmental reports. They are assumed to be in line with similar products of various brands in the marketplace. Environmental impact factors like acidification and eutrophication are not as commonly reported and we have therefore used impact factors that are based on an average value from assorted studies and reports [
38,
39,
40,
41,
42,
43,
44,
45,
46]. Tablets were not included as data was not available. See
Supplementary Materials, Part B for more details.
By extending the lifespan of the products purchased, the number of new products that need to be purchased each year is reduced. For Scenario 1, environmental impact is calculated using Equation (3) by quantifying products purchased each year, which is based on the assumption that new products are purchased after the end of the lifespan and for new employees, given that municipal employees will increase along with population increase. In Scenario 2, the quantity of products purchased each year is calculated using Equation (4), which accounts for new residents entering the region. Employees are assumed to increase at a rate 1.3% per year, based on employment history of the city, and the population is expected to increase by approximately 24% by 2035.
EI = Environmental Impact (either kg CO2-eq, mol H+-eq, or g P-eq)
E = Stock of electronic devices per unit
L = lifetime of electronic device
NEmp = New employees
ER = Electronic devices ratios (units/employee)
I = Environmental impact factor (per unit)
y = year
n = type of electronic device
EI = Environmental Impact (either kg CO2-eq, mol H+-eq, or g P-eq)
E = Stock of electronic devices per unit
L = lifetime of electronic device
P = Population
ER = Electronic devices ratios (units/population)
I = Environmental impact factor (per unit)
y = year
n = type of electronic device
4. Discussion
4.1. Method Analysis
The results indicate that the method described may be useful for identifying measures that should be prioritized as well as those that do not need to be, thereby improving the efficiency of policy implementation. Moreover, the co-creative method enables the analysis of potential synergies among proposed measures by bundling them together to evaluate the potential outcomes.
The method can also be used to identify needs, e.g., if more measures should be evaluated or developed. In contrast to previous work by Fitzgerald et al. (2015) and Jones et al. (2018), which look at hypothetical policy categories, this method allows for prioritization of specific proposed measures rather than providing guidance for more general strategic planning purposes. Moreover, rather than using aggregated sustainability indicators such as sustainable development index or carbon/ecological footprint, this method allows for comparison to existing targets. Fitzgerald et al. (2015) also note that the QESSP/SEMPRe model may not be appropriate for regions with well-established sustainability planning, and may therefore be less suitable for countries like Sweden.
The results also suggest that there may be more product types within the categories analyzed and additional hotspots (i.e., other product groups) that should be evaluated. In the hotspot identification method outlined by Lavers Westin et al. (under review), the top product groups contributing to climate change were electronics, machinery, fuel, and vehicles [
6]. However, other studies also include food and construction materials as priority product groups [
3,
48,
49,
50]. These did not appear as hotspots in the method employed, which may be due to the difference in the geographic boundaries used by the different consumption analysis methods. It should be emphasized that our hotspot identification method considers total consumption of a city including public procurement, households, and industry and is not limited to households, which is often the case when analyzing consumption in other studies (e.g., Notarnicola et al. (2017) and Huppes et al. (2006) [
51,
52]). This is a strength of our method as the comprehensive picture allows for identification of both city-specific hotspots and thereby relevant stakeholders for the various hotspots and impacts. The result of such a holistic consumption analysis is a somewhat different prioritization of products. For example, a commonly cited contributor to consumption-based climate impact is concrete [
53], which does not appear as a hotspot using our method. This may be because Gothenburg is a developed urban area that already has most of its infrastructure and buildings constructed. Additions to stock in such a case may not be as important in comparison to growing urban areas. Although the impacts estimated in this study account for the full cradle-to-grave life cycle, the hotspot identification method uses cradle-to-gate LCA, which may underestimate the total impacts. On the other hand, we do not expect the environmental impacts of food or concrete to be significantly underestimated with the cradle-to-gate LCA because major portion of impacts occur pre-consumer. In the case of food, the end-of-life impacts in Sweden are low as organic waste was banned from landfills as of 2005 [
54].
4.2. Results Analysis
The results show that despite targeting two hotspots, fuel and electronics, even the most optimistic reduction efforts would not allow the 3.5-ton CO
2-eq target to be met; at most, targeting personal electronics’ lifespans and personal vehicle fuel use would combined lead to 14% of the 4.5-ton CO
2-eq reduction needed to meet the goal. This indicates that there must be additional and simultaneous efforts to reduce other product groups and other types of consumption if the target is to be reached by 2035. This finding is in line with other studies’ results evaluating other cities [
11].
All fuel reduction scenarios evaluated led to reduced climate impact per capita, and the initial condition (2017) was in line with previous estimates of slightly under one ton CO
2-eq per capita per year fuel-induced impact in Gothenburg [
55]. The most successful scenarios in achieving environmental impact reductions included reduced driving distances based on modal shifts, which is similar to the findings found in Denmark [
56]. The success of policies to enable modal shifts have been analyzed in several studies and reports, but few quantify the emission reduction potential, as was done in this study [
57,
58,
59,
60]. The climate reduction potential of increasing electrification of the fleet is in line with previous studies as well [
61,
62], and although several studies evaluate potential electrification levels of vehicle fleets, they do not quantify potential emission reductions, as was done in this study [
63,
64]. In the case of Gothenburg, regardless of the scenario selected, only 6 to 13% of the 4.5-ton reduction goal was met. Moreover, the city is almost completely reliant on external adoption as they have already transitioned their own internal vehicle fleet to 34% electric or hybrid vehicles, and 40% natural gas. Only 14% of their fleet uses gasoline or diesel, and the remaining vehicles run on ethanol (personal communication with Gothenburg Traffic Office, 15 October 2018). The fuel reduction scenarios evaluated in this study were limited to personal vehicles in Gothenburg, and did not include commuters driving into the city from outside the municipality, as the measures consider the municipal administrative boundary. Impact reduction of commuter travel is considered in the traffic strategy plan for the Västra Götaland region, in which Gothenburg is located and should be evaluated as a part of region-wide policy development. In order to see the impact of passenger vehicles, fuel consumption associated with freight was not included but could be addressed using other scenarios related to other measures in the plan. Nor did the scenarios address fuel consumption associated with air travel, which has recently been specified as a key cause of climate impact, estimated to be 1.2 tons CO
2-eq per capita in Gothenburg, for example [
65]. Air travel is not addressed in the Gothenburg Environmental Plan, and was therefore not included in this analysis.
We also see that by only focusing on climate change, it is possible to miss other prioritization factors based on other impact types. By analyzing potential changes in acidification and eutrophication due to the vehicle types, we can see that reducing driving distance and the number of vehicles in Gothenburg should be prioritized over increasing electrification of the fleet. This is in line with other studies like Tasala Gradin et al. (2018) who note that primarily focusing on CO
2-eq benefits of electric vehicles ignores the energy, rare materials, and toxic compounds that are used during production of electric vehicles, and the environmentally problematic disposal stage [
47]. Encouragingly, none of the scenarios led to an increase in acidification, climate change, or eutrophication per capita, which indicates that they will not result in burden shifting for these categories.
The lifespan extension scenarios evaluated for the electronics led to a very low reduction of CO
2-eq per capita—only 0.02 or 0.22%, respectively, of the 4.5-ton reduction needed. Previous studies that look at lifetime extension do not quantify potential CO
2-eq improvements and simply state that there may be benefits of doing so [
36,
66]; it is therefore not possible to compare these results to other studies. The impacts do not include the impact associated with network use [
67]. The impact reduction of consumption-driven acidification and eutrophication levels was also low when compared to historical levels. Only a narrow selection of goods was studied, and additional products could be analyzed; previous studies have identified televisions, household appliances like refrigerators and laundry machines, and domestic heating equipment to be impact drivers, and these could be investigated [
48,
49]. The Gothenburg environmental measure 172 “discontinue refrigerators” is an example of a measure that could be investigated, or 56 “facilitate sharing economy in Gothenburg”. The range of the obtained results suggests, however, that the information campaigns on extending electronics lifespans should not be the municipality’s primary focus area for investment of significant funding. The municipality has an internal program in place to extend longevity of office electronics for both sustainability and financial reasons, and there is no practical reason to discontinue this. For external consumers, however, the efforts should likely be focused elsewhere.
4.3. Future Work
This method can be used for evaluating planned or proposed measures and should be part of an iterative process where scenarios are developed, tested, and expanded or discarded as described above. The developed method for quantitative evaluation of sustainability measures does not consider the costs associated with the various actions. A cost benefit analysis may therefore be useful. For example, there may be measures that are not the most effective but are inexpensive, and are still worth implementing to achieve incremental improvement at low cost.
The results of the method presented in this paper are intended to be used to update the Gothenburg Environmental Action Plan, and the method is being applied to other measures in the plan. For example, scenarios including measures related to housing and construction materials are being evaluated as this is a target area stated by both national and local administrations. Among the future modeled measures are: 51 “encourage the start-up of building material re-use depots in Gothenburg”, 67 “reduce construction waste”, and 154 “reduce climate impact from the city’s own construction projects.” These, among other scenarios, will give the municipality an idea as to how much effort will be required to reach their environmental goals. As we see here, significantly more consumption reduction efforts will be required than just on fuel or electronics to reach the 3.5-ton CO2-eq per person target.
5. Conclusions
Decision makers are tasked with defining and implementing measures that can meet established environmental targets. However, it is not always clear how effective the measure(s) will be in meeting the specified goals and which measures should be prioritized for implementation. To fill this gap, we have developed a method for testing possible measures to estimate the potential to achieve environmental impact targets. The method presented in this paper bundles proposed policy measures and translates them into detailed and quantified possible outcomes. The potential reduction in environmental impact of the corresponding modeled scenarios is then quantified and compared to environmental impact targets in order to aid prioritization and selection of the measures to implement. Although the method is presented here using the municipal-scale environmental targets, it can be performed at any scale, e.g., at the national, regional or city level. In methodological terms, this method contributes with a systematic approach that considers several key factors that are not included in other reported approaches, such as the total consumption of an area, region-specific consumption-based environmental hotspots, the decision makers involved, the reduction targets and related measures. These factors allow for tailored results specific to the area in question that improves the analysis and provides more suitable guidance than methods that use generalized policy suggestions. The results are presented in units that are relevant to decision makers (e.g., tons CO2-eq) rather than aggregated indices (e.g., SDI score) which are often used in other methods and may not be related to the specific targets. Moreover, the consideration of multiple impact types in the presented method is an essential aspect of measure evaluation that is often neglected, and which can affect prioritization results, as was shown in this study for the “fuel” scenarios.
In terms of application, the method can be used to inform an action plan related to sustainable development goals, among others, translating measures into potential outcomes. It is built upon existing and accessible methodologies and documents like MFA, LCA, and government reports, which allows for easy implementation. The collaboration between researchers and decision makers promotes realistic prognoses and is an essential part of the validation of the method. The method is not intended to predict absolute values, but gives an indication of the likelihood of reaching goals. The results can identify the level of effort necessary to meet targets and thus inform their selection of appropriate measures, and can even show that additional approaches not originally considered may be necessary. Furthermore, the method enables more effective implementation by identifying potential synergistic measures (i.e., those that were bundled together for the potential outcome scenarios). As we present in the case of Gothenburg, cities can use the method to improve or evaluate existing plans and aid them in reaching environmental impact targets.


