Article

GIS-Based Livelihood Vulnerability Index Mapping of the Socioeconomy of the Pekan Community


by
Nuriah Abd Majid
1,*,
Nurafiqah Muhamad Nazi
1,
Nor Diana Mohd Idris
1 and
Mohd. Raihan Taha
2
1
Institute for Environment and Development (LESTARI), Universiti Kebangsaan Malaysia, UKM Bangi, Selangor Darul Ehsan 43600, Malaysia
2
Smart & Sustainable Township Research Center (SUTRA) & Civil Engineering Program, Faculty of Engineering and Built Environment, Universiti Kebangsaan Malaysia, UKM Bangi, Selangor Darul Ehsan 43600, Malaysia
*
Author to whom correspondence should be addressed.
Sustainability 2019, 11(24), 6935; https://doi.org/10.3390/su11246935
Submission received: 9 October 2019 / Revised: 20 November 2019 / Accepted: 21 November 2019 / Published: 5 December 2019

Abstract

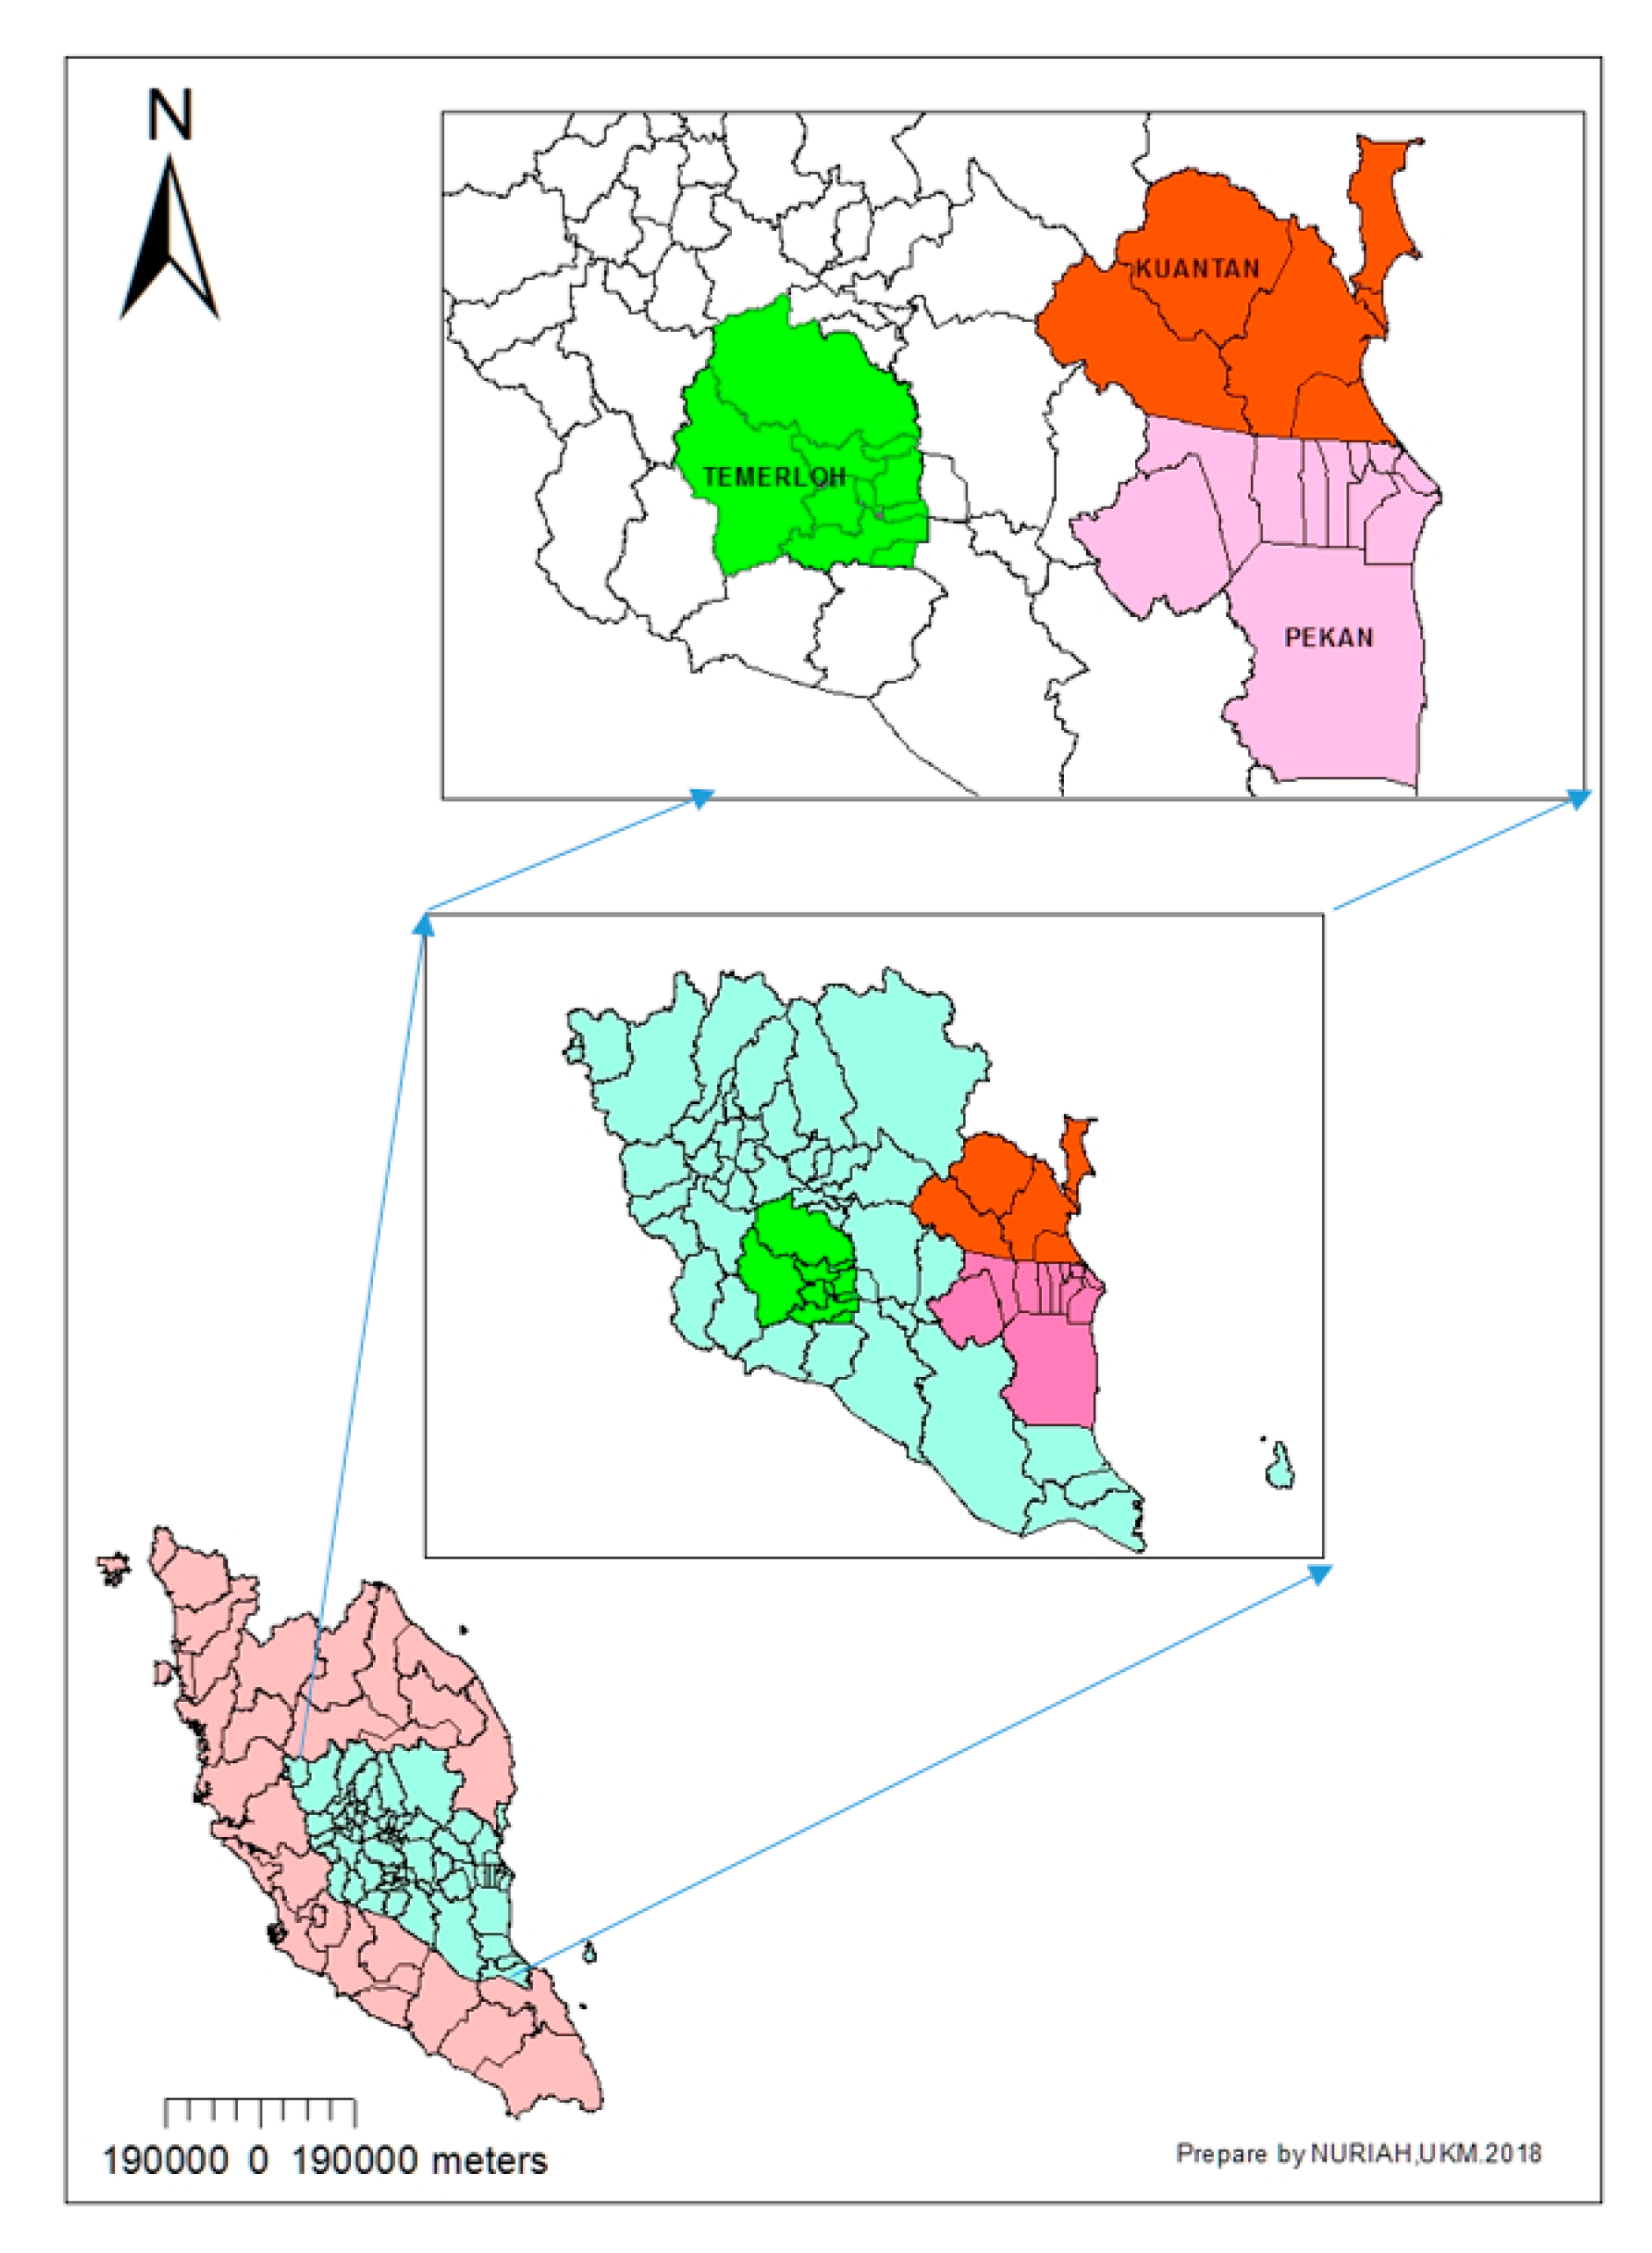
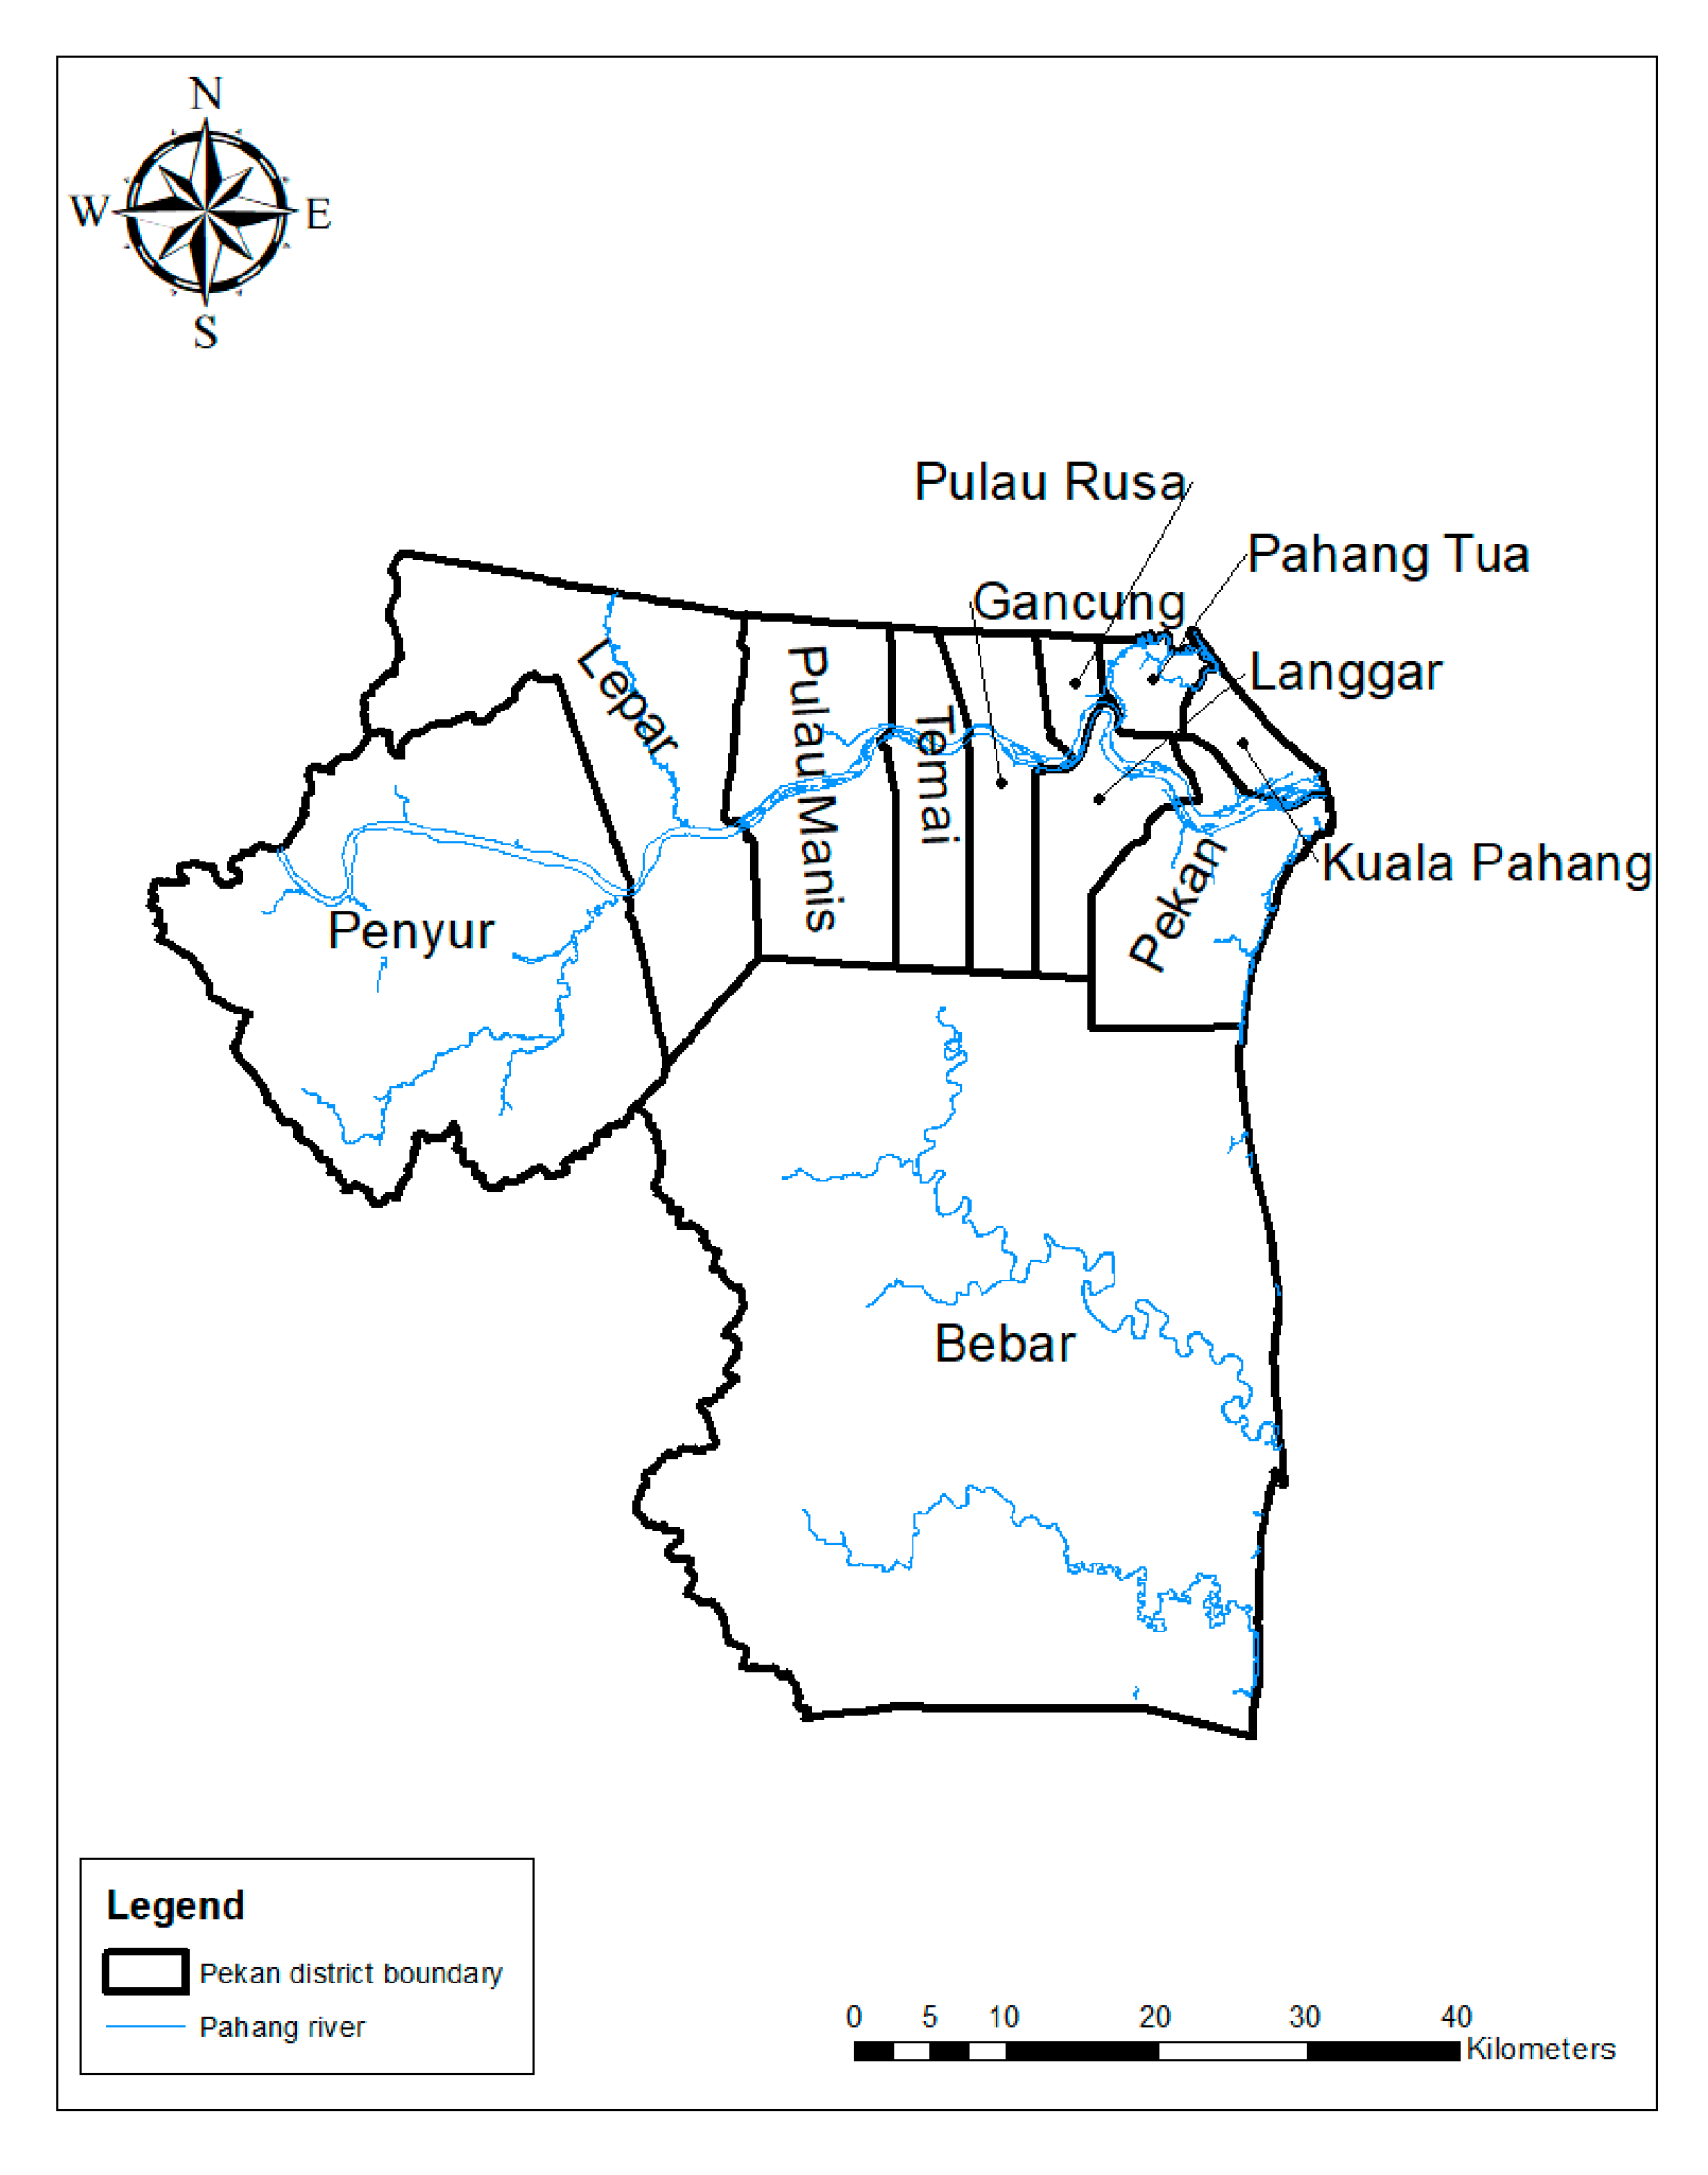
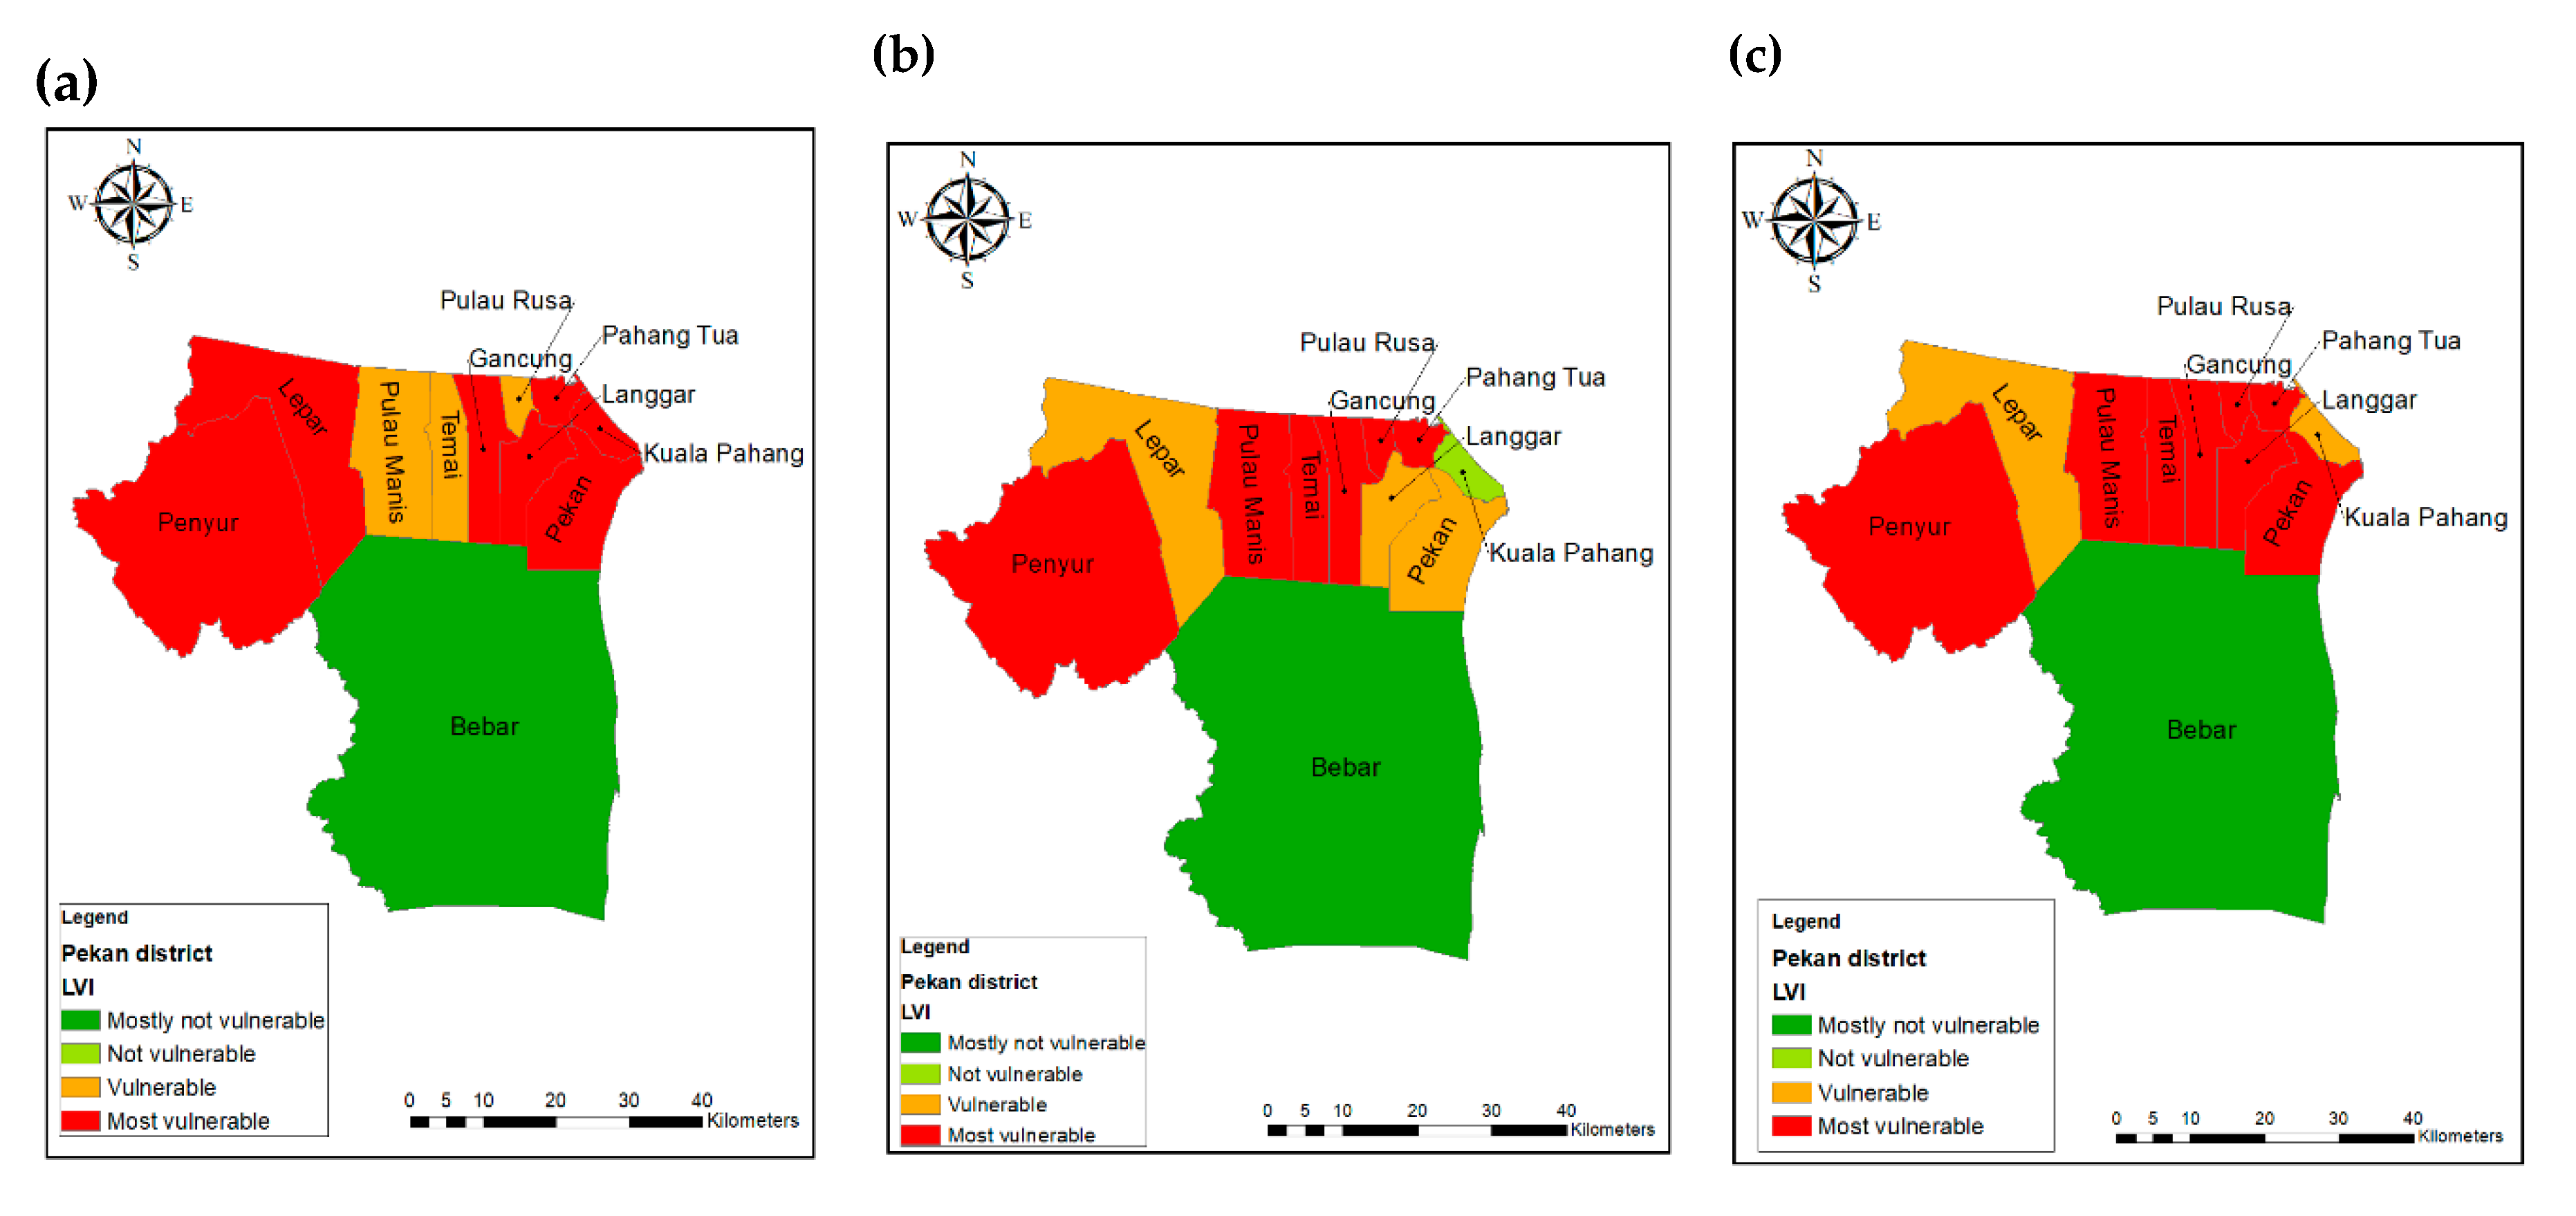
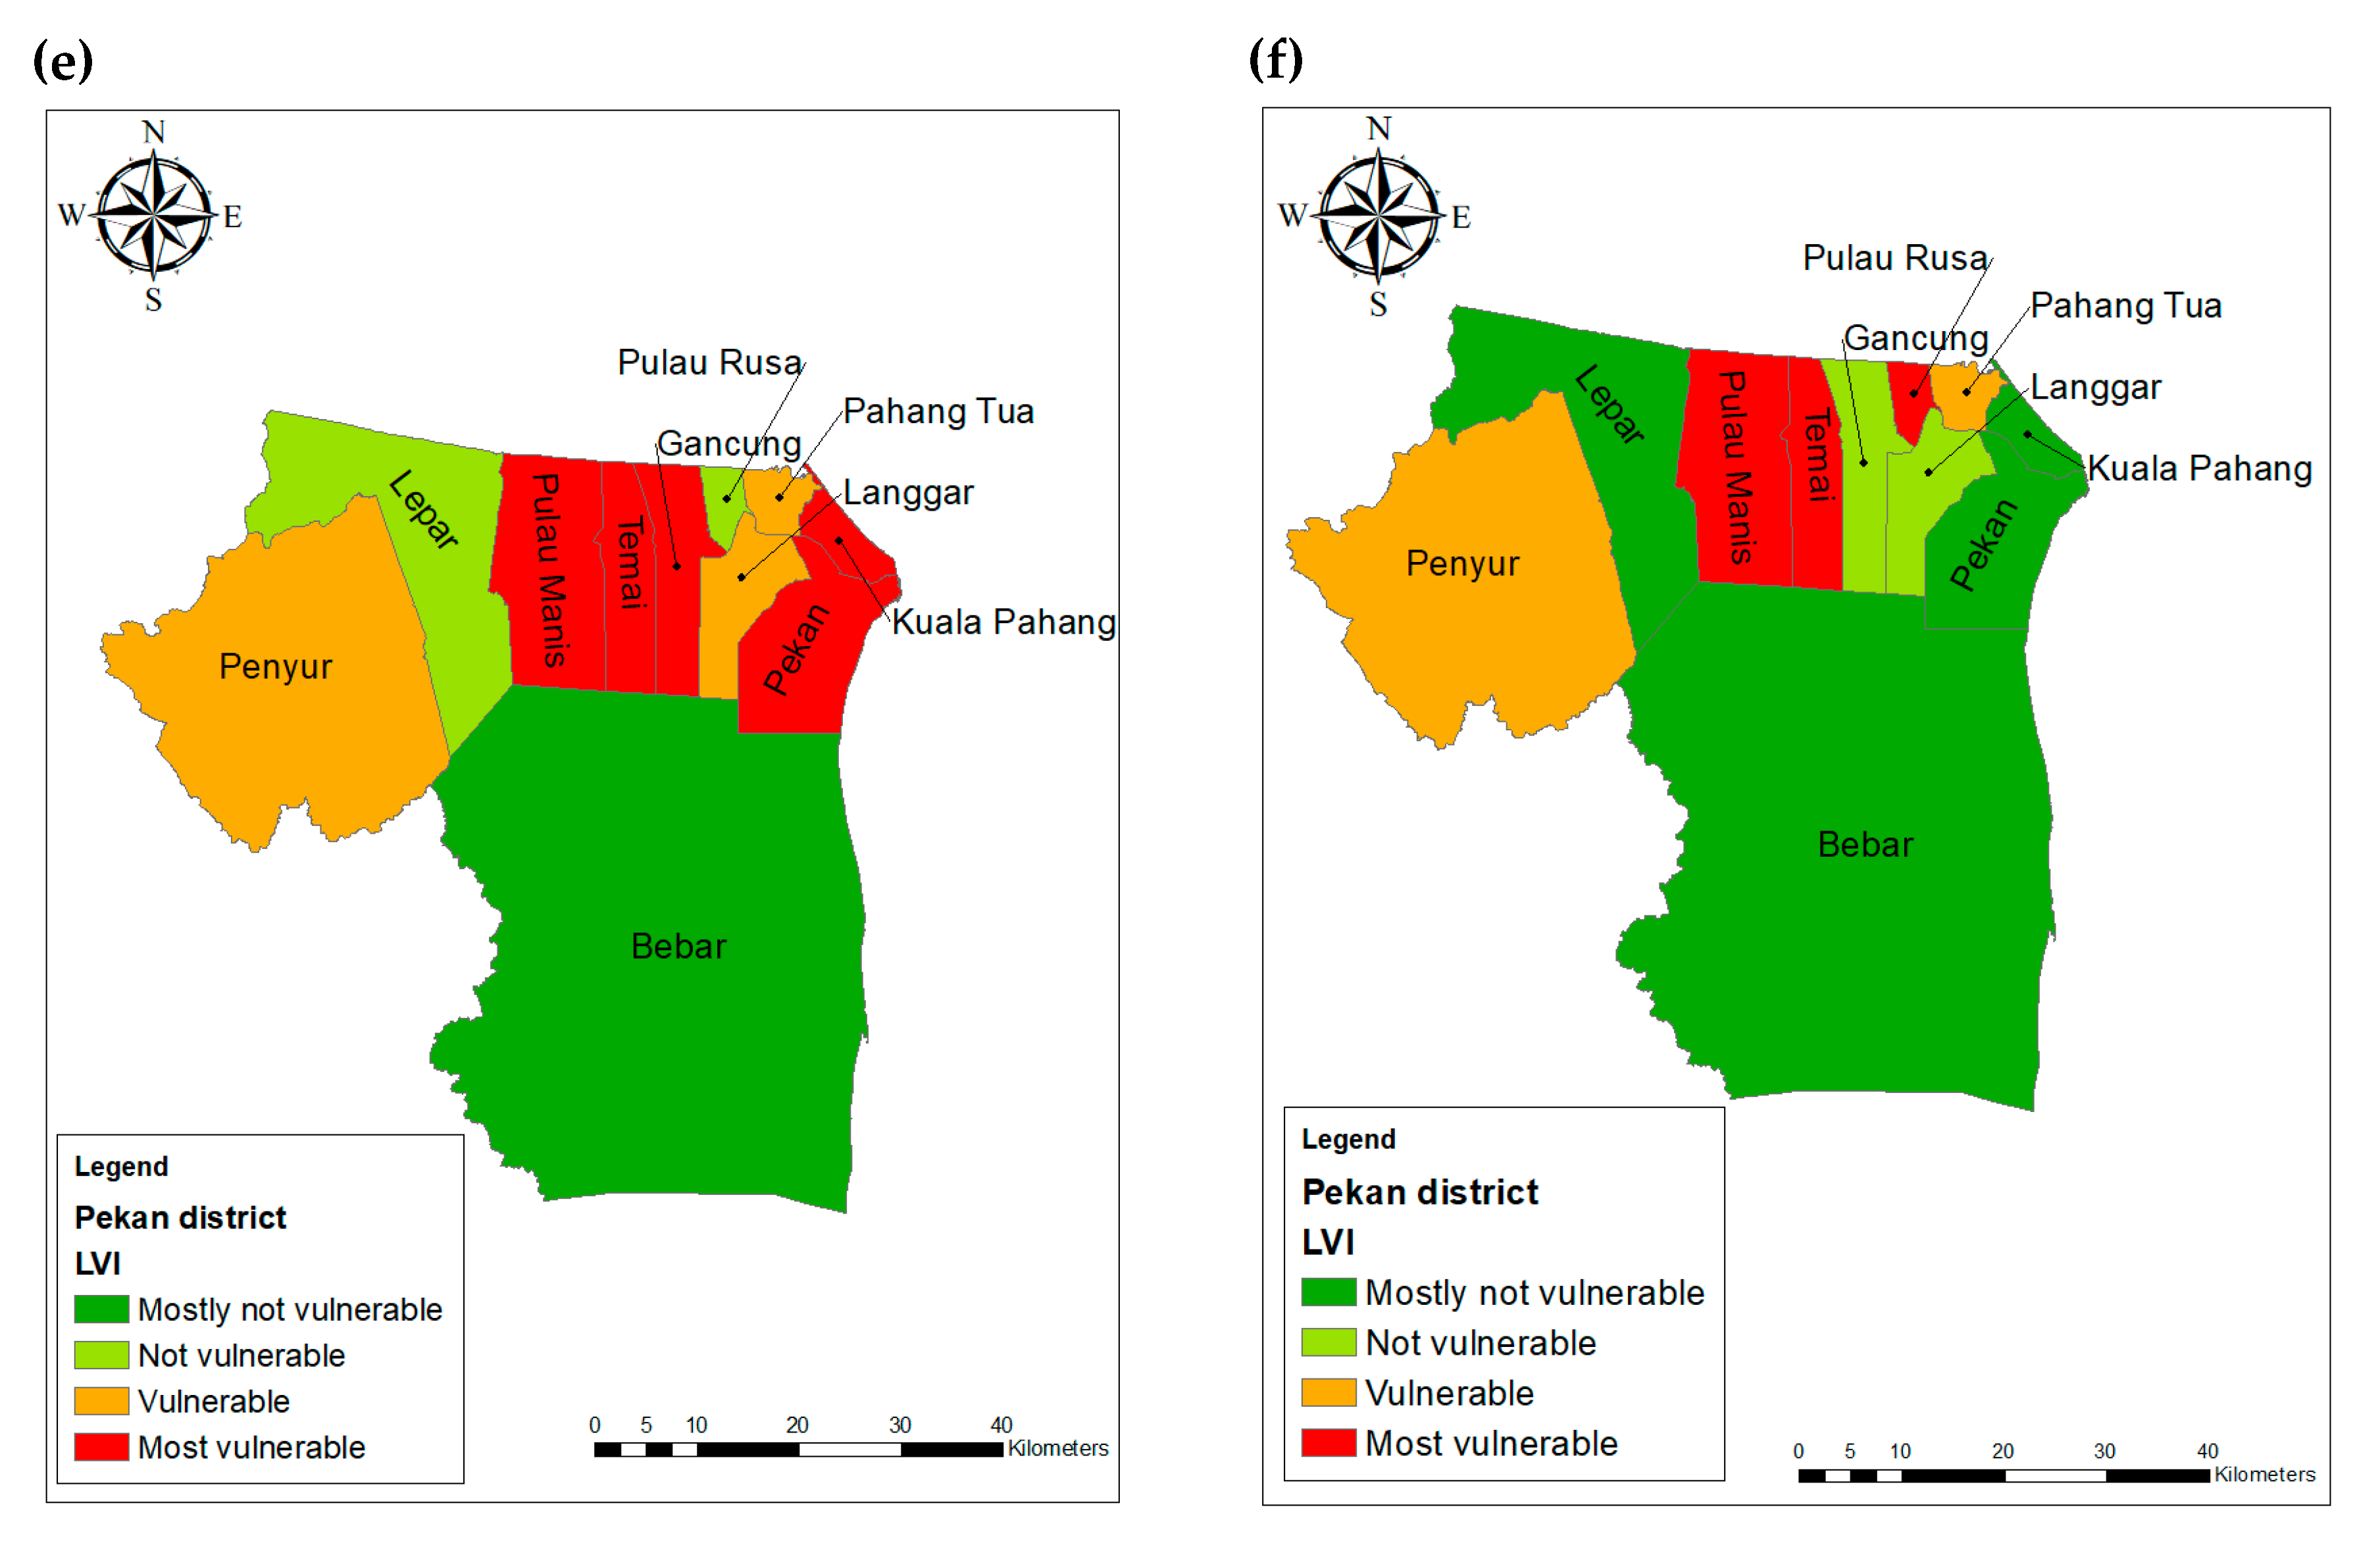
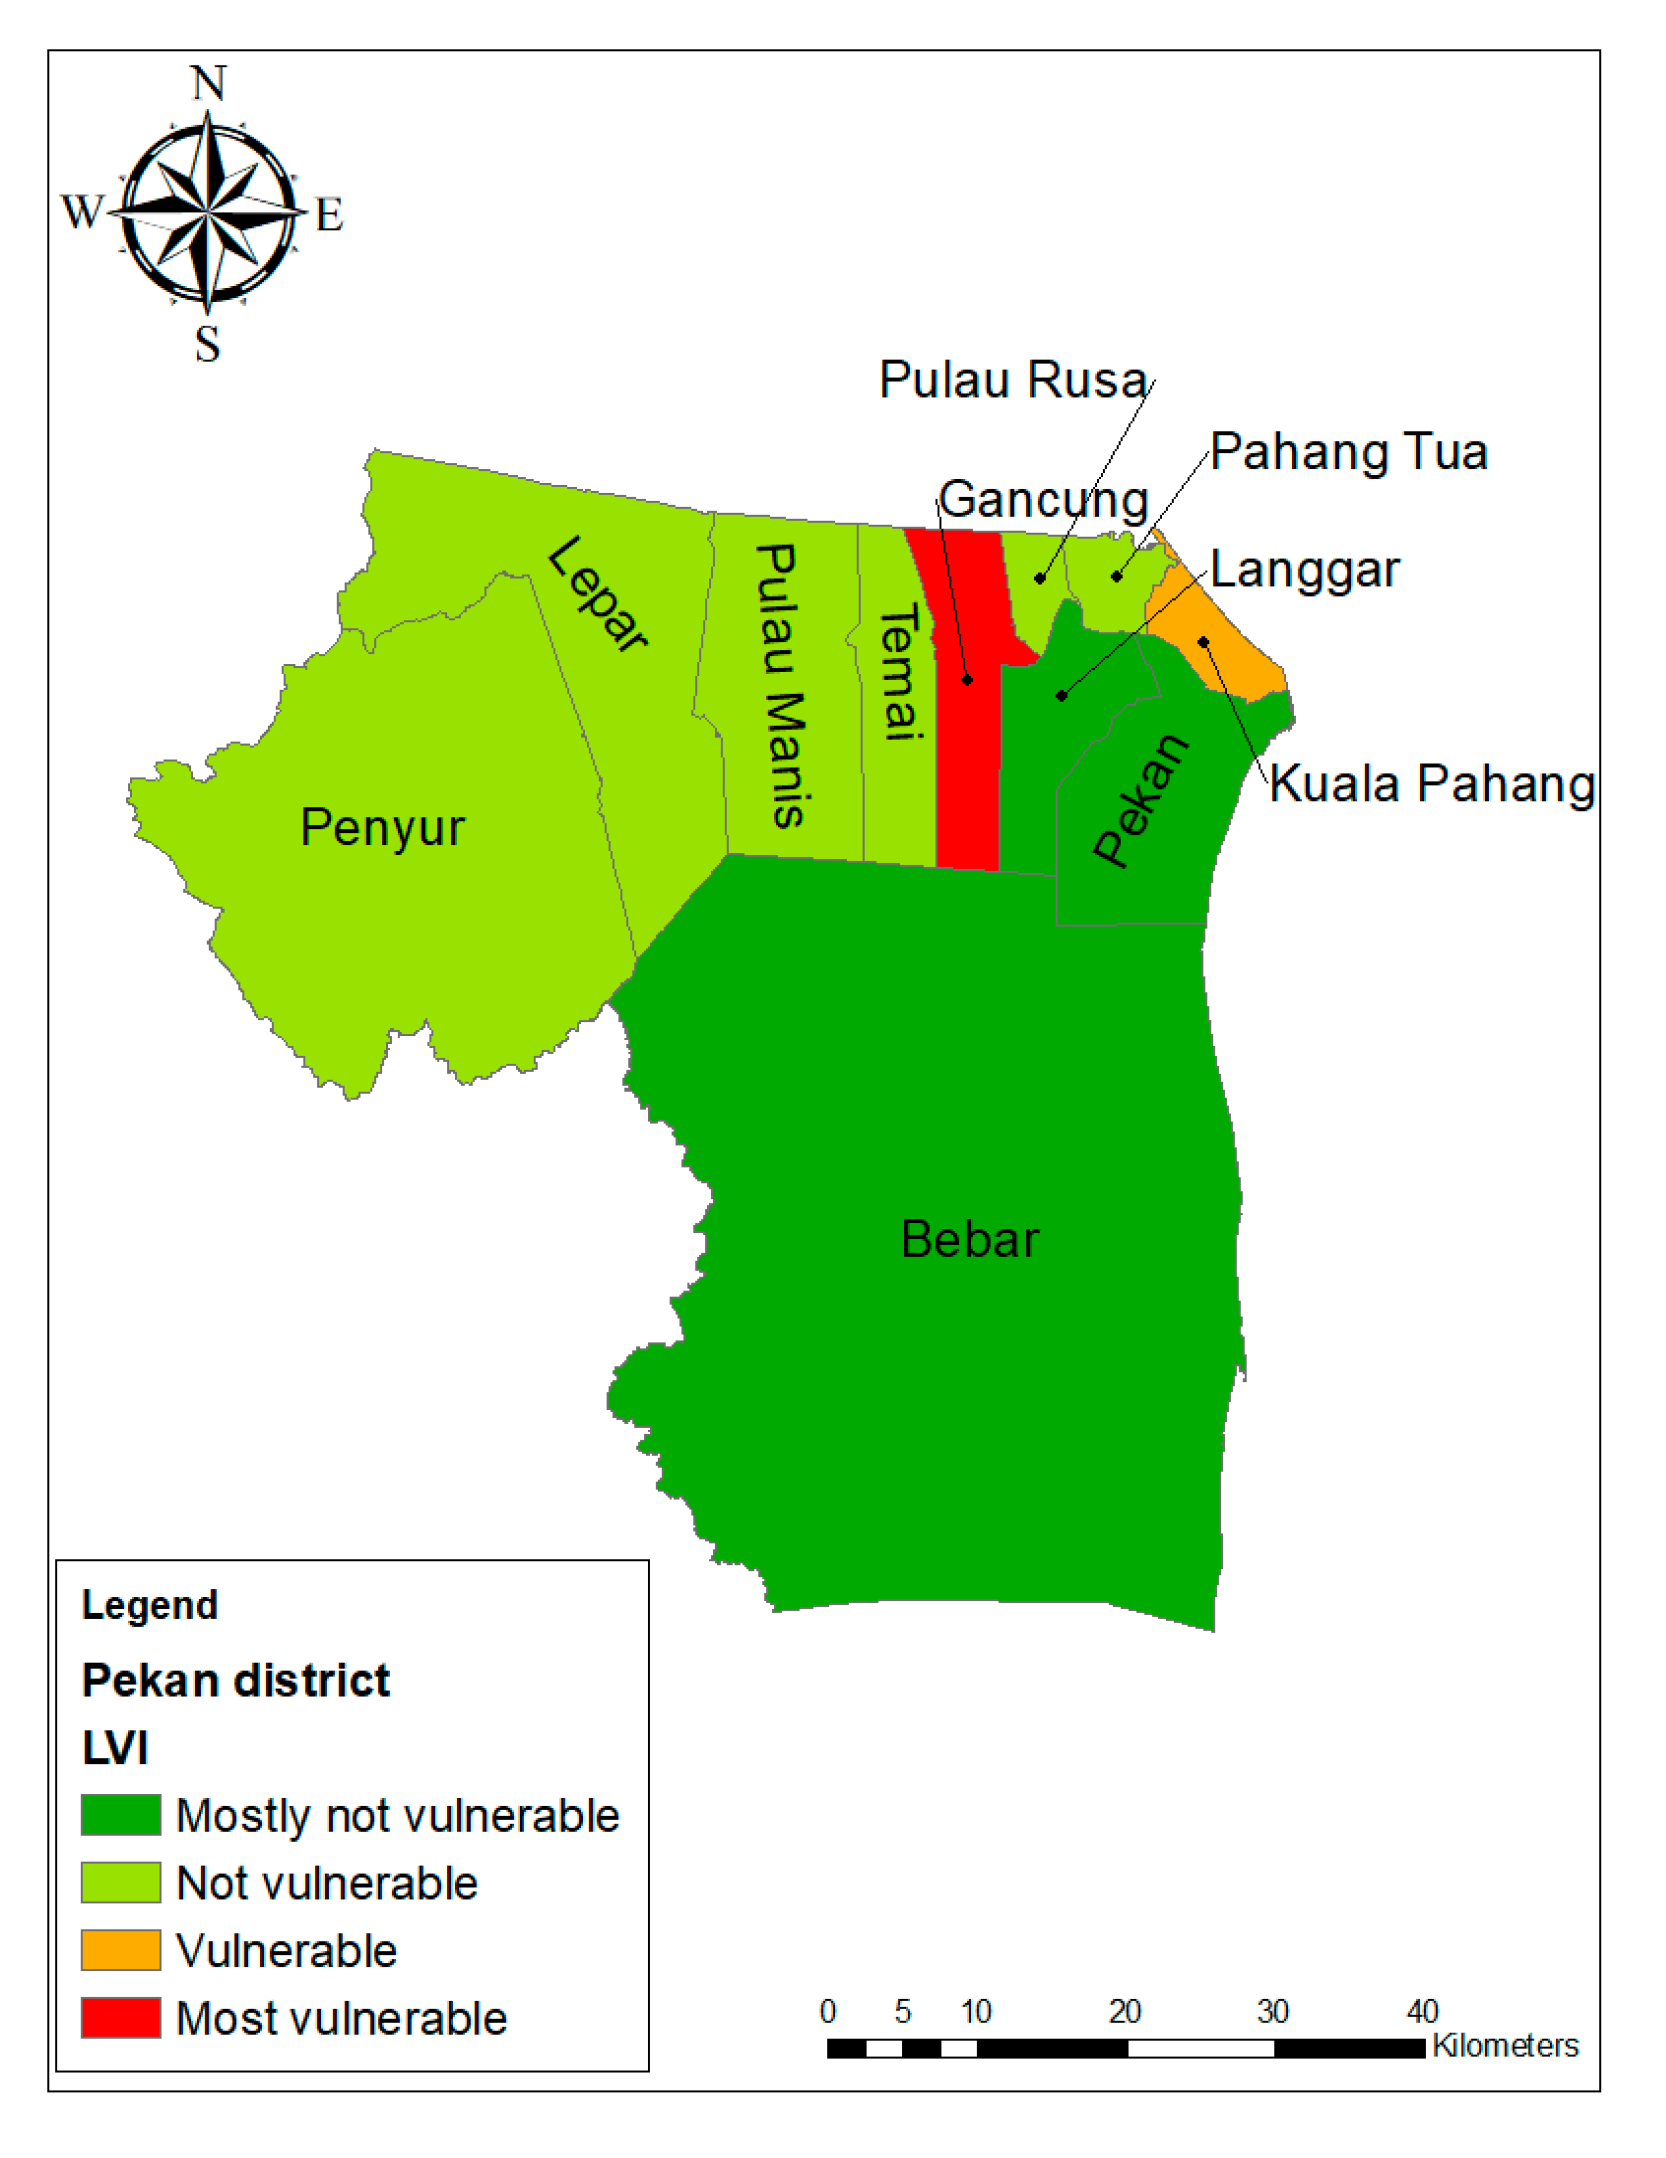
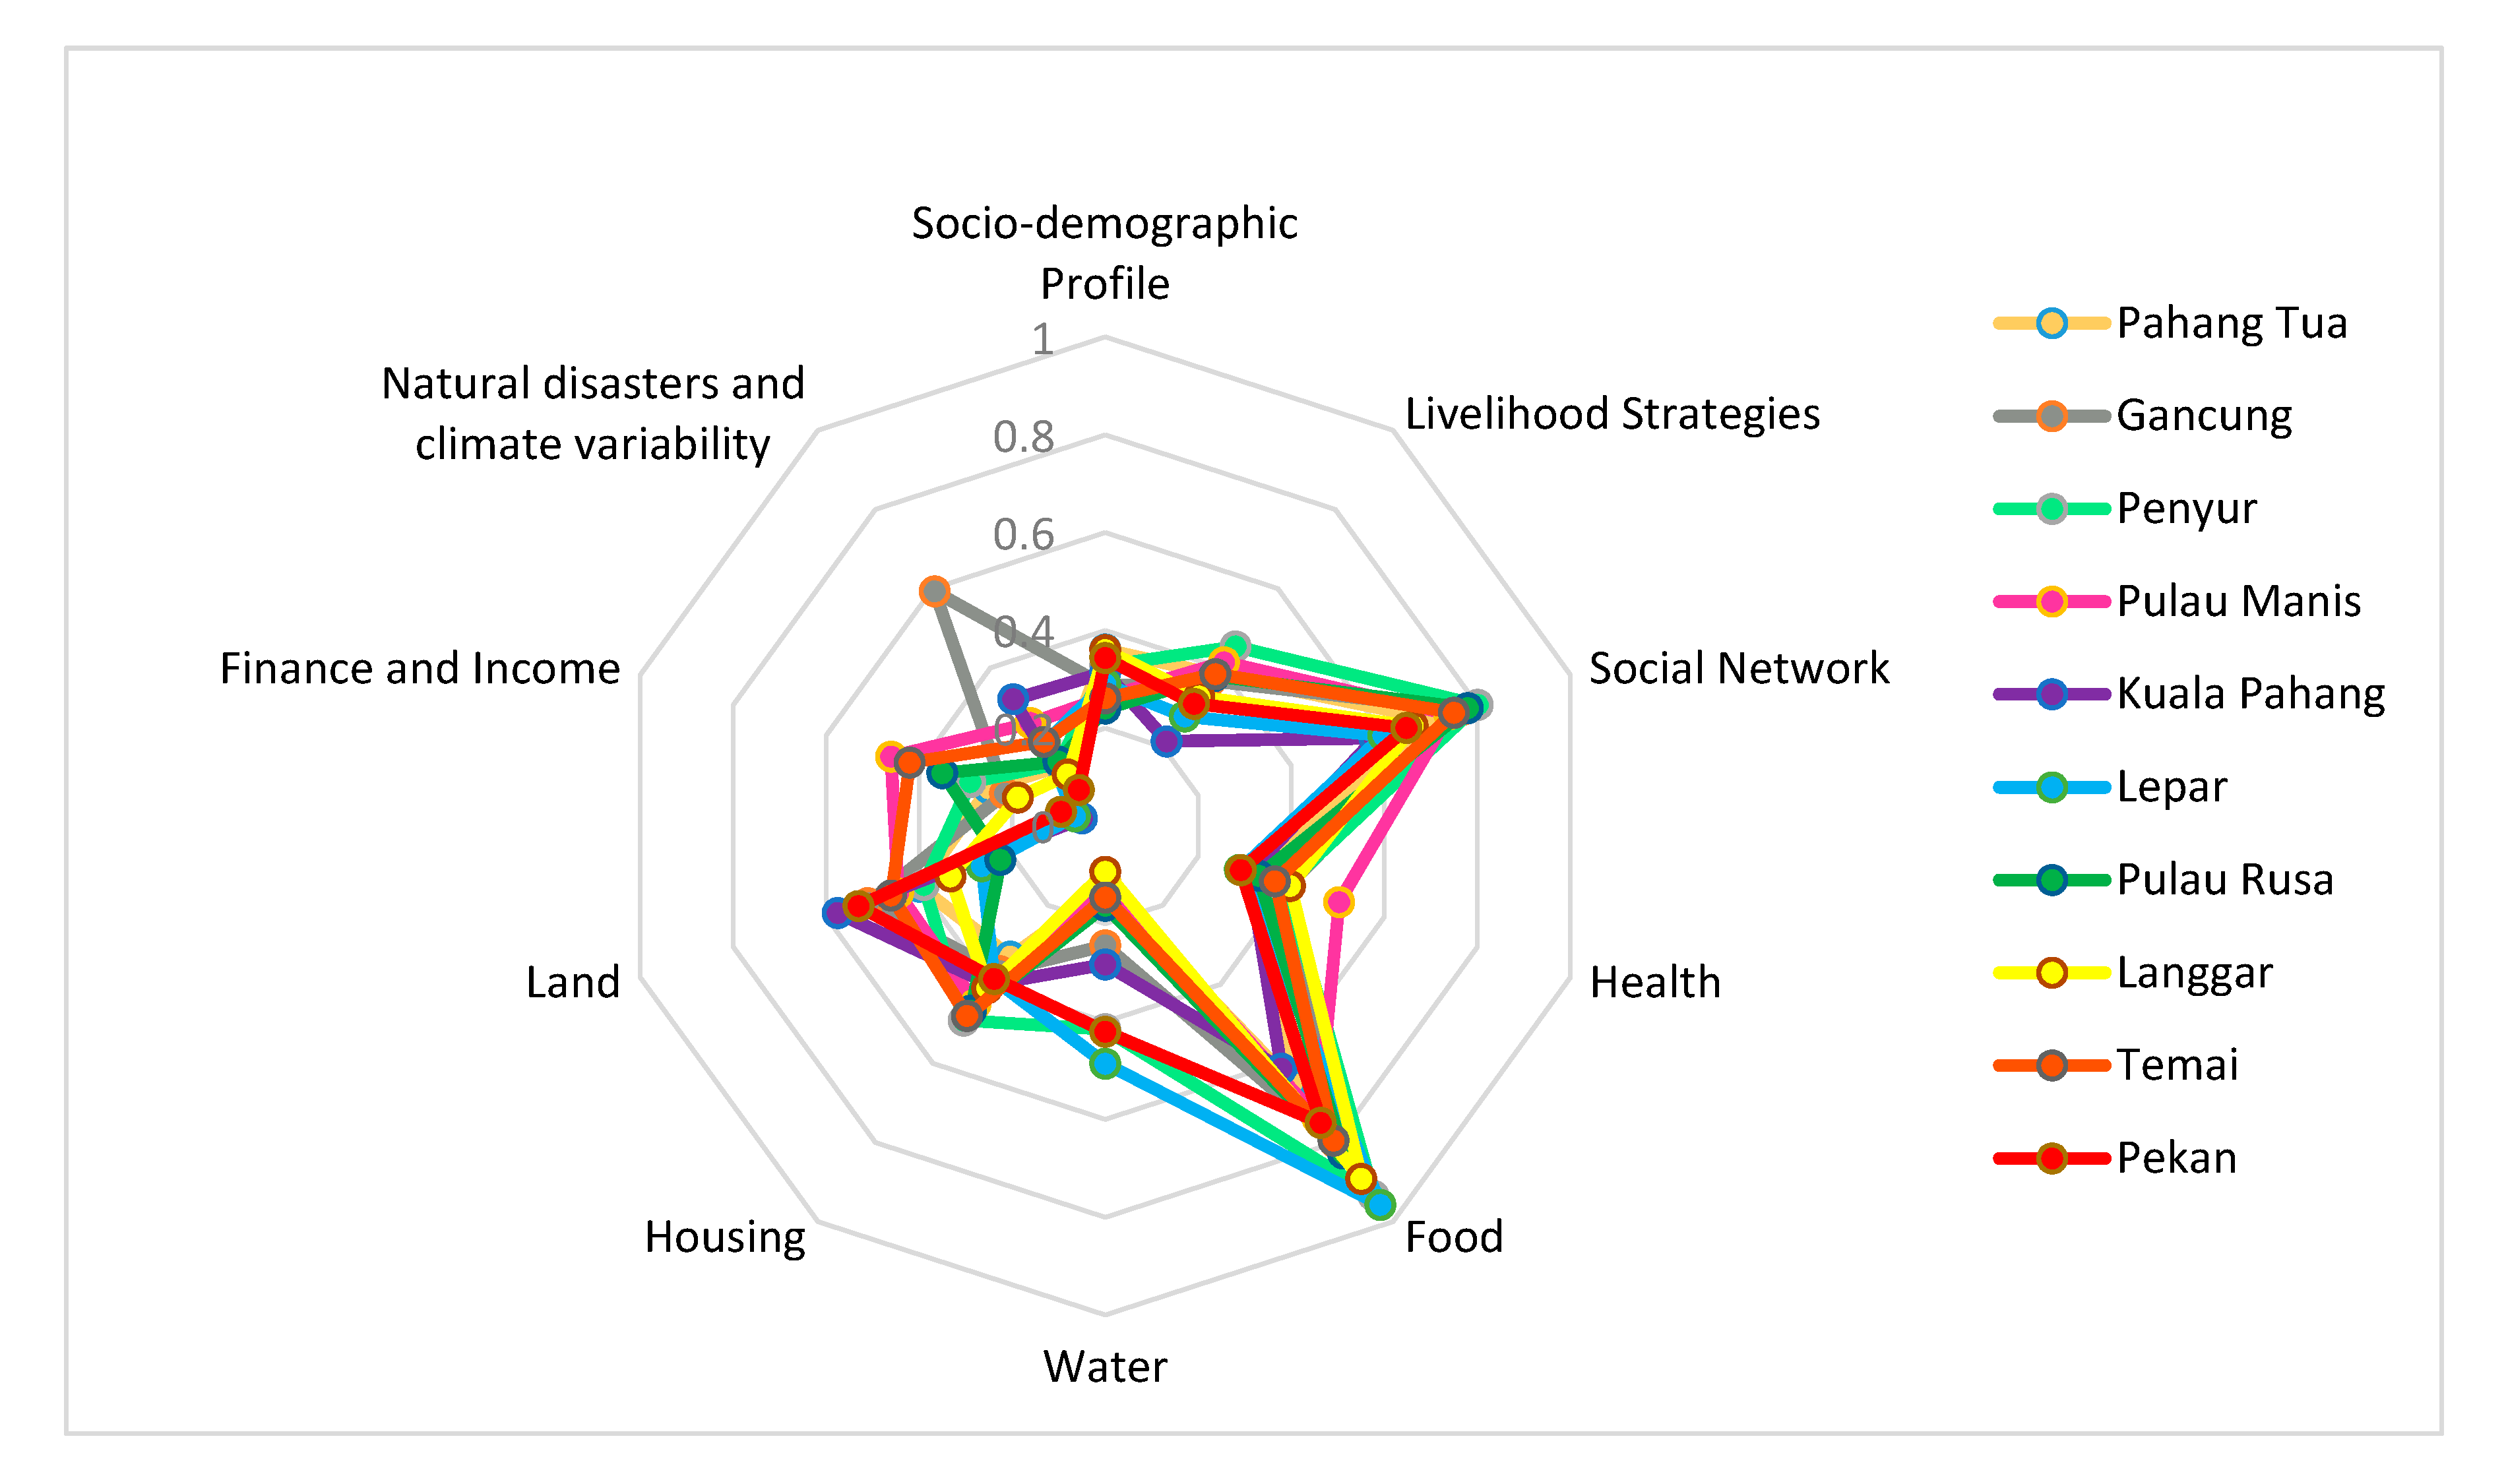
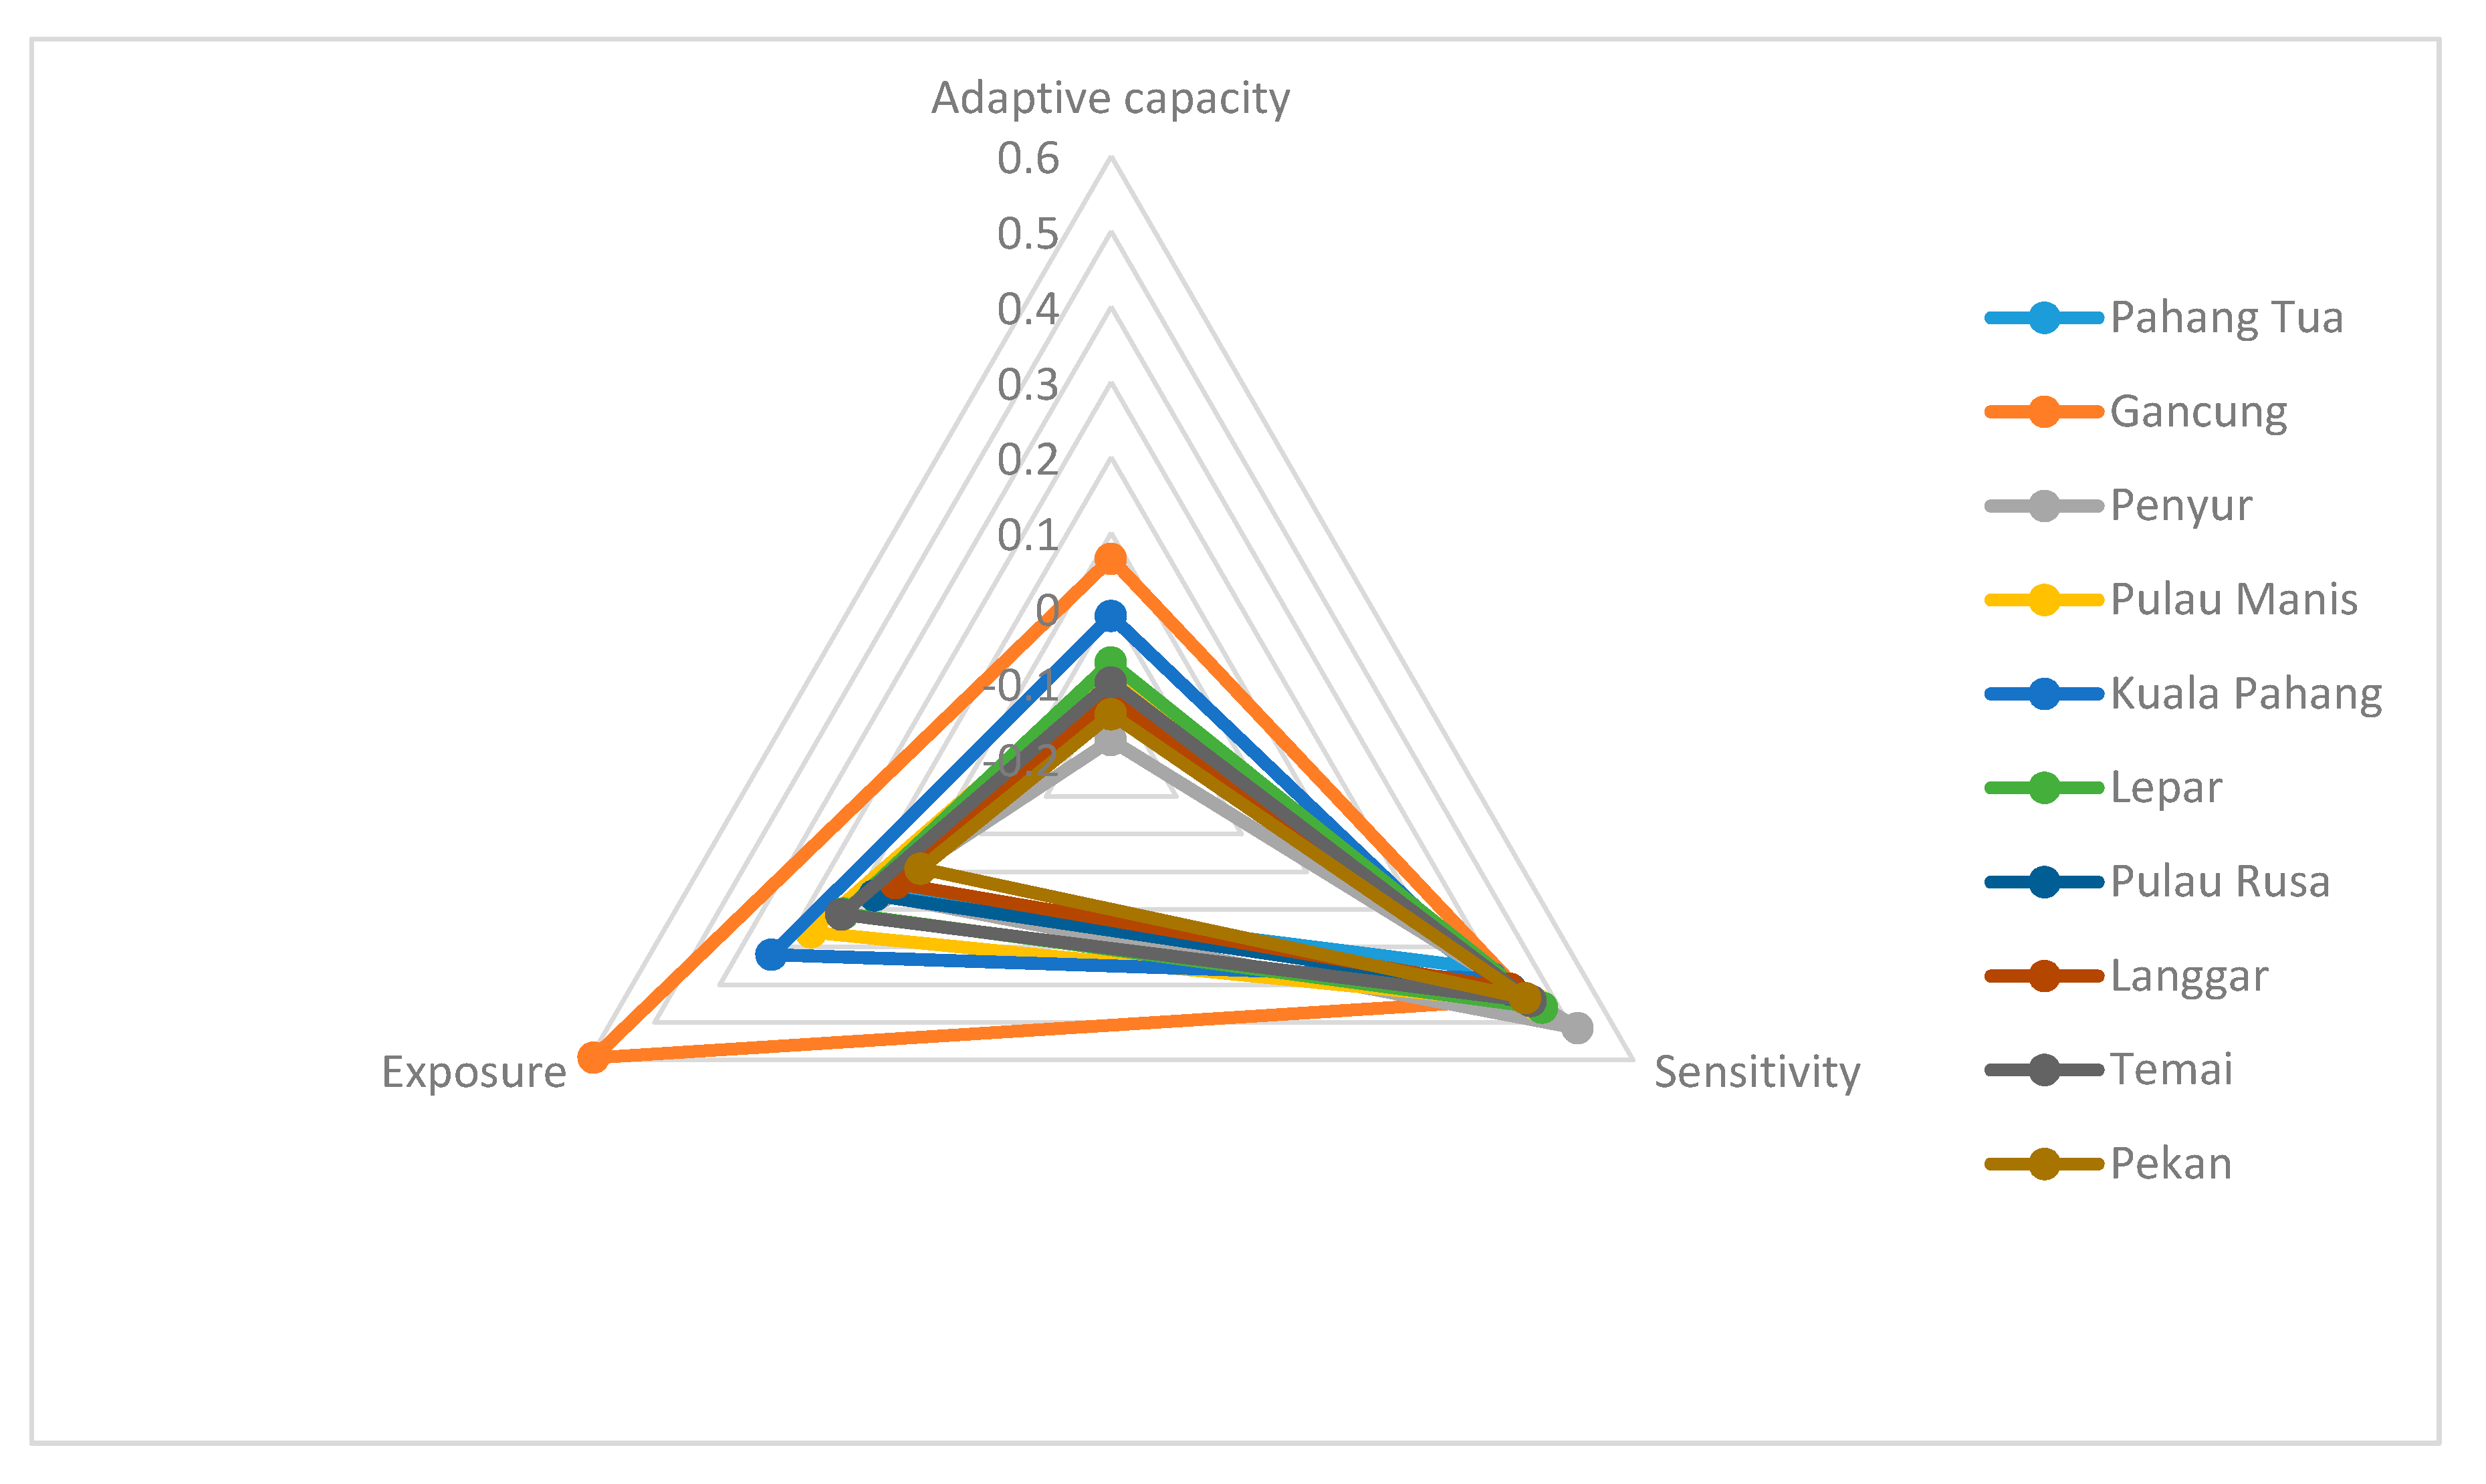
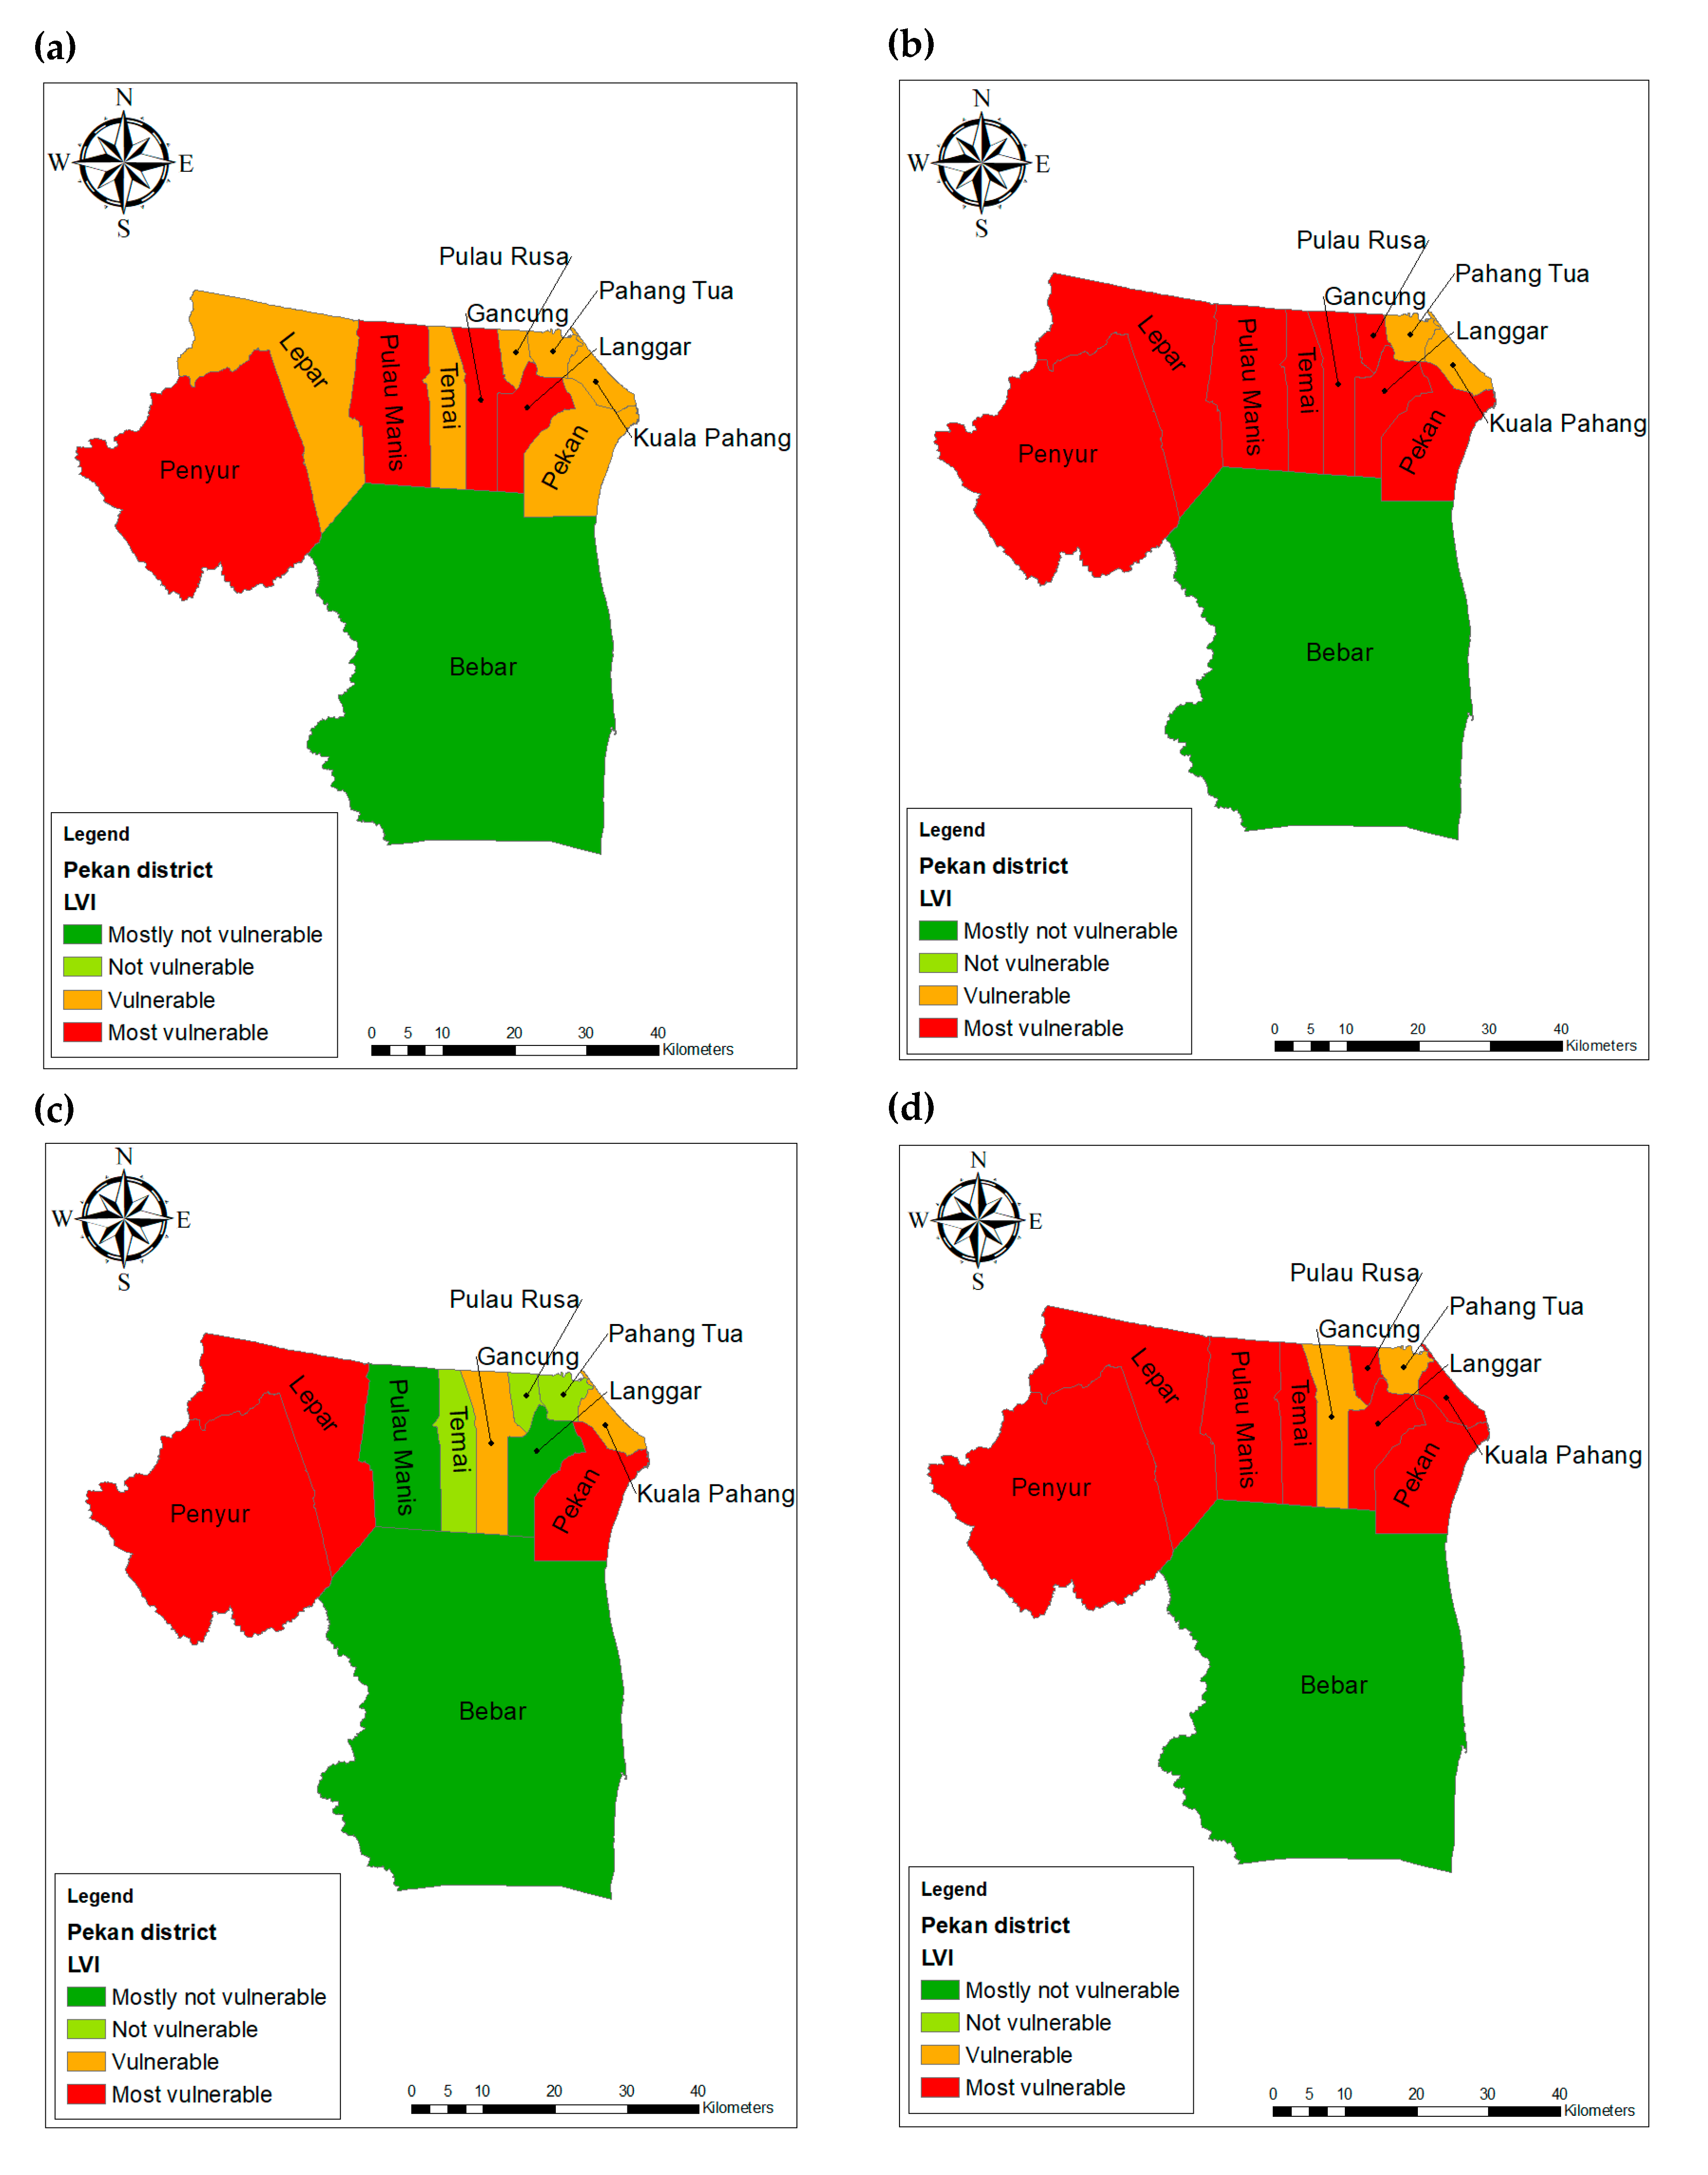
Monsoon floods that annually hit the east coast of Malaysia have brought a variety of implications, especially for those who inhabit the most vulnerable areas. This study aims to find the relationship between the socioeconomy of the community living and flood events in the district of Pekan, Pahang. This involved geographic analyses which combined data on vulnerability index components represented by Geographical Information System (GIS) mapping. A field survey was conducted to assess the Livelihood Vulnerability Index (LVI), comprising major and sub-components of vulnerability for ten sub-districts in Pekan. LVI mapping was performed for every major component of the LVI with spatial data on the district. Households in the Gancung sub-district were found to be more vulnerable to flooding impact, with a high exposure index (0.59), but reported a positive vulnerability based on adaptive capacity (0.06). Penyur (0.51) was the most vulnerable and sensitive in terms of food security during the flood season. LVI assessment in the Pekan district could be used as an indicator to change livelihoods, survival food storage practices, and other preventive measures in order to curb damages and injuries when annual flooding strikes in the future.
Keywords: flood; vulnerability; adaptive capacity; sensitivity; exposure; GIS flood; vulnerability; adaptive capacity; sensitivity; exposure; GIS