Deciphering the Manufacturing Production Space in Global City-Regions of Developing Countries—a Case of Pearl River Delta, China


Abstract
:1. Introduction
2. Data and Material
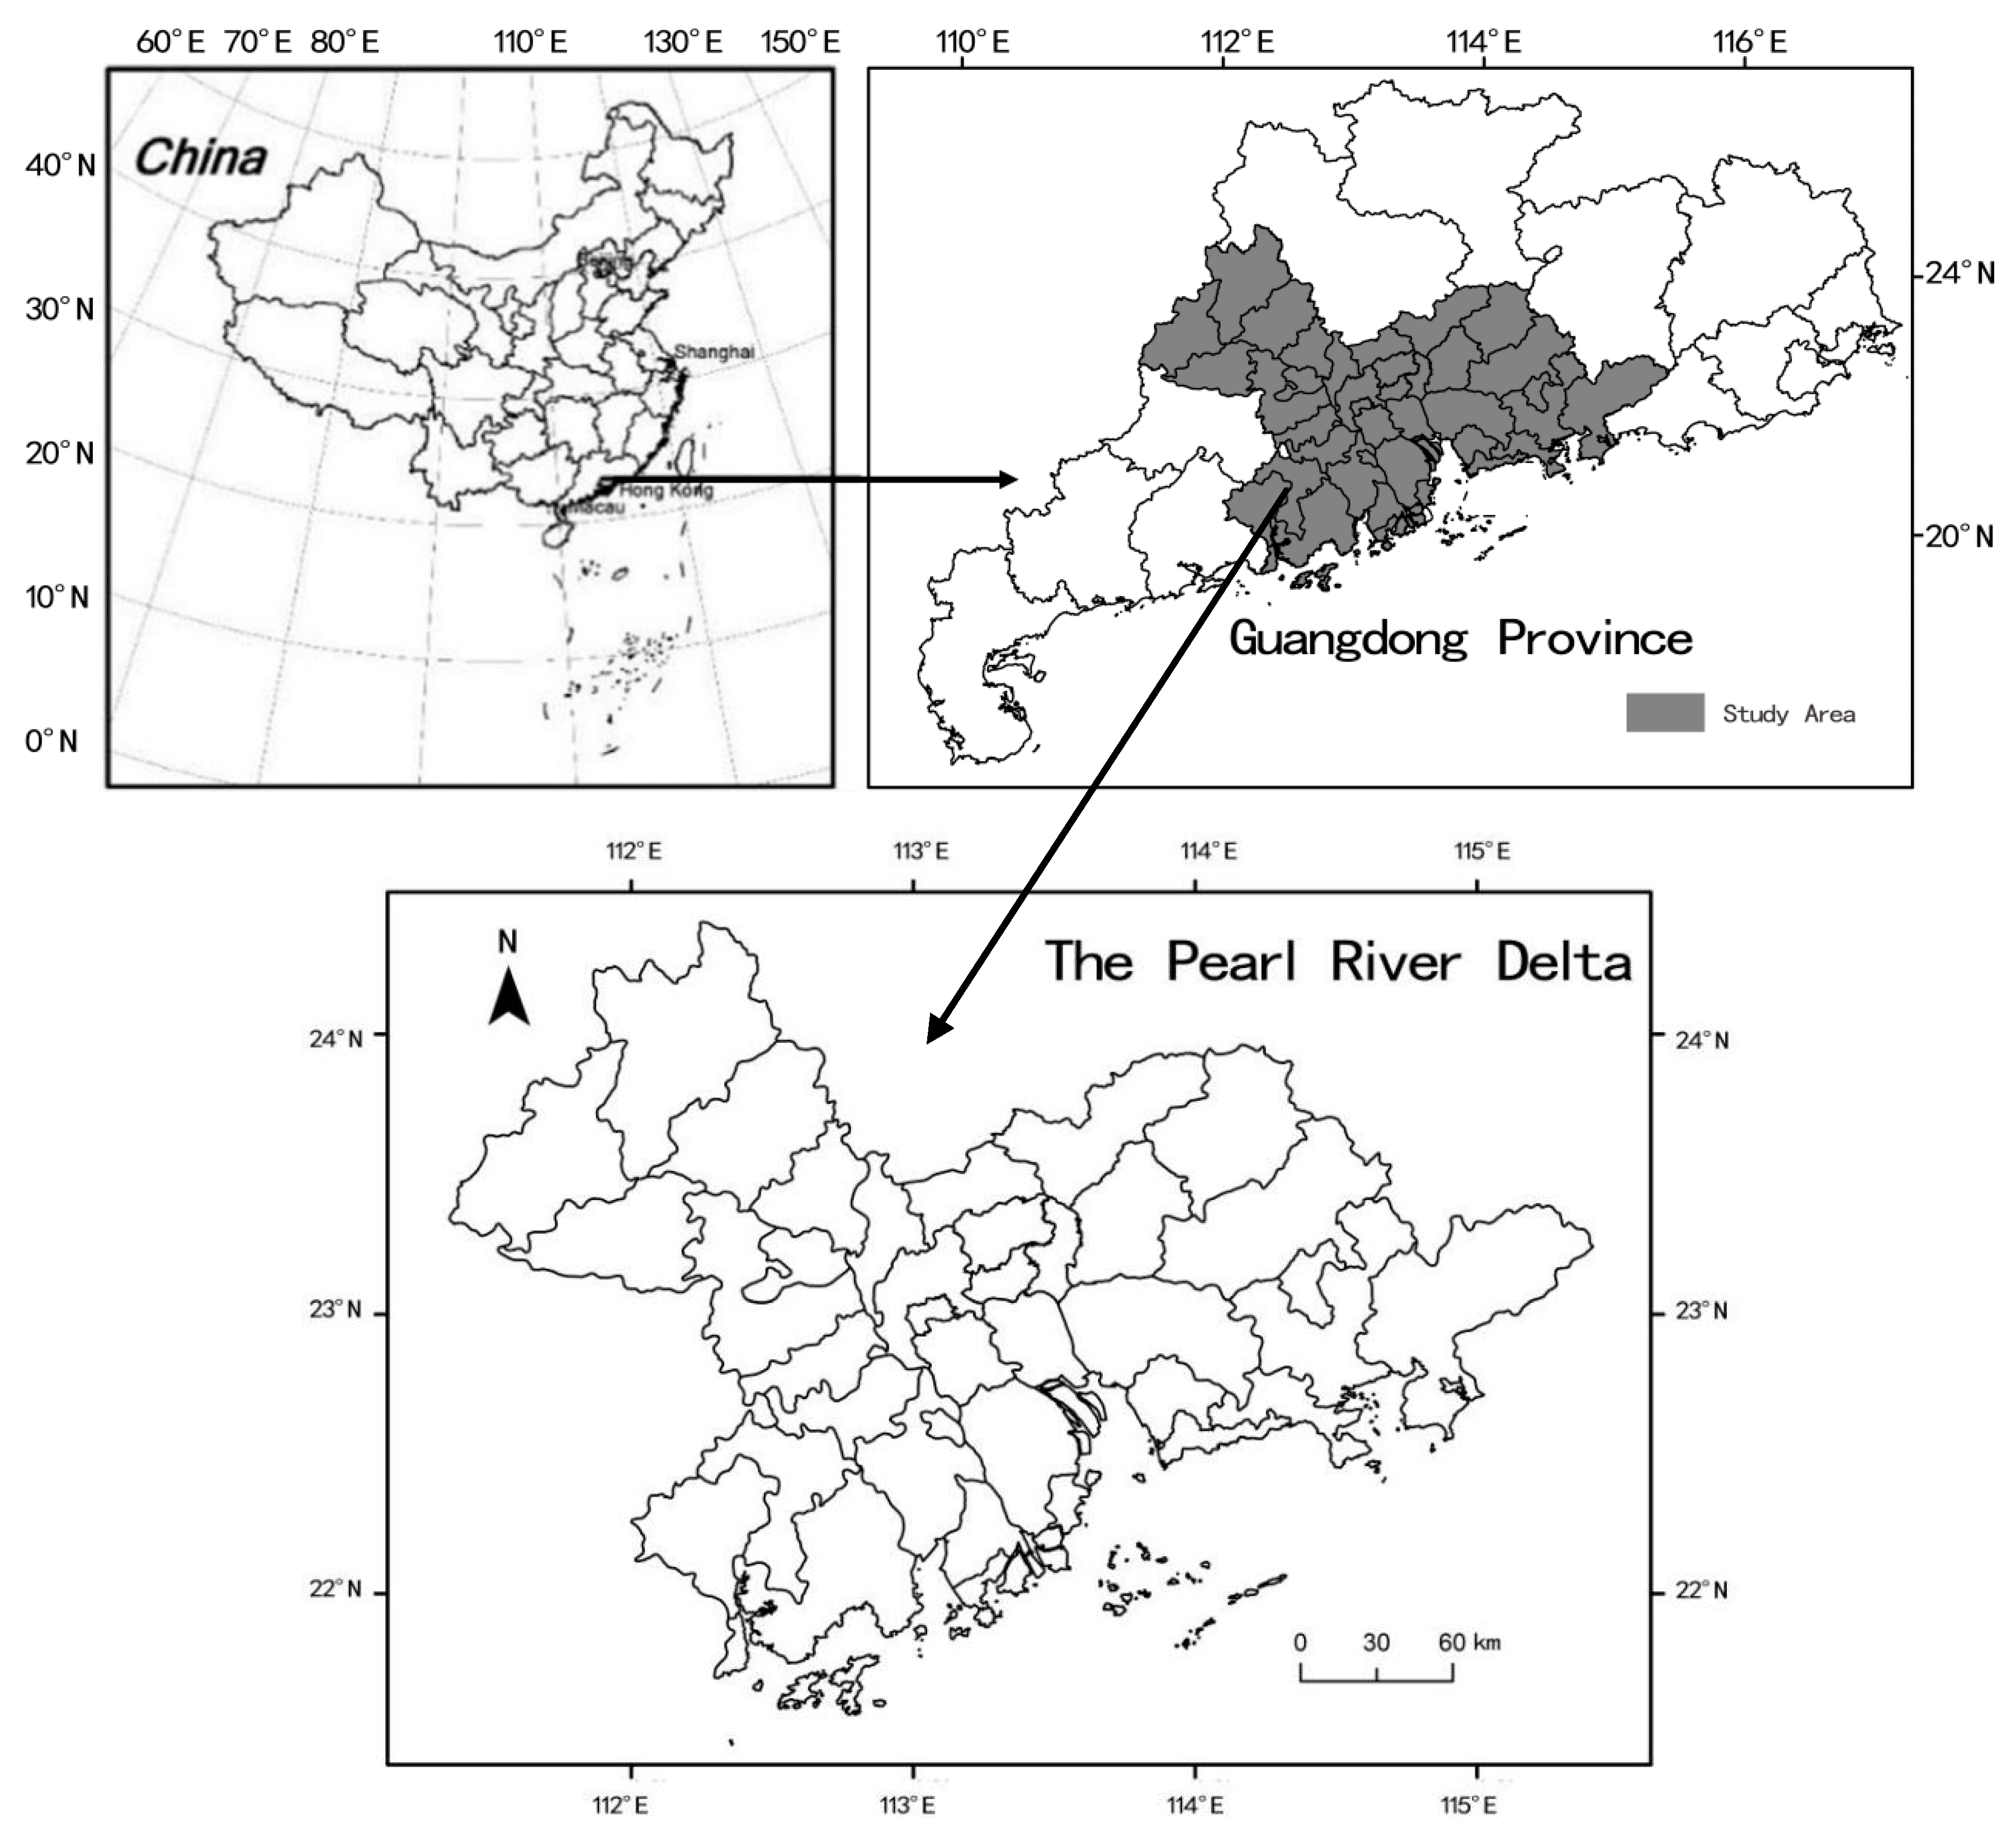
2.1. Study Area and Data
2.1.1. Study Area
2.1.2. Data
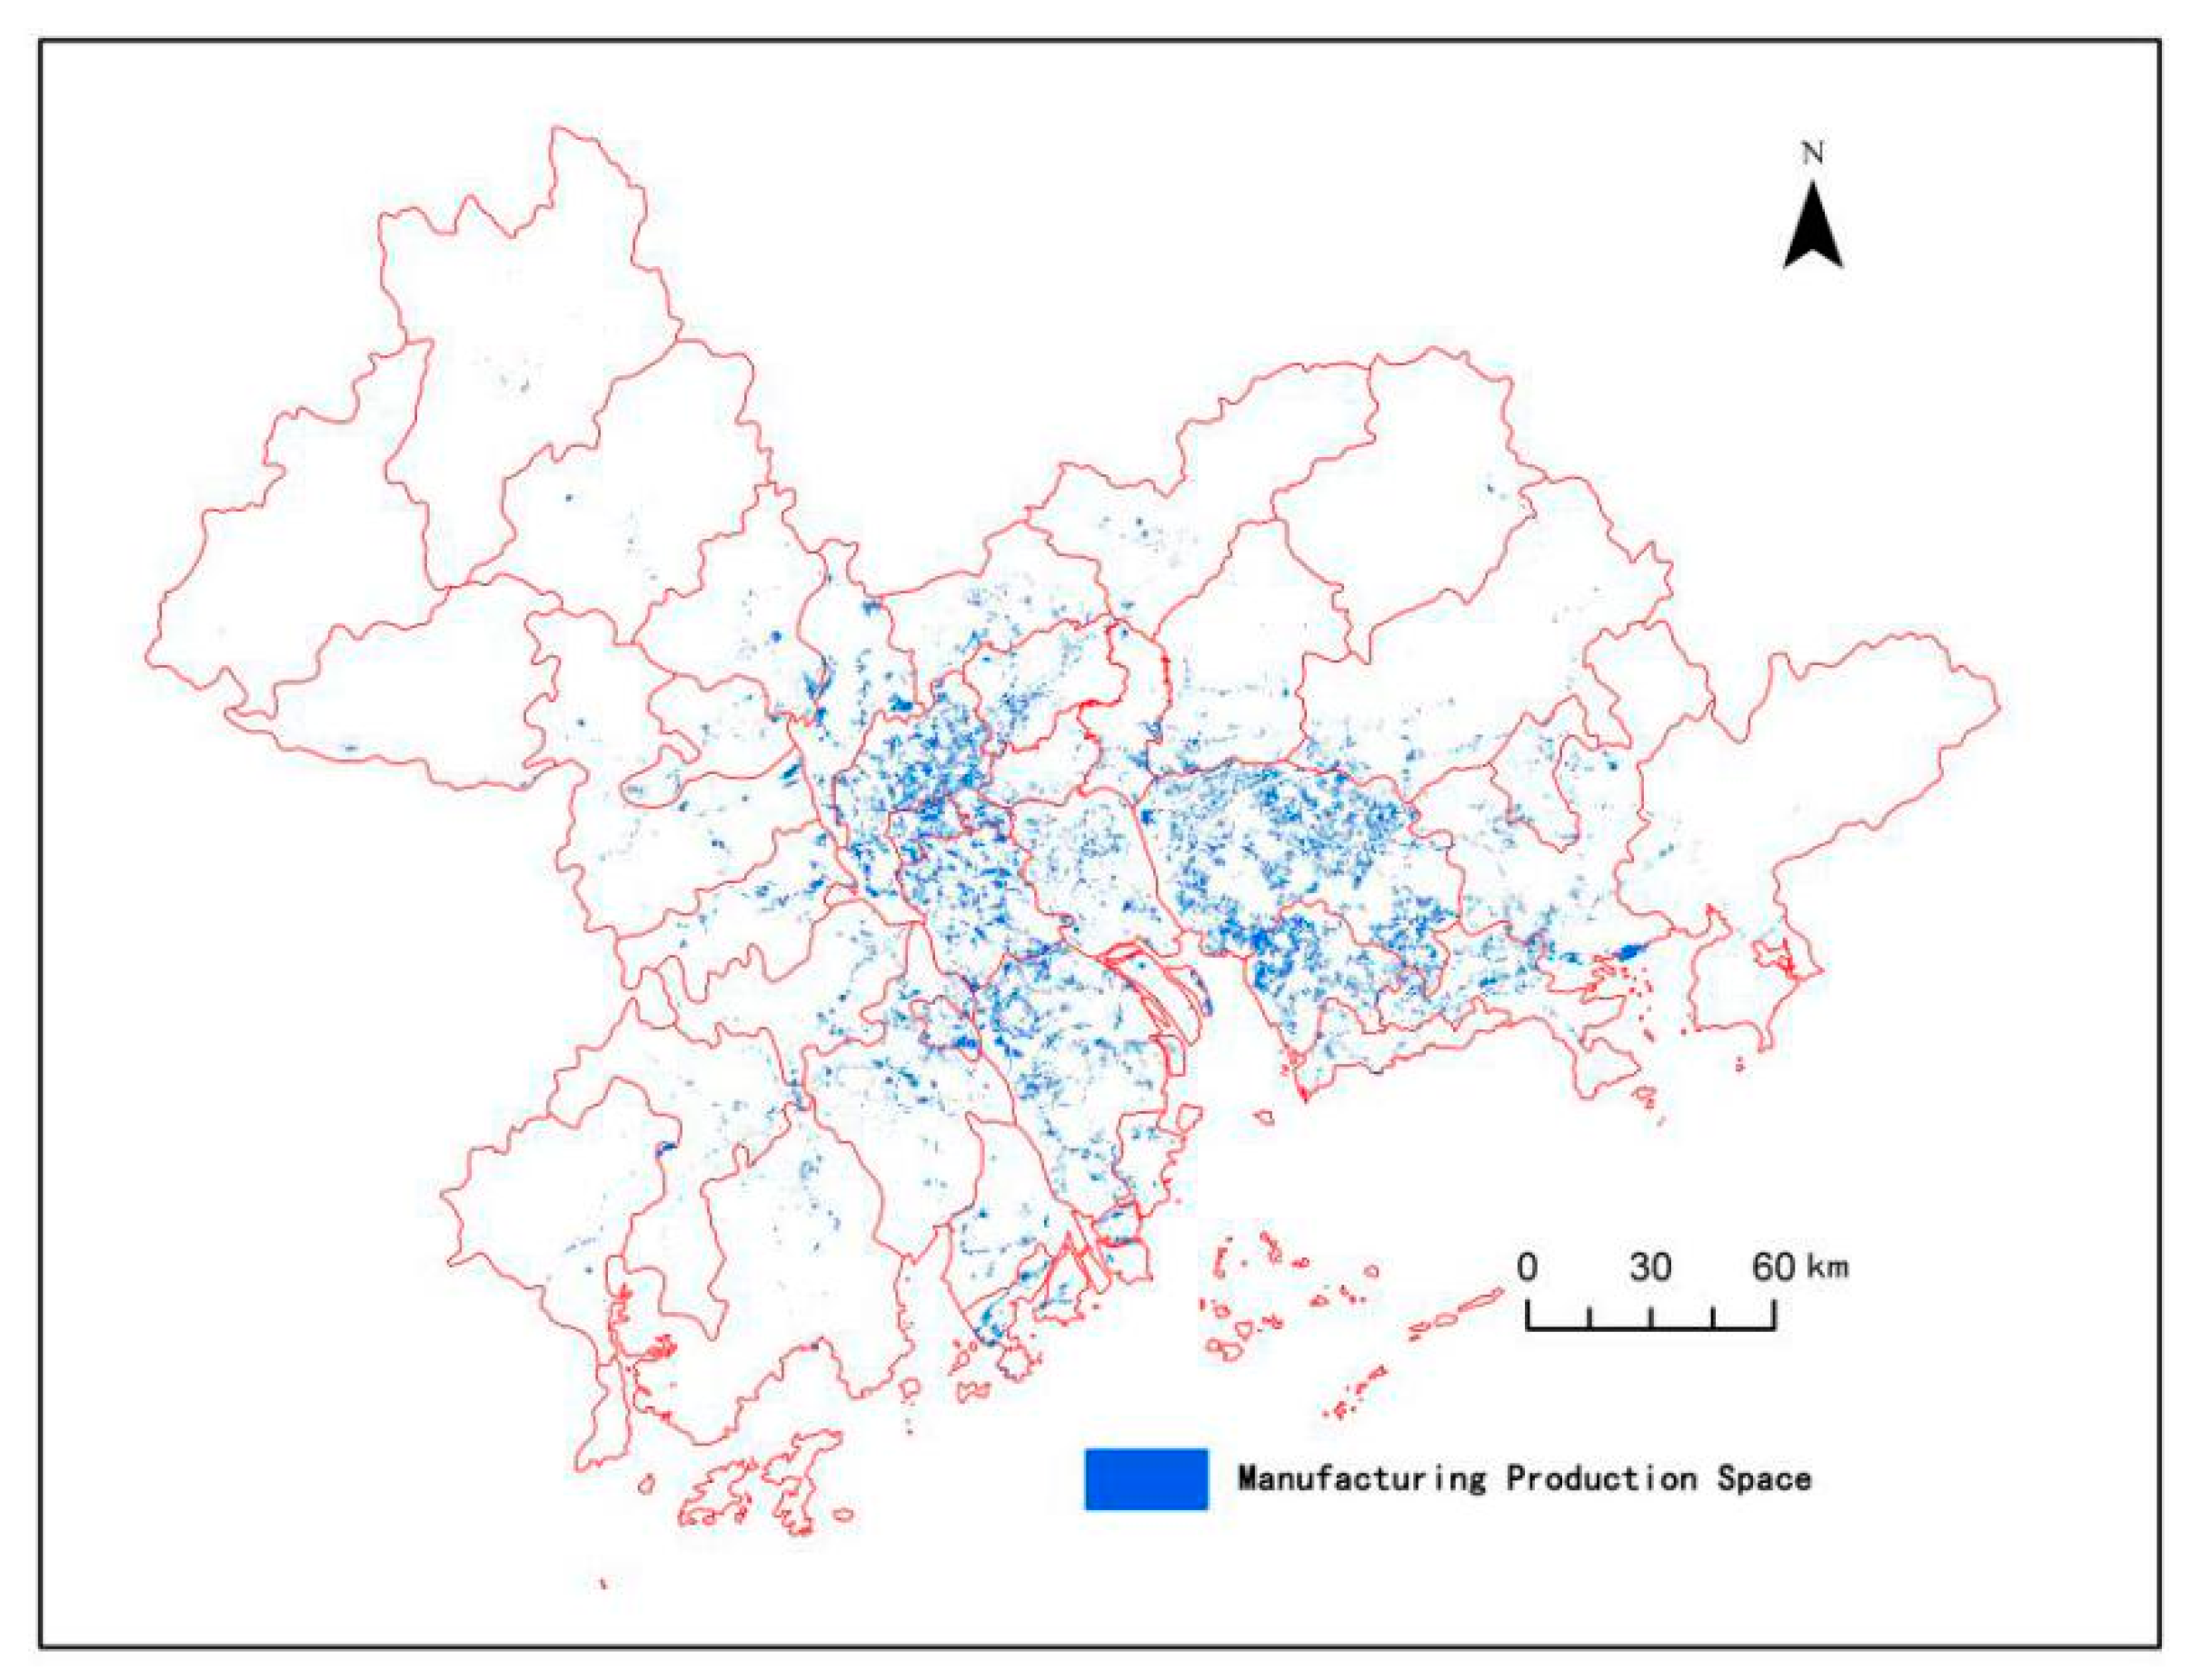
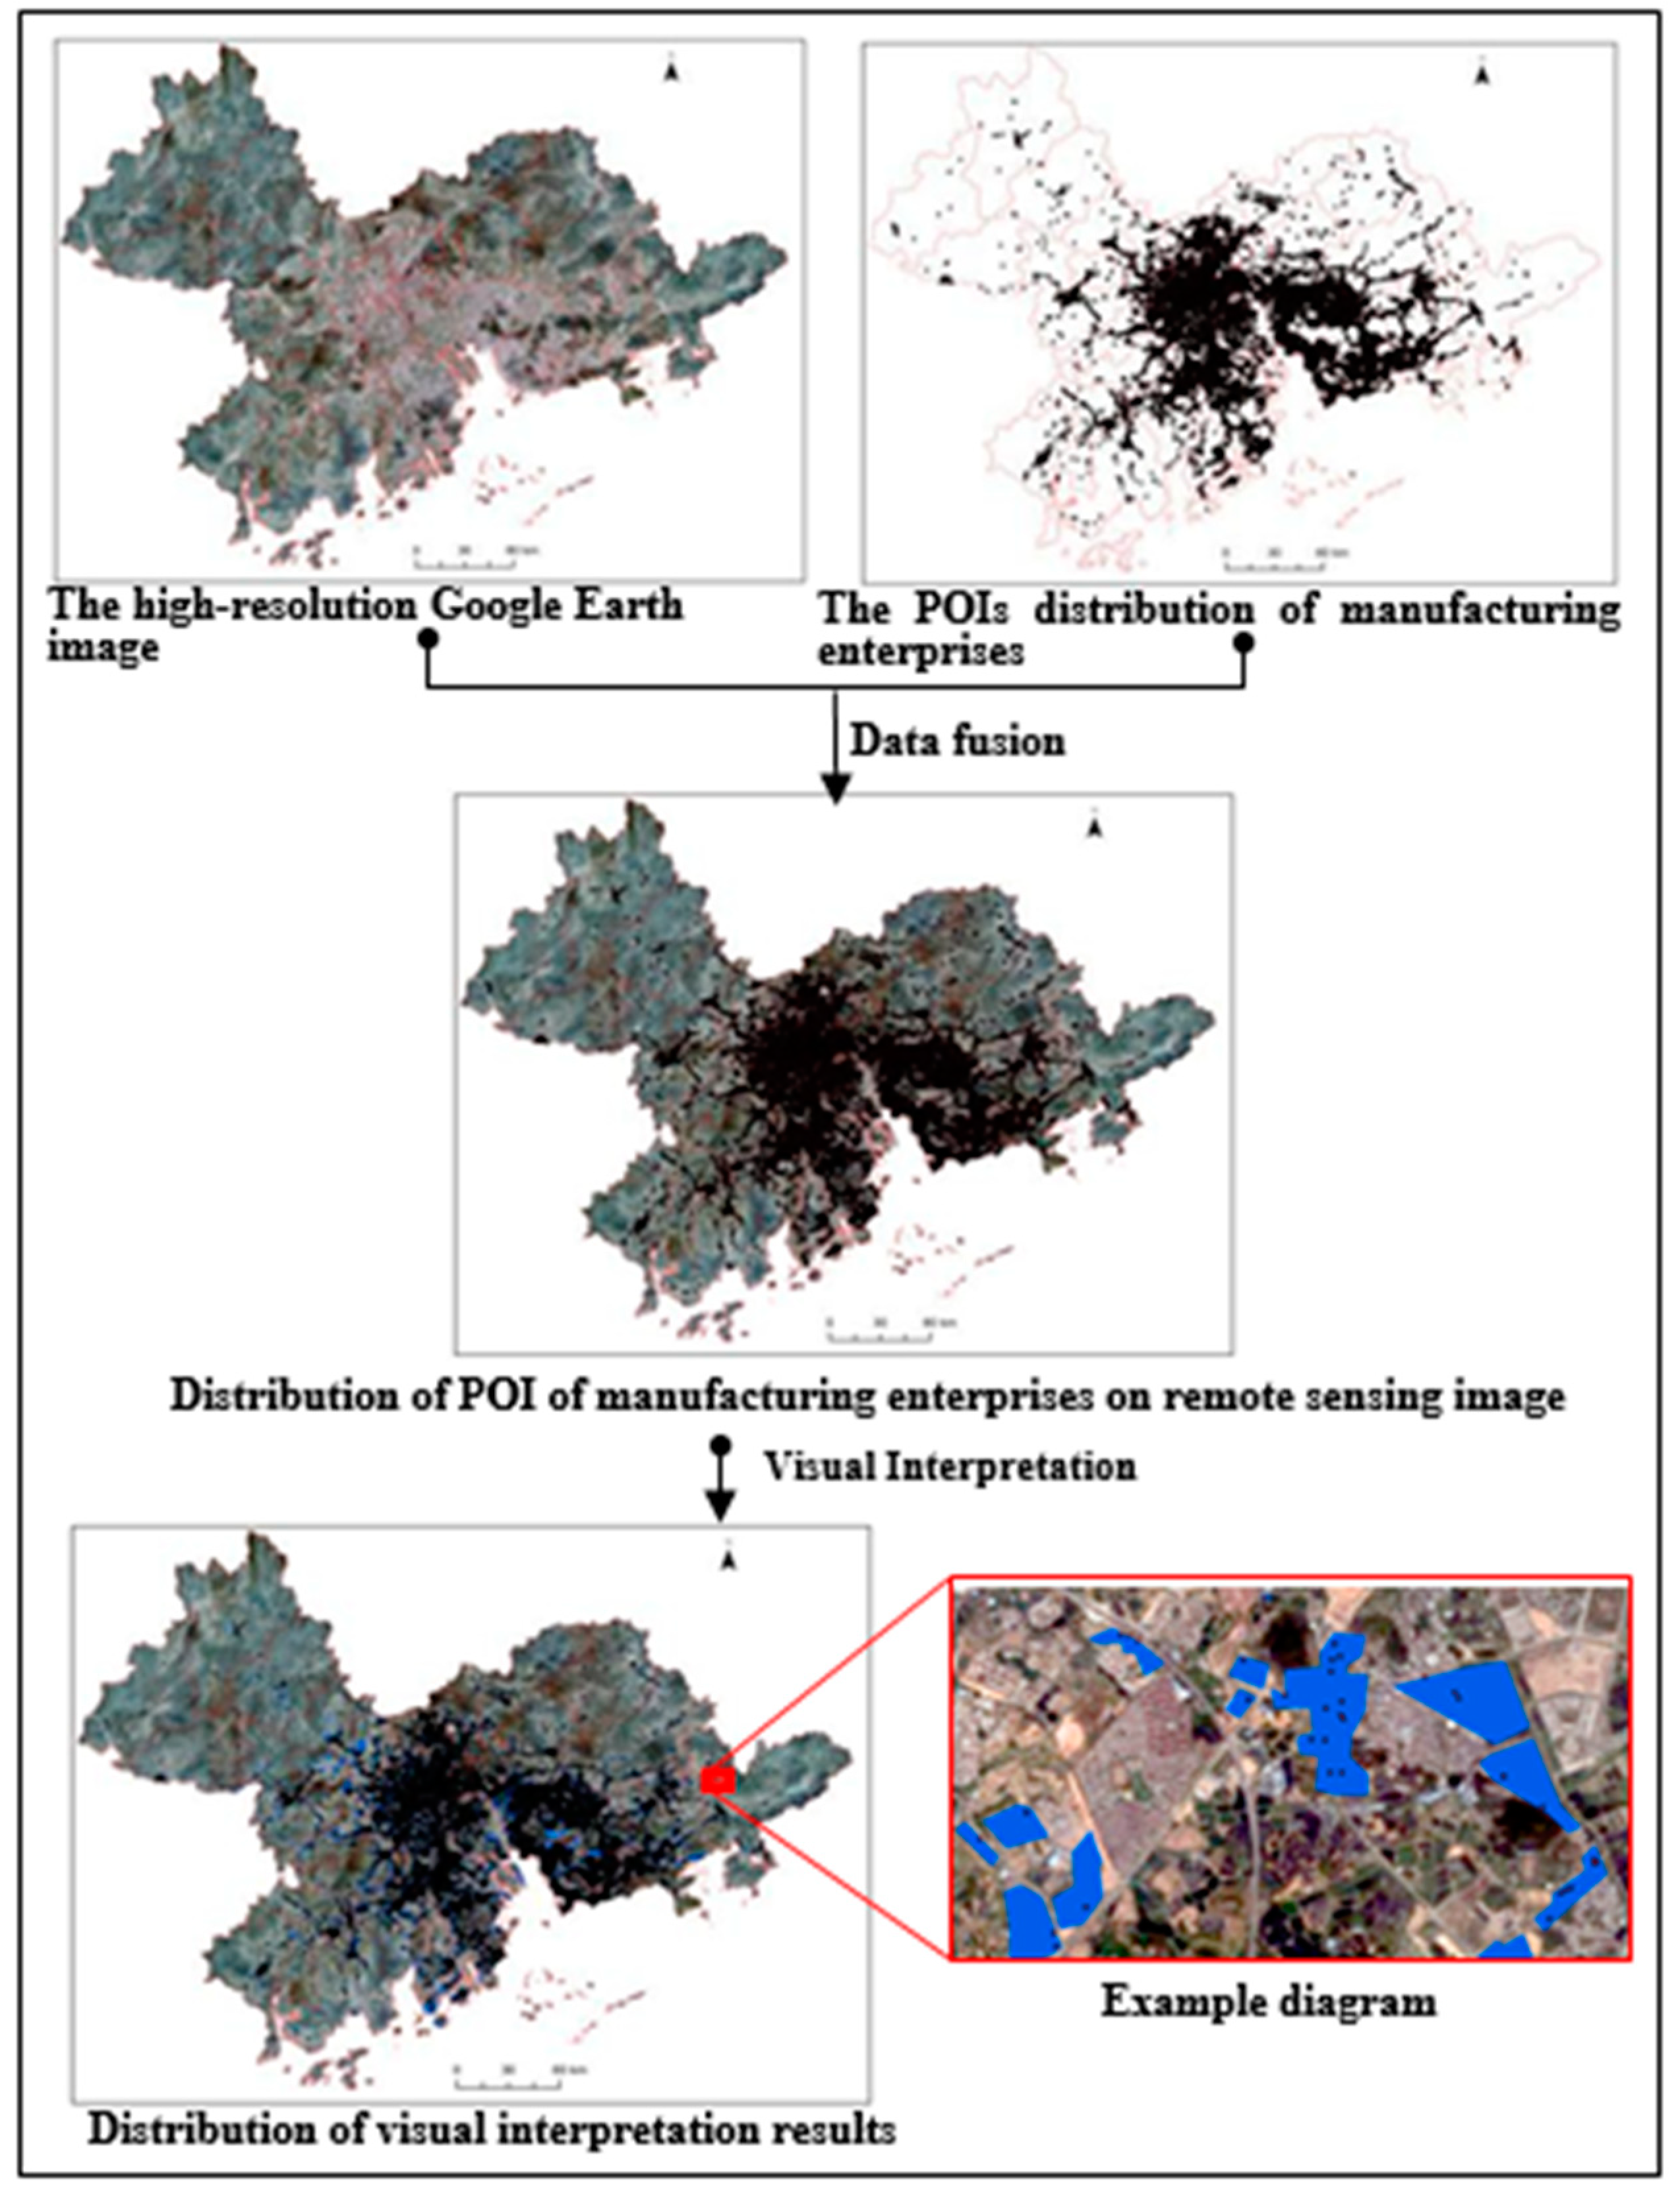
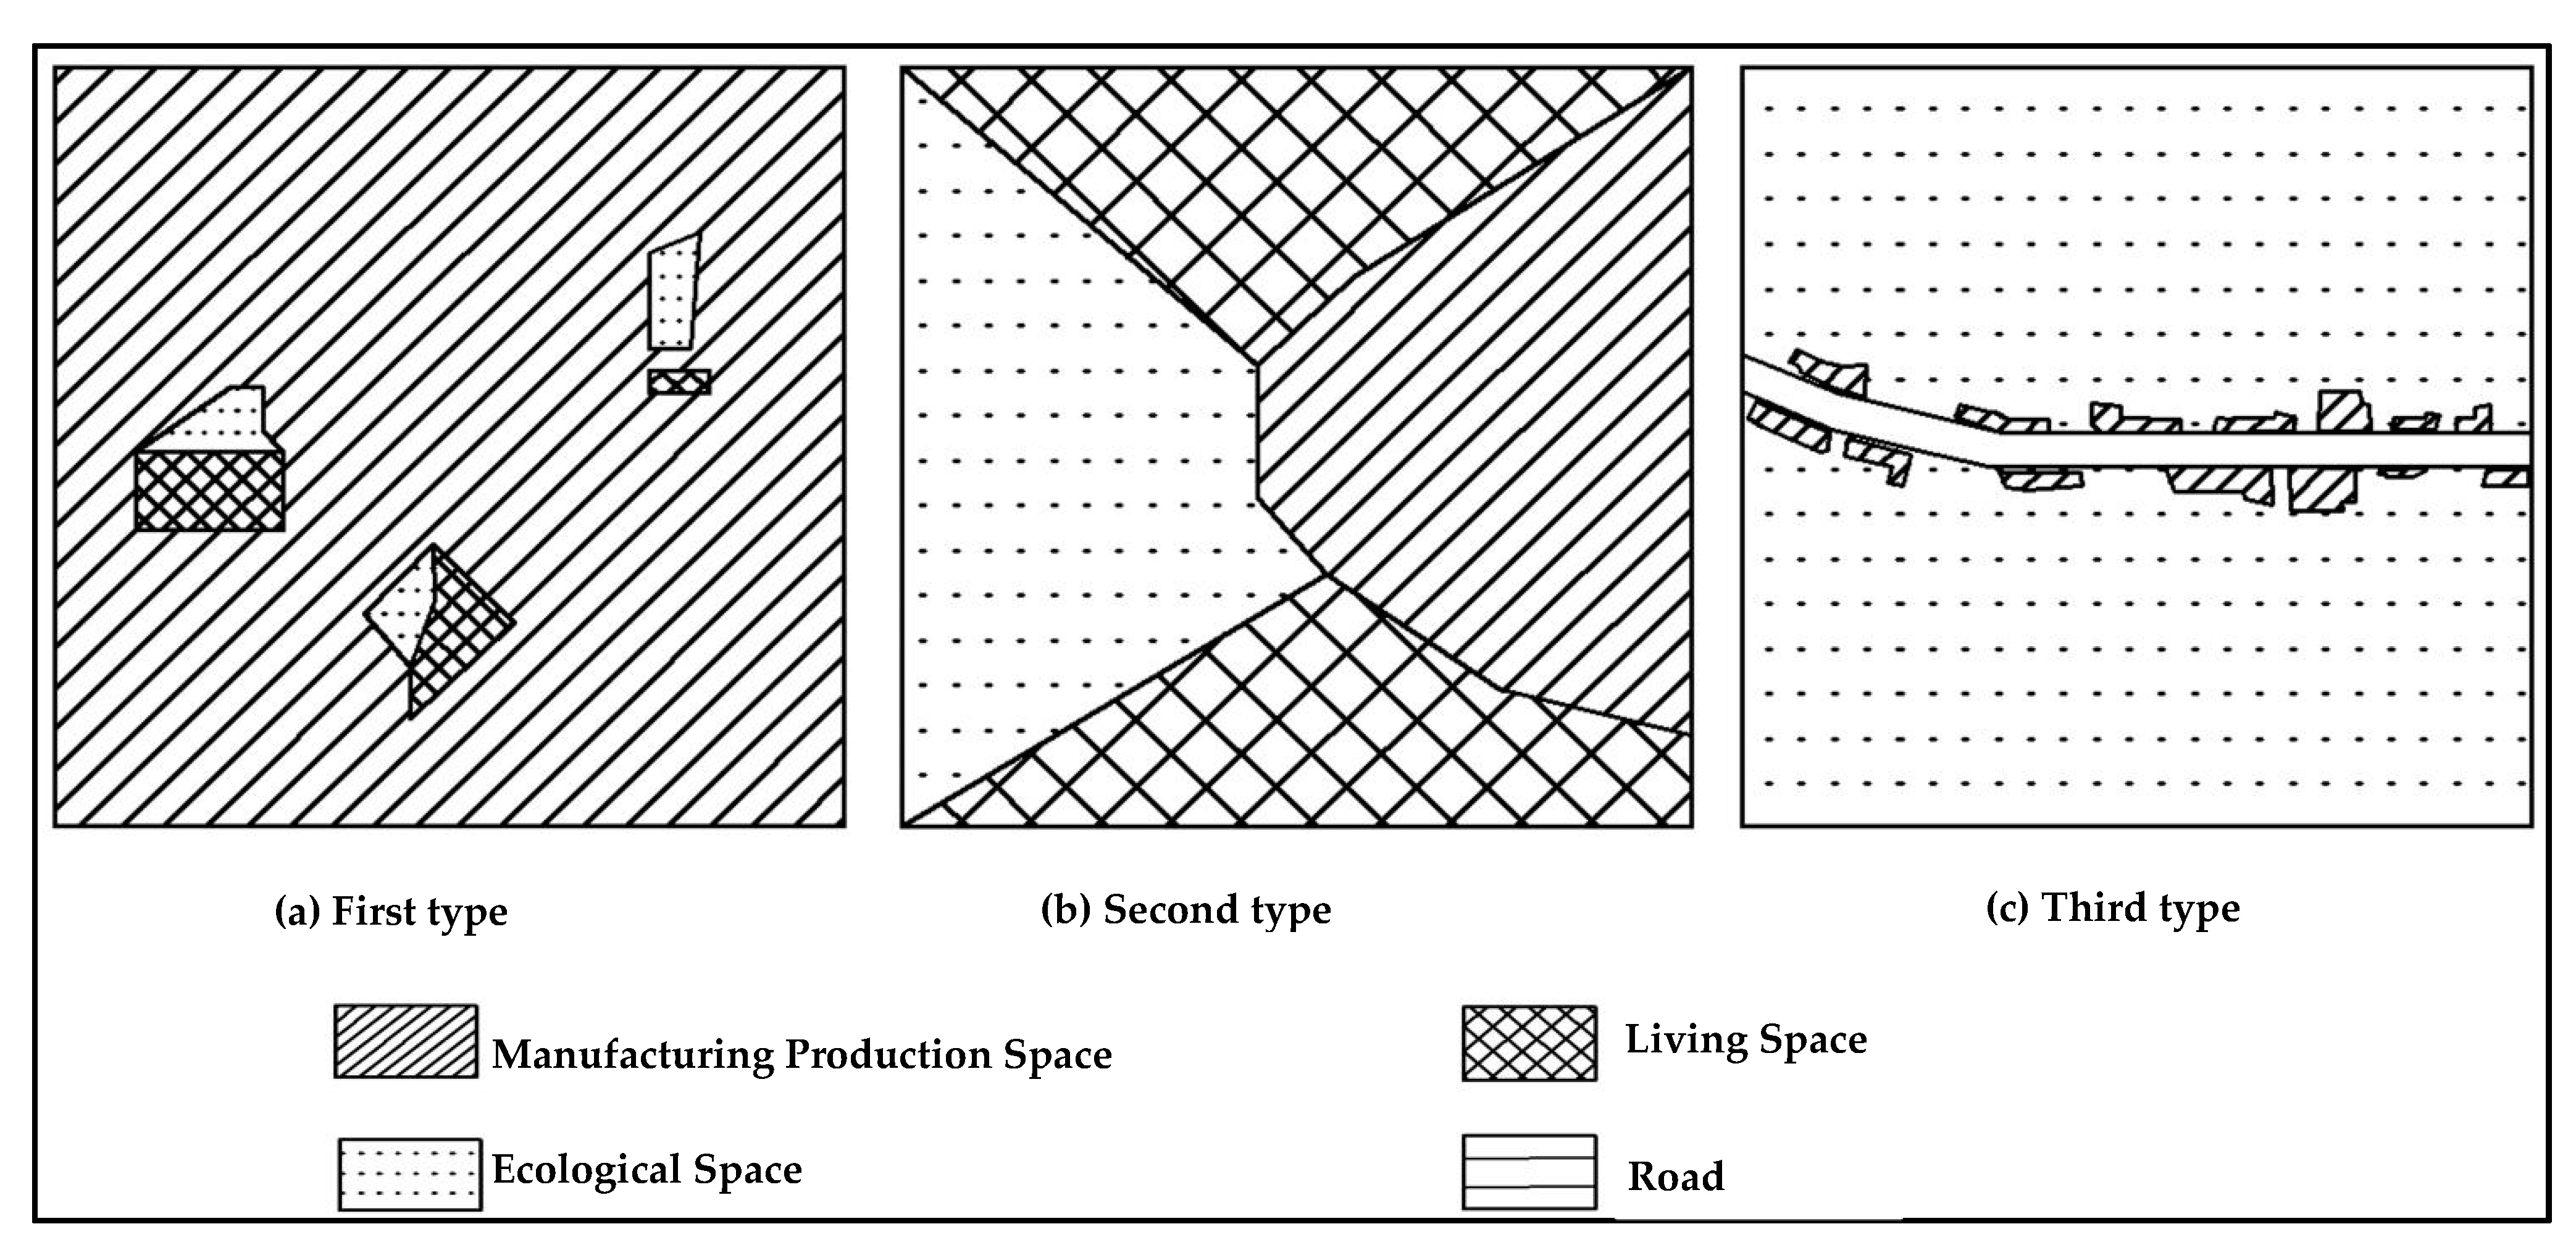
2.2. Remote Sensing Interpretation of Manufacturing Production Space
3. Methodology
3.1. Spatial Feature Analysis Method
3.1.1. Stability Index
3.1.2. Form Compactness Index
3.1.3. Density Index
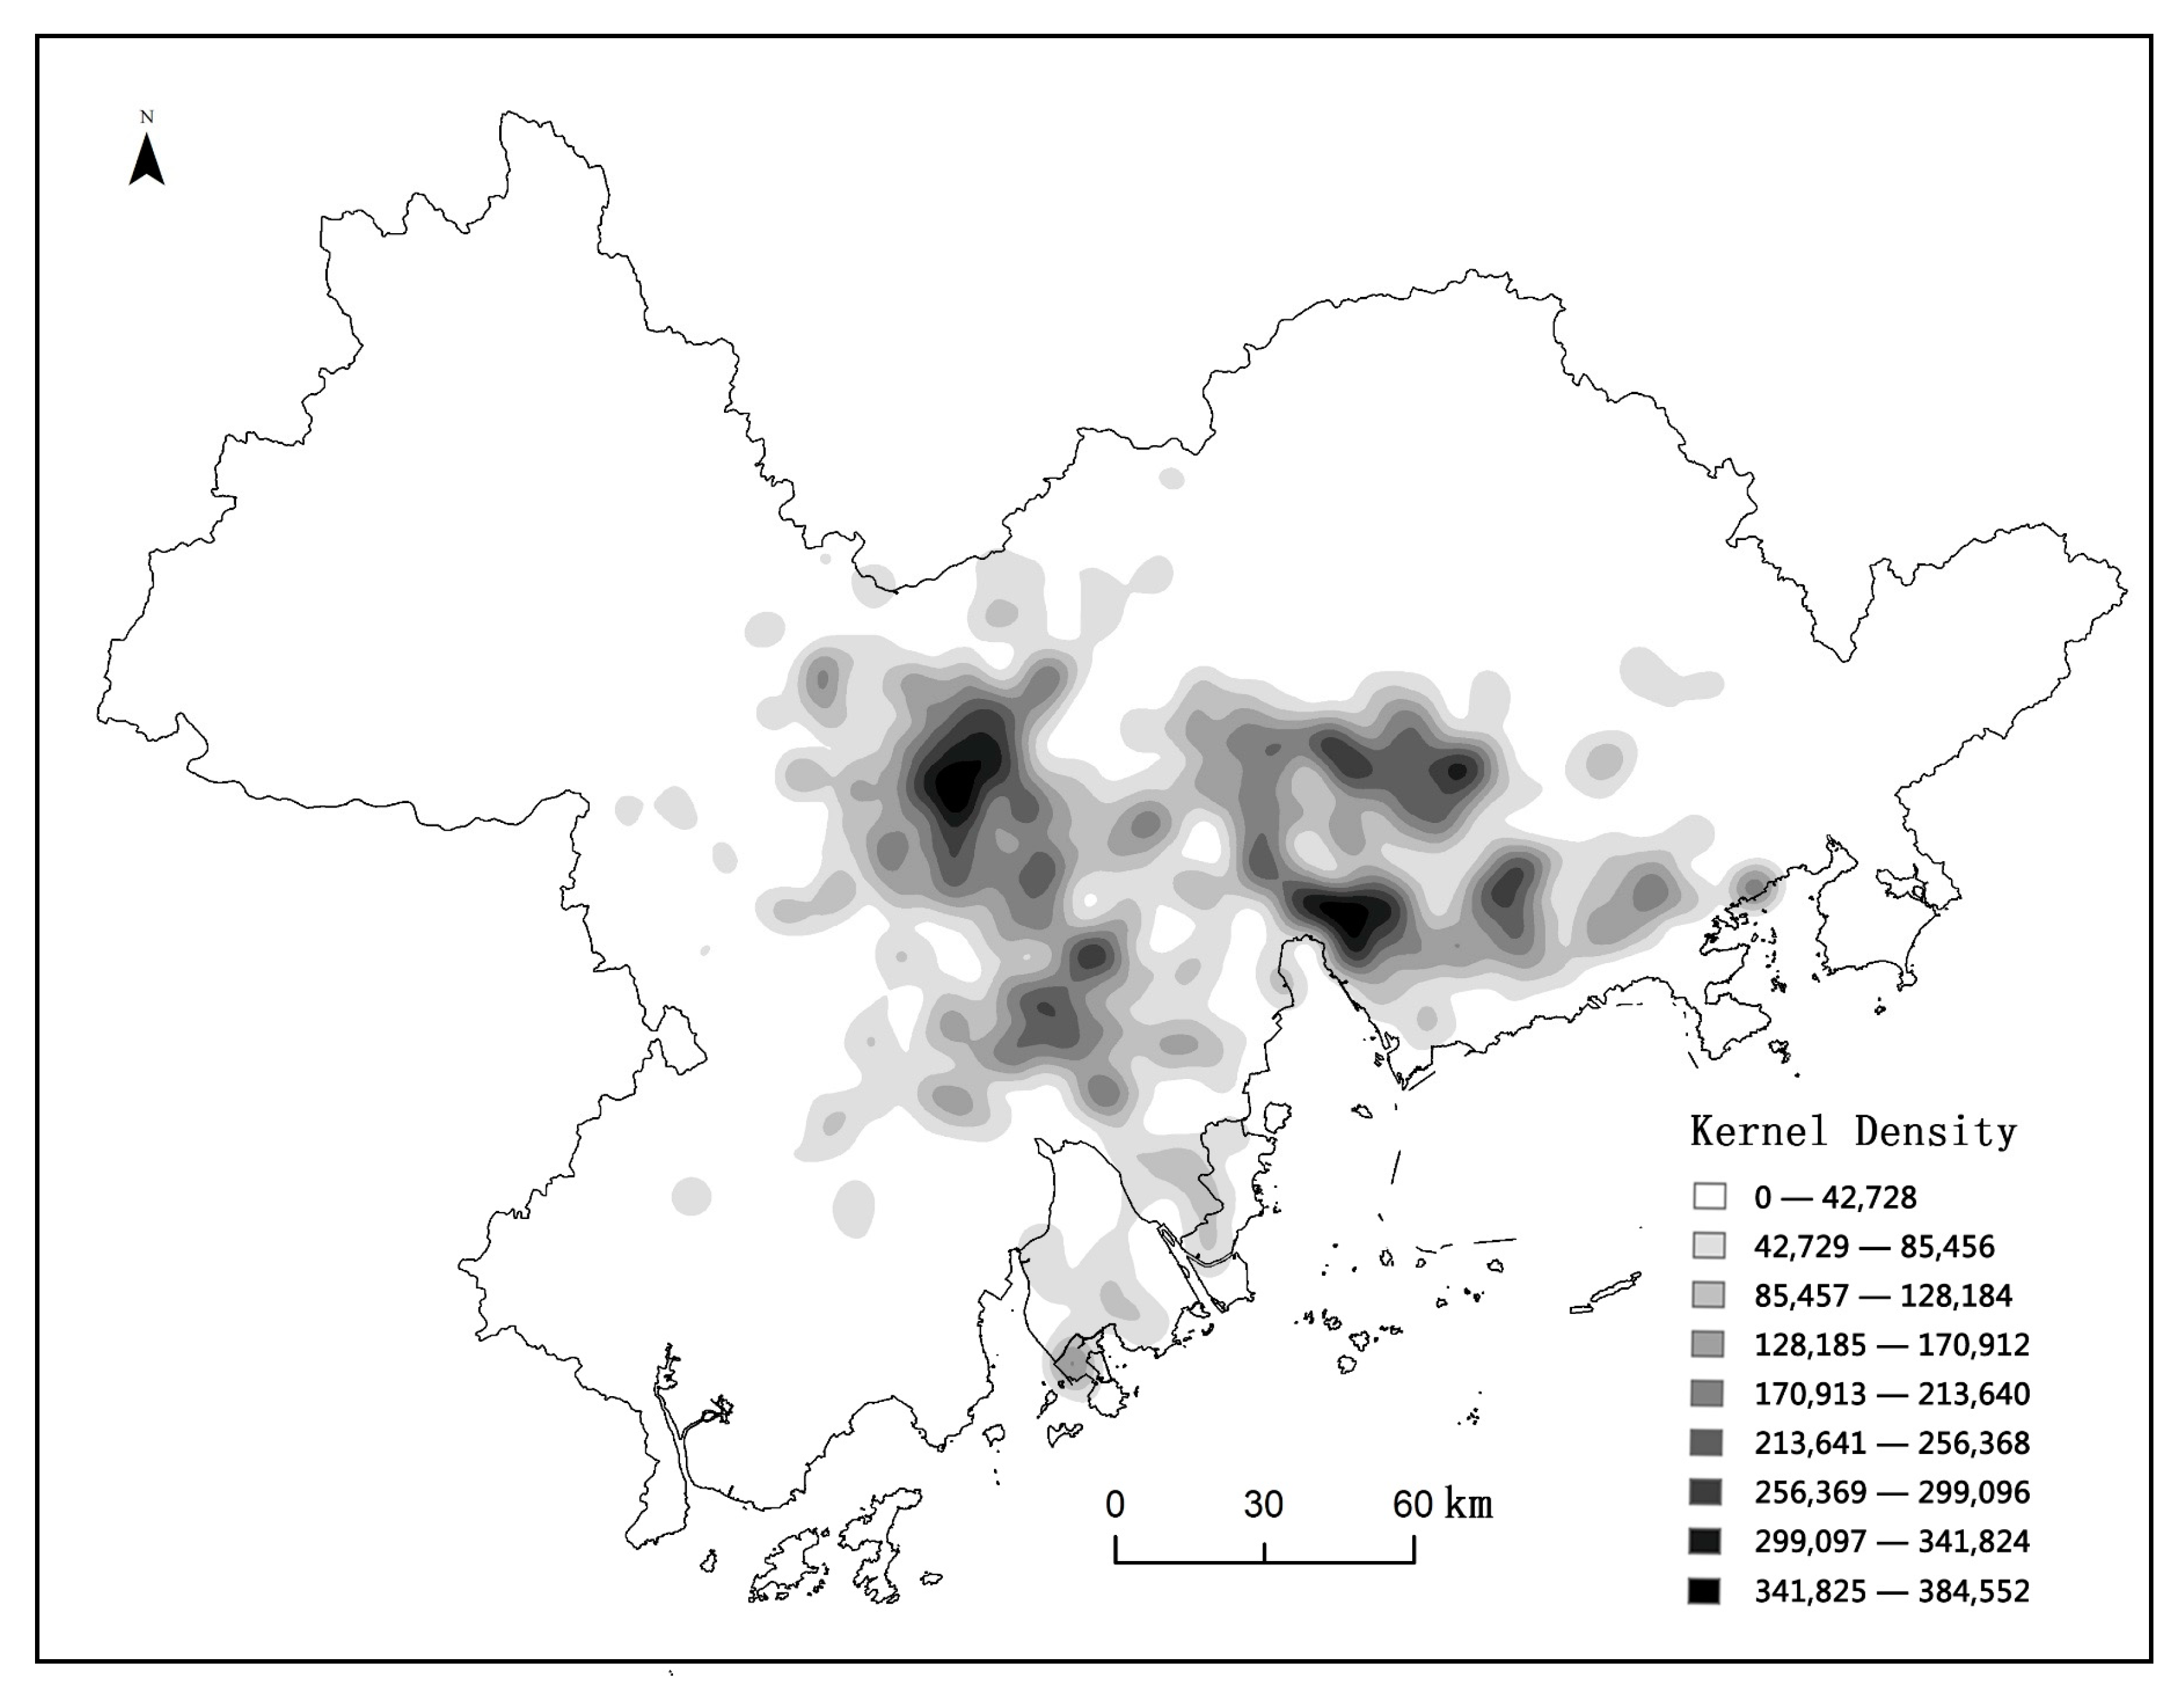
3.1.4. Kernel Density
3.2. Regression Model Construction
3.2.1. Variable Selection
3.2.2. Regression Model Construction
4. The Results of Spatial Characteristics of Manufacturing Production Space
4.1. The Multi-Scale Distribution of Manufacturing Production Space
4.1.1. Whole Domain
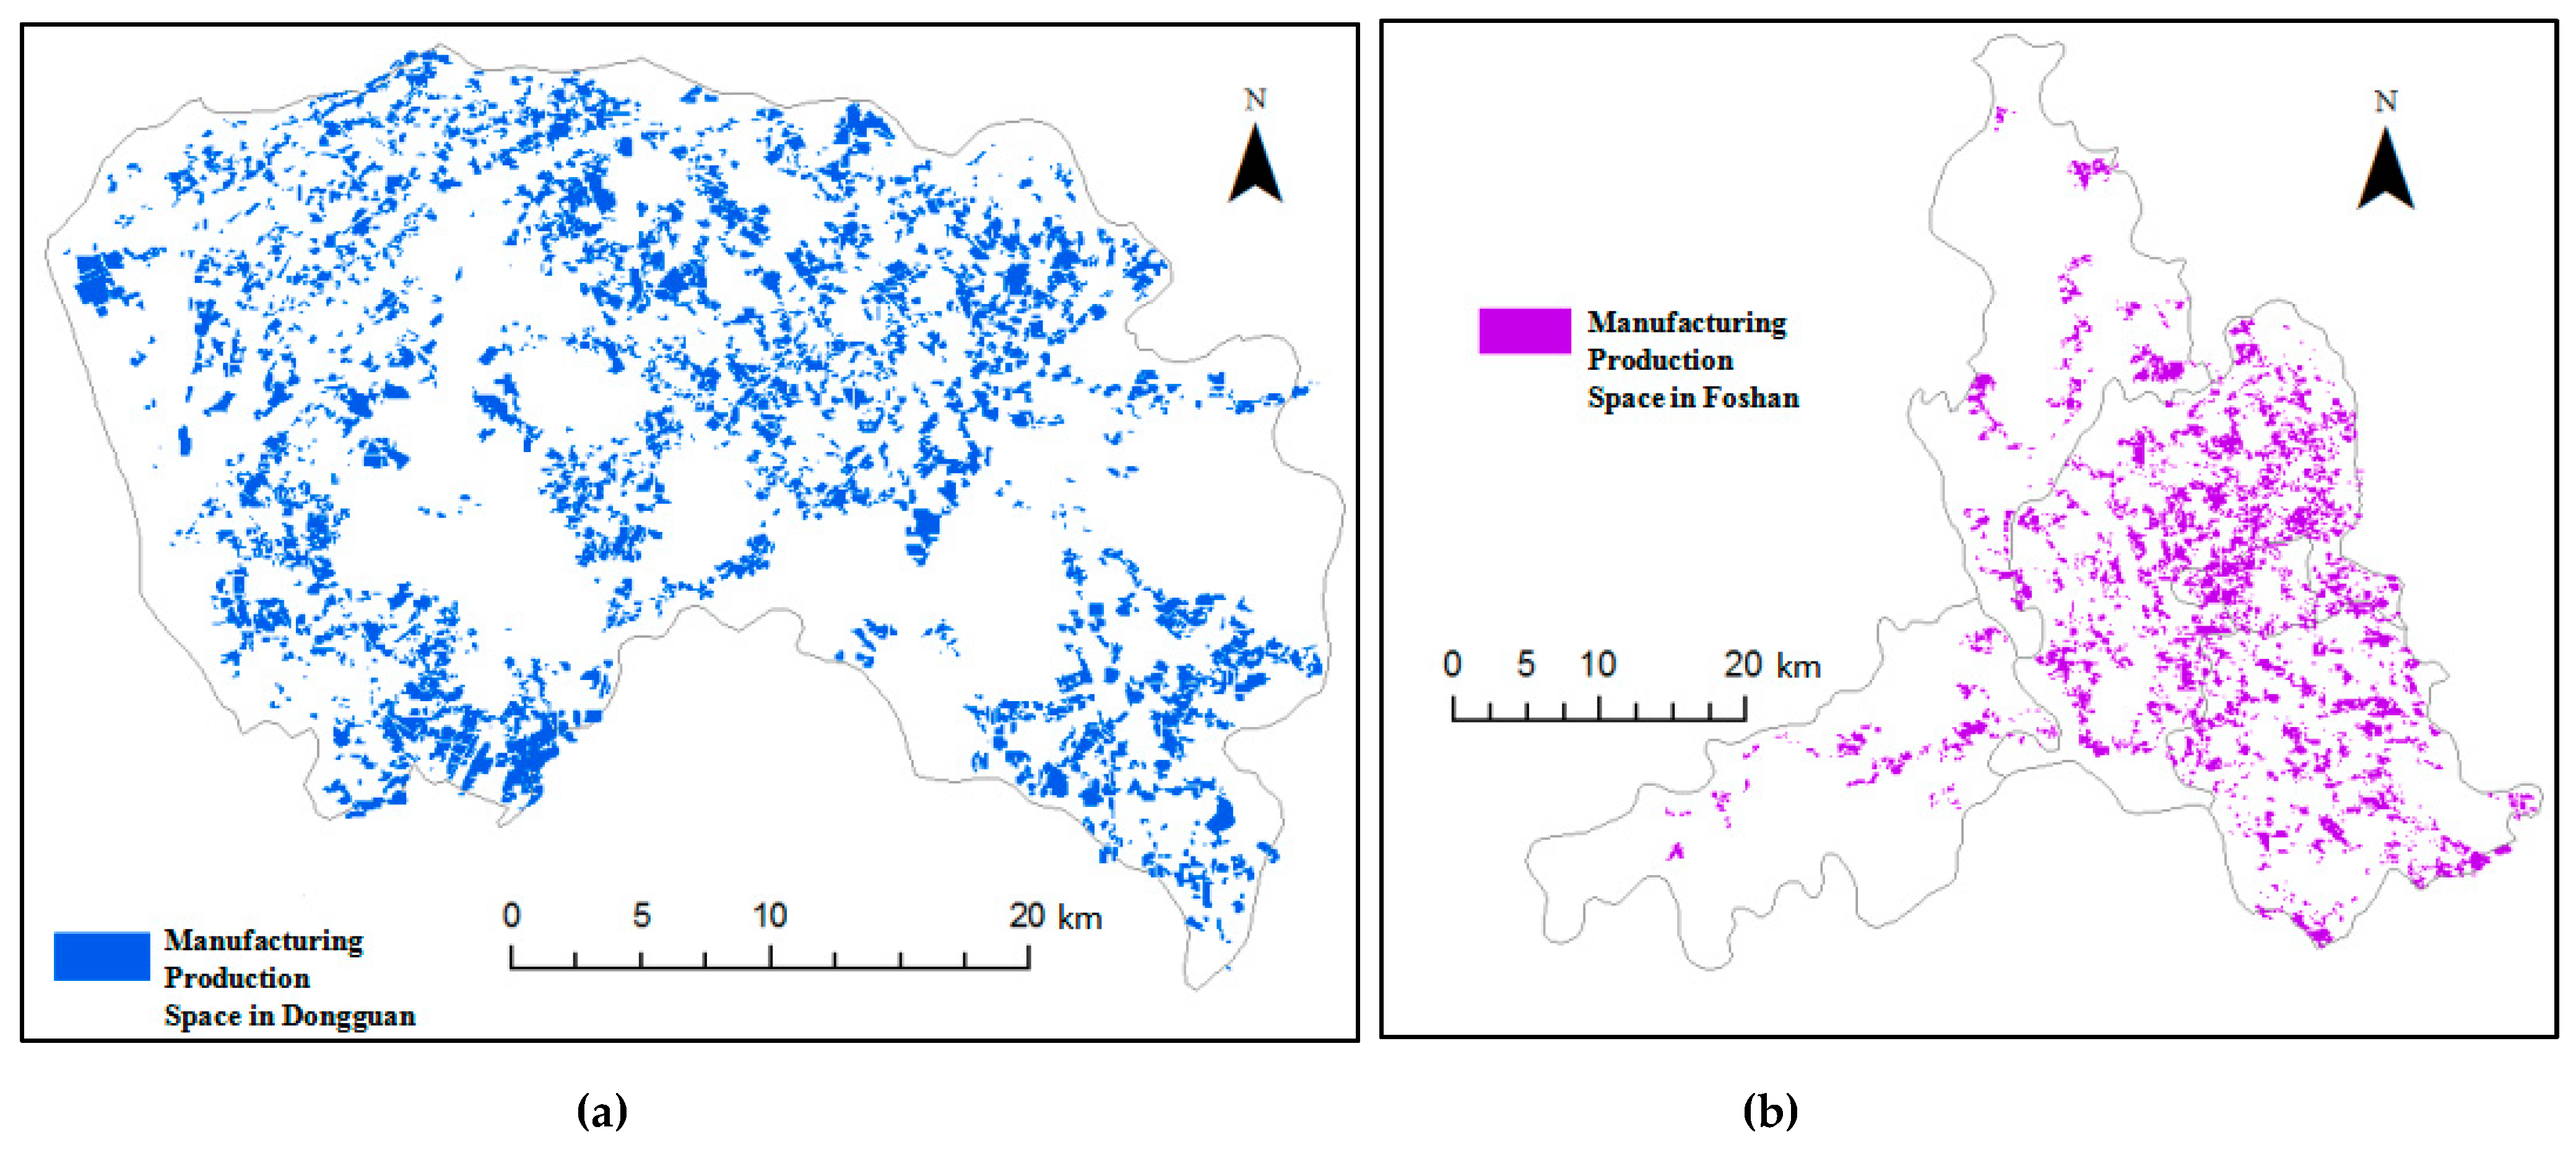
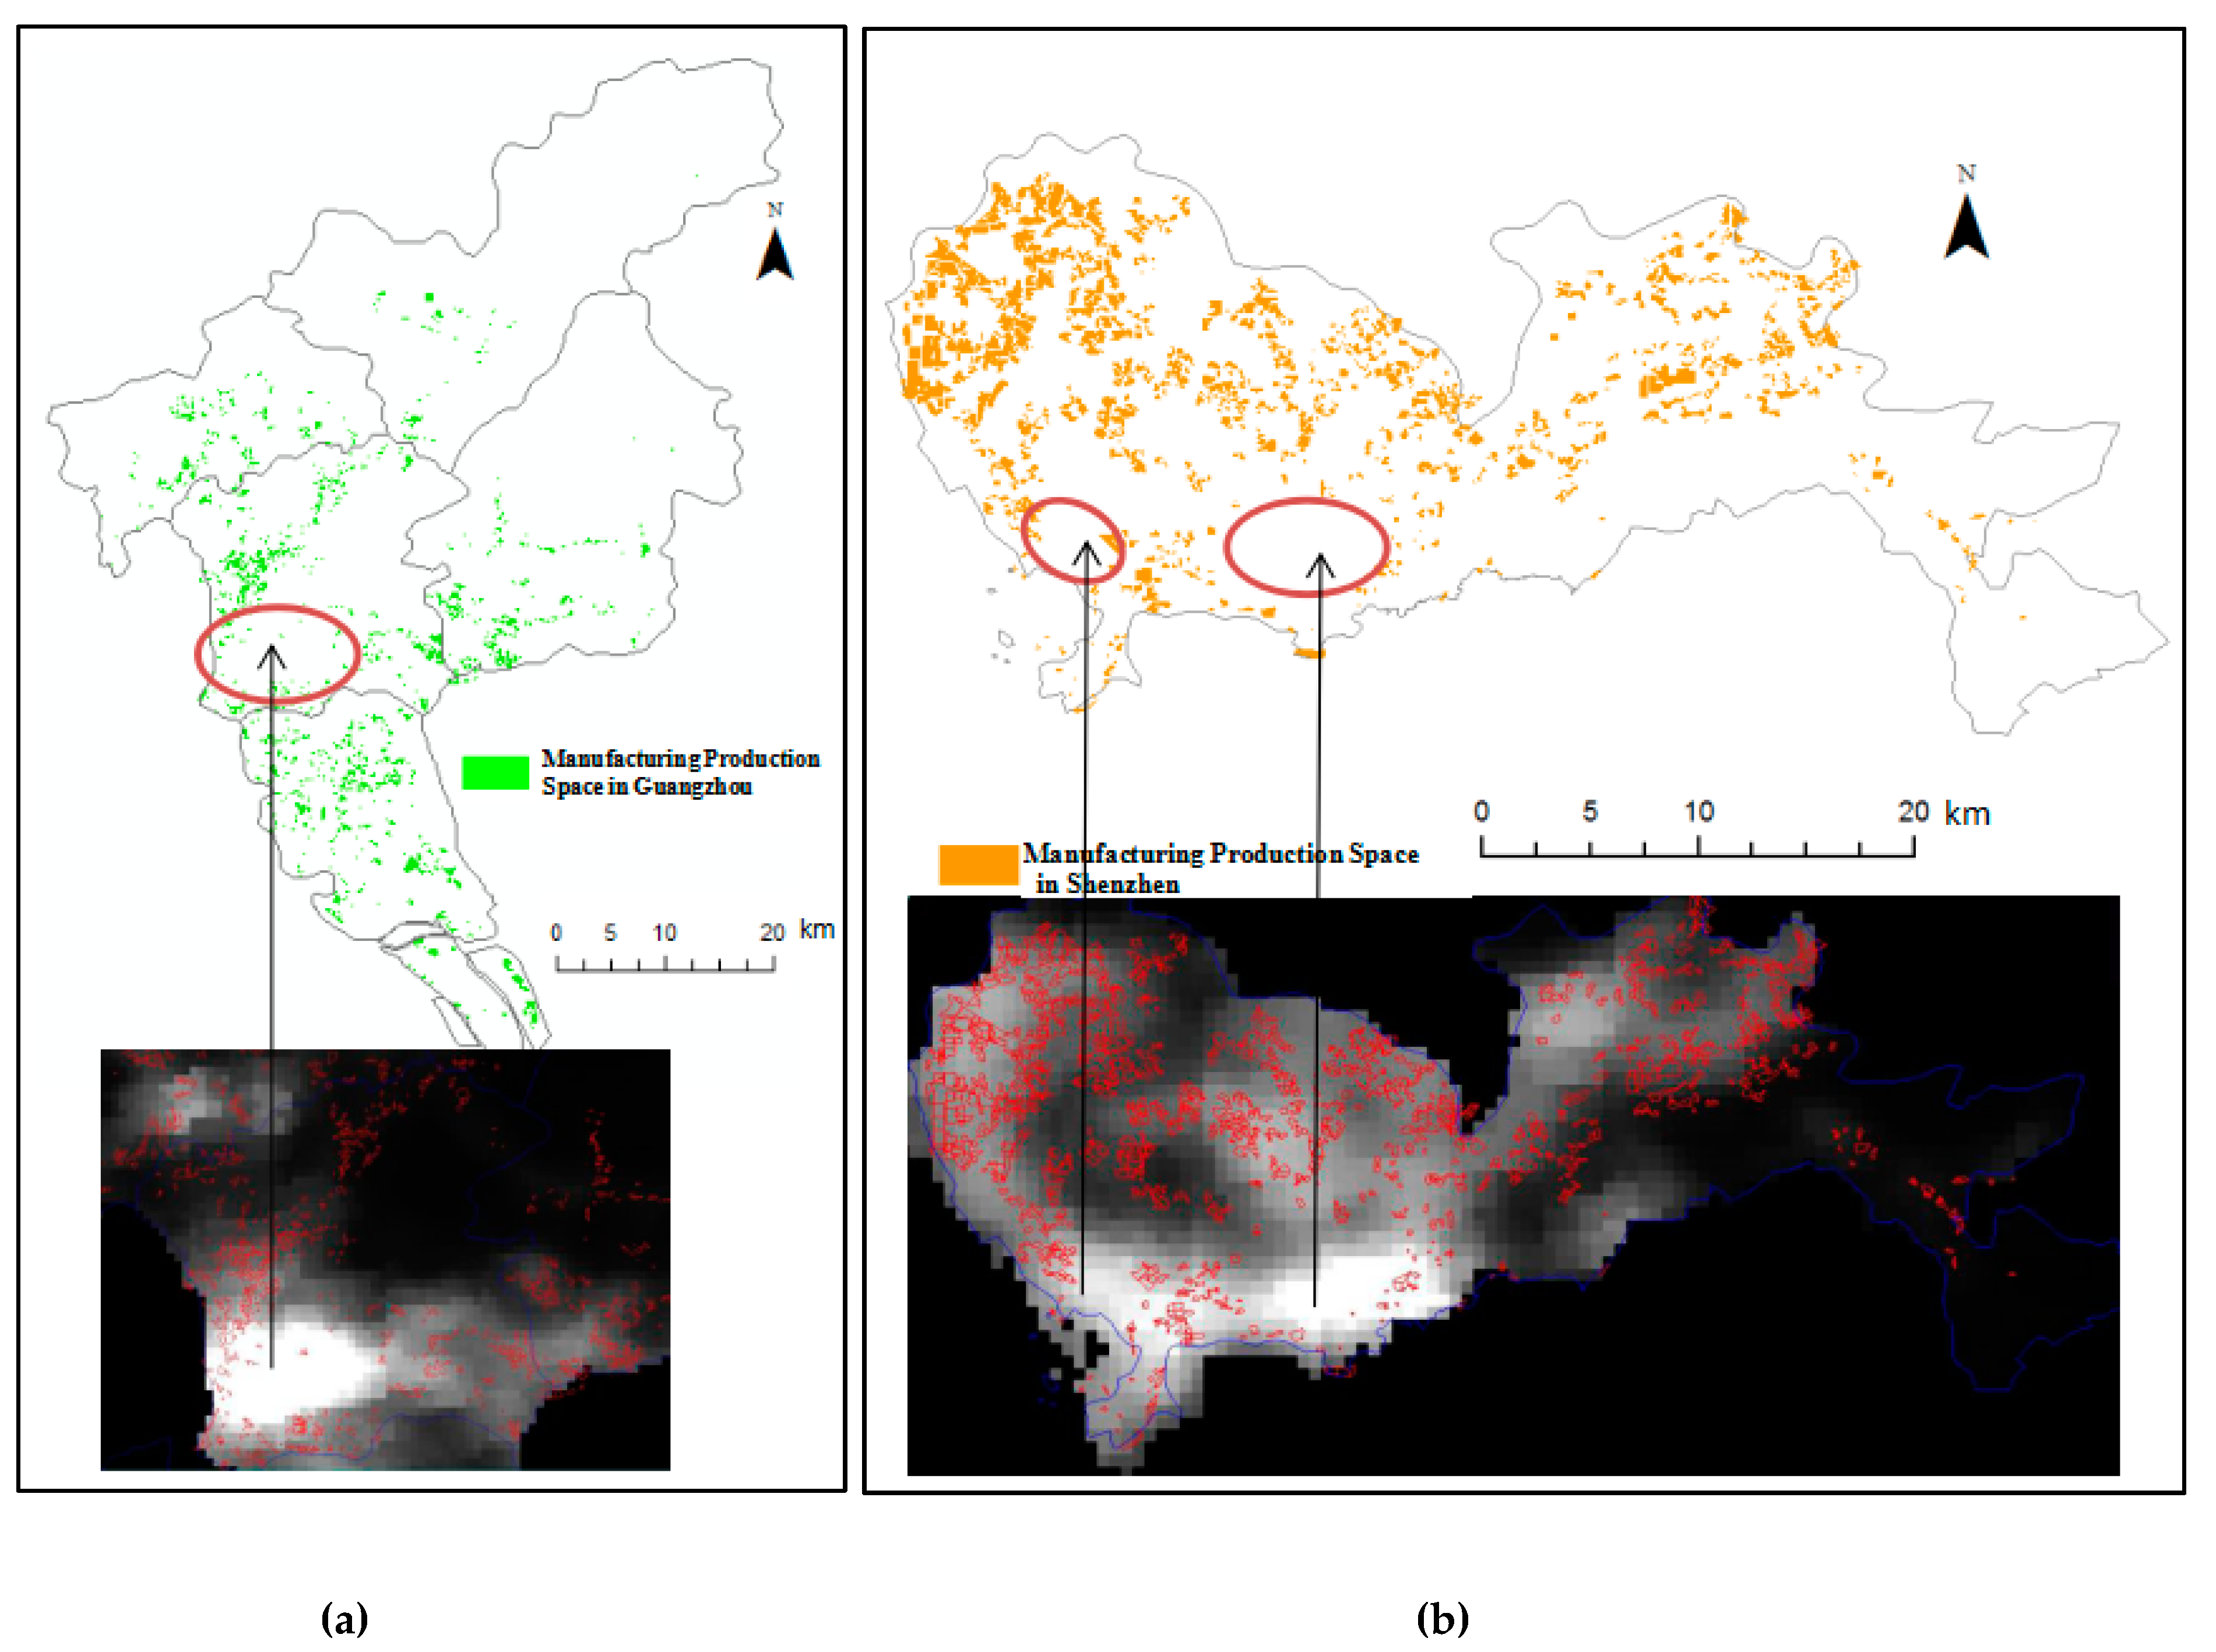
4.1.2. City Scale
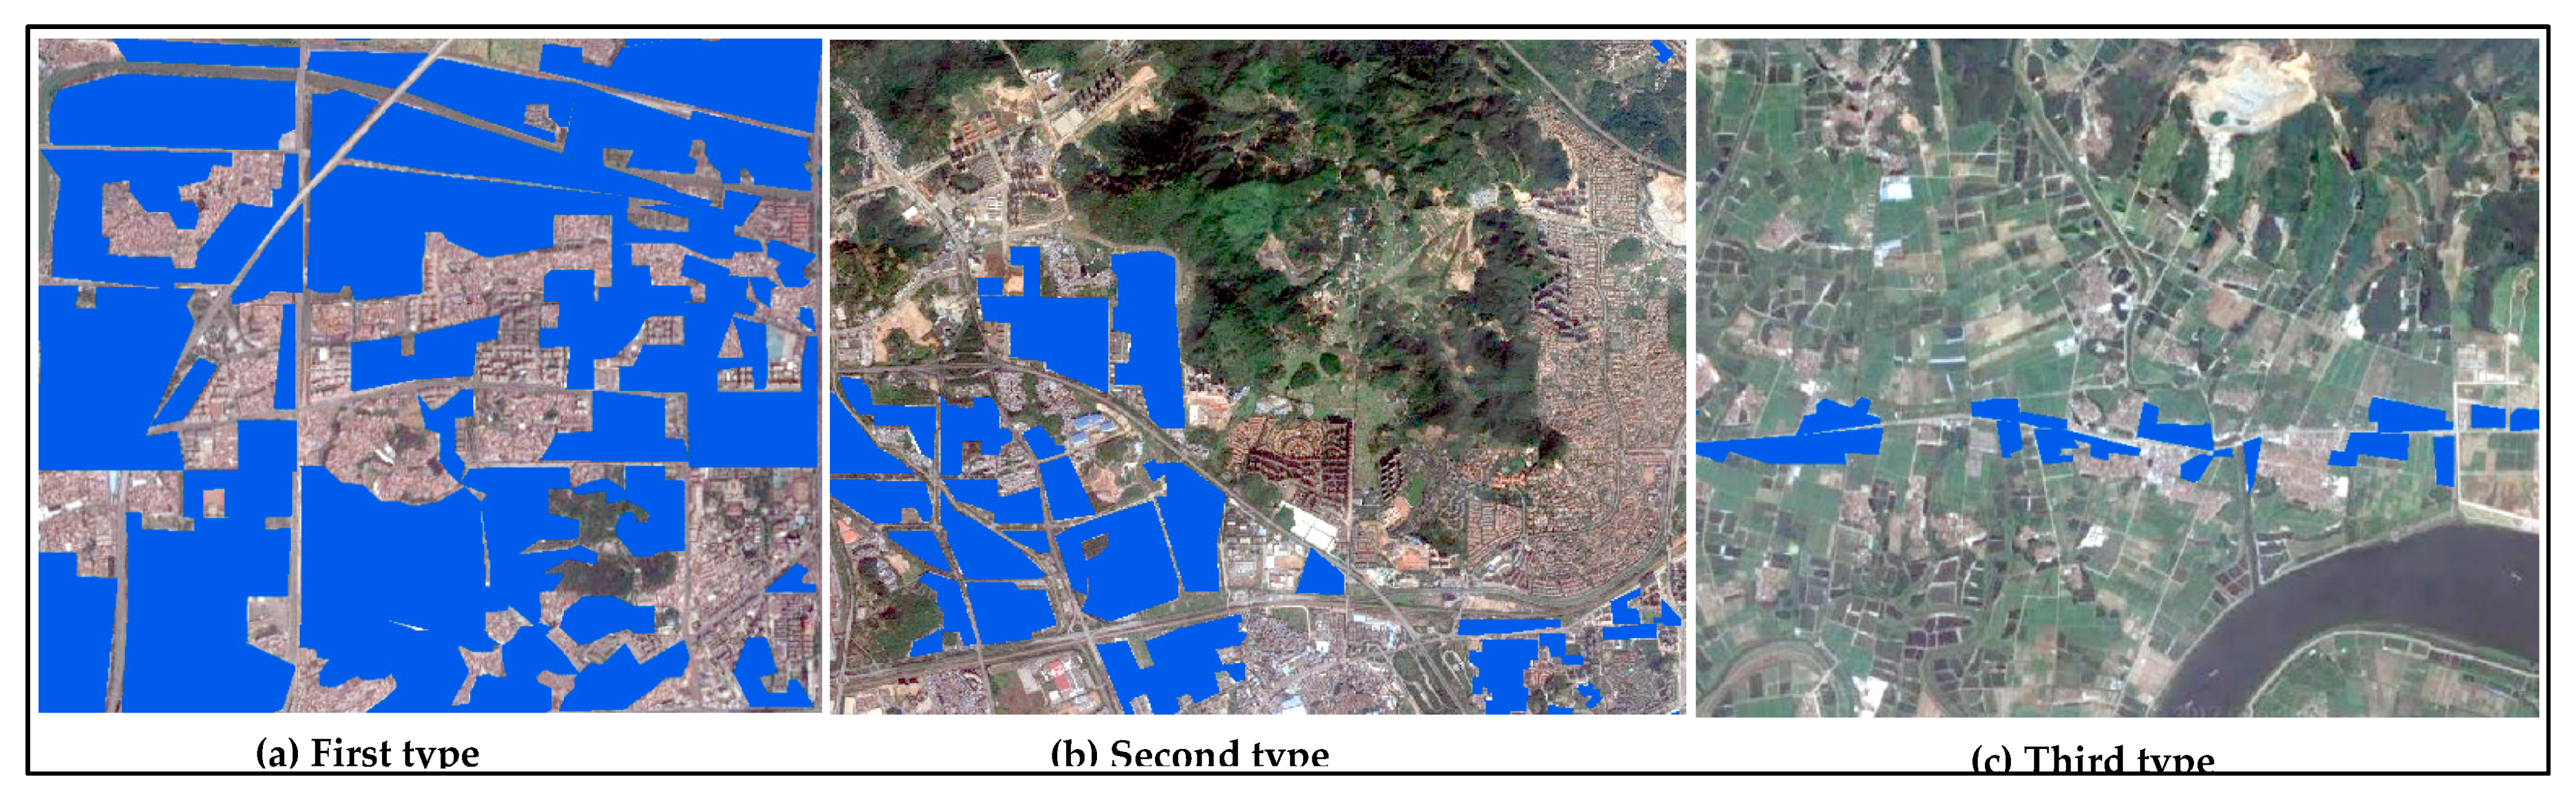
4.1.3. Typical Areas
4.2. Multi-scale Morphologies and Agglomerations of Manufacturing Production Space Patch
4.2.1. Whole Domain
4.2.2. City-Level Analysis
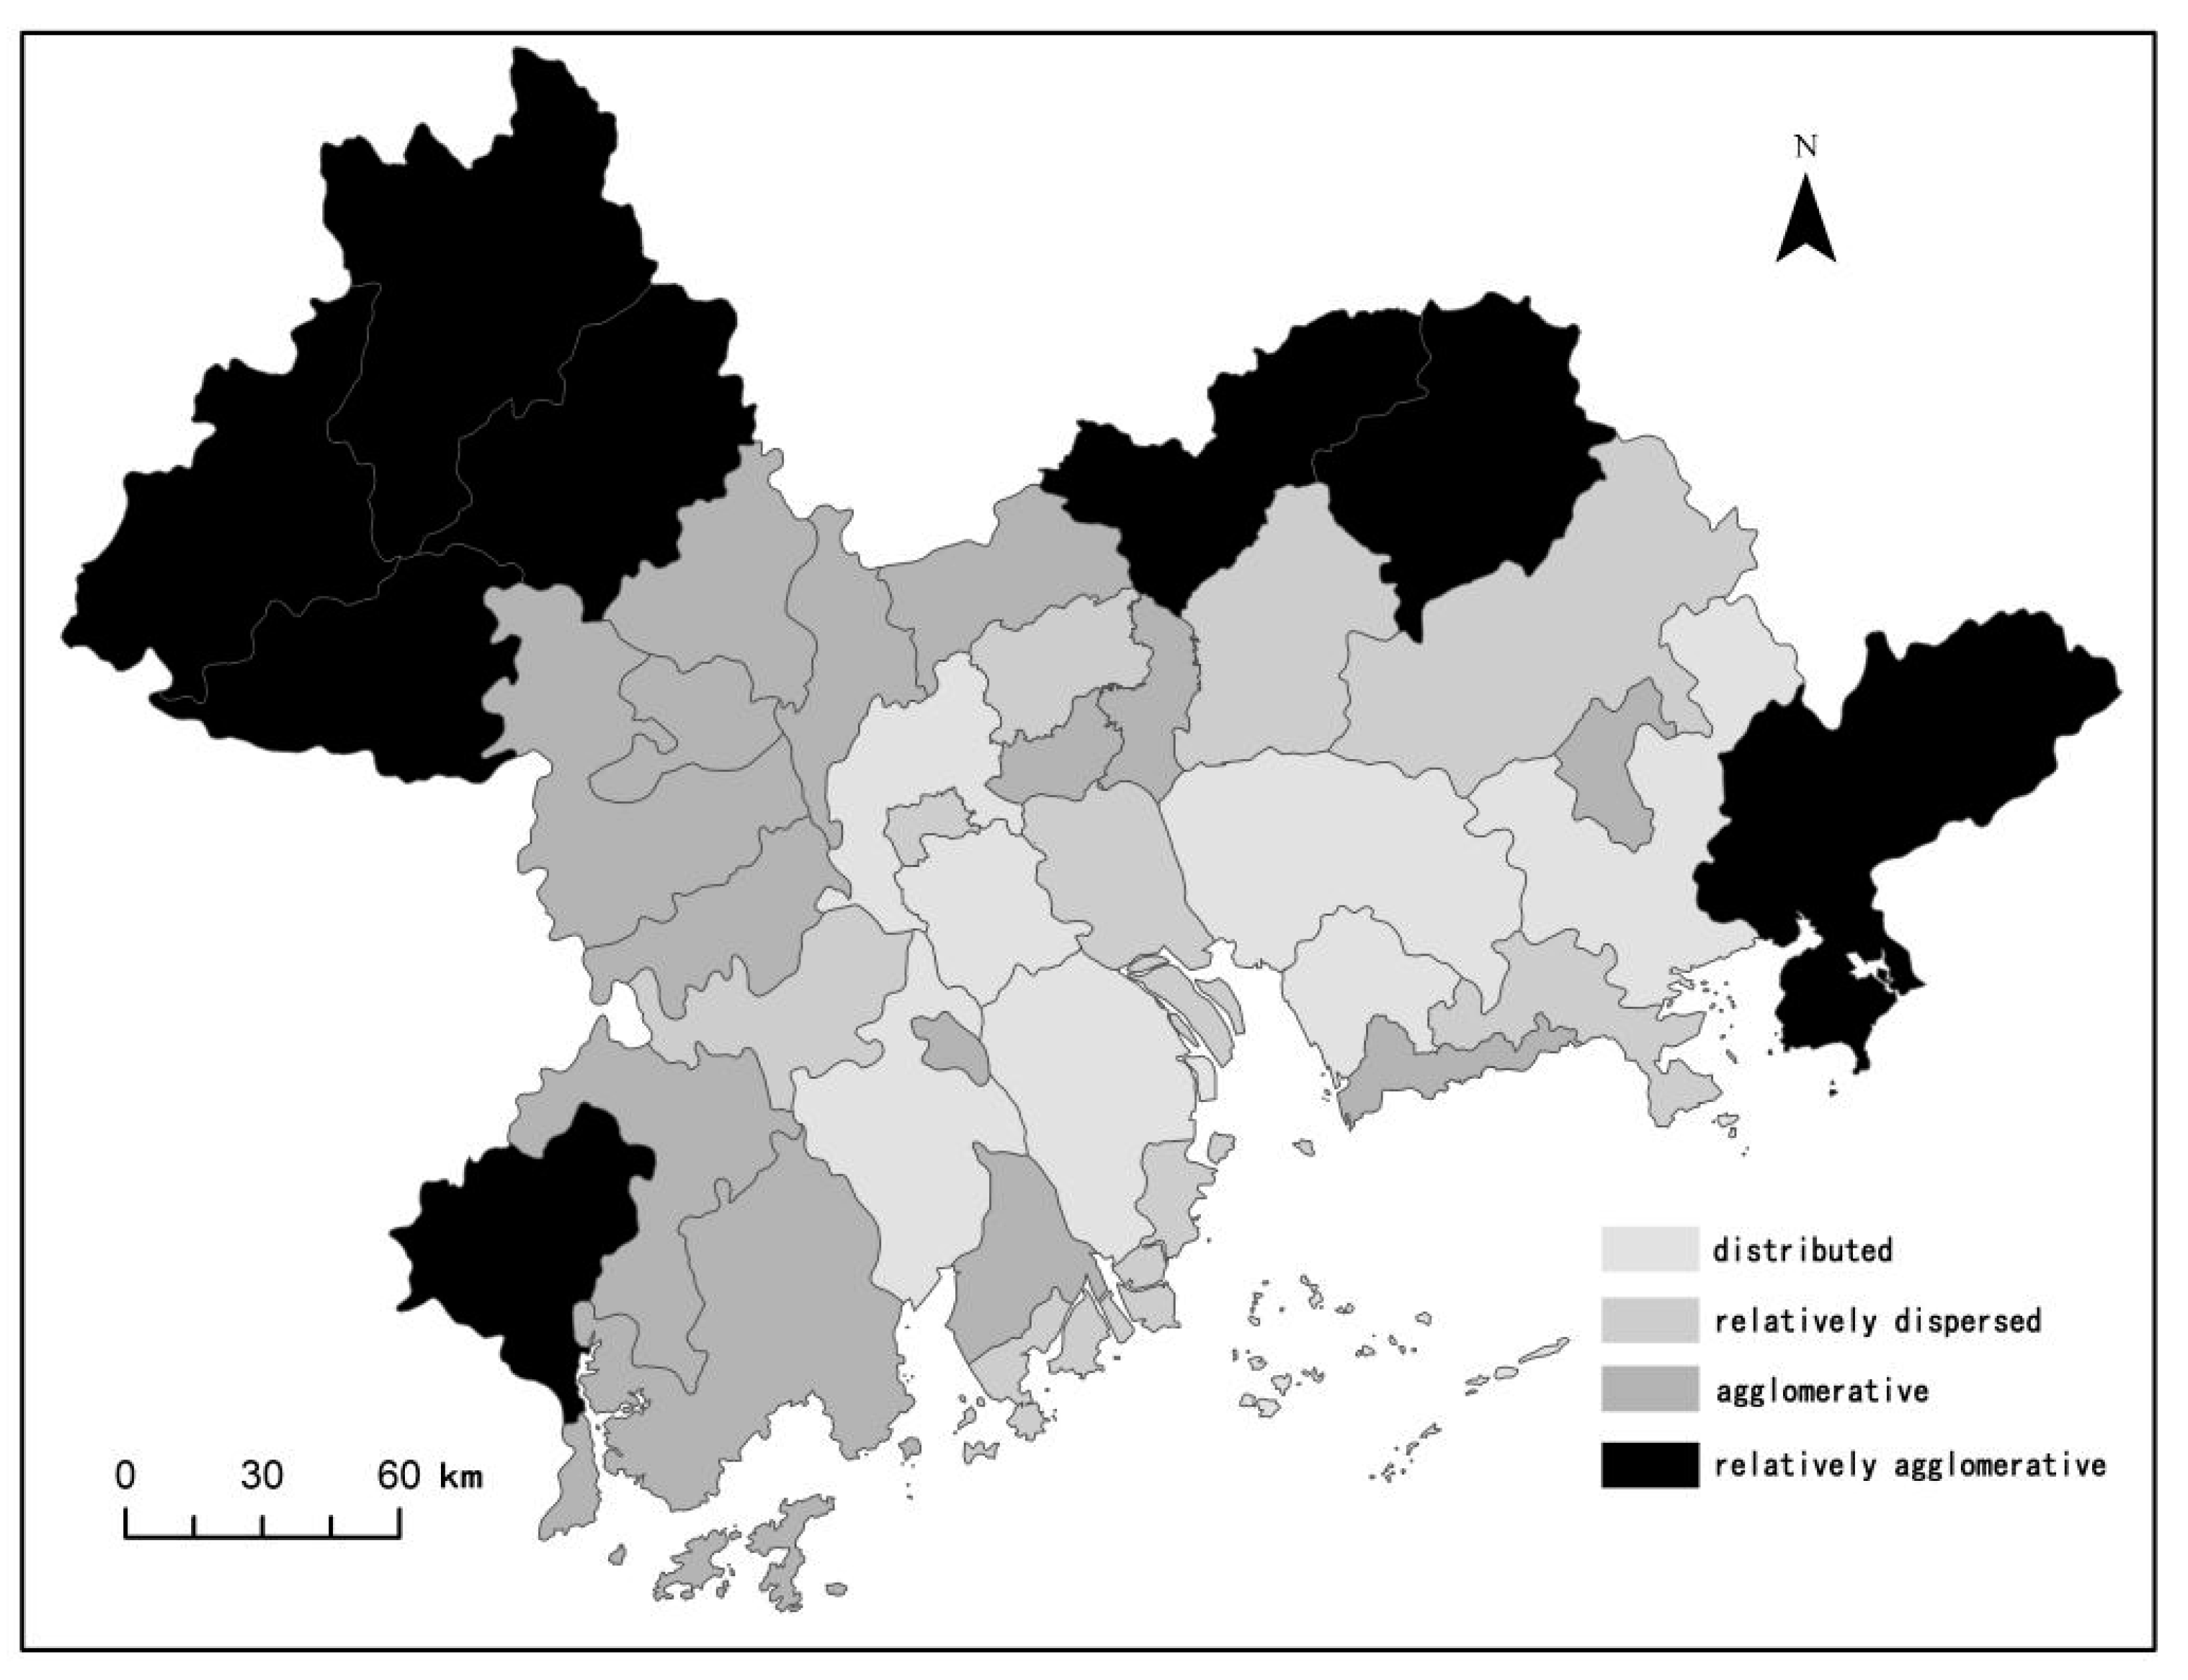
4.2.3. County-Level Analysis
5. The Results of GWR Model
5.1. Geographically Weighted Regression Analysis Results
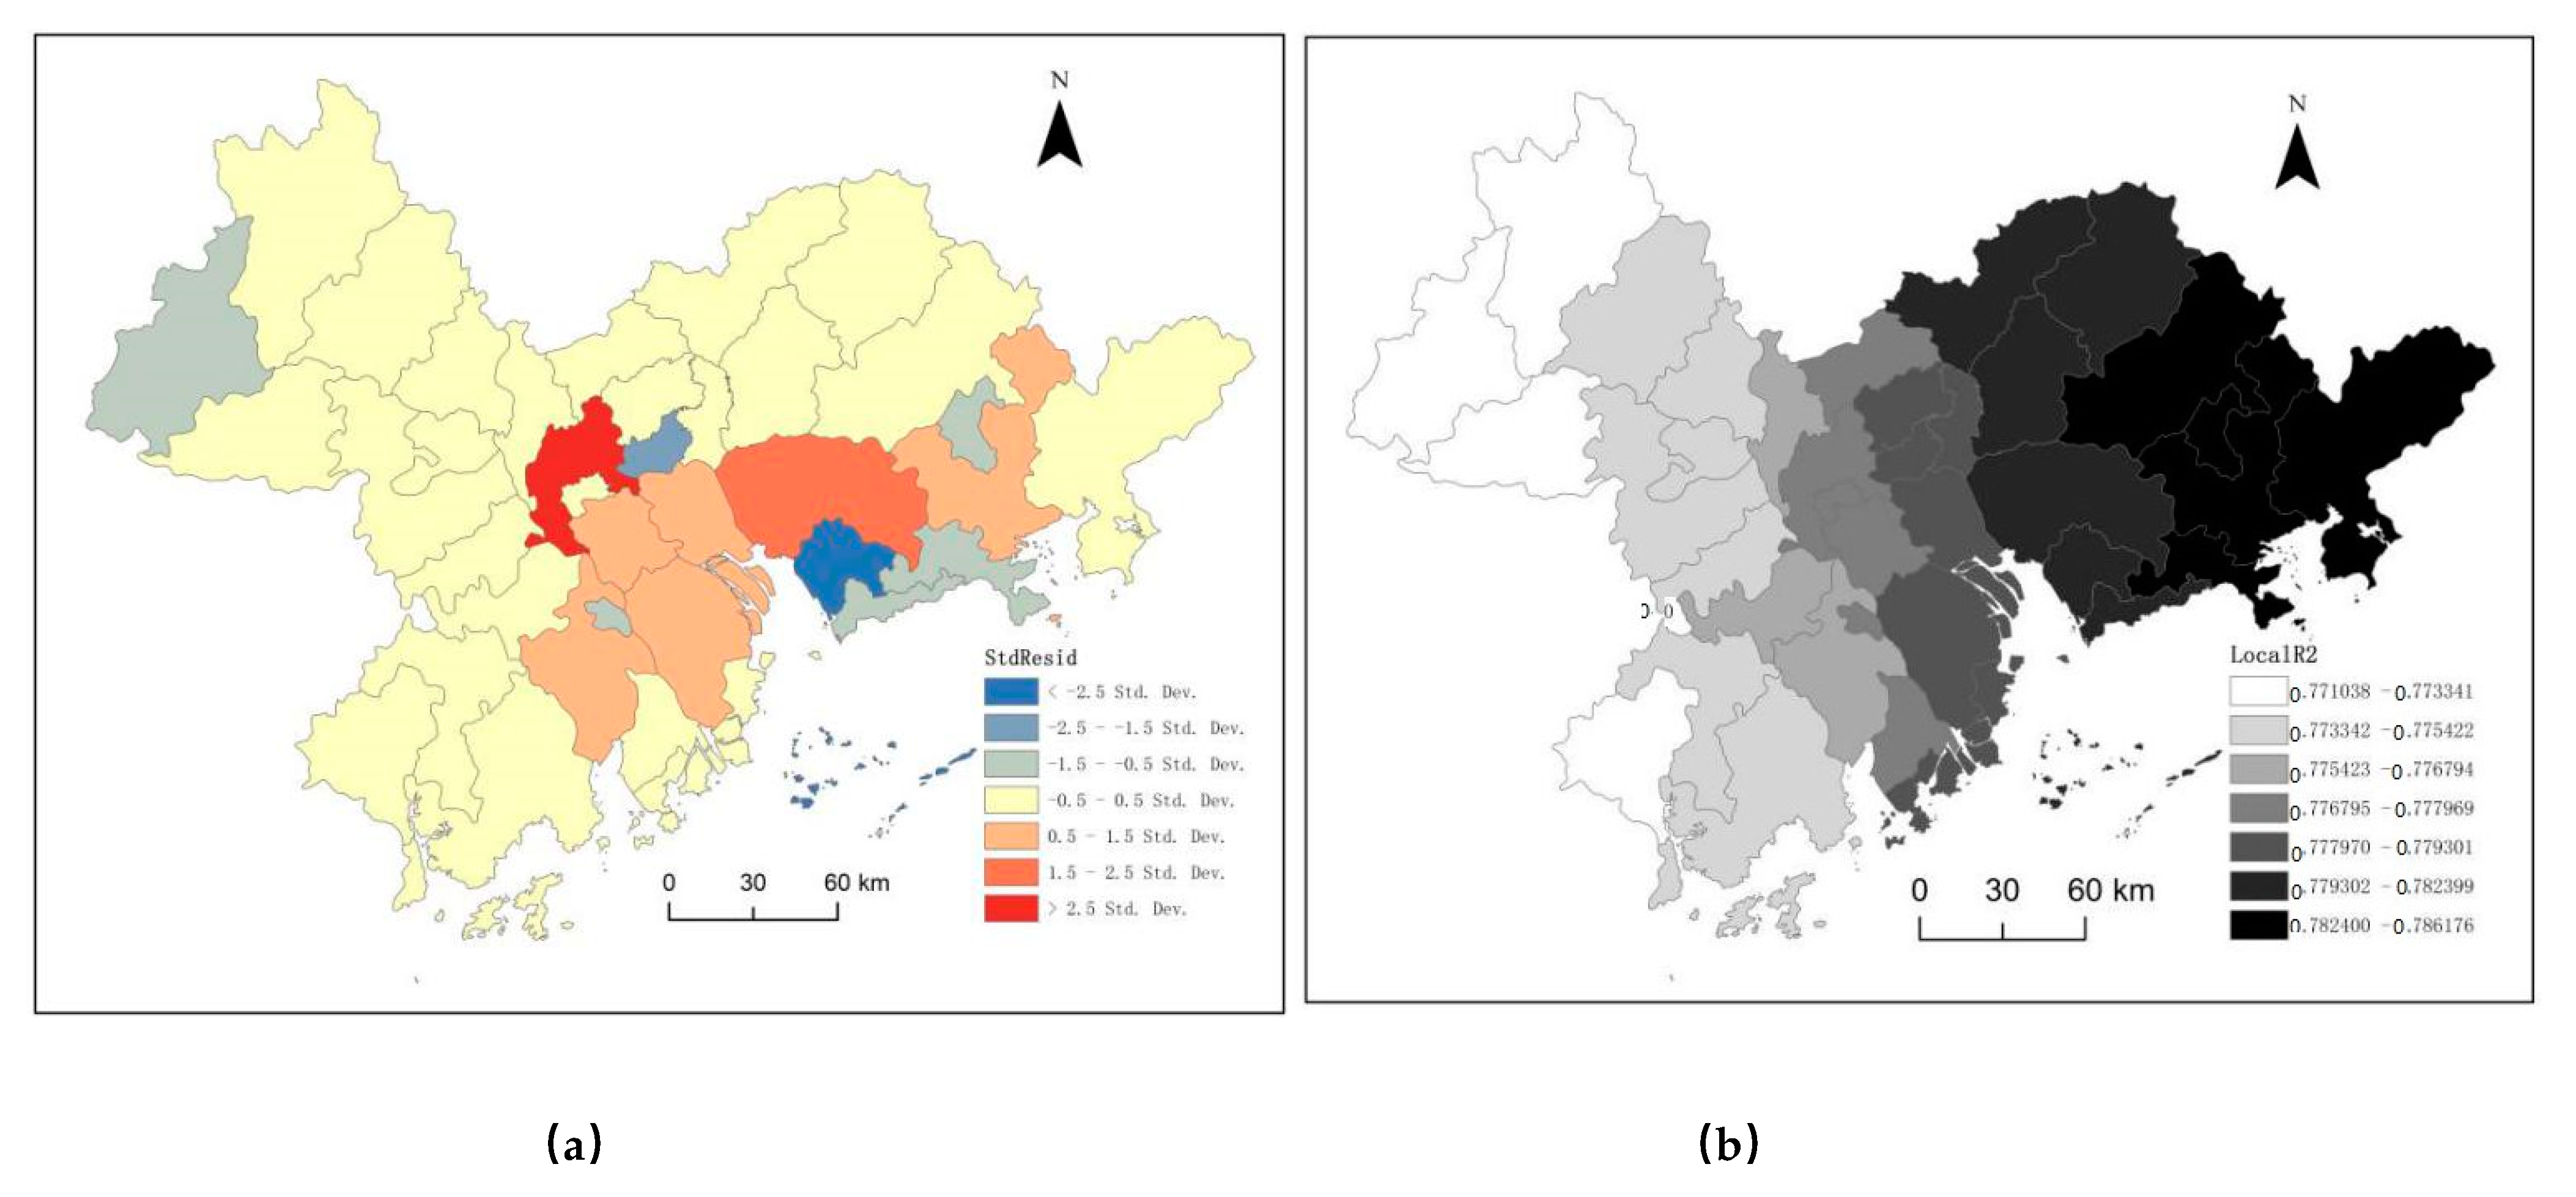
5.1.1. Overall Region
5.1.2. Each Counties (Districts)
5.2. Spatial Heterogeneity of Influencing Factors
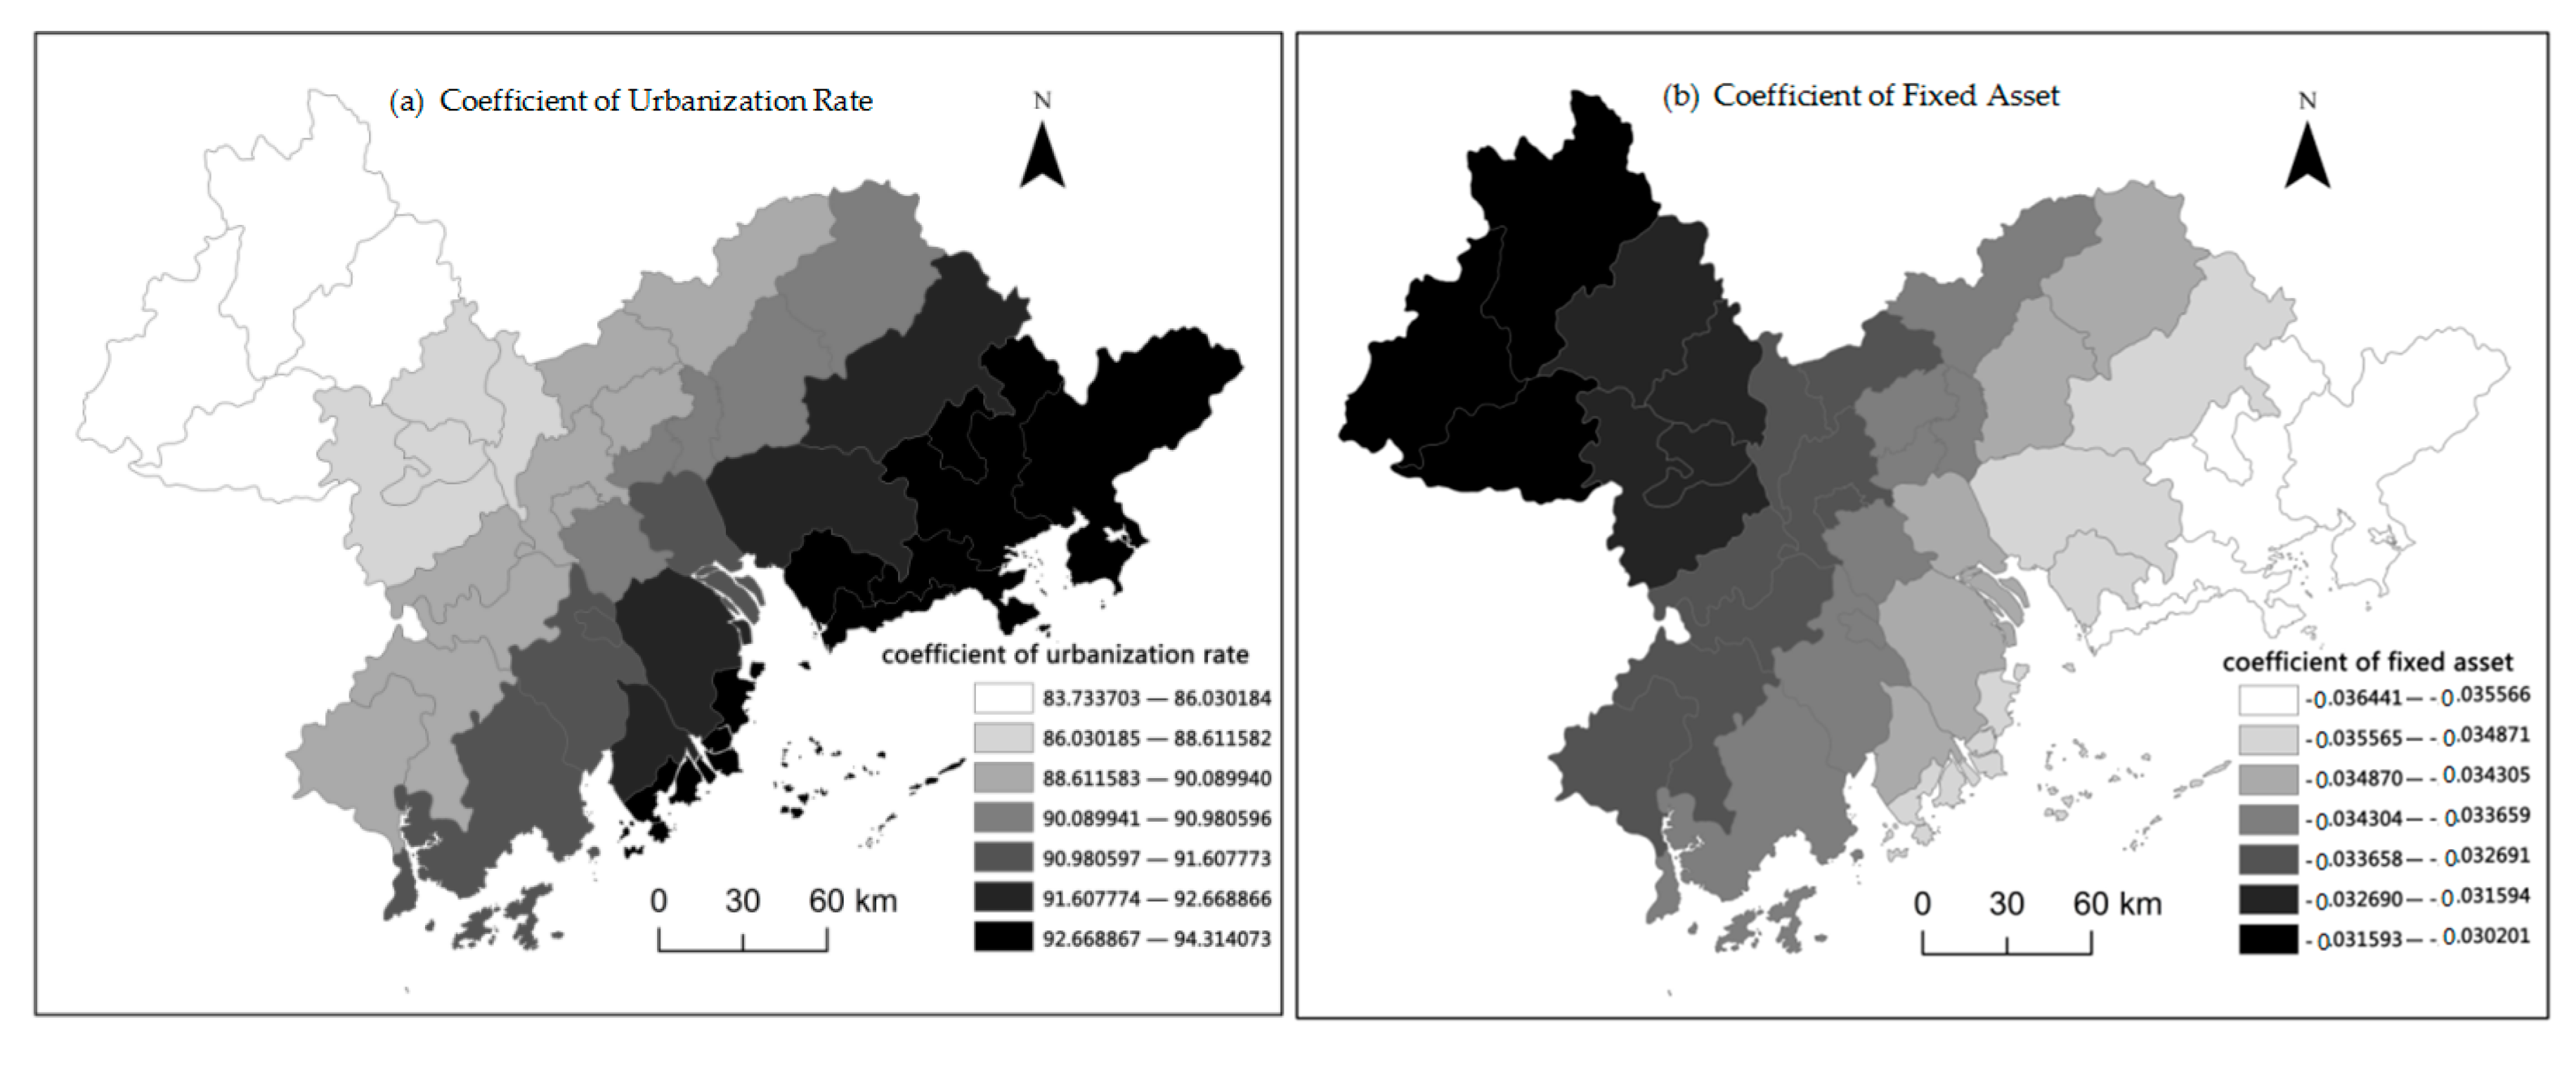
5.2.1. Spatial Variability of Urbanization Has an Impact on Manufacturing Production Space
5.2.2. Spatial Variability of the Impact of Fixed Asset Investment on Manufacturing Production Space
5.2.3. Spatial Variability of the Influence of Outward Dynamics on Manufacturing Production Space
5.2.4. Spatial Variability of Industrialization Impact on Manufacturing Production Space
5.2.5. Spatial Variability of Employment Population’s Influence on Manufacturing Production Space
6. Discussion
6.1. Comparison of Spatial Distribution Characteristics between Developing Countries and Western Countries
6.2. Optimal Control of Spatial Morphological Characteristics
6.3. A Comparison of Driving Factors between Developing Countries and Western Countries
7. Conclusions
- ①
- For the local industrial space optimization control, cannot simply extensive promotion or containment. On the basis of ensuring the overall industrial ecological balance in the region, the local governments should make precise regulation according to the actual situation of the development of manufacturing production space in different cities.
- ②
- For the core districts in global cities, we should continue to control the distribution of manufacturing production space and promote APS distribution with higher industrial added value and control function. For the peripheral areas of global cities, the local government should control the distribution of manufacturing enterprises of "three highs"——high pollution, high energy consumption, and high emission.
- ③
- For typical manufacturing cities, the districts with development intensity of more than 30% should be strictly controlled and the stock of extensive utilization of manufacturing production space should be actively activated.
- ④
- The agglomeration degree of manufacturing production space in the peripheral counties (districts) of the PRD is better, but the output value of regional manufacturing industry is relatively backward. Therefore, the local government should control the development intensity of manufacturing production space, and more importantly, improve the technological content of manufacturing enterprises and promote innovation and development.
Author Contributions
Funding
Acknowledgments
Conflicts of Interest
References
- Thierstein, A.; Lüthi, S.; Kruse, C.; Gabi, S.; Glanzmann, L. Changing value chain of the Swiss knowledge economy: Spatial impact of intra-firm and inter-firm networks within the emerging Mega-City Region of Northern Switzerland. Reg. Stud. 2008, 42, 1113–1131. [Google Scholar] [CrossRef]
- Jacobs, W.; Rietbergen, T.; Atzema, O.; Grunsven, L.; Dongen, F. The Impact of Multinational Enterprises (MNEs) on Knowledge-Intensive Business Services (KIBS) Start-ups: Empirical Evidence from the Dutch Randstad. Reg. Stud. 2016, 50, 728–743. [Google Scholar] [CrossRef]
- Simmie, J. Knowledge spillovers and reasons for the concentration of innovative SMEs. Urban. Stud. 2002, 39, 885–902. [Google Scholar] [CrossRef]
- Romijn, H.; Albu, M. Innovation, networking and proximity: Lessons from small high technology firms in the UK. Reg. Stud. 2002, 36, 81–86. [Google Scholar] [CrossRef]
- Scott, A.J. Global City-Regions: Trends, Theory, Policy; Oxford University Press: Oxford, UK, 2001. [Google Scholar]
- Scott, A.J. Globalization and the Rise of City-Regions. Eur. Plan. Stud. 2001, 9, 813–826. [Google Scholar] [CrossRef]
- Daniels, P.W. Book review: Global city regions: Their emerging forms. Prog. Hum. Geog. 2002, 26, 714–715. [Google Scholar] [CrossRef]
- Romero, V.; Solís, E.; De Ureña, J.M. Beyond the metropolis: New employment centers and historic administrative cities in the Madrid global city region. Urban. Geogr. 2014, 35, 889–915. [Google Scholar] [CrossRef]
- Pain, K. Examining ‘core-periphery’ relationships in a global city-region: The case of London and South East England. Reg. Stud. 2008, 42, 1161–1172. [Google Scholar] [CrossRef]
- Varis, M.; Tohmo, T.; Littunen, H. Arriving at the Dawn of the New Economy: Is Knowledge-Based Industrial Renewal Possible in a Peripheral Region? Eur. Plan. Stud. 2014, 22, 101–125. [Google Scholar] [CrossRef]
- Rodriguez-Pose, A.; Fitjar, R.D. Buzz, Archipelago Economies and the Future of Intermediate and Peripheral Areas in a Spiky World. Eur. Plan. Stud. 2013, 21, 355–372. [Google Scholar] [CrossRef]
- Lin, G.C.S. Toward a post-socialist city? Economic tertiarization and urban transformation in the Guangzhou metropolis, China. Eurasian Geogr. Econ. 2004, 45, 18–44. [Google Scholar] [CrossRef]
- Daniels, P.W.; Ho, K.C.; Hutton, T. Service industries and Asia-Pacific cities: Introduction and overview. In Service Industries and Asia-Pacific Cities: New Development Trajectories; Routledge: London, UK, 2005; pp. 1–18. [Google Scholar]
- Zhao, M.; Derudder, B.; Huang, J. Examining the transition processes in the Pearl River Delta polycentric mega-city region through the lens of corporate networks. Cities 2017, 60, 147–155. [Google Scholar] [CrossRef]
- Wei, Y.D. Restructuring for growth in urban China: Transitional institutions, urban development, and spatial transformation. Habitat Int. 2012, 36, 396–405. [Google Scholar] [CrossRef]
- Bie, J.B.; Jong, M.; Derudder, B. Greater Pearl River Delta: Historical Evolution towards a Global City-Region. J. Urban. Technol. 2015, 22, 103–123. [Google Scholar] [CrossRef]
- Ye, Y.Y.; Wu, K.M.; Xie, Y.C.; Huang, G.Z.; Wang, C.J.; Chen, J. How firm heterogeneity affects foreign direct investment location choice: Micro-evidence from new foreign manufacturing firms in the Pearl River Delta. Appl. Geogr. 2019, 106, 11–21. [Google Scholar] [CrossRef]
- Yeh, A.G.; Yang, F.F.; Wang, J. Producer service linkages and city connectivity in the mega- city region of China: A case study of the Pearl River Delta. Urban. Stud. 2015, 52, 2458–2482. [Google Scholar] [CrossRef]
- Zhang, X.; Kloosterman, R.C. Connecting the ‘Workshop of the World’: Intra-and Extra-Service Networks of the Pearl River Delta City-Region. Reg. Stud. 2016, 50, 1069–1081. [Google Scholar] [CrossRef]
- Zhao, S.X.B.; Zhang, L. Foreign direct investment and the formation of global city-regions in China. Reg. Stud. 2007, 41, 979–994. [Google Scholar] [CrossRef]
- Brouwer, A.E.; Mariotti, I.; van Ommeren, J.N. The firm relocation decision: An empirical investigation. Ann. Reg. Sci. 2004, 38, 335–347. [Google Scholar] [CrossRef]
- Scott, A.J. Locational patterns and dynamics of industrial activity in the modern metropolis. Urban. Stud. 1982, 19, 111–142. [Google Scholar] [CrossRef]
- Scott, A.J. Industrial organization and the logic of intra-metropolitan location: I. Theoretical considerations. Econ. Geogr. 1983, 59, 233–250. [Google Scholar] [CrossRef]
- Arauzo-Carod, J.-M.; Viladecans-Marsal, E. Industrial location at the intra-metropolitan level: The role of agglomeration economies. Reg. Stud. 2009, 43, 545–558. [Google Scholar] [CrossRef]
- Scott, A.J. Industrial organization and the local of intra-metropolitan location, III: A case study of the women’s dress industry in the Greater Los Angeles Region. Econ. Geogr. 1984, 60, 3–27. [Google Scholar] [CrossRef]
- Dicken, P. Global Shift: Reshaping the Global Economic Map in the 21st Century; Sage: Thousand Oaks, CA, USA, 2003. [Google Scholar]
- Broadman, H.; Sun, X. The Distribution of Foreign Direct Investment in China. World Econ. 1997, 20, 339–361. [Google Scholar] [CrossRef]
- Zhu, S.J.; He, C.F. Global, regional and local: New firm formation and spatial restructuring in China’s apparel industry. GEO J. 2014, 79, 237–253. [Google Scholar] [CrossRef]
- Zhou, R.B.; Li, X.W. Evolution of spatial pattern and influencing factors of manufacturing industries in Guangdong Province. Hum. Geogr. 2017, 32, 95–102. [Google Scholar]
- He, C.F.; Dennis Wei, Y.H.; Pan, F.H. Geographical concentration of manufacturing industries in China: The importance of spatial and industrial scales. Eurasian Geogr. Econ. 2007, 48, 603–625. [Google Scholar] [CrossRef]
- Gao, B.Y.; Liu, W.D.; Michael, D. State land policy, land markets and geographies of manufacturing: The case of Beijing, China. Land Use Policy 2014, 36, 1–12. [Google Scholar]
- Zhang, X.; Huang, P.; Sun, L.; Wang, Z.H. Spatial evolution and locational determinants of high-tech industries in Beijing. Chin. Geogr. Sci. 2013, 23, 249–261. [Google Scholar] [CrossRef]
- Halbert, L.; Rouanet, H. Filtering Risk Away: Global Finance Capital, Transcalar Territorial Networks and the (Un) Making of City-Regions: An Analysis of Business Property Development in Bangalore, India. Reg. Stud. 2014, 48, 471–484. [Google Scholar] [CrossRef]
- Wei, Y.D.; Bi, X.J.; Wang, M.F.; Ning, Y.M. Globalization, economic restructuring, and locational trajectories of software firms in Shanghai. Prof. Geogr. 2016, 68, 211–226. [Google Scholar] [CrossRef]
- Yeh, A.G.; Li, X. An integrated remote sensing and GIS approach in the monitoring and evaluation of rapid urban growth for sustainable development in the Pearl River Delta, China. Int. Plan. Stud. 1997, 2, 193–210. [Google Scholar] [CrossRef]
- Gong, J.Z.; Liu, Y.S.; Xia, B.C. Spatial heterogeneity of urban land-cover landscape in Guangzhou from 1990 to 2005. J. Geogr. Sci. 2009, 19, 213–224. [Google Scholar] [CrossRef]
- Kuang, W.H. Spatio- temporal patterns of intra- urban land use change in Beijing, China between 1984 and 2008. Chin. Geogr. Sci. 2012, 22, 210–220. [Google Scholar] [CrossRef]
- Wang, Y.F.; Liu, Y.S.; Li, Y.H.; Li, T.T. The spatio-temporal patterns of urban-rural development transformation in China since 1990. Habitat Int. 2016, 53, 178–187. [Google Scholar] [CrossRef]
- Liu, X.P.; Hu, G.H.; Chen, Y.M.; Li, X.; Xua, X.C.; Li, S.Y.; Pei, F.S.; Wang, S.J. High-resolution multi-temporal mapping of global urban land using Landsat images based on the Google Earth Engine Platform. Remote Sens. Environ. 2018, 209, 227–239. [Google Scholar] [CrossRef]
- Ding, J.; Wang, K.Y. Spatial pattern and morphological characteristics of industrial production space and influential factors in the Pearl River Delta urban agglomeration. Prog. Geogr. 2016, 35, 610–621. (In Chinese) [Google Scholar]
- Zhang, L.L.; Yue, W.Z.; Liu, Y.; Fan, P.L.; Wei, Y.H. Suburban industrial land development in transitional China: Spatial restructuring and determinants. Cities 2018, 78, 96–107. [Google Scholar] [CrossRef]
- Ding, J.; Wang, K.Y. Spatio-temporal evolution of industrial production space and its driving mechanisms in Pearl River Delta urban agglomeration. Geogr. Res. 2018, 37, 53–66. (In Chinese) [Google Scholar]
- Wang, N.C.; Liu, Y.F.; Wang, J.Z.; Qian, X.J.; Zhao, X.Z.; Wu, J.P.; Wu, B.; Yao, S.J.; Fang, L. Investigating the Potential of Using POI and Nighttime Light Data to Map Urban Road Safety at the Micro-Level: A Case in Shanghai, China. Sustainability 2019, 11, 4739. [Google Scholar] [CrossRef] [Green Version]
- Min, Y.; Tinghua, A.I.; Wei, L.U.; Cheng, X.; Qi, Z. A real-time generalization and multi-scale visualization method for poi data in volunteered geographic information. Acta Geod. Cartogr. Sin. 2015, 44, 228–234. [Google Scholar]
- Chen, W.; Liu, L.; Liang, Y. Retail center recognition and spatial aggregating feature analysis of retail formats in guangzhou based on poi data. Geogr. Res. 2016, 35, 703–716. [Google Scholar]
- Hu, Y.F.; Han, Y.Q. Identification of Urban Functional Areas Based on POI Data: A Case Study of the Guangzhou Economic and Technological Development Zone. Sustainability 2019, 11, 1385. [Google Scholar] [CrossRef] [Green Version]
- Wang, J.C. Modern Industrial Geography; China Science and Technology Press: Beijing, China, 1994. (In Chinese) [Google Scholar]
- Lin, G.C.S. Red Capitalism in South. China: Growth and Development of the Pearl River Delta; University of British Columbia Press: Vancouver, BC, Canada, 1997; pp. 1–219. [Google Scholar]
- Sit, V.F.S.; Yang, C. Foreign-investment-induced Exo-urbanisation in the Pearl River Delta, China. Urban Stud. 1997, 34, 647–677. [Google Scholar] [CrossRef]
- Liu, Y.; Liang, Y.; Ma, S.; Huang, K.; Liu, Y.; Liang, Y.; Ma, S.; Huang, K. Divergent developmental trajectories and strategic coupling in the pearl river delta: Where is a sustainable way of regional economic growth? Sustainability 2017, 9, 1782. [Google Scholar] [CrossRef] [Green Version]
- Wei, Y.D.; Ye, X.Y. Urbanization, urban land expansion and environmental change in China. Stoch. Envrion. Res. Risk Assess. 2014, 28, 757–765. [Google Scholar] [CrossRef]
- Li, G.D.; Fang, C.L. Quantitative function identification and analysis of urban ecological-production-living spaces. Acta Geogr. Sinica 2016, 71, 49–65. [Google Scholar]
- Yang, C. Cross-boundary integration of the Pearl River Delta and Hong Kong—An emerging global city-region in China. In Globalization and the Chinese City; Wu, F.L., Ed.; Routledge Press: London, UK, 2006; pp. 125–147. [Google Scholar]
- Guangdong Burenu of Statistics. Guangdong Statistical Yearbook 2018; China Statistics Press: Beijing, China, 2018. (In Chinese) [Google Scholar]
- Batty, M.; Longley, P. Fractal Cities: A Geometry of Form. and Function; Academic Press: London, UK, 1994; pp. 42–49. [Google Scholar]
- Benguigui, L.; Czamanski, D.; Marinov, M.; Portugali, Y. When and where is a city fractal? Environ. Plan. B 2000, 27, 507–519. [Google Scholar] [CrossRef] [Green Version]
- Chen, Y.G.; Jiang, S.G. Modeling fractal structure of systems of cities using spatial correlation function. Int. J. Artif. Life Res. IJALR 2009, 1, 12–34. [Google Scholar] [CrossRef]
- Xu, J.H. Mathematical Methods in Contemporary Geography, 2nd ed.; Higher Education Press: Beijing, China, 2002. (In Chinese) [Google Scholar]
- Gert, D.R. Environment conflicts in compact cities: Complexity, decision making and policy approaches. Environ. Plan. B 2000, 27, 151–162. [Google Scholar]
- Ye, Y.Y.; Zhang, H.; Li, K.; Wu, Q.D. A research on the relationship between construction and expansion and the industrialization of the pearl river delta. Hum. Geogr. 2011, 26, 79–84. (In Chinese) [Google Scholar]
- Camagni, R.; Cristina, M.; Rigamonti, P. Urban mobility and urban form: The social and environmental costs of different pattern of urban expansion. Ecol. Econ. 2002, 40, 199–216. [Google Scholar] [CrossRef]
- Stephan, P.; Friedrich, D. Assessing the environmental performance of land cover types for urban planning. Landsc. Urban. Plan. 2001, 52, 1–20. [Google Scholar]
- Leorey, O.M.; Nariida, C.S. A framework for linking urban form and air quality. Environ. Model. Softw. 1999, 14, 541–548. [Google Scholar]
- Wang, X.S.; Liu, J.Y.; Zhang, D.F.; Wang, L.M. Spatial- temporal changes of urban spatial morphology in China. Acta Geogr. Sin. 2005, 60, 392–400. (In Chinese) [Google Scholar]
- Brown, M.T.; Vivas, M.B. Landscape development intensity index. Environ. Monit. Assess. 2005, 101, 289–309. [Google Scholar] [CrossRef] [PubMed]
- Diggelen, R.; Sijtsma, F.J.; Strijker, D.; Burga, J. Relating land-use intensity and biodiversity at the regional scale. Basic Appl. Ecol. 2005, 6, 145–159. [Google Scholar] [CrossRef]
- Zhu, H.X.; Pan, K.Y.; Liu, Y.; Chang, Z.; Jiang, P.; Li, Y.F. Analyzing Temporal and Spatial Characteristics and Determinant Factors of Energy-Related CO2 Emissions of Shanghai in China Using High-Resolution Gridded Data. Sustainability 2019, 11, 4766. [Google Scholar] [CrossRef] [Green Version]
- Silverman, B.W. Using kernel density estimates to investigate multimodality. J. R. Statist. Soc. B 1981, 43, 97–99. [Google Scholar] [CrossRef]
- Wang, J.; Zhang, W.W.; Zhang, Z.X. Quantifying the Spatio-Temporal Dynamics of Rural Settlements and the Associated Impacts on Land Use in an Undeveloped Area of China. Sustainability 2018, 10, 1490. [Google Scholar] [CrossRef] [Green Version]
- He, C.F. Regional decentralisation and location of foreign direct investment in China. Post Communist Econ. 2006, 18, 33–50. [Google Scholar]
- McDonald, J.F.; McMillen, D.P. Employment Subcenters and Land Values in a Polycentric Urban Area: The Case of Chicago. Environ. Plann. A 1990, 22, 1561–1574. [Google Scholar] [CrossRef]
- Xu, X.Q.; Li, X. Review and preview of the urbanization in Pearl River Delta in the past 30 years of reform and opening up. Econ. Geogr. 2009, 29, 13–18. (In Chinese) [Google Scholar]
- Fotheringham, A.S.; Brunsdon, C.; Charlton, M. Geographically Weighted Regression: The Analysis of Spatially Varying Relation-Ships; Wiley: Chichester, UK, 2002. [Google Scholar]
- Rutherford, V.P. Global and local analysis of fragmentation in a mountain region of Colorado. Agric. Ecosyst. Environ. 2004, 101, 207–218. [Google Scholar]
- Yeh, G.O.; Yang, F.; Xu, Z.H. Will rural urbanization produce a new producer service space in China? Habitat Int. 2017, 67, 105–117. [Google Scholar] [CrossRef]
- Gottmann, J. Megalopolis revisited: 25 years later; University of Maryland Institute for Urban Studies: College Park, MD, USA, 1987. [Google Scholar]
- Dicken, P. Global shift; The Guilford Press: New York, NY, USA, 2011. [Google Scholar]
- Dauth, W.; Suedekum, J. Globalization and local profiles of economic growth and industrial change. J. Econ. Geogr. 2016, 16, 1007–1034. [Google Scholar] [CrossRef] [Green Version]
- Krugman, P. Development, Geography, and Economic Theory; The MIT Press: Cambridge, MA, USA, 1995; p. 117. [Google Scholar]
- Hall, P.G. The World Cities; Heinemann: London, UK, 1966. [Google Scholar]
- Hall, P.G. Global City-Regions in the Twenty-first Century. In Global City-Regions: Trends, Theory, Policy; Scott, A.J., Ed.; Oxford University Press: Oxford, UK, 2001; pp. 59–77. [Google Scholar]
- Lampard, E.E. The history of cities in the economically advanced areas. In Regional Development and Planning; Friedmann, J., Alonso, W., Eds.; The MIT Press: Cambridge, MA, USA, 1964. [Google Scholar]


| Year | GDP (100million yuan) | Secondary industry (100million yuan) | Proportion of GDP |
|---|---|---|---|
| 1990 | 1006.88 | 441.65 | 44% |
| 2000 | 8471.28 | 4044.38 | 48% |
| 2010 | 38377.06 | 18761.56 | 49% |
| 2017 | 75710.14 | 31542.82 | 42% |
| Dimension | Index System | Data Sources | OLS test results |
|---|---|---|---|
| Capital | Number of FDI enterprises | Chinese industrial enterprise database | Good correlation √ |
| Fixed asset investment | Guangdong Statistical Yearbook 2018 | Good correlation √ | |
| Labor | Employment population | Guangdong Statistical Yearbook 2018 | Good correlation √ |
| Average annual wage | Guangdong Statistical Yearbook 2018 | Collinearity × | |
| Land | Land price | The average level of each county (district) | Poor correlation × |
| Built-up area | Impervious surface data (http://www.geosimulation.cn/GlobalUrbanLand.html) | Collinearity × | |
| Others | Urbanization rate | Guangdong Statistical Yearbook 2018 | Good correlation √ |
| Gross industrial production | Guangdong Statistical Yearbook 2018 | Good correlation √ |
| Index | GZ | FS | DG | ZH | SZ | ZS | ZQ | JM | HZ | Total |
|---|---|---|---|---|---|---|---|---|---|---|
| Number of patches | 1739 | 2186 | 2545 | 456 | 1212 | 1323 | 709 | 1530 | 1217 | 12,986 |
| Perimeter of patches/km | 2920.17 | 4728.64 | 4845.27 | 773.89 | 2322.17 | 2235.22 | 991.86 | 2169.84 | 1766.55 | 22,120.22 |
| Area of patches/km2 | 215.05 | 467.91 | 417.69 | 76.87 | 202.66 | 182.43 | 79.26 | 169.66 | 137.98 | 1953.84 |
| intensity index ρ (%) | 15.01 | 42.38 | 32.91 | 24.02 | 25.05 | 36.27 | 18.65 | 24.45 | 18.80 | 26.84 |
| City | Perimeter(P)–area(A)relational Model | Correlation coefficient R | SK | CI | ρ(%) |
|---|---|---|---|---|---|
| GZ | lnA = 1.7467lnP–1.3500 | 0.9418 | 0.3550 | 0.0050 | 15.01 |
| FS | lnA = 1.7316lnP–1.2187 | 0.9442 | 0.3450 | 0.0046 | 42.38 |
| DG | lnA= 1.7461lnP–1.2919 | 0.9351 | 0.3546 | 0.0044 | 33.36 |
| ZH | lnA = 1.8158lnP–1.7154 | 0.9574 | 0.3986 | 0.0113 | 24.02 |
| SZ | lnA = 1.7635lnP–1.3439 | 0.9317 | 0.3659 | 0.0061 | 25.05 |
| ZS | lnA = 1.7247lnP–1.1716 | 0.9474 | 0.3404 | 0.0060 | 36.76 |
| ZQ | lnA = 1.7445lnP–1.3343 | 0.9464 | 0.3535 | 0.0062 | 18.65 |
| JM | lnA= 1.7562lnP–1.4239 | 0.9476 | 0.3612 | 0.0060 | 24.45 |
| HZ | lnA = 1.728lnP–1.1767 | 0.9413 | 0.3426 | 0.0066 | 18.80 |
| County/District/City | Number of Patches | Total Area of the Patch (km2) | CI | ρ (%) |
|---|---|---|---|---|
| Guangzhou Core District | 215 | 14.97 | 0.0159 | 6.59 |
| Baiyun District | 345 | 41.21 | 0.0117 | 17.32 |
| Huangpu District | 122 | 26.69 | 0.0199 | 16.08 |
| Panyu District | 483 | 92.56 | 0.011 | 28.31 |
| Huadu District | 195 | 25.25 | 0.0156 | 11.43 |
| Zengcheng District | 276 | 33.77 | 0.0128 | 18.45 |
| Conghua District | 106 | 10.48 | 0.0217 | 13.27 |
| Shenzhen Core District | 146 | 17.01 | 0.0198 | 7.95 |
| Longgang district | 438 | 65.18 | 0.0109 | 24.14 |
| Baoan District | 635 | 122.74 | 0.0091 | 33.26 |
| Zhuhai Core District | 295 | 55.37 | 0.0142 | 23.26 |
| Doumen District | 152 | 20.95 | 0.0198 | 19.95 |
| Foshan Core District | 229 | 49.81 | 0.0142 | 45.70 |
| Shunde District | 634 | 132.94 | 0.0092 | 44.31 |
| Nanhai District | 974 | 208.6 | 0.0068 | 45.85 |
| Sanshui City | 218 | 48.75 | 0.0151 | 36.11 |
| Gaoming District | 142 | 31.98 | 0.0184 | 33.31 |
| Jiangmen Core District | 178 | 18.28 | 0.0177 | 26.11 |
| Taishan City | 188 | 18.28 | 0.0177 | 10.04 |
| Xinhui City | 660 | 75.6 | 0.0091 | 38.77 |
| Kaiping City | 220 | 23.57 | 0.0168 | 18.71 |
| Heshan City | 275 | 27.62 | 0.0147 | 65.76 |
| Enping City | 53 | 11.38 | 0.0372 | 13.39 |
| Zhaoqing Core District | 154 | 15.13 | 0.0184 | 29.10 |
| Guangning County | 50 | 3.68 | 0.0347 | 11.87 |
| Huaiji County | 46 | 2.59 | 0.0356 | 3.92 |
| Fengkai County | 4 | 0.15 | 0.1160 | 0.41 |
| Deqing County | 39 | 3.73 | 0.0370 | 9.33 |
| Gaoyao City | 210 | 26.05 | 0.0172 | 23.47 |
| Sihui City | 167 | 21.48 | 0.0183 | 24.41 |
| Huizhou Core District | 145 | 14.87 | 0.0191 | 14.44 |
| Boluo County | 360 | 37.14 | 0.0118 | 23.51 |
| Huidong County | 117 | 8.47 | 0.0216 | 6.67 |
| Longmen County | 24 | 2.59 | 0.0572 | 7.19 |
| Huiyang City | 571 | 70.67 | 0.0100 | 6.93 |
| Dongguan City | 2545 | 417.69 | 0.0044 | 32.91 |
| Zhongshan City | 1323 | 182.43 | 0.0062 | 36.27 |
| OID | VARNVME | VARIABLE | DEFINITION |
|---|---|---|---|
| 0 | Bandwidth | 480298.9314 | |
| 1 | ResidualSquares | 47899.64803 | |
| 2 | EffectiveNumber | 6.436530842 | |
| 3 | Sigma | 39.58811627 | |
| 4 | AICc | 388.719898 | |
| 5 | R2 | 0.783257524 | |
| 6 | R2Adjusted | 0.744704074 | |
| 7 | Dependent Field | 0 | Manufacturing Production Space (area/km2) |
| 8 | Explanatory Field | 1 | Urbanization Rate |
| 9 | Explanatory Field | 2 | Fixed Assets Investment |
| 10 | Explanatory Field | 3 | FDI(Number of Enterprises) |
| 11 | Explanatory Field | 4 | Gross Industrial Product |
| 12 | Explanatory Field | 5 | The Employment Population |
© 2019 by the authors. Licensee MDPI, Basel, Switzerland. This article is an open access article distributed under the terms and conditions of the Creative Commons Attribution (CC BY) license (http://creativecommons.org/licenses/by/4.0/).
Share and Cite
Liu, B.; Xue, D.; Tan, Y. Deciphering the Manufacturing Production Space in Global City-Regions of Developing Countries—a Case of Pearl River Delta, China. Sustainability 2019, 11, 6850. https://doi.org/10.3390/su11236850
Liu B, Xue D, Tan Y. Deciphering the Manufacturing Production Space in Global City-Regions of Developing Countries—a Case of Pearl River Delta, China. Sustainability. 2019; 11(23):6850. https://doi.org/10.3390/su11236850
Chicago/Turabian StyleLiu, Bo, Desheng Xue, and Yiming Tan. 2019. "Deciphering the Manufacturing Production Space in Global City-Regions of Developing Countries—a Case of Pearl River Delta, China" Sustainability 11, no. 23: 6850. https://doi.org/10.3390/su11236850
APA StyleLiu, B., Xue, D., & Tan, Y. (2019). Deciphering the Manufacturing Production Space in Global City-Regions of Developing Countries—a Case of Pearl River Delta, China. Sustainability, 11(23), 6850. https://doi.org/10.3390/su11236850