Article

An Evaluation of Historical Trends in New Mexico Beef Cattle Production in Relation to Climate and Energy

by
Ashraf J. Zaied
1,
Hatim M.E. Geli
2,*,
Jerry L. Holechek
1,
Andres F. Cibils
1,
Mohammed N. Sawalhah
3 and
Charlotte C. Gard
4
1
Department of Animal and Range Sciences, New Mexico State University, Las Cruces, NM 88003, USA
2
New Mexico Water Resources Research Institute and Department of Animal and Range Sciences, New Mexico State University, Las Cruces, NM 88003, USA
3
Department of Natural Resources in Arid Lands, Prince El-Hassan bin Talal Faculty for Arid Lands, The Hashemite University, Zarqa 13133, Jordan
4
Department of Economics, Applied Statistics & International Business, New Mexico State University, Las Cruces, NM 88003, USA
*
Author to whom correspondence should be addressed.
Sustainability 2019, 11(23), 6840; https://doi.org/10.3390/su11236840
Submission received: 11 September 2019 / Revised: 26 November 2019 / Accepted: 29 November 2019 / Published: 2 December 2019
(This article belongs to the Special Issue Sustainable Food-Energy-Water (FEW) Nexus)

Abstract

:
In support of Food-Energy-Water Systems (FEWS) analysis to enhance its sustainability for New Mexico (NM), this study evaluated observed trends in beef cattle population in response to environmental and economic changes. The specific goal was to provide an improved understanding of the behavior of NM’s beef cattle production systems relative to precipitation, temperature, rangeland conditions, production of hay and crude oil, and prices of hay and crude oil. Historical data of all variables were available for the 1973–2017 period. The analysis was conducted using generalized autoregressive conditional heteroscedasticity models. The results indicated declining trends in beef cattle population and prices. The most important predictors of beef cattle population variation were hay production, mean annual hay prices, and mean annual temperature, whereas mean annual temperature, cattle feed sold, and crude oil production were the most important predictors for calf population that weigh under 500 lb. Prices of beef cattle showed a strong positive relationship with crude oil production, mean annual hay prices, rangeland conditions, and mean annual precipitation. However, mean annual temperature had a negative relationship with mean annual beef prices. Variation in mean annual calf prices was explained by hay production, mean annual temperature, and crude oil production. This analysis suggested that NM’s beef cattle production systems were affected mainly and directly by mean annual temperature and crude oil production, and to a lesser extent by other factors studied in this research.

1. Introduction

A tremendous increase of 50% or more in global demand for meat, especially beef, is predicted over the next 30 years [1]; this prediction is due to the expected human population growth which can reach up to 9.7 billion by 2050 [2,3]. Globally and as one of the major food components, recent estimates suggested that beef contributes to 22.5% and 34.3% of meat and red meat consumption, respectively [4]. A recent special report by the Intergovernmental Panel on Climate Change (IPCC) on climate change and land indicated that the growing demand for beef (or generally red meat) has a significant impact on land resources, water consumption, and greenhouse gas emission which consequently can have a positive feedback on (i.e., accelerating) climate [5]. The importance of the beef industry to the United States (US) arises from its significant contribution to the economy as livestock production accounts for about half of the total farm revenue (~$137 billion) [6]. At the same time, the US’s Fourth National Climate Assessment highlighted an observed and projected decline in livestock production that was linked to climate change impact through resources consumption (e.g., water and energy) and degradation (pasture land) [6]. Unless there is a clear understanding of the factors affecting this industry coupled with a science-based balanced vision about its impact on climate, enhancing the sustainability of this industry would be a great challenge [7,8,9]. While accounting for beef industry as an individual system is important, this vision also highlighted the need to include and consider the integration of this system with the interconnected food-energy-water (FEW) systems [10].
Beef cattle production can be affected by many environmental and economic factors including temperature [11], precipitation [12], rangeland conditions [13], cattle feed [14], production and prices of hay [15], and production and prices of crude oil [16], among others. It is also important to recognize consumer demand as the primary driver of the beef prices. Overall global growth in beef consumption has increased at an average annual rate of 0.7% for the 1990 to 2016 period [17]. Beef consumption in the US has grown more slower (0.2% annual growth) than globally. This is due in large part to health concerns and associated replacement of beef with chicken in the US diet [18]. To understand the effects of some of these factors on the beef cattle industry, this study used New Mexico (NM) as a model and a suitable indicator due to its multi-latitude location and its diversity of rangeland vegetation types.
The beef cattle industry plays a substantial role in NM’s economy. This industry consists mainly of three interconnected production sub-systems; cow-calf, backgrounding, and feedlot [19]. The cow-calf systems depend mainly on rangeland to produce calves which after weaning (at about six months of age) are sent to backgrounding or feedlots for finishing [19]―processes that depend mostly on feed supplements. About 39% of NM’s land is considered farm and ranches and 92% of that is used for grazing [19]. Agriculture and food processing production, which partially supports feed supplements, make up 12% of NM’s total gross state product (GSP) [20]. In 2012, approximately, 44% of the state’s total agricultural receipts were generated by cattle, consisting of 55% of beef cattle and calves [20]. Therefore, the beef cattle industry is connected with the other sectors that include water [21], crops, labor, machineries, equipment, vehicles [22], and energy [16]. These interconnected sectors further highlighted the need to consider the livestock production system (including beef industry) within integrated FEW systems [8,10,23]. Within this context, this analysis was aimed to understand the behavior of beef cattle industry and environmental changes. An initial observation provided by the authors [24] showed an alarming consistent decline in beef cattle numbers since 1973 that led to this increased concern about the sustainability of this industry.
Increased global average temperature can have negative impacts on forage and livestock production [25]. Global warming is evident due to rising levels of atmospheric carbon dioxide, methane, and nitrous oxide that originate from human activities [26]. The global average temperature increase during the 1950–2000 period was unprecedented, and it is expected to rise an additional 0.4 °C by the end of 2027 [26]. Heat waves due to global warming will be severe by the end of the current century [26]. High temperatures lead to increased rates of evaporation, resulting in decreasing water availability for forage plants [27]. In addition, heat stress has negative impacts on cattle feed efficiency [28,29]. Beef cattle fertility can be affected when average daily minimum temperature and humidity are above 17 °C and 73, respectively [11], The observed rising temperature trend in New Mexico is not so different than that of the global averages [24]. Hence the response of NM’s beef industry to these trends can provide a good characterization of the potential behavior of this industry globally.
NM’s beef industry may face serious threats from lack of water that can affect rangeland forage and feed supplements production as well as drinking water supply [30]. NM’s climate is generally semi-arid to arid [19]. Thus, the agricultural sector primarily depends on surface and groundwater that account for 53% and 46% of the total freshwater, respectively [21]. On average, livestock consumes 1% of the total water withdrawals [for drinking]. All water used by livestock come from surface water (9%) and groundwater (91%) [21]. Precipitation and water flow from other states are primary contributors to these sources. So the lack of precipitation, increased evaporation, and persistent drought continued to negatively impact these sources [31]. Increased pressure on water due to population growth, drought, and the need to increase food production for human consumption from irrigated agriculture can result in reduced rangeland livestock production [30].
In addition to its normally dry conditions, another challenge facing NM beef production is the decline in forage production due to drought [32] and heavy grazing [32,33], where heavy grazing usually refers to 57% use of the main forage plants [34]. These two factors can directly affect rangeland conditions. A study conducted in southcentral NM showed that heavy grazing during a drought in 1974 resulted in a decline in blue grama production to 60% (about 34 kg per hectare), compared to pre-drought production (about 170 kg per hectare) [32]. Another study in Southeastern NM indicated that the decrease in blue grama production caused by heavy grazing was more than the decline caused by light grazing [33].
The beef industry in NM can also be influenced by low livestock prices coupled with high feed supplement prices often associated with drought [12]. When these economic phenomena occur, their impact lasts for half a decade or longer [12]. For example, the 1996 drought led to a decrease in livestock prices to 35% below those of the 1992–1993 period, while grain prices increased by 100% from the 1995 prices [12]. In response to drought, ranchers reduced herd numbers through liquidation due to a decline in rangeland forage production [12,13]. In other cases, ranchers opted to enhance supplemental feeding and leased lands to retain their cattle to avoid herd liquidation and low cattle prices triggered by drought [13].
Recent ranchers’ behavior can affect the production of supplemental feeds. Between 2002 and 2014, the number of farms in NM experiencing net economic losses rose about 81% [30]. This rise in net economic losses was mainly attributed to a decline in the size of farmlands to 41% over a period of 10 years (2002–2012) [30]. In NM, lands have been converted to be used for other purposes like crude oil extraction [30,35]. This conversion practice leads to loss of croplands that play an important role in producing supplemental feed for livestock [36]. Additionally, crude oil extraction leads to increased pressure on water through drilling processes that needs a considerable amount of water [37].
Moreover, beef cattle production can directly and indirectly be impacted by drought which can limit water availability and consequently energy production [38]. Water is one of the major inputs in energy (primary and secondary) production because it is used in the extraction of crude oil and in the cooling of power plants that are used to produce electricity [38]. Water shortage can reduce the efficiency of these power plants. For instance, due to the 2012 drought, one-third of the United States (US) was affected by water shortage that also hampered energy production at some locations [38]. These effects, consequently, led to negative impacts on the beef cattle production process because energy is needed in agricultural operations for powering agricultural machineries, producing fertilizers, and transporting crops [39], which can affect the production of feed supplements. Therefore, any change in crude oil production and its associated costs can have impacts on ranchers, especially for those who use great amounts of harvested forage and grain to feed their cattle [40]. Furthermore, energy plays an essential role in the transportation of animals. For example, the cow-calf systems, which are widely used in US, involves moving weaned calves to pasture and then feedlot to be finished [41]. Once finished at a feedlot then they are sent to the slaughterhouse.
Historically, in NM, increased energy prices that coincide with a reduction in crude oil production affect livestock production by increasing ranching costs [16]. Increases in livestock prices are usually insufficient to offset the rise of energy prices and ranching costs, resulting in financial losses [16]. While crude oil prices increased from $2.9 (per barrel) in 1959 to $89.2 in 2010 [42], beef prices increased from $6.2 (per 45.4 kg) in 1959 to $84.7 in 2010 and ranching costs represented by hay prices increased from $24.3 to $177 (per ton) during the same period [43].
Research is lacking on proper characterization of the relationships between the beef cattle system and water-energy systems which can negatively affect the development of sustainable production systems [8,44]. Providing such characterization not only can potentially help in improving the sustainability of the overall food production but also FEW systems. The objectives of this study were to contribute an understanding and provide improved characterization of the linkages among NM’s beef cattle-climate-energy systems, examine their responses to stresses, and develop resilience strategies. These objectives were achieved by evaluating the relationships between beef production systems (i.e., beef cattle population, calf population, and their corresponding prices) and hay production and prices, mean annual temperature, mean annual precipitation, rangeland conditions, cattle feed sold, and crude oil production and prices.

2. Methodology

2.1. Study Area

The study focused on beef cattle production in NM, which is located in the southwestern region of the US (31°20′ N to 37° N) and (103° W to 109°3′ W). With an average annual precipitation of 380 mm, NM is classified as the fifth driest state in the US. Most of the precipitation falls in the summer months of July and August, with small amounts fall in January. Precipitation rate varies spatially from high to low from north to south, respectively. The mean annual and maximum temperatures are 11.5 °C and 40.6 °C, respectively. The annual evaporation rate is more than 250 cm. Generally, NM is considered the fifth largest crude oil producer in the US, accounting for 5% of the total US production. Based on NM’s characteristics mentioned above, the state can be considered as a model and a good indicator to understand the linkages between beef cattle production and some environmental and economic factors including energy, water, and climate change. This understanding can be generalized for other parts of the world with similar arid to semi-arid conditions.

2.2. Time Series Data

The data used in this study consisted of 45 years (1973–2017) of beef cattle population (numbers of beef cattle) and calf population (number of calves that weigh under 500 lb.); hay production (tons); mean annual hay price ($ per ton); mean annual rangeland conditions (percent); cattle feed sold (tons); and mean annual prices of beef cattle and calves ($ per 45.4 kg) that were obtained from the US Department of Agriculture National Agricultural Statistics Service (USDA-NASS) [43]. It is important to note that the USDA reports a number of categories of calf population that include in addition to calves that weigh under 500 lb., steers that weigh 500 or more, heifers that weigh 500 or more, and calf crop which may include the sum (with some level of uncertainty) of these three categories. All data obtained from the USDA website represents an inventory that is conducted in January each year for all variables. Environmental data including mean annual precipitation (mm) and mean annual temperature (°C) were obtained from the Western Regional Climate Center [45]. Crude oil production (barrels) and mean annual prices ($ per barrel) data were obtained from the Go-TECH [46] and the Federal Reserve Economic Data (FRED), respectively [42]. Mean annual range condition can be used as an indicator of rangeland forage production. Mean annual calf prices are the prices of calves that are less than one year old and weight less than 226.7 kg. Mean annual cattle prices refer to prices of all cattle that weight more than 226.7 kg.

2.3. Statistical Analysis

All prices were adjusted for inflation, according to the consumer price index (CPI) that was obtained from FRED [42]. Calf population was converted to percent (%) by dividing the number of calves that weigh under 500 lb. in each year by the number of beef cattle. Prior to conducting simple regression analyses, relevant statistical tests were performed including: (1) Portmanteau tests and Engle Lagrange multiplier tests to check outliers and homoscedasticity at time lags (years) 1–12; (2) Shapiro–Wilk tests to check normality; and (3) Durbin–Watson tests to check autocorrelations. The Durbin–Watson test was used to diagnose autocorrelation in residuals of linear regression in all data. Heteroscedasticity and autocorrelation were detected in our data. To determine the significance of a variable in explaining the variation in beef cattle production and its prices, the generalized autoregressive conditional heteroscedasticity (GARCH) and its exponential version (EGARCH) models were used at significance level of 0.05 when heteroscedasticity and autocorrelation were detected [47]. Proc AUTOREG in SAS 9.4 (SAS Institute, Cary, NC, US) was used in the analysis.

3. Results and Discussion

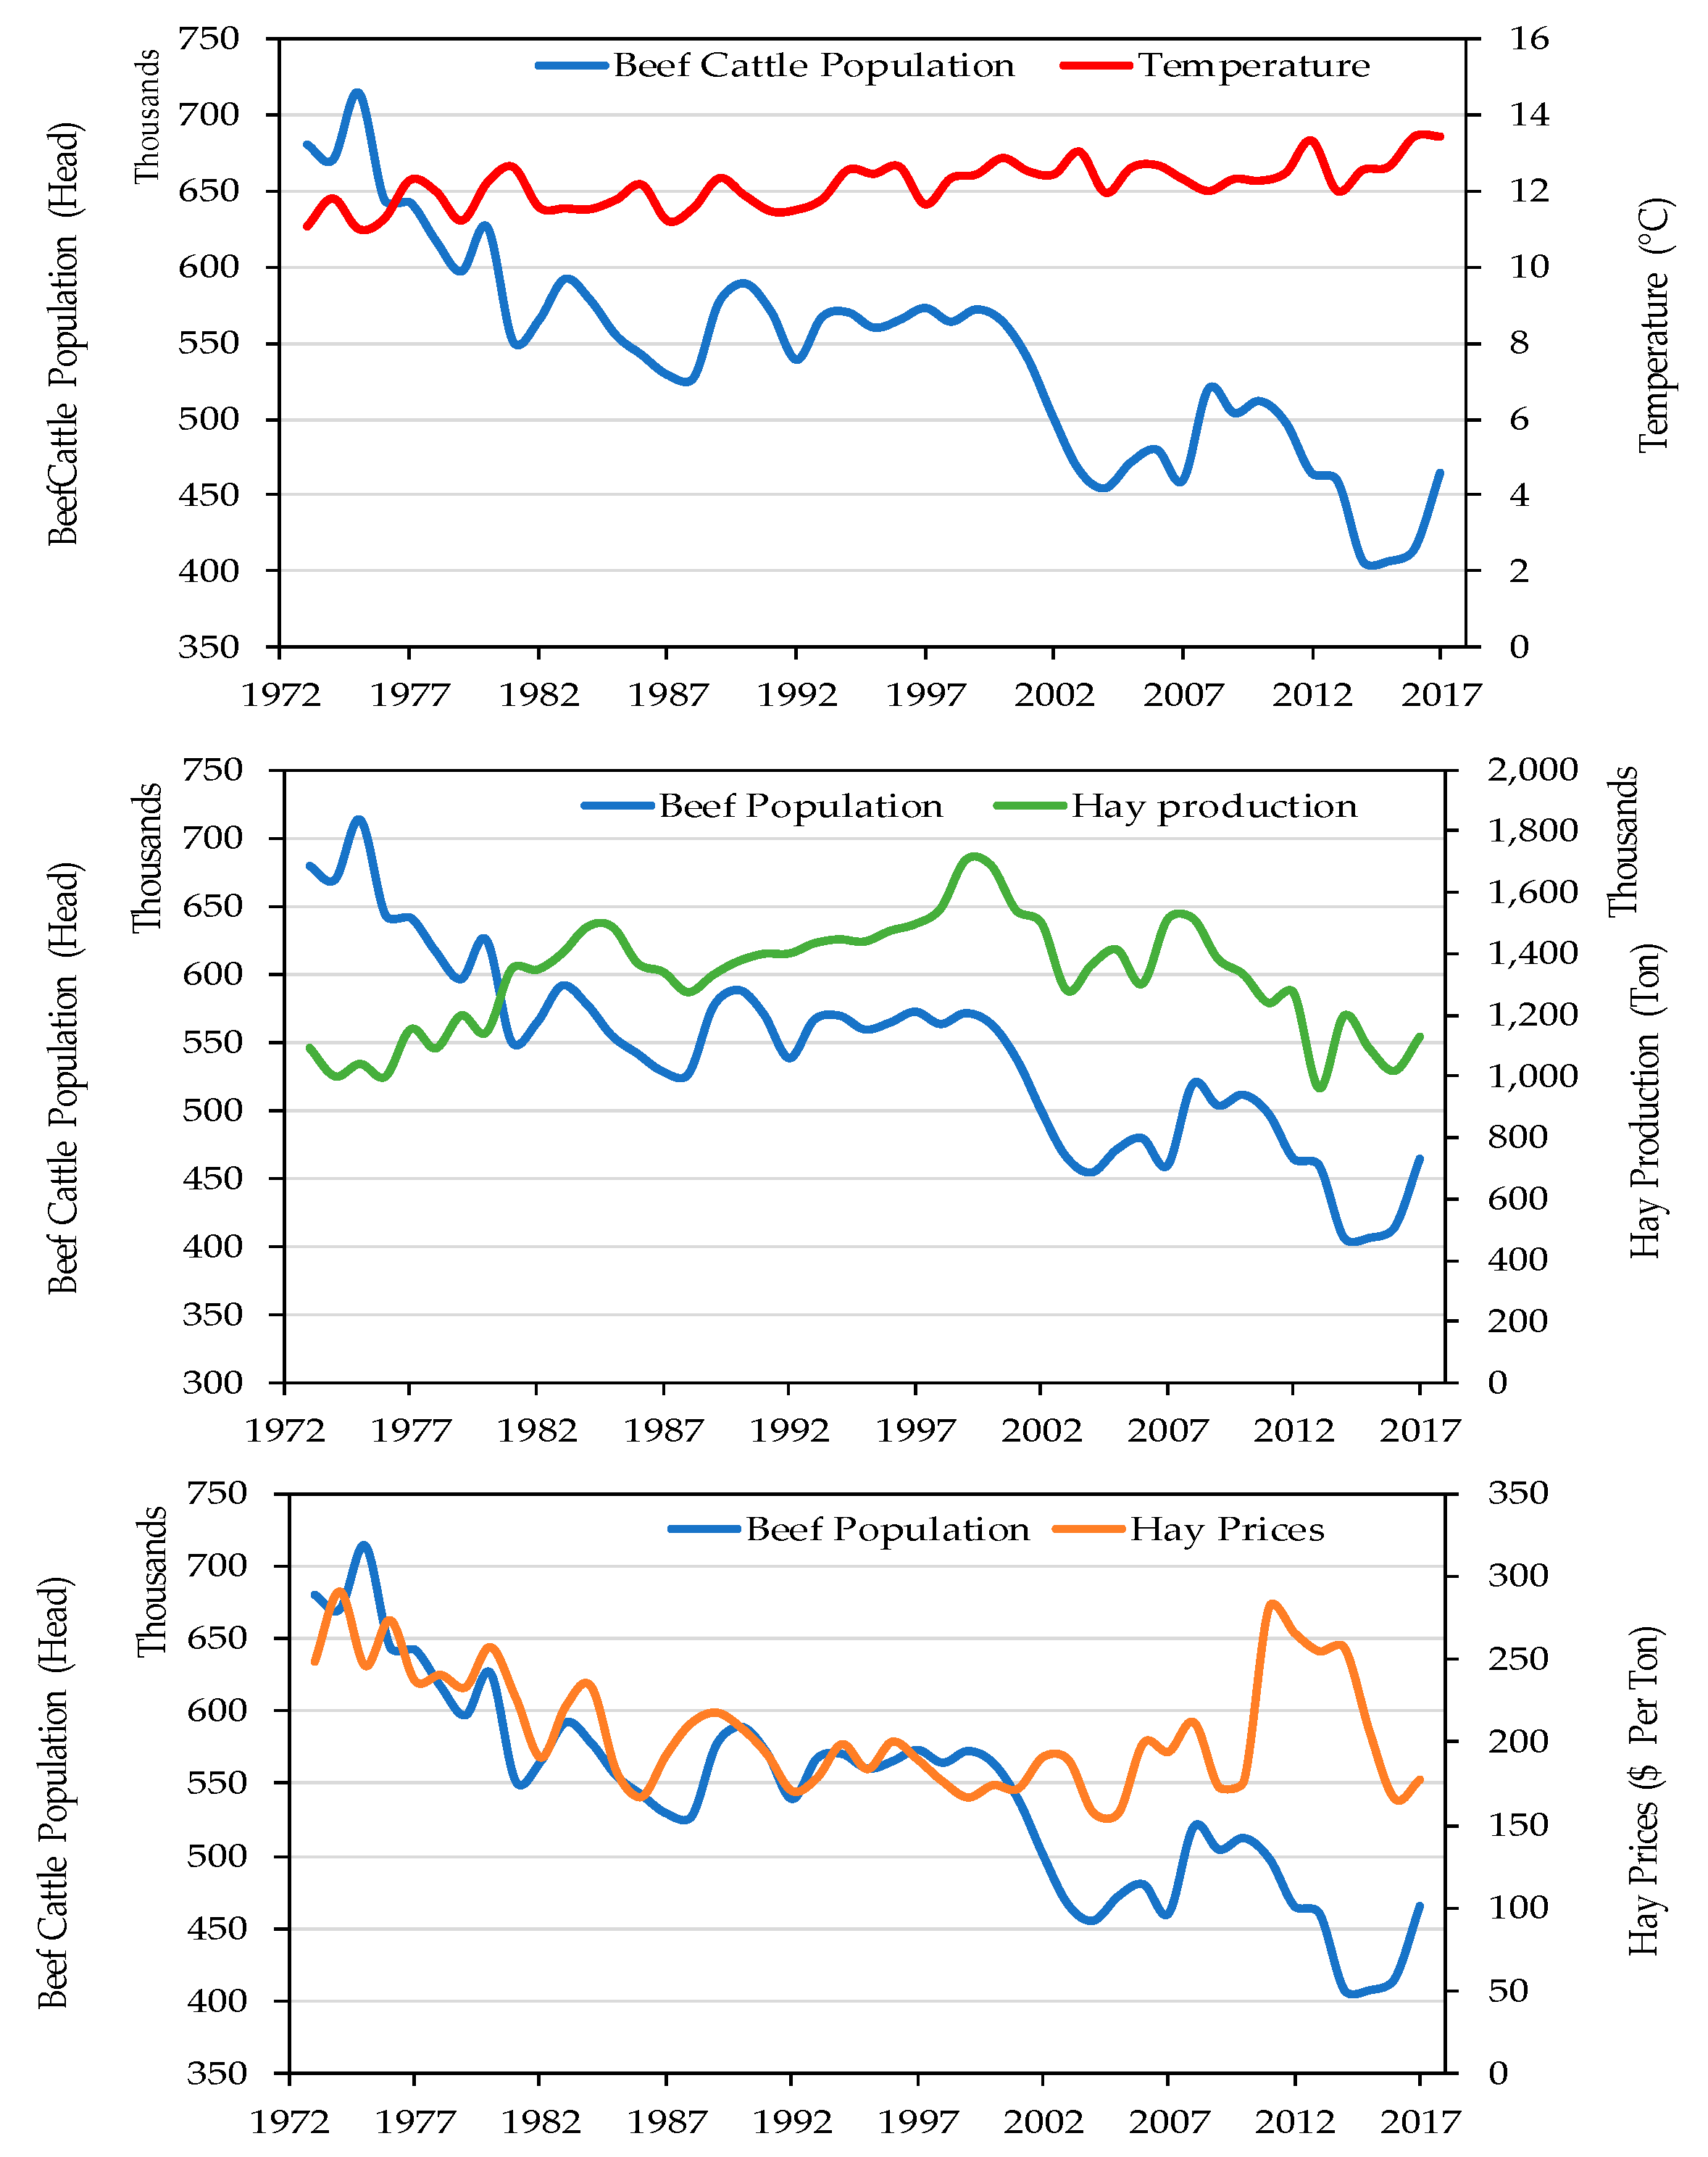
3.1. Factors Affecting Beef Cattle population

Based on a visual inspection of all available historic data since 1973, beef cattle population (i.e., numbers) showed a consistent declining trend. The lowest cattle numbers were observed in 2015, with an annual beef cattle population of only 407,000 head (Figure 1). The results indicated that mean annual temperature, hay production, and mean annual hay prices were the only significant predictors that were able to explain some of the variation in beef cattle population (Table 1).
Mean annual temperature was significantly linked with beef cattle population (β = −24,210) and explained 77% of its declining trend (Table 1). The results showed that the increased mean annual temperature to ~2.3 °C between 1973 and 2017 was associated with a decline in beef cattle numbers from 680,000 to 465,000 head (Figure 1). Generally, beef cattle can be affected by high temperatures because they have negative impacts on animal growth, feed efficiency [28], and animal health [25]. A more rational explanation that is pertinent to New Mexico was related to long-term reduction in rangeland forage production that was observed in the Chihuahua Desert and was linked to increased temperatures as shown in [48].
Hay production (β = 0.11) and mean annual hay prices (β = 434.44) contributed significantly to variations in beef cattle numbers. They each accounted for 80% of the variation in beef cattle numbers. The increase in hay production between 1993 and 2000 coincided with temporally stable beef cattle numbers. However, in 2017, both hay production and beef cattle numbers showed a 33% and 17% decline, respectively, compared to 2000 (Figure 1). The relationship between beef cattle population and mean annual hay prices is shown in Figure 1. Beef cattle population was positively correlated with hay production and mean annual hay prices. It should be noted the dairy industry is a major driver of hay prices as well as the beef industry. NM’s beef cows consume on average 33% more hay than dairy cattle. This average is inferred from the number of beef and milk cows as provided in the USDA-NASS reports for the period 2000 to 2017. On the other hand, persistent drought conditions can partially explain the increase in mean annual hay prices, hay production, and beef cattle numbers. It should be noted that generally the demand for hay is the major driver for hay prices. During drought periods, the demand for hay increases due to the potential decline in rangeland forage production. This increased demand for hay during drought can then lead to the need to increase irrigation requirements for cultivating hay crops. In NM water supply comes mostly from combined surface and groundwater sources. Shortage in surface water supply during drought periods is supplemented from groundwater sources which is then accompanied by cost of pumping. Hence the combined effects of hay demand during normal conditions, frequent drought, and cost of pumping can partially lead to increased hay prices. The use of hay in beef cattle nutrition, specifically alfalfa hay, can lead to better animal performance by improving cattle digestibility [14], and reproduction [49]. This can result in reducing mortality rates among herds. However, during drought periods some ranchers have opted to retain their cattle on lands where plants cannot meet cattle requirement from forage without providing them forage supplements [12]. Such management practice can result in losing weight and increase mortality among beef cattle [12].
The obtained results indicated that there were no relationships between beef cattle population and other investigated variables including mean annual precipitation, rangeland conditions, and cattle feed sold (Table 1). Also, the regression analysis was not able to detect any significant relationship between beef cattle population and crude oil production and prices. It should be noted that, this finding was inconsistent with those from the study by Holechek and Sawalhah [16]. Based on a qualitative analysis, they suggested that a combination of declining crude oil production and rising crude oil prices can negatively affect livestock industry profits by increasing transportation costs [16]. Additional analysis will be conducted in the future to evaluate these two different findings.

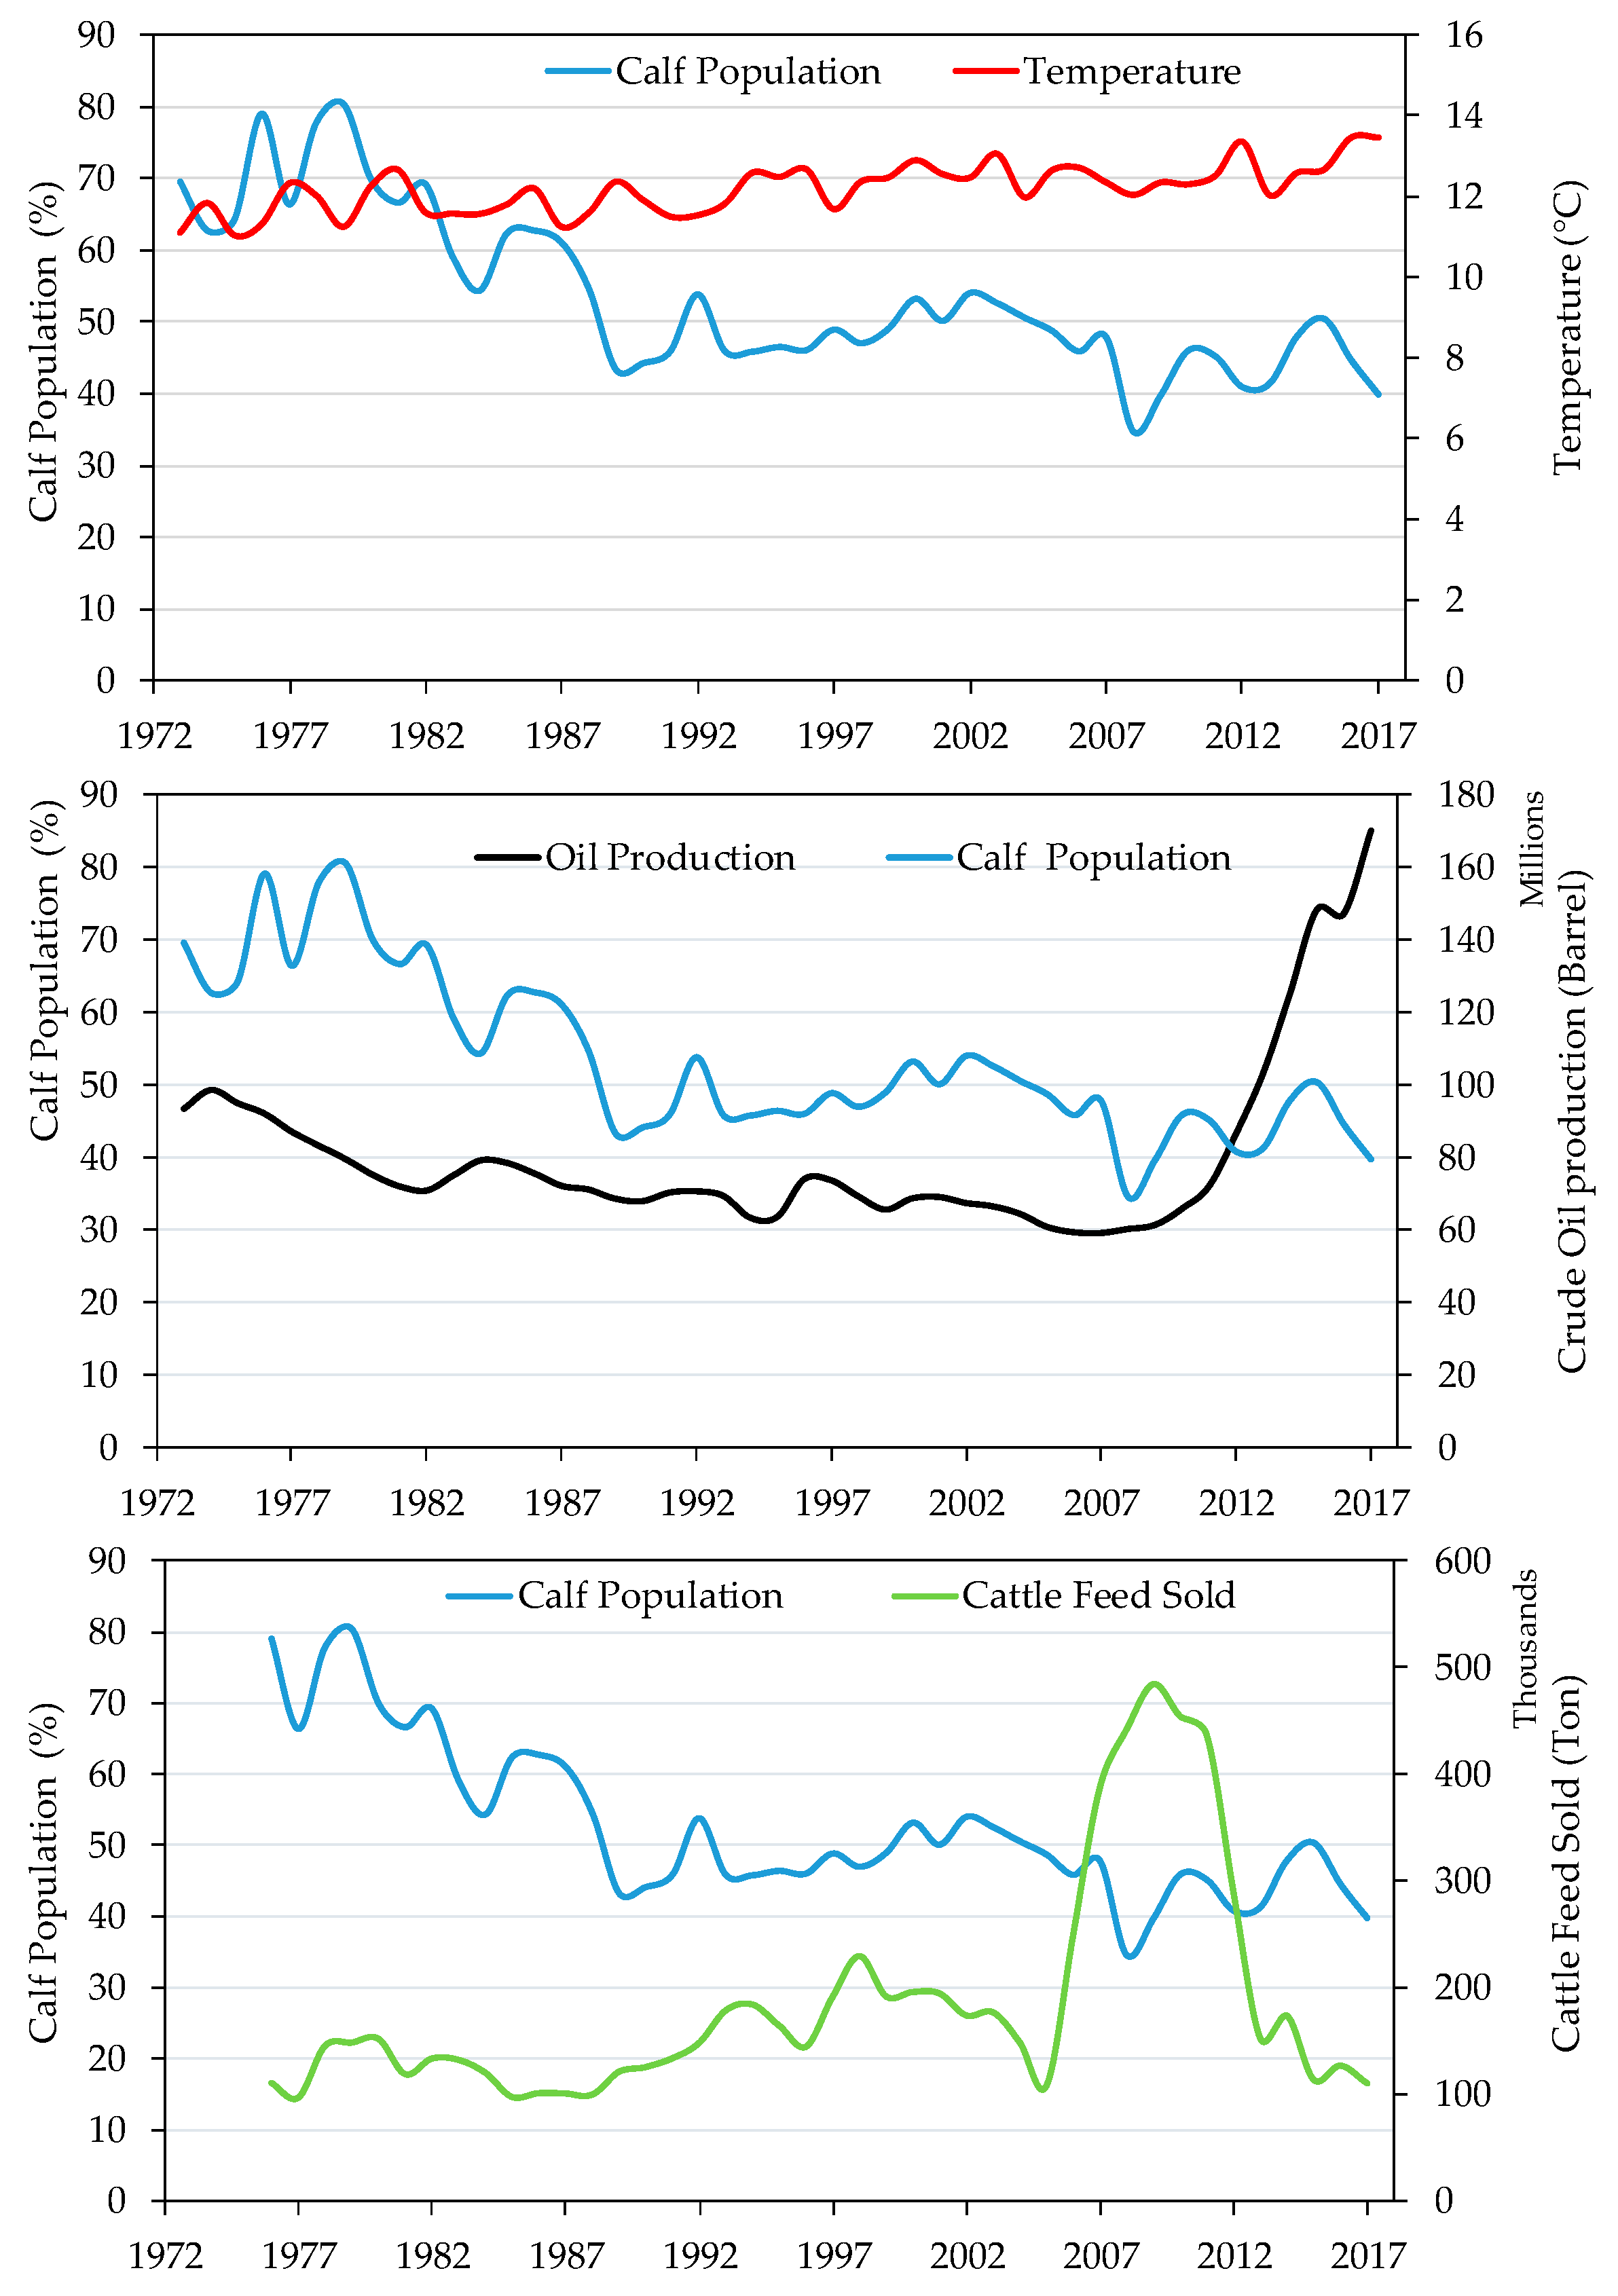
3.2. Factors Affecting Calf Population

In 2017, calf population decreased to around 40% compared to 70% in 1973. The lowest calf population was observed in 2008 (34.6%, Figure 2). Only mean annual temperature, crude oil production, and cattle feed sold were able to explain some of the variation in calf population (Table 2).
Mean annual temperatures were significantly related to decreased calf population (β = −5.89) and explained about 70% of its variation (Table 2). The results showed that calf population dropped about 50% between 1979 and 2017 as the mean annual temperature increased from 11.09 °C to 13.4 °C (about 2.31 °C increase) (Figure 2). Increased temperature can result in decreased cow fertility [11]. It also, can reduce nutrient intake by cows [28]. Undernutrition during gestation period can cause increased mortality among calves [50].
Crude oil production was significantly correlated with calf population (β = −1.475 × 10⁻⁸) and explained 70% of its variation (Table 2). Comparing 2017 to 1973, crude oil production almost doubled, while calf population declined about 30%. However, much of the decline in calf population was during a period with a relatively stable crude oil production which showed an exponential increase after 2010 (Figure 2). This can be attributed to the development in crude oil production that requires changing lands to be used as oil pads, roads, and other infrastructures [36], leading to loss of rangelands that are considered the primary source of forage for livestock. On the other hand, the analysis also indicated that hay prices, hay production, mean annual precipitation, range conditions, and mean annual crude oil prices were not able to explain the behavior of, or provide a relative response to, calf population (Table 2).
Cattle feed sold was negatively related to calf population (β = −1.824 × 10⁻⁶) and explained 72% of its variation (Table 2). During 2006 to 2014 period, there was a surge (more than 100%) in cattle feed sold followed by a sudden decrease, meanwhile a notable drop in calf population was observed during the same period. Increased cattle feed sold of about 485 × 103 tons in 2009 was associated with a 39% decline in calf population (Figure 2). This can partially be attributed to selling calves early because rangelands cannot support additional number of animals [13]. In addition, during this period NM suffered from persistent drought conditions as indicated by Palmer Drought Index (PDI) [24] that can also partially explain the relative behavior of cattle feed sold and calf population. Moreover, prior to this drought period, NM’s rangeland forage production did not show signs of improvement even when it received reasonable precipitation [24]. Therefore, ranchers needed to use cattle feed in order to keep their cattle. However, previous studies indicated that the prevalent management strategy during droughts for NM’s ranchers was to sell calves early as short yearling to avoid increased ranching costs [12,13].

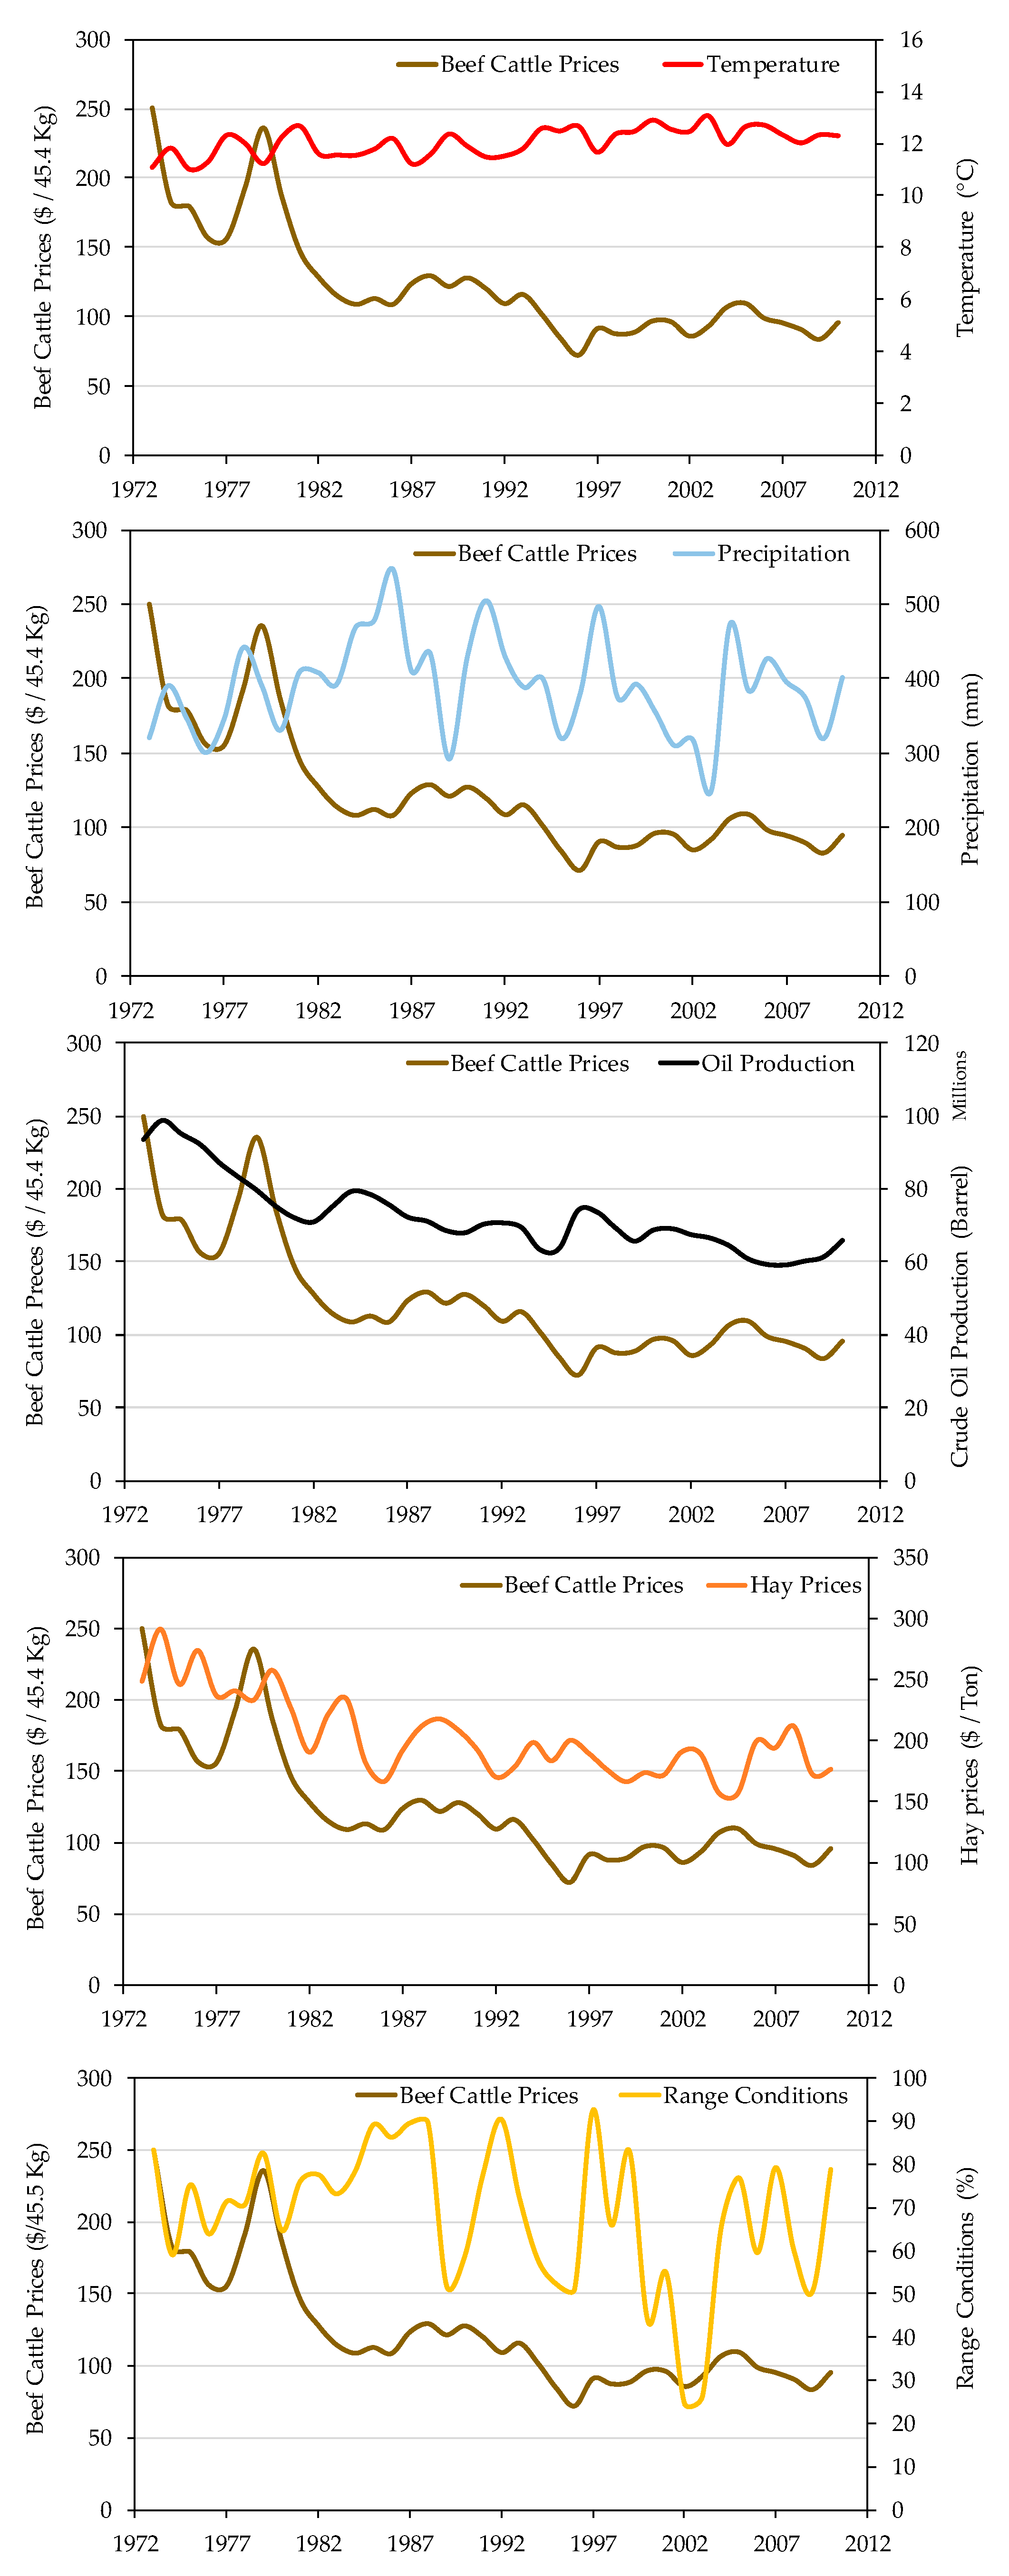
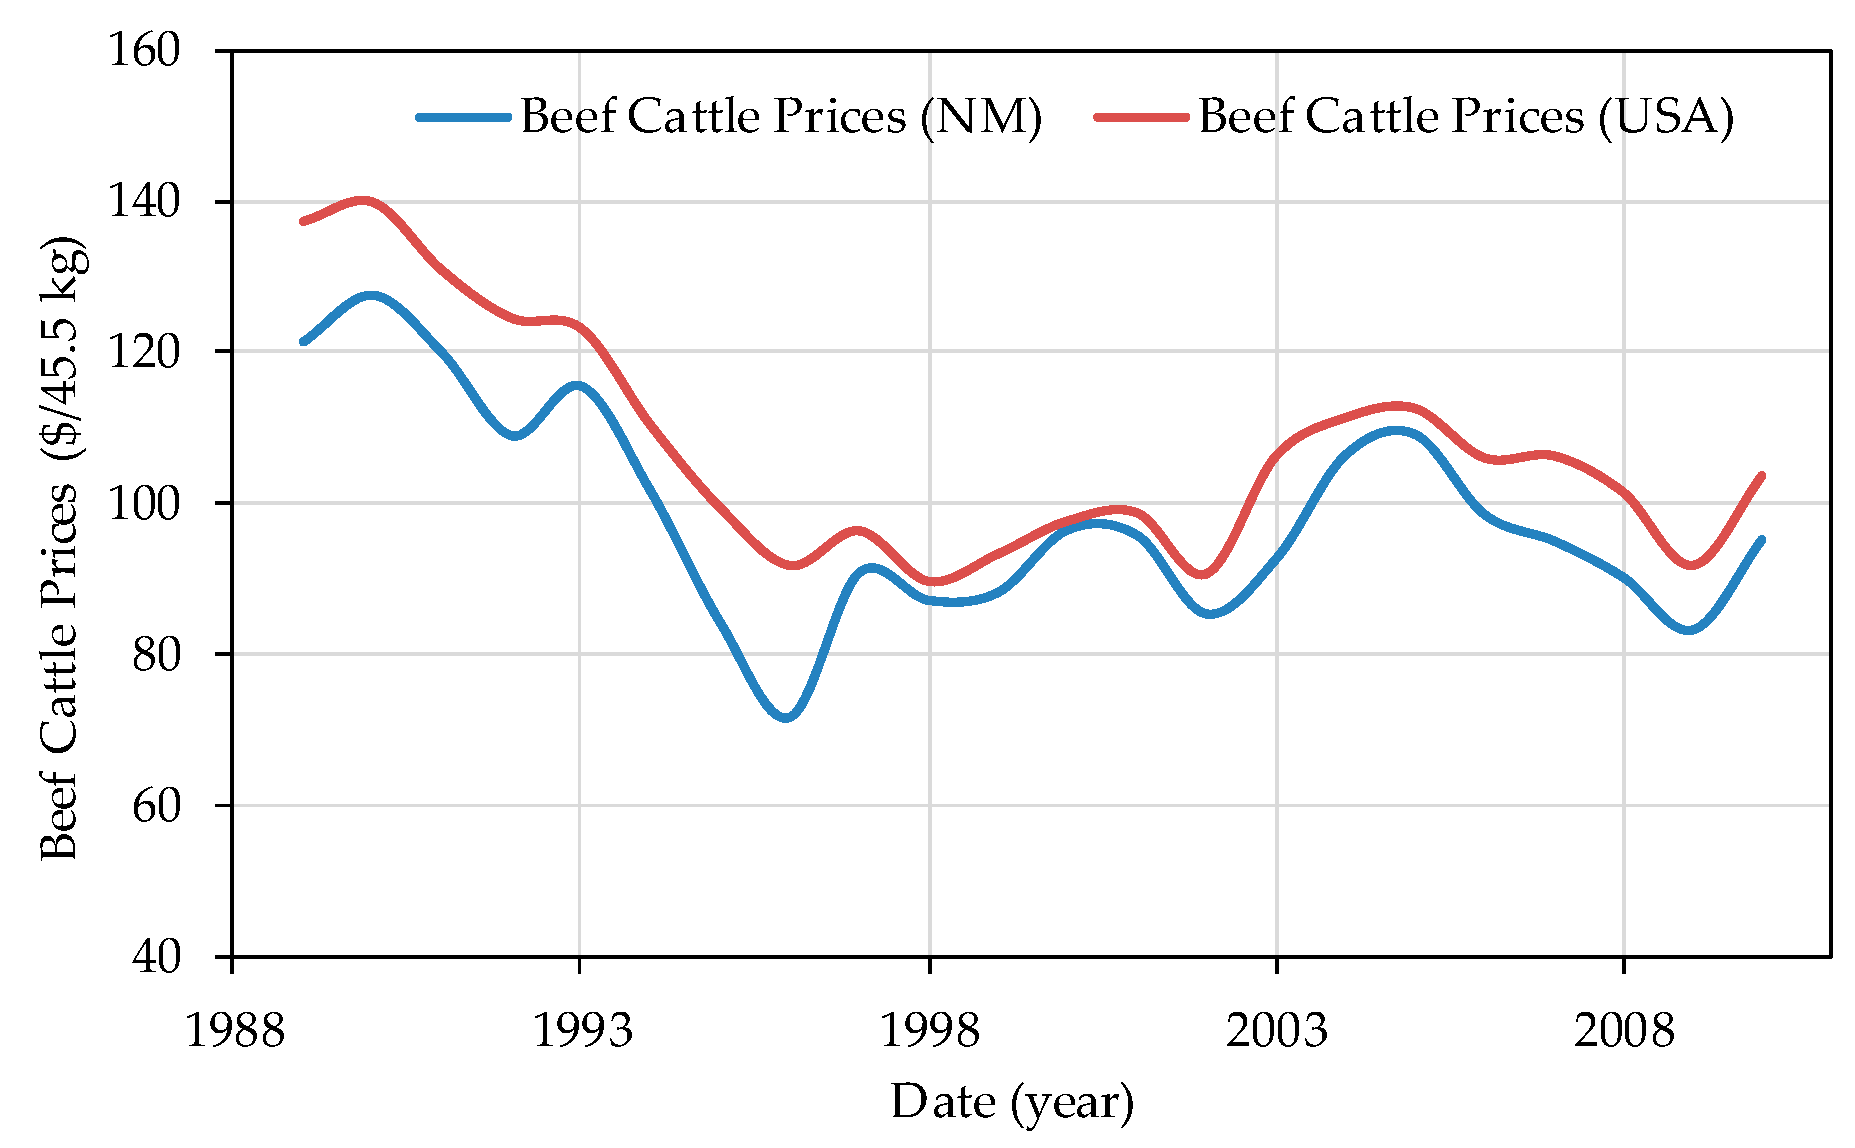
3.3. Factors Affecting Beef Cattle Prices

Mean annual beef cattle prices showed an overall consistent declining trend since 1973. A steep decline was observed during 1973–1996 followed by moderate to stable price levels since then. The greatest beef cattle price drop was observed in 1996 and the average decline in prices in the 2010s was about 62% relative to the 1973 price (Figure 3).
As shown in Table 3, mean annual temperatures were significantly correlated with mean annual beef cattle prices (β= −13.8) and explained 79% of its declining trend. The data showed that in 1973, mean annual beef cattle price was $250 per 45.4 kg, while mean annual temperature was 11 °C. In 1996 as the mean annual temperature increased to 12.6 °C, mean annual beef cattle price dropped to $71.7 per 45.4 kg―which is a 70% drop compared to the 1973 price (Figure 3). In NM and based on this analysis, it appeared that the beef cattle prices were affected by many factors, that can mostly be attributed to change in climate as represented by rising mean annual temperatures. High temperatures can result in a high rate of evaporation of approximately more than 250 mm annually. Increased evaporation can reduce water availability for forage plants [27], and when coupled with drought can result in degraded rangelands in terms of forage quality and quantity. It should be noted that NM’s rangeland forages are considered the primary feed source for beef cattle. With the degraded forage in rangelands, ranchers tend to use forage supplements to feed their cattle at least 3–5 months per year [13]. Increased use of supplemental feed can lead to increased ranching costs especially during drought periods. This combination of increased temperature, drought, and increased use of feed supplement can be the main reason for reducing herd sizes through liquidation, therefore livestock prices fluctuated based on supply-demand relationship. The impact of destocking and later restocking in response to these climatic fluctuations can cause regional livestock price fluctuations which can alter the supply-demand relationship. This finding, however, highlighted the need to evaluate the dynamic behavior of beef demand, production, and price fluctuations during both normal and drought conditions. However, the need to conduct such evaluation was out of the scope of this analysis and is currently being conducted by this research team.
Mean annual precipitation and mean annual range conditions were significantly related to mean annual beef cattle prices (β = 0.05), and (β = 28.25) and explained about 74%, and 78% of its variation, respectively (Table 3). These results can partially be explained by the fact that adequate precipitation and favorable temperature between drought periods can result in improved vegetation conditions which, in turn, can provide enough rangeland forage to carry additional animals and postpone sale especially when predicted prices were satisfactory [12,13]. Thus, ranchers can retain their cattle resulting in a temporary increase in beef cattle prices. In 1979, increased mean annual precipitation to 391.9 mm and decreased mean annual temperature to 11.2 °C resulted in improved mean annual range conditions to 82.4%. This can partially explain the increased beef cattle prices to $235.7 per 45.4 Kg. In 2003, however, decreased mean annual precipitation to 250 mm and increased mean annual temperature to 13.03 °C led to a sharp drop in mean annual range conditions to 26.2 % and consequently resulted in a declined beef cattle price to $92.6 per 45.4 Kg (Figure 3). The results showed that there was cyclical pattern that can be used to describe the behavior of beef cattle prices. The prices generally increased for about 1–3 years then followed by a decrease for about 2–4 years.
Since 1973, fluctuation in crude oil production was correlated with the mean annual beef cattle prices (β = 1.7844 × 10⁻⁶) and explained 62% of its variation (Table 3). In 1973, the observed increase in crude oil production to about 93 million barrels per year was associated with a raise in mean annual beef cattle price to $250 per 45.4 Kg. Similarly, a decline in crude oil production to about 66 million barrels per year in 2010 was associated with a decrease in mean annual beef cattle price to $95.2 per 45.4 Kg (Figure 3). A rational explanation for this correlation is that crude oil development can have a positive impact on beef cattle industry by providing extra income for some ranchers who were also involved in the crude oil sector [16]. This effect is not broadly applicable since most of the crude oil production (more than 90%) occurs in eastern NM and only 8.6% of the farm and ranch bussinesses received income from the energy sector in the form of royalites and leases [51]. Improved financial status of ranchers can enhance their ability to buy feed supplements, reduce liquidation operations, and consequently lead to increased beef cattle prices.
Mean annual hay prices were correlated with mean annual beef cattle prices (β= 0.93) and explained about 53% of its variation (Table 3). Figure 3 showed that both mean annual beef cattle prices and mean annual hay prices declined since 1973, but with notably different percentages of decrease. In the 1973–2010 period, mean annual hay prices declined about 29% while mean annual beef cattle prices dropped 62%. This correlation is in agreement with observed traditional economic and rangeland management practices followed in NM. In normal conditions NM’s ranchers buy feed supplements to feed their cattle during the winter season (about 3–5 months) [13]. Such use of feed supplement adds to the overall production expenses and ranching costs. It has been shown that hay prices can be affected by the increase in crude oil prices [2], which also can result in increasing ranching costs and mean annual beef cattle prices. On the other hand, historical prices suggest that NM’s prices are reflective of the national economy but not necessarily affect its behavior. A time series plot (Appendix A) of the two market prices provided an initial perspective about similar behavior that needs additional analysis which was out of the scope of this paper. An in-depth evaluation is under development by the authors and will be disseminated in the further. Also, generally, the factors that influence crude oil production have a moderate impact on beef cattle production. These conditions show generally how beef cattle prices are sensitive to changes in hay prices. Additionally, it should be noted that the overall effect of a decline in beef cattle prices can result in reduced profitability and ranchers’ income. The other variables including hay production, cattle feed sold, and mean annual crude oil prices did not show any relationships that can be used to describe the behavior of mean annual beef cattle prices (Table 3).

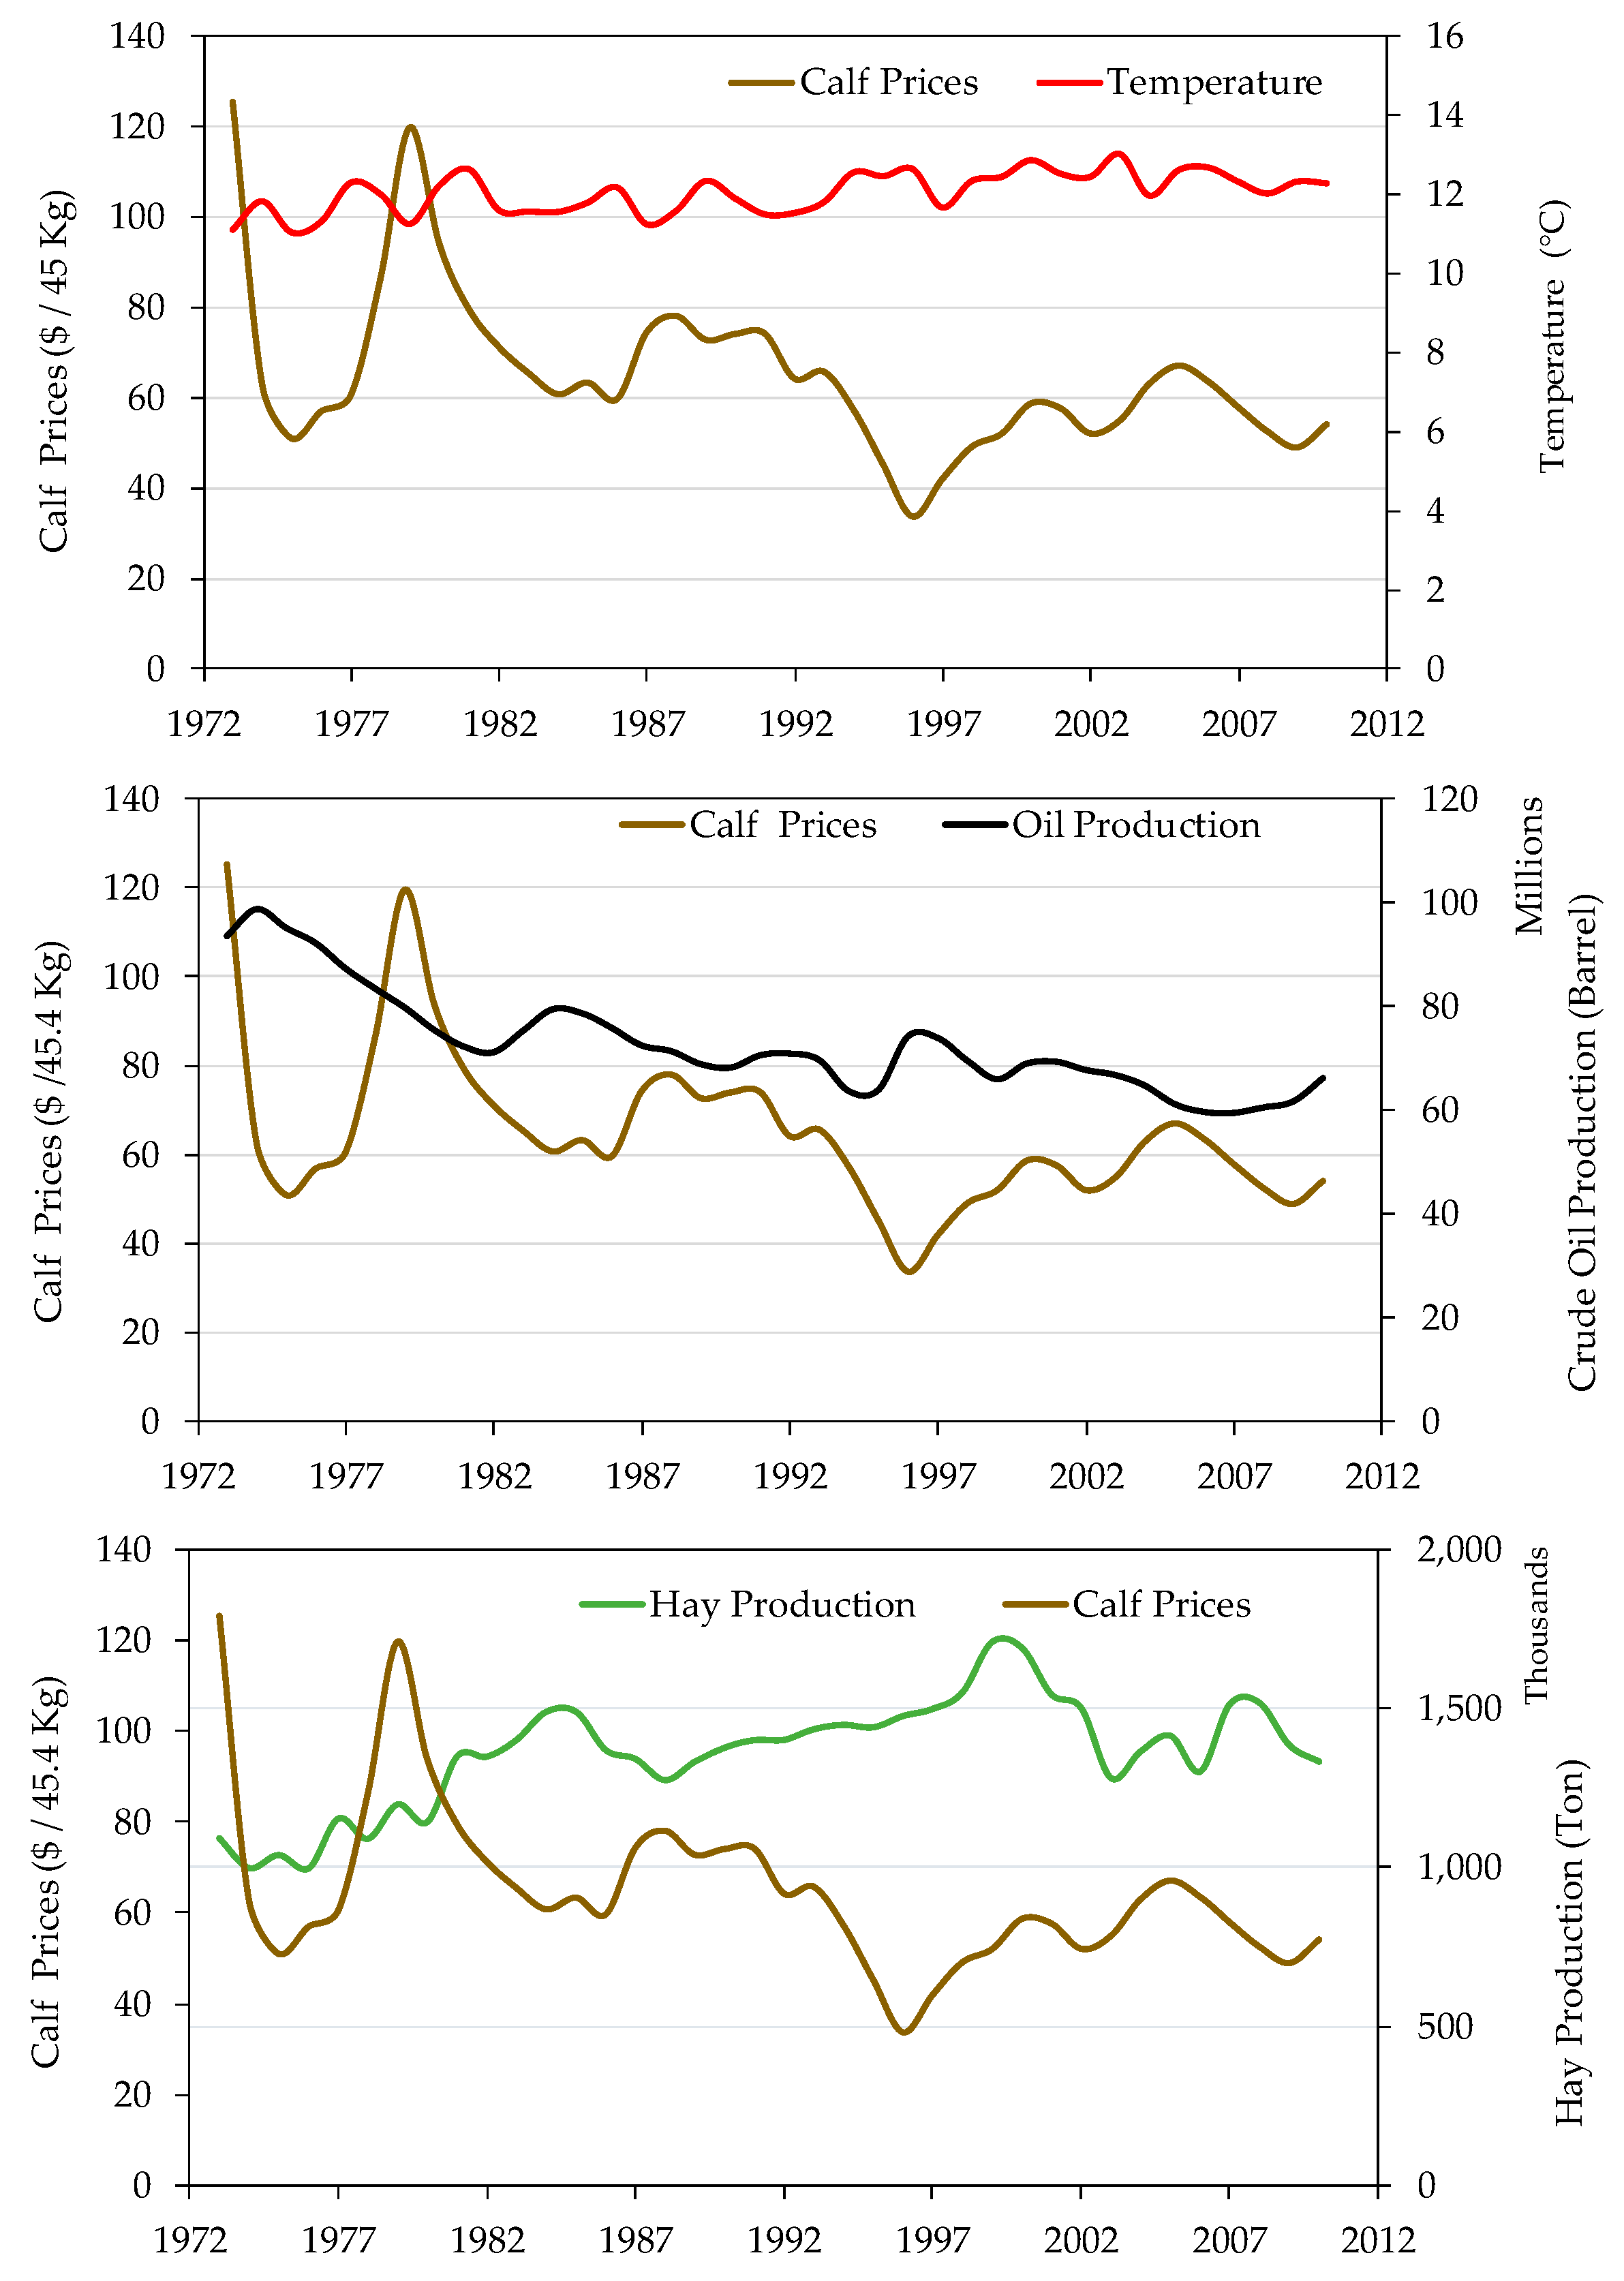
3.4. Factors Affecting Calf Prices

Mean annual calf prices showed a significant declining trend since 1973. Summary of regression analysis of variables used to predict mean annual calf prices is shown in Table 4. Mean annual temperatures had a negative correlation with mean annual calf prices (β = −6.14) and explained 40% of its variation. In 1979, a low mean annual temperature of 11.2 °C, coincided with a rise in mean annual calf price to $119.7. In 1996, an increase in the mean annual temperature to 12.6 °C was followed by a sharp drop the mean annual calf price to $33.6 (Figure 4). Increased mean annual temperatures can not only affect livestock by causing low nutrition, growth cessation [28], and eventually death [25], but they can also result in high evaporation rates which, in turn, limit water availability for plant growth, causing a decline in rangeland productivity [27] and early calf marketing (liquidation) [13]. The liquidation operation can lead to decline calf prices [52].
Crude oil production was significantly related with mean annual calf prices (β = 7.8005 × 10⁻⁷) and explained around 31% of its variation (Table 4). Crude oil production and mean annual calf prices experienced a long-term declining trend during the 1973–2010 period (Figure 4). This result was consistent with the findings from previous studies that suggested that crude oil production contributed to an increase of income of some ranchers [16] which may have allowed them to hold calves longer until getting a good price and hence leading to increased calf prices.
Hay production was significantly linked with mean annual calf prices (β = −0.000039) and explained about 33% of its variation (Table 4). In 1973, hay production was 1,093,300 tons and the mean annual calf price was $125 per 45.4 Kg. In 2009, increased hay production to 1.384 million tons was associated with a decrease in the mean annual calf price to $48.9 per 45.4 Kg―about a 60% drop from the 1973 prices (Figure 4). In NM, the decline in rangeland productivity due to drought can cause many ranchers to follow a strategy of reducing herds or selling calves early instead of feeding them forage supplements―a process that can increase ranching expenses [12,13]. Therefore, cattle liquidation operations especially during drought can be considered as the main reason for the decline in mean annual calf prices. Similar to the behavior of beef cattle prices, an initial observation showed that there was a cycle in calf prices of about 1–3 years of increase followed by decline for about 2–4 years. This observation requires additional analysis to support but it was out of the scope of this study.
This analysis showed that hay prices, precipitation, range conditions, cattle feed sold, and crude oil prices were not able to explain the variation in calf prices (Table 4). These results were inconsistent with previous findings that indicated that the cost of feed supplements and energy prices affect ranching costs and livestock prices [16]. Ranchers do not necessarily affect (set) beef cattle and calf prices. In addition, it is known that beef cattle and calf prices are not determined by traits of environment alone. Consumers’ demand, supply, and interconnected regional and national economy are important determinants that set some constraints on prices that ranchers have to consider while also accounting for their associated ranching costs. Additional analysis will need to be conducted in the future to understand the linkages between these factors and beef cattle and calf prices. Similarly, previous studies suggested that favorable precipitation and forage conditions allowed ranchers to retain calves longer, sell them as long yearlings [12,13], and increase calf prices.

4. A Perspective of Practical Applications

These findings could provide a perception and improved understanding about NM’s major food production system―beef cattle. The study showed how these systems function during normal conditions and highlighted its response and behavior under stresses from drought and economic fluctuations. This analysis was conducted within the context of understanding NM’s food-energy-water systems (FEWS) and to develop more resilient FEWS. This analysis identified the main variables (i.e., temperature, precipitation, range conditions, hay production and prices, and cattle feed sold) that have a major role in describing beef cattle population as summarized in Table 5. The identified relationships can directly support the development of an integrated FEWS that is responsive to environmental and economic stresses. Such integrated system of systems will allow evaluation of NM’s FEWS which currently is under increased pressure and guide efforts to enhance its resiliency. This pressure is evident specially when considering that beef cattle production showed a declining trend since 1973 and puts some doubt on the ability of this system to meet the increased demand for food due to population growth if it continues to operate with the current management practices. New sustainable management strategies will need to be developed to enhance the resiliency of NM’s FEWS and other similar regions. This analysis showed that the combination of increased temperature and frequent droughts is one of the major problems that affect rangeland livestock production systems. A group of researchers from NM State University (NMSU) is currently developing a NM FEWS that will help in evaluating current, and develop new, management strategies for resilient FEWS. One of the management strategies is development of heat tolerant genetically adapted cattle breeds that can subsist in lean precipitation. Members of this team are engaged in research with a heritage cattle breed, the Raramuri Criollo from Mexico, with the goal of identifying a beef cattle breed that is better adapted to a progressively drier and hotter Southwest as shown in [53,54].

5. Conclusions

This paper highlighted some relationships that can be used to describe the behavior of beef cattle production systems including beef cattle population, calf production, and beef cattle prices, and calf prices in response to environmental and economic factors that include precipitation, temperature, prices and production of hay and crude oil, cattle feed sold, and range conditions in NM. The results showed that all four variables, beef cattle population, calf population, and prices of beef cattle and calf, experienced an overall declining trend since 1973. These declining trends can mainly be attributed to increased mean annual temperatures. The analysis also showed that the decrease in hay prices and production can lead to a decrease in beef cattle population. Crude oil production showed no relationship with beef cattle population while crude oil production and cattle feed sold were negatively correlated with calf population. The results also showed that increased (or improved) range conditions, precipitation, and hay prices can lead to increased beef cattle prices. On the other hand, calf prices were negatively correlated with hay production. Crude oil production was one of the variables that contributed to increased prices of beef cattle and calf. This analysis also highlighted the need for an in-depth evaluation of market conditions in terms of consumers’ demand and supply and their relationships with beef cattle prices, analysis of the dynamics in beef demand during both normal and drought conditions, and the need for the development of drought and heat stress tolerant genetically adapted cattle breeds.

Author Contributions

Conceptualization, A.J.Z. and H.M.E.G.; methodology, A.J.Z., H.M.E.G., J.L.H., M.N.S., and A.F.C.; software, A.J.Z., M.N.S., and C.C.G.; validation, A.J.Z., H.M.E.G., J.L.H., A.F.C., and M.N.S.; formal analysis, A.J.Z. and C.C.G.; investigation, A.J.Z. and, H.M.E.G.; resources, H.M.E.G.; data curation, A.J.Z.; writing―original draft, A.J.Z.; writing―review and editing, A.J.Z., H.M.E.G., J.L.H., M.N.S., A.F.C., and C.C.G.; visualization, A.J.Z., M.N.S., and H.M.E.G.; supervision, H.M.E.G. and A.F.C.; project administration, H.M.E.G.; funding acquisition, H.M.E.G. and A.J.Z.

Funding

This research was partially funded by the National Science Foundation (NSF), awards # 1739835 and # IIA-1301346”, New Mexico State University, and Canadian Bureau of International Education (CBIE) -Libyan-North American Scholarship Program (LNASP).

Acknowledgments

The authors would like to thank two anonymous reviewers for their effort and comments that helped in strengthening the manuscript.

Conflicts of Interest

The authors declare no conflict of interest. The funders had no role in the design of the study; in the collection, analyses, or interpretation of data; in the writing of the manuscript, or in the decision to publish the results. Any opinions, findings, and conclusions or recommendations expressed in this material are those of the author(s) and do not necessarily reflect the views of the National Science Foundation.

Appendix A

The following historic prices of NM and US prices of beef cattle. These time series showed a tendency of similar behavior and trend. This observation suggested that NM’s prices are reflective of, but not necessarily affect, the national economy. A further in-depth analysis is needed to highlight this association.
Figure A1. A comparison between NM and US beef cattle prices for the period 1989–2010.
Sustainability 11 06840 g0a1

References

  1. World Resources Institute (WRI). World Resource Report: Creating a Sustainable Food Future: A Menu to Feed Nearly 10 Billion People by 2050; World Resources Institute: Washington, DC, USA, 2018; p. 96. [Google Scholar]
  2. Searchinger, T.; Waite, R.; Hanson, C.; Ranganathan, J.; Dumas, P.; Matthews, E.; Klirs, C. Creating a Sustainable Food Future. A Menu of Solutions to Feed Nearly 10 Billion People by 2050—Final Report; Library of Congress Control Number: 2019907466; Water Resources Institute: Washington, DC, USA, 2019; ISBN 978-1-56973-963-1. [Google Scholar]
  3. Trostle, R. Global Agricultural Supply and Demand: Factors Contributing to the Recent Increase in Food Commodity Prices; DIANE Publishing: Collingdale, PA, USA, 2010. [Google Scholar]
  4. Revell, B.J. One man’s meat… 2050? ruminations on future meat demand in the context of global warming. J. Agric. Econ. 2015, 66, 573–614. [Google Scholar] [CrossRef]
  5. Reidmiller, D.R.; Avery, C.W.; Easterling, D.R.; Kunkel, K.E.; Lewis, K.L.M.; Maycock, T.K.; Stewart, B.C.; Wuebbles, D.J.; Fahey, D.W.; Hibbard, K.A. (Eds.) USGCRP Impacts, Risks, and Adaptation in the United States: Fourth National Climate Assessment; Volume II: Report-in-Brief; U.S. Global Change Research Program: Washington, DC, USA, 2018; p. 186.
  6. Gowda, P.H.; Steiner, J.; Olson, C.; Boggess, M.; Farrigan, T.; Grusak, M.A. Chapter 10: Agriculture and Rural Communities. Impacts, Risks, and Adaptation in the United States: The Fourth National Climate Assessment; U.S. Global Change Research Program: Washington, DC, USA, 2018; Volume II.
  7. National Academies of Sciences, Engineering, and Medicine. Science Breakthroughs to Advance Food and Agricultural Research by 2030; National Academies Press: Washington, DC, USA, 2019; ISBN 0-309-47395-0. [Google Scholar]
  8. Godde, C.; Dizyee, K.; Ash, A.; Thornton, P.; Sloat, L.; Roura, E.; Henderson, B.; Herrero, M. Climate change and variability impacts on grazing herds: Insights from a system dynamics approach for semi-arid Australian rangelands. Glob. Chang. Biol. 2019, 25, 3091–3109. [Google Scholar] [CrossRef] [PubMed]
  9. World Meteorological Organization. The Global Climate in 2011–2015; WMO – No 1179; Chairperson, Publications Board World Meteorological Organization (WMO): Geneva, Switzerland, 2016; p. 32. ISBN 978-92-63-11179-1. [Google Scholar]
  10. Zhang, C.; Chen, X.; Li, Y.; Ding, W.; Fu, G. Water-energy-food nexus: Concepts, questions and methodologies. J. Clean. Prod. 2018, 195, 625–639. [Google Scholar] [CrossRef]
  11. Amundson, J.L.; Mader, T.L.; Rasby, R.J.; Hu, Q.S. Environmental effects on pregnancy rate in beef cattle. J. Anim. Sci. 2006, 84, 3415–3420. [Google Scholar] [CrossRef] [PubMed]
  12. Holechek, J.L. Drought in New Mexico: Prospects and management. Rangelands 1996, 18, 225–227. [Google Scholar]
  13. Boykin, C.C.; Gray, J.R.; Caton, D.D. Ranch production adjustments to drought in eastern New Mexico. 1962. Available online: http://contentdm.nmsu.edu/cdm/ref/collection/AgCircs/id/69939 (accessed on 1 December 2019).
  14. Holechek, J.L.; Pieper, R.D.; Herbel, C.H. Range Management. Principles and Practices, 6th ed.; Prentice-Hall: Upper Saddle River, NJ, USA, 1989. [Google Scholar]
  15. Kemper, N.; Flanders, A.; Watkins, B.; Popp, M. Impact of the 2012 Drought on Field Crops and Cattle Production in Arkansas Preliminary Report. Drought Impact 2013, 1–10. [Google Scholar]
  16. Holechek, J.L.; Sawalhah, M.N. Energy and Rangelands: A Perspective. Rangelands 2014, 36, 36–43. [Google Scholar] [CrossRef]
  17. Widmar, D.A. Global Beef Trends: China, Brazil Grab Spotlight. Available online: https://www.feedstuffs.com/news/global-beef-trends-china-brazil-grab-spotlight (accessed on 24 November 2019).
  18. Oscar, R. Food Trends: Meat Consumption Up, Beef Declines. Available online: https://www.globalmeatnews.com/Article/2016/04/13/Food-trends-meat-consumption-up-beef-declines (accessed on 24 November 2019).
  19. Culbert, J.I. Cattle Industry of New Mexico. Econ. Geogr. 1941, 17, 155–168. [Google Scholar] [CrossRef]
  20. Diemer, J.; Crawford, T.; Patrick, M. Agriculture’s Contribution to New Mexico’s Economy. Available online: https://aces.nmsu.edu/pubs/_circulars/CR675/welcome.html (accessed on 15 July 2019).
  21. New Mexico Office of the State Engineer/Interstate Stream Commission. New Mexico Water Use by Categories 2010. Available online: http://www.ose.state.nm.us/ (accessed on 28 March 2019).
  22. Hawkes, J.; Libbin, J. Cost and Return Estimates (CARE) for Farms and Ranches 2013–2019. Available online: https://costsandreturns.nmsu.edu./ (accessed on 18 July 2019).
  23. Rasul, G.; Sharma, B. The nexus approach to water–energy–food security: An option for adaptation to climate change. Clim. Policy 2016, 16, 682–702. [Google Scholar] [CrossRef]
  24. Sawalhah, M.N.; Holechek, J.L.; Cibils, A.F.; Geli, H.M.E.; Zaied, A. Rangeland Livestock Production in Relation to Climate and Vegetation Trends in New Mexico. Rangel. Ecol. Manag. 2019, 72, 832–845. [Google Scholar] [CrossRef]
  25. Nardone, A.; Ronchi, B.; Lacetera, N.; Ranieri, M.S.; Bernabucci, U. Effects of climate changes on animal production and sustainability of livestock systems. Livest. Sci. 2010, 130, 57–69. [Google Scholar] [CrossRef]
  26. Solomon, S.; Qin, D.; Manning, M.; Averyt, K.; Marquis, M.; Tignor, M.M. Climate Change 2007—The Physical Science Basis: Working Group I Contribution to the Fourth Assessment Report of the IPCC; Cambridge University Press: Cambridge, UK, 2007; Volume 4, ISBN 0-521-70596-7. [Google Scholar]
  27. Stoddart, L.A.; Smith, A.D.; Thadis, W.B. Range Management, 3th ed.; McGraw-Hill: New York, NY, USA, 1955. [Google Scholar]
  28. Hahn, G.L. Dynamic responses of cattle to thermal heat loads. J. Anim. Sci. 1999, 77, 10–20. [Google Scholar] [CrossRef] [PubMed]
  29. Mitlöhner, F.M.; Morrow, J.L.; Dailey, J.W.; Wilson, S.C.; Galyean, M.L.; Miller, M.F.; McGlone, J.J. Shade and water misting effects on behavior, physiology, performance, and carcass traits of heat-stressed feedlot cattle. J. Anim. Sci. 2001, 79, 2327–2335. [Google Scholar] [CrossRef] [PubMed]
  30. New Mexico First. Resilience in New Mexico Agriculture. Opportunities, Challenges and Realities for New Mexico’s Farming and Ranching Future. Available online: http://nmfirst.org/ (accessed on 28 March 2019).
  31. New Mexico First. 2018 State Water Planning Town Hall Background Report. Available online: http://nmfirst.org/ (accessed on 28 March 2019).
  32. Pieper, R.D.; Parker, E.E.; Donart, G.B.; Wright, J.D. Cattle and vegetational response to four-pasture and continuous grazing systems. N. M. Agric. Exp. Stn. Bull. 1991, 576. [Google Scholar]
  33. Holechek, J.; Galt, D.; Joseph, J.; Navarro, J.; Kumalo, G.; Molinar, F.; Thomas, M. Moderate and light cattle grazing effects on Chihuahuan Desert rangelands. J. Range Manag. 2003, 1, 133–139. [Google Scholar] [CrossRef]
  34. Holechek, J.L.; Gomez, H.; Molinar, F.; Galt, D. Grazing studies: What we’ve learned. Rangel. Arch. 1999, 21, 12–16. [Google Scholar]
  35. Gedefaw, M.G.; Geli, H.M.; Finegold, Y. Evaluating the impact of land use/land cover change on food production using cloud-based dense time series analysis to Support New Mexico’s Food-Energy-Water Systems Analysis. In Proceedings of the AGU Fall Meeting Abstracts, Washington, DC, USA, 10–14 December 2018. [Google Scholar]
  36. Allred, B.W.; Smith, W.K.; Twidwell, D.; Haggerty, J.H.; Running, S.W.; Naugle, D.E.; Fuhlendorf, S.D. Ecosystem services lost to oil and gas in North America. Science 2015, 348, 401–402. [Google Scholar] [CrossRef]
  37. Vengosh, A.; Jackson, R.B.; Warner, N.; Darrah, T.H.; Kondash, A. A critical review of the risks to water resources from unconventional shale gas development and hydraulic fracturing in the United States. Environ. Sci. Technol. 2014, 48, 8334–8348. [Google Scholar] [CrossRef]
  38. USA Department of Energy. Ensuring the Resiliency of Our Future Water and Energy Systems. Available online: https://www.energy.gov/energygov (accessed on 28 March 2019).
  39. Holechek, J.L.; Valdez, R. Natural Resources: Ecology, Economics, and Policy; Prentice Hall: Upper Saddle River, NJ, USA, 1999. [Google Scholar]
  40. Holechek, J.L. Changing western landscapes, debt, and oil: A perspective. Rangelands 2006, 28, 28–33. [Google Scholar] [CrossRef]
  41. Pelletier, N.; Pirog, R.; Rasmussen, R. Comparative life cycle environmental impacts of three beef production strategies in the Upper Midwestern United States. Agric. Syst. 2010, 103, 380–389. [Google Scholar] [CrossRef]
  42. Federal Reserve Economic Data | FRED | St. Louis Fed. Available online: https://fred.stlouisfed.org/ (accessed on 28 March 2019).
  43. USDA—National Agricultural Statistics Service—New Mexico. Quick Stats (Searchable Database) and Annual Statistical Bulletin. Available online: https://www.nass.usda.gov/Statistics_by_State/New_Mexico/index.php (accessed on 28 March 2019).
  44. Fan, X.; Fei, C.; McCarl, B. Adaptation: An Agricultural Challenge. Climate 2017, 5, 56. [Google Scholar] [CrossRef]
  45. Western Regional Climate Center. Available online: https://wrcc.dri.edu (accessed on 28 March 2019).
  46. GO-TECH: Home Page. Available online: http://octane.nmt.edu/gotech/ (accessed on 28 March 2019).
  47. López, S.; Cibils, A.; Smedly, U.; Guldan, S.; Fernald, A.; Ochoa, C.; Boykin, K.; Cibils, L. Linkages Between acequia Farming and Rangeland Grazing in Traditional Agropastoral Communities of the Southwestern USA. Sustainability 2018, 10, 2021. [Google Scholar] [CrossRef]
  48. McIntosh, M.M.; Holechek, J.L.; Spiegal, S.A.; Cibils, A.F.; Estell, R.E. Long-Term Declining Trends in Chihuahuan Desert Forage Production in Relation to Precipitation and Ambient Temperature. Rangel. Ecol. Manag. 2019, 72, 976–987. [Google Scholar] [CrossRef]
  49. Davis, D.; Schalles, R.R.; Kiracofe, G.H.; Good, D.L. Influence of winter nutrition on beef cow reproduction. J. Anim. Sci. 1977, 45, 430–437. [Google Scholar] [CrossRef]
  50. Hight, G.K. The effects of undernutrition in late pregnancy on beef cattle production. N. Z. J. Agric. Res. 1966, 9, 479–490. [Google Scholar] [CrossRef]
  51. Hitaj, C.; Suttles, S. Trends in U.S. Agriculture’s Consumption and Production of Energy: Renewable Power, Shale Energy, and Cellulosic Biomass. In Economic Information Bulletin; 2016. Available online: https://www.ers.usda.gov/webdocs/publications/74658/60128_eib159.pdf?v=0 (accessed on 1 December 2019).
  52. Prevatt, J.W.; VanSickle, J.J. United States Cattle Cycles: Perspectives on US Cattle and Calves Inventories and Prices; Food and Resource Economics Department, Florida Cooperative Extension Service, Institute of Food and Agricultural Sciences, University of Florida—Series FE 64; University of Florida: Gainesville, FL, USA, 2000; p. 10. [Google Scholar]
  53. Spiegal, S.; Estell, R.E.; Cibils, A.F.; James, D.K.; Peinetti, H.R.; Browning, D.M.; Romig, K.B.; Gonzalez, A.L.; Lyons, A.J.; Bestelmeyer, B.T. Seasonal Divergence of Landscape Use by Heritage and Conventional Cattle on Desert Rangeland. Rangel. Ecol. Manag. 2019, 72, 590–601. [Google Scholar] [CrossRef]
  54. Anderson, D.M.; Estell, R.E.; Gonzalez, A.L.; Cibils, A.F.; Torell, L.A. Criollo cattle: Heritage Genetics for Arid Landscapes. Rangelands 2015, 37, 62–67. [Google Scholar] [CrossRef] [Green Version]
Figure 1. Time series plots of beef cattle population (head) with mean annual temperature (°C), hay production (ton), and mean annual hay prices ($/ton) in NM between 1973 and 2017.
Sustainability 11 06840 g001
Figure 2. Time series plots of calf population that weigh 500 lb. and under relative to beef cattle numbers (%) with mean annual temperature °C, crude oil production (barrels), and cattle feed sold (tons) in NM between 1976 and 2017.
Sustainability 11 06840 g002
Figure 3. Time series plots of mean annual beef cattle prices ($/45.4 kg) with mean annual temperature (°C), mean annual precipitation (mm), crude oil production (barrel), mean annual hay prices ($ / Ton), and range conditions in NM between 1973 and 2010.
Sustainability 11 06840 g003
Figure 4. Time series plots of calf prices ($/45.4 kg) with mean annual temperature (°C), crude oil production (barrel), hay production (ton) in NM between 1973 and 2010.
Sustainability 11 06840 g004
Table 1. Summary of simple regression analyses of variables used to predict beef cattle population (heads) in New Mexico (NM) between 1973 and 2017 using a generalized autoregressive conditional heteroscedasticity model (GARCH) or an exponential GARCH (EGARCH).
Independent VariablesModelInterceptEstimate (β)R2
Mean Annual Temperature (°C) *EGARCH840,045−242100.77
Mean Annual Precipitation (mm)EGARCH560,36157.1596
Crude Oil Production (barrels)EGARCH689,675−0.000038
Mean Annual Crude Oil Prices ($ per barrel)EGARCH676,828310.1408
Hay Production (tons) *EGARCH559,4460.11030.80
Mean Annual Hay Prices ($ per ton) *GARCH519,494434.44350.80
Mean Annual Range Conditions (%)EGARCH552,698−10331
Cattle Feed Sold (tons)EGARCH527,4420.1453
* Model is significant at P ≤ 0.05.
Table 2. Summary of simple regression analyses of variables used to predict calf population (the number of calves that weigh under 500 lb. divided by the number of beef cattle in %) in NM between 1973 and 2017 using a generalized autoregressive conditional heteroscedasticity model (GARCH) or an exponential GARCH (EGARCH).
Independent VariablesModelInterceptEstimate (β)R2
Mean Annual Temperature (°C) *EGARCH123.4081−5.89630.70
Mean Annual Precipitation (mm)EGARCH61.53490.007567
Crude Oil Production (barrels) *EGARCH65.2082−1.475 × 10−80.70
Mean Annual Crude Oil Prices ($ per barrel)EGARCH66.3727−0.0935
Hay Production (tons)EGARCH65.6726−1.612 × 10⁻⁶
Mean Annual Hay Prices ($ per ton)EGARCH77.3626−0.0540
Mean Annual Range Conditions (%)EGARCH57.38906.7819
Cattle Feed Sold (tons) *EGARCH75.9448−1.824 × 10−60.72
* Model is significant at P ≤ 0.05.
Table 3. Summary of simple regression analyses of variables used to predict mean annual beef cattle prices ($/45.4 kg) in NM between 1973 and 2010 using a generalized autoregressive conditional heteroscedasticity model (GARCH) or an exponential GARCH (EGARCH).
Independent VariablesModelInterceptEstimate (β)R2
Mean Annual Temperature (°C) *EGARCH384.4344−13.80080.79
Mean Annual Precipitation (mm) *EGARCH201.28900.05920.74
Crude Oil Production (barrels) *GARCH−20.10171.7844 × 10−60.62
Mean Annual Crude Oil Prices ($ per barrel)EGARCH220.35740.1547
Hay Production (tons)EGARCH213.54657.8635 × 10−7
Mean Annual Hay Prices ($ per ton) *EGARCH−65.93330.93470.53
Mean Annual Range Conditions (%) *EGARCH206.176628.25040.78
Cattle Feed Sold (tons)GARCH159.7860−0.000033
* Model is significant at P ≤ 0.05.
Table 4. Summary of simple regression analyses for variables predicting mean annual calf prices ($/45.4) in NM between 1973 and 2010 using a generalized autoregressive conditional heteroscedasticity model (GARCH) or an exponential GARCH (EGARCH).
Independent VariablesModelInterceptEstimate (β)R2
Mean Annual Temperature (°C) *EGARCH174.1819−6.14840.40
Mean Annual Precipitation (mm)EGARCH99.39020.007385
Crude Oil Production (barrels) *EGARCH8.32337.8005 × 10−70.31
Mean Annual Crude Oil Prices ($ per barrel)EGARCH61.5146−0.0705
Hay Production (tons) *EGARCH116.9502−0.0000390.33
Mean Annual Hay Prices ($ per tons)EGARCH83.57430.0804
Mean Annual Range Conditions (%)EGARCH89.591112.2472
Cattle Feed Sold (tons)GARCH70.2113−0.000033
* Model is significant at P ≤ 0.05.
Table 5. Summary of the relationship between the predictors used in this study and beef cattle production in NM 1.
PredictorBeef Cattle Population
(Head)
Calf Population
(%)
Beef Cattle Prices
($/45.4 kg)
Calf Prices
($/45.4 kg)
Mean Annual Temperature (°C)(−) 0.77 *(−) 0.70 *(−) 0.79 *(−) 0.40 *
Mean Annual Precipitation (mm) (+) 0.74 *
Crude Oil Production (barrel) (−) 0.70 *(+) 0.62 *(+) 0.31 *
Mean Annual Crude Oil Prices ($/barrel)
Hay Production (ton)(+) 0.80 * (−) 0.03 *
Mean Annual Hay Prices ($/ton)(+) 0.80 *
Mean Annual Range Conditions (%) (+) 0.53 *
Cattle Feed Sold (ton) (−) 0.72 *(+) 0.78 *
1 Relationship either positive relationship (+) or negative relationship (−); * Represent R2 when the predictor is significant at P ≤ 0.05.

