Article

Field Measurement and Research on Environmental Vibration due to Subway Systems: A Case Study in Eastern China

1
School of Geology Engineering and Geomatics, Chang’an University, Xian 710054, China
2
Petroleum Engineering Department, University of North Dakota, Grand Forks, ND 58202-6116, USA
3
Research Institute of Structural Engineering and Disaster Reduction, Tongji University, Shanghai 200092, China
*
Author to whom correspondence should be addressed.
Sustainability 2019, 11(23), 6835; https://doi.org/10.3390/su11236835
Submission received: 6 November 2019 / Revised: 20 November 2019 / Accepted: 29 November 2019 / Published: 2 December 2019
(This article belongs to the Section Sustainable Engineering and Science)

Abstract

:
With the rapid development of subway systems, the negative environmental impacts of vibration induced by subways has gradually become a research hotspot. For the purpose of developing predictive models of vibration and designing effective vibration mitigation systems, continuous field dynamic measurements were conducted simultaneously in a subway tunnel, ground, and building in eastern China, the most prosperous region in China. The characteristics of vibration transmission and attenuation induced by subway were analyzed by statistical analysis of large amounts of measurement data. The results showed that most prominent and visible attenuation of vibration is from the track to the ballast bed in the tunnel, where the ground-borne vibration would quickly decrease exponentially with distance. The results also showed that the measured attenuation value of indoor vibration was approximate 0.76 dB on average between each floor. Moreover, the decay ratio of the vibration increased with the increase in the frequency range. Based on these findings, construction gauge of 20–25 m outside of the tunnel is recommended. In addition, reducing the vibration source excitation intensity is the most effective vibration isolation method, especially by track structural transformation.

1. Introduction

In recent years, human engineering activity has become one of the main challenges on environment sustainable development [1]. Due to the construction and operation of subways, the problem of ground-borne vibration induced by underground railways has been reported frequently in China [2,3]. Although the vibration induced by subway could not usually inflict direct damage on ground structures along the subway line, the vibrations and re-radiated noise inside buildings may cause disturbance to the nearby residents, especially given that most subway lines are located in large cities with a dense population [4,5,6,7].
Vibrations induced by subways are generated primarily at the wheel–rail interface and then propagate through the tunnel and surrounding soil into the nearby ground environment as ‘ground-borne vibrations’. Finally, these ground-borne vibrations reach nearby buildings and cause the walls and floors to shake, which may also result in ground-borne noise (‘re-radiated noise’) causing annoyance to people [8].
The subway vibration effect on the surrounding environment is not only related to the tunnel structure, stratigraphic characteristics, and building structure, but also to the track and train [9]. Therefore, unlike vibration induced by other sources, such as airplanes, ground traffic or industrial machinery, vibration induced by subway has certain distinctive characteristics, such as low frequency, persistence, and longevity. Thus, more theoretic analysis and field measurements of the vibration induced by subway are also needed to determine causes, characteristics, and its effects.
Among the various research methods, the numerical simulation is widely used to predict the environmental influence of vibration induced by subway [10]. Unfortunately, all the simplifying assumptions used in numerical models of ground vibration induced by subway could result in maximum errors of ±10 dB in predictions [11]. Although field measurement involves a lot of data collection and analysis, it is the most direct and reliable method in studying subway vibration propagation. Field measurement is also the only way of verifying the accuracy of other methods, especially when it comes to locally applicable ones [12,13,14].
Although there have been many studies on subway vibration worldwide [8], further field measurement studies, specific to vehicle-track excitation source and vibration propagation, are still required. In this study, in order to ascertain the characteristics of vibration transmission and attenuation induced by subway, and to predict the environmental influence of subway train-induced vibration on ground and inside over-track buildings, the continuous dynamic measurement was conducted simultaneously in the subway tunnel, ground, and building above the tested subway tunnel. Moreover, by comparing the vibrational data of three track structures before and after the transformation, the damping effect of three track structures was experimentally studied. We also present the findings from the exploratory analysis of the developed predictive models of vibration for designing effective vibration mitigation systems. This research can provide a theoretical basis and technical support for the forecasting, evaluation, and control of subway train-induced vibration.
This paper mainly consists of five parts. The first introduces the research background and significance of subway train-induced vibration. The second chapter introduces the field measurement information, such as study site, measurement devices, measurement method, etc. In the third chapter, the test data are analyzed in order to ascertain the characteristics of vibration transmission. The fourth chapter discusses the characteristic of the vibration attenuation and compares the effect of different vibration isolation designs. The last chapter summarizes the main work of this research and forecasts the next step of research work.

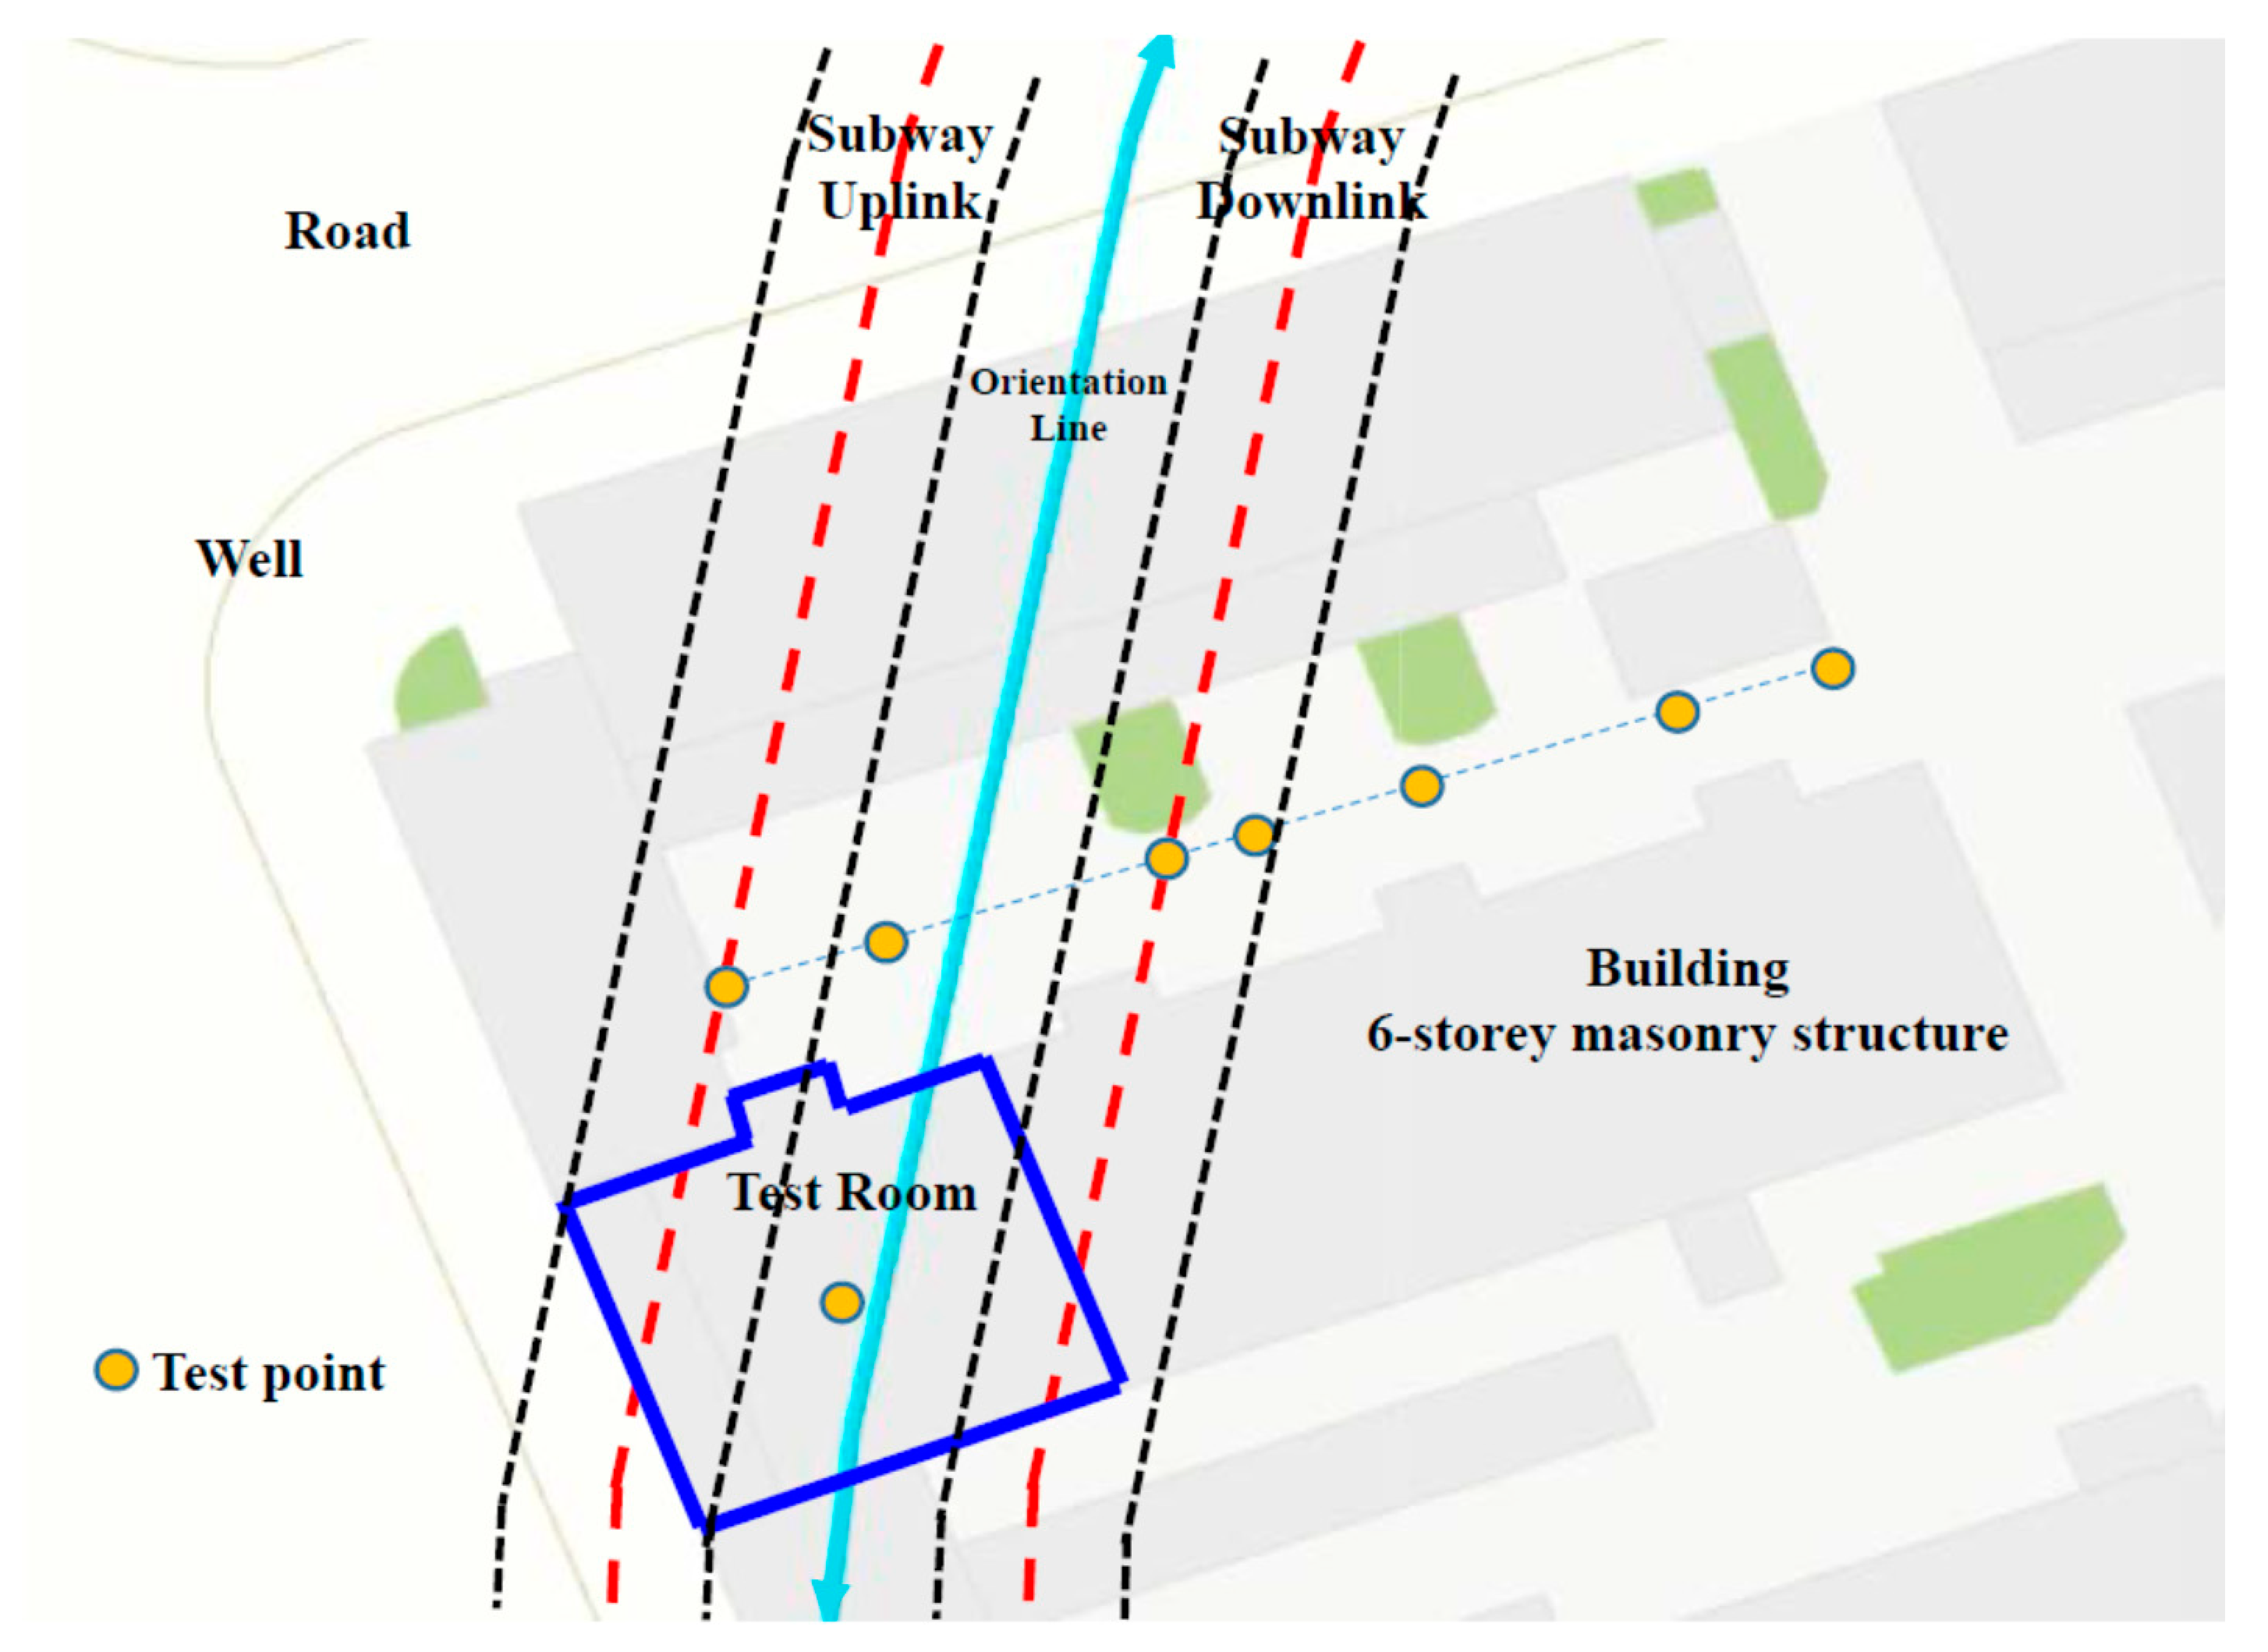
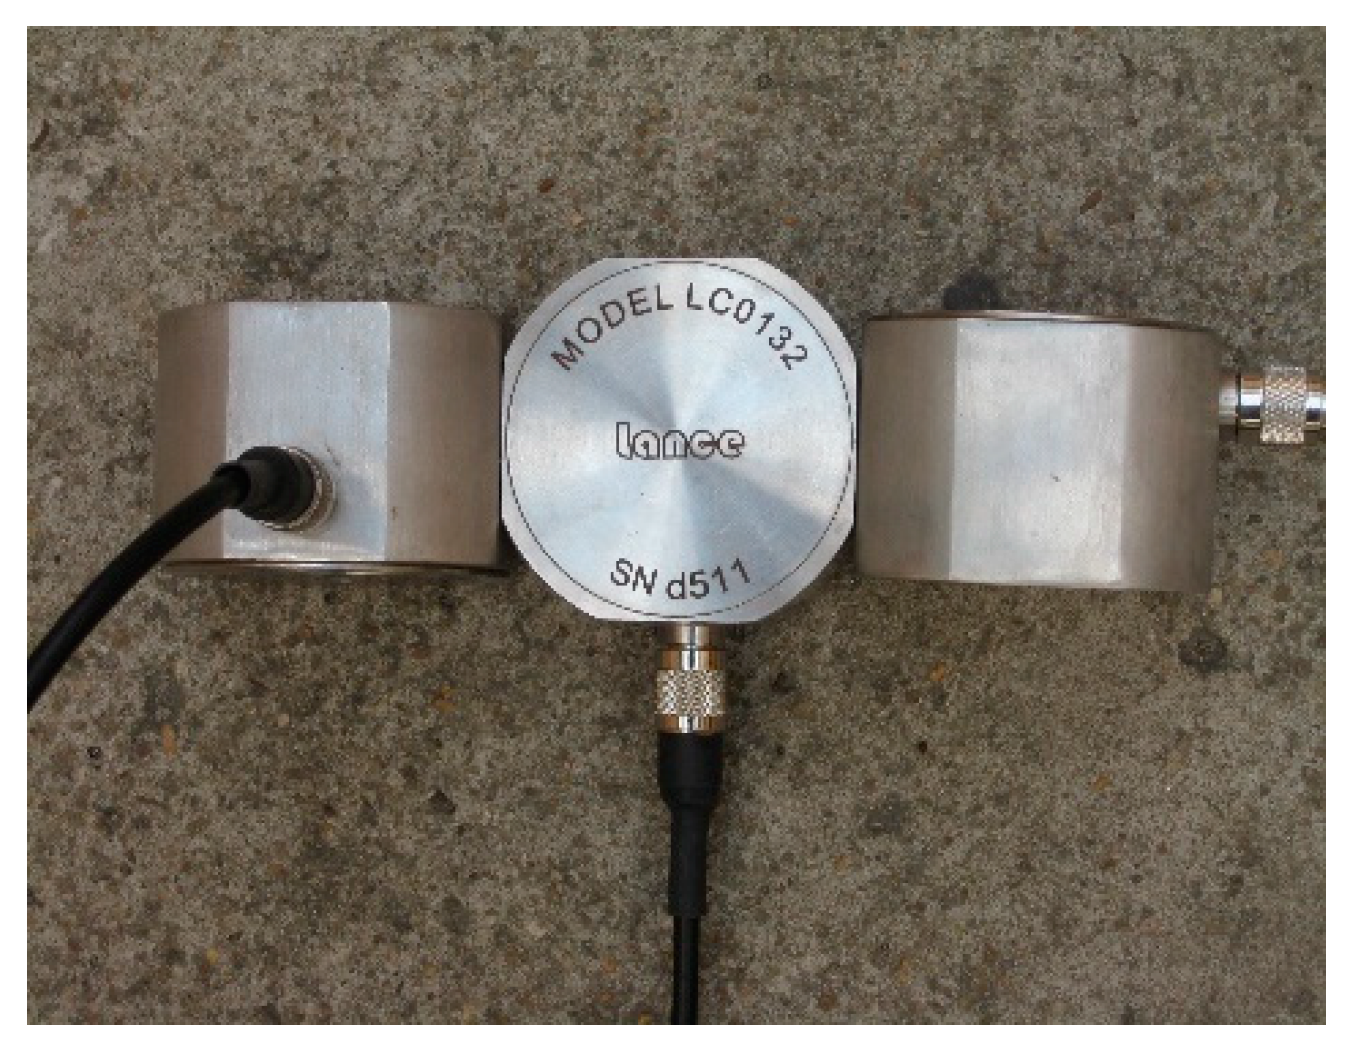
2. Field Measurement Information

As the China Financial Center and transport hub for East Asia, the coastal areas in east China was one of the first region to open the subway systems in China with many operating subway lines and many more in planning and construction. This makes this area one of the most suitable sites for studying subway environmental influences, and therefore field measurements were conducted in an urban area in this region. The subway line is buried at about 12 m depth and the building under study is a six-story masonry dwelling above the tested line. The subway is concrete construction. The soil around the subway tunnel is mainly saturated soft soil. The sketch map of the measurement site is shown in Figure 1.
In order to investigate the environmental influences caused by subway vibration, continuous dynamic measurement was conducted simultaneously in the subway tunnel, ground and building above the tested subway tunnel. The measurement last throughout the metro operation. Figure 1 shows the location of the ground test points. The high-speed multi-channel signal acquisition processing system (PXI1042, made by NI Inc.) was applied in this measurement, with a range and sensitivity of the accelerometer all meeting the requirements. At each test point, accelerometers were mainly placed on vertical, longitudinal, and transversal directions across the tunnel. Here, the transversal direction means direction perpendicular to the steel rails in the horizontal plane, while the longitudinal direction means the direction along the rails in the horizontal plane. All measurements were performed using IC accelerometers LC0132T type with sensitivity of 50 V/g.
In the tunnel, the accelerometers were positioned on the track, ballast bed and tunnel inner wall, as shown in Figure 2. In this measurement, the accelerometers on the track were arranged in a vertical direction and the accelerometers on the ballast bed and tunnel inner wall were arranged in a vertical direction and transversal direction. The sampling frequency of all test points in the tunnel was 3000 Hz.
On the ground, a line of surface vibration sensors was set up horizontally at about 0, 4, 8, 12, 14, 19, 26 and 31 m away from the centerline of the subway tunnel at different vertical distances to the tunnel axis, as shown in Figure 1. Apart from researchers of this study, the measurement area was evacuated, in order to find the attenuation characteristics more clearly and to avoid the interference of other human factors. At each test point, accelerometers were arranged in three directions and the sampling frequency of all test points on the ground was 1000 Hz (Figure 3).
In the six-story building above the tested subway tunnel, the three-direction accelerometers were located almost directly above the test line, at the center of the rooms on selected floors. The sampling frequency of all test points in the tested rooms was 1000 Hz.
The measured process is accord with the requirements of correlative specifications, such as Federal Transit Administration (FTA) criteria [15]. The measured data were then processed to obtain the frequency spectra in 1/3 octave frequency for individual train pass-by events based on fast Fourier transforms (FFT) of time signals. Because vertical vibrations were dominant in the over-track buildings [1,15], this paper mainly analyzes the vertical vibration acceleration.

3. Results

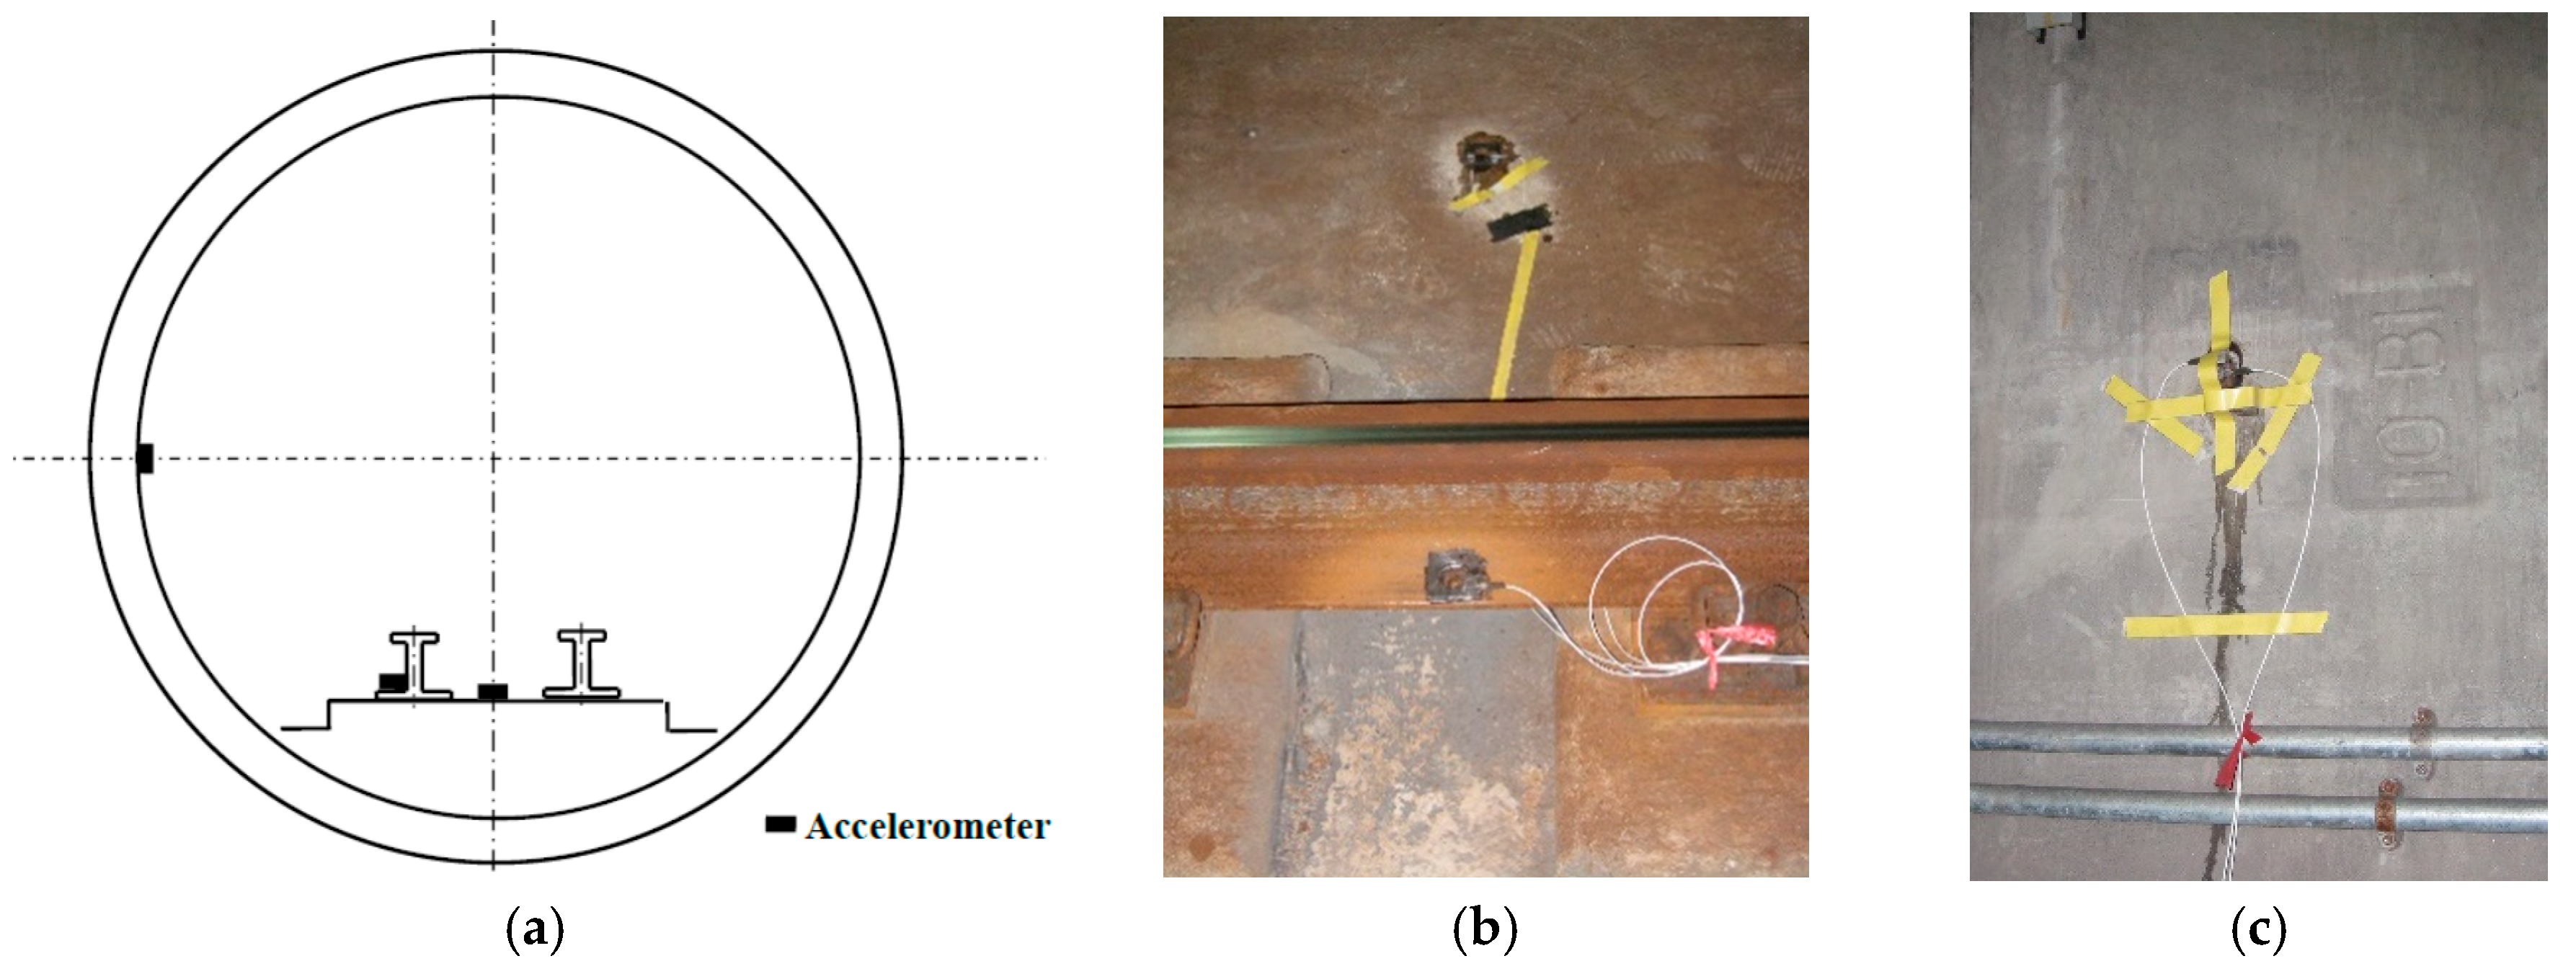
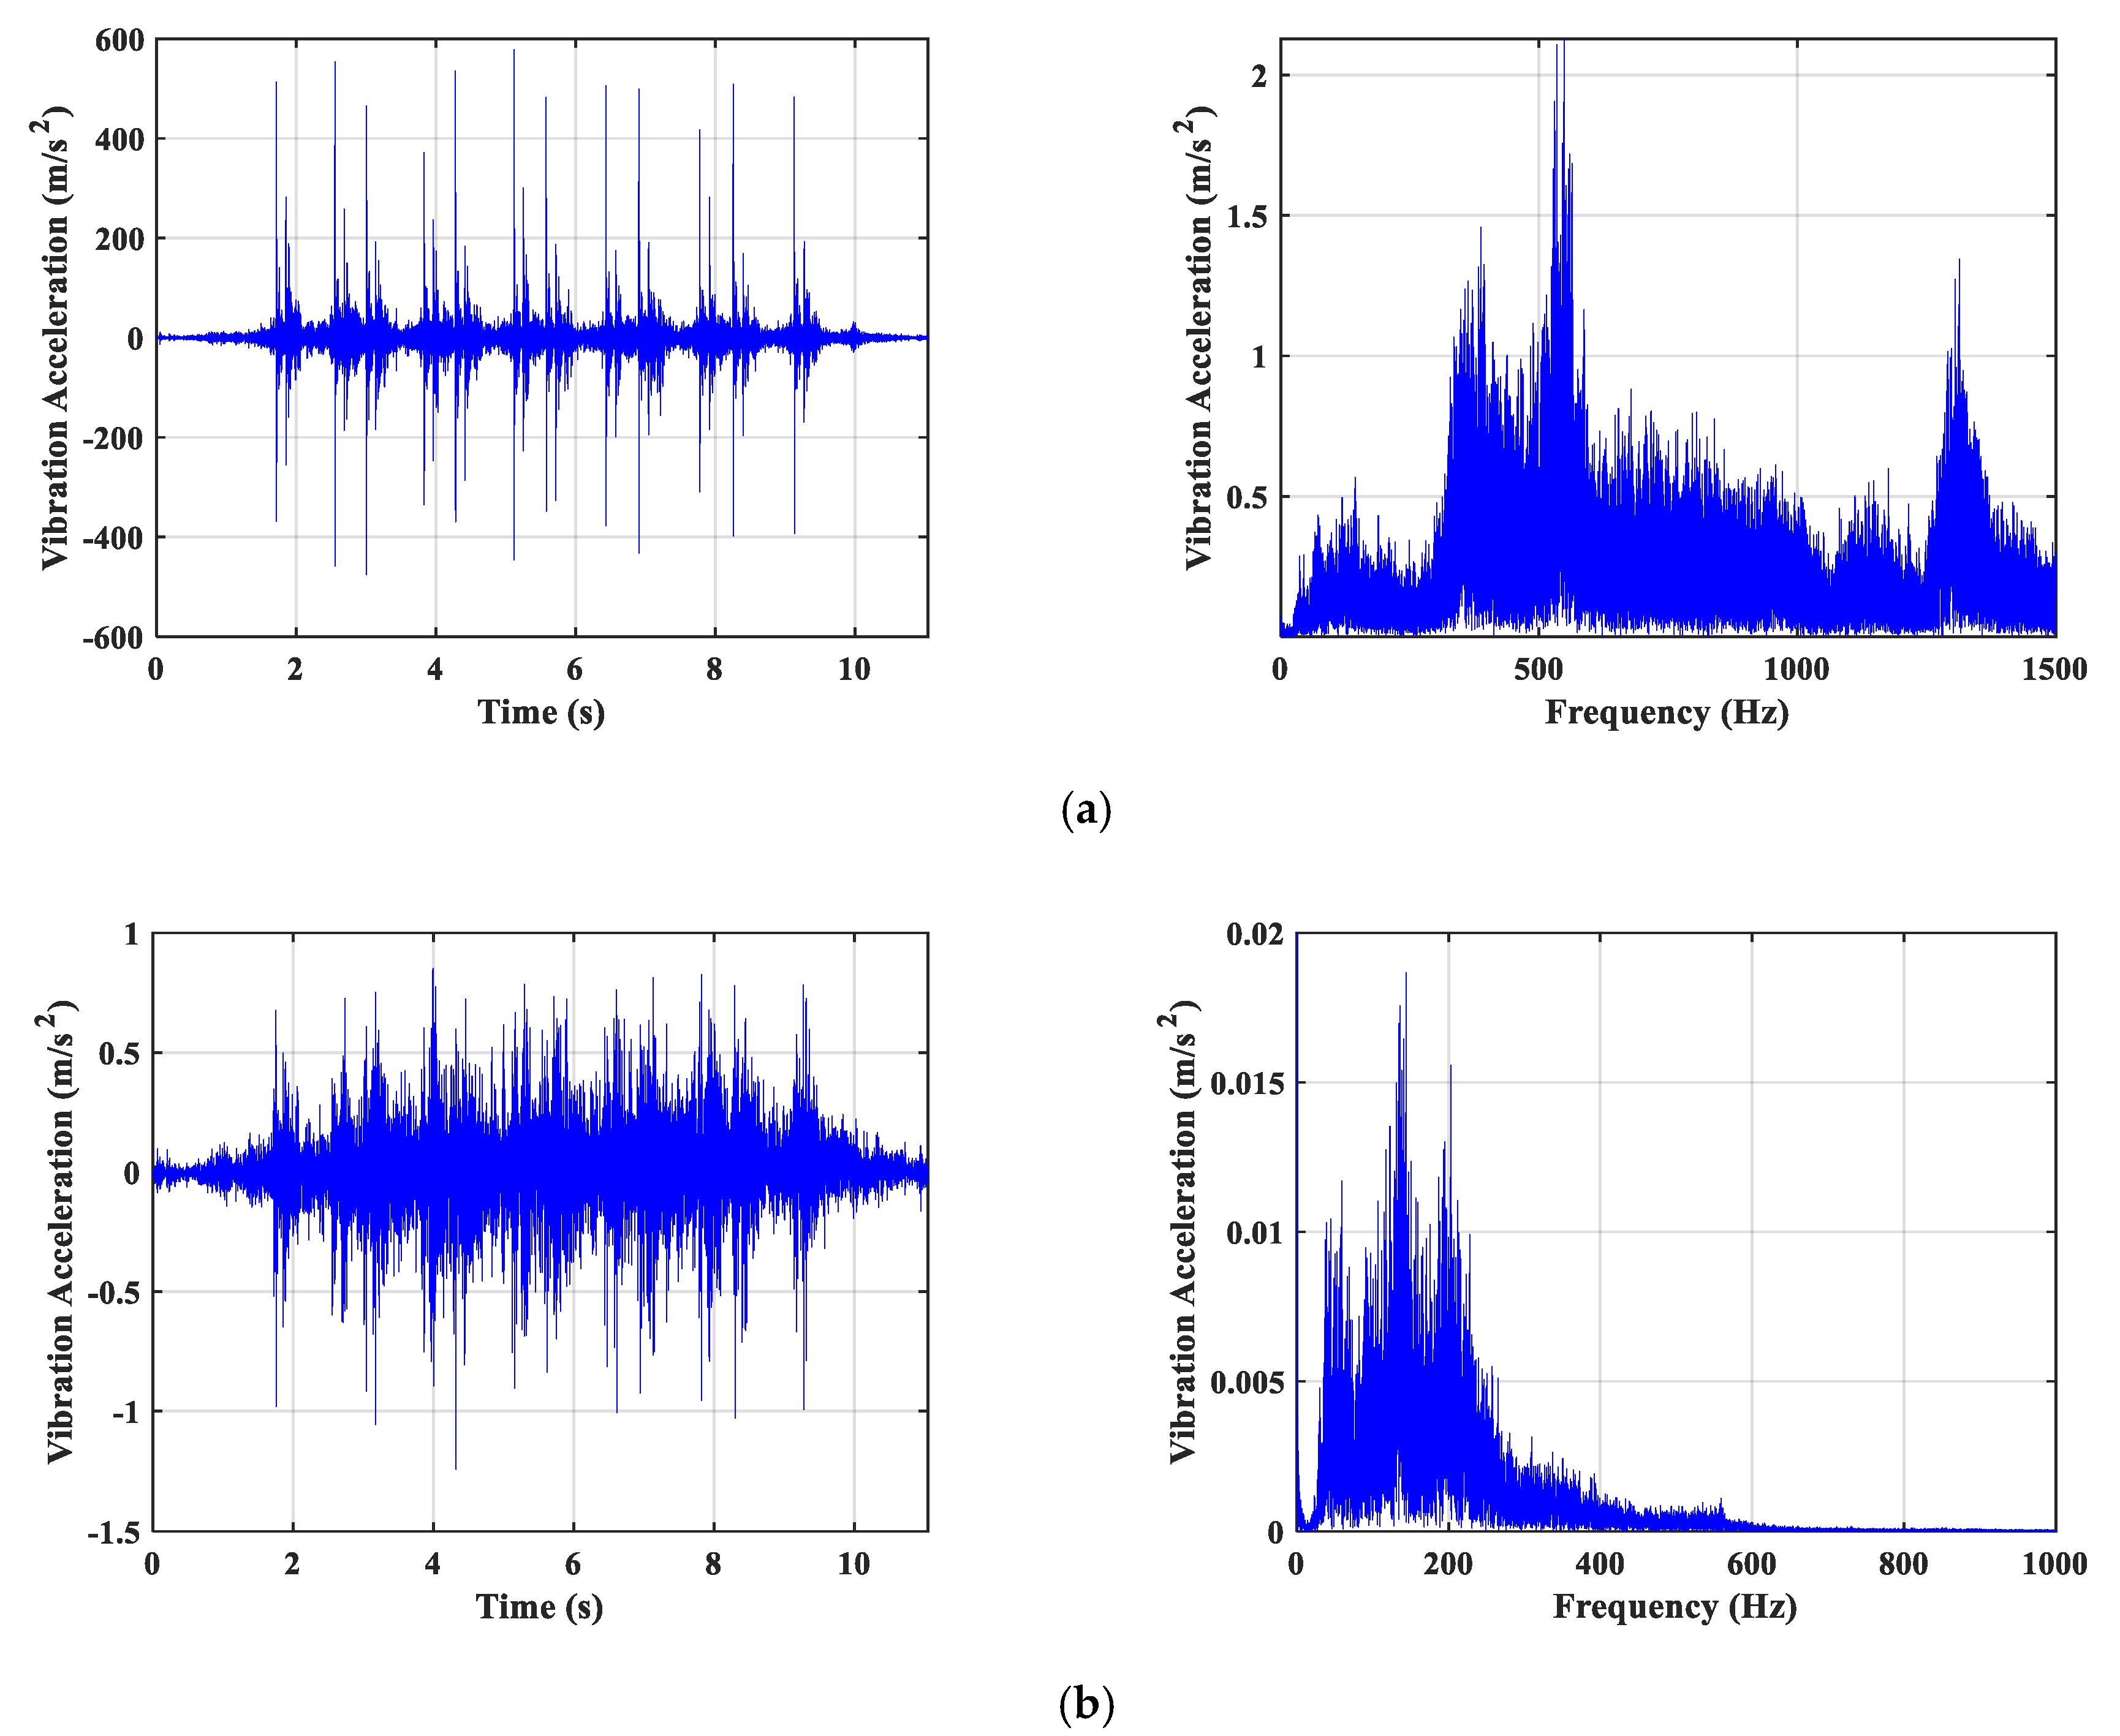
3.1. Vibration Response in the Subway Tunnel

The dynamic behavior of each measurement point, represented by the time history curve of vibration acceleration period, was obtained using the results of the dynamic tests on accelerometers measurements. Exemplary acceleration waveforms in the vertical “z” direction are visualized in Figure 4. As Figure 4 shows, the vibration characteristics was obviously different in different locations, whether time-history or frequency-domain.
Peak ground acceleration (PGA) amplification factor is widely used to evaluate the acceleration. Descriptive statistic was used for a better understanding of the extreme values of vertical vibration acceleration amplitude (Peak Ground Acceleration, PGA) on each measurement point in the tunnel (Figure 5). As shown in Figure 5, the extreme values of vibration acceleration amplitude were significantly reduced with distance from the vibration source, especially when vibration wave spread between the track and ballast bed. In other words, the vibration on track was much more than the vibrations on the ballast bed and tunnel wall.
Through signal preprocessing, we could change the measured vibration acceleration time history to the frequency vibration levels on 1/3 octave band, as shown in Figure 6. This figure shows how 1/3 octave spectra of typical vertical and transversal vibrations in the tunnel change with distance from the vibration source. It is observed that there is a substantial reduction of vibration level from the track to the ballast bed and tunnel inner wall, consistent with the statistics of PGA in Figure 5.
More importantly, the distribution of vibration energy varies greatly with frequency range. The band of vibration energy on track is concentrated between 300–600 Hz, whereas, on ballast bed and tunnel wall it ranges from 30–300 Hz. In the other words, the higher frequency, the more reduction.

3.2. Vibration Response on the Ground

To study the attenuation of vibration of the subway on the ground with the increasing distance from the origin of vibration, the monitored data were averaged and the statistics of PGA on the ground is given in Figure 7. It can be seen from Figure 7 that the attenuation of the subway vibration exhibits a certain trend with the increasing distance, conforming to an exponential function with the coefficient of determination (R2 = 0.9539).
Based on the results of the statistical analysis of a large amount of measurement data, 1/3 octave spectra of average vertical vibration acceleration is given in Figure 8. This figure shows that the band of vibration energy on the ground is concentrated between 10–250 Hz with a peak within 30–60 Hz.

3.3. Vibration Response in the Building

Based on massive measurement acceleration data on different floors of the six-story building (Figure 1), we obtained the dynamic behavior of each measurement room. Exemplary acceleration data in the vertical “z” direction from some test rooms are visualized in Figure 9.
The Figure 9 shows the dominant frequency of indoor vibration ranges from 30 Hz to 300 Hz and its peak ranges within 40–60 Hz. It is observed that there is a substantial reduction of vibration level from the track to the room, and the higher frequency, the more reduction.

4. Discussion

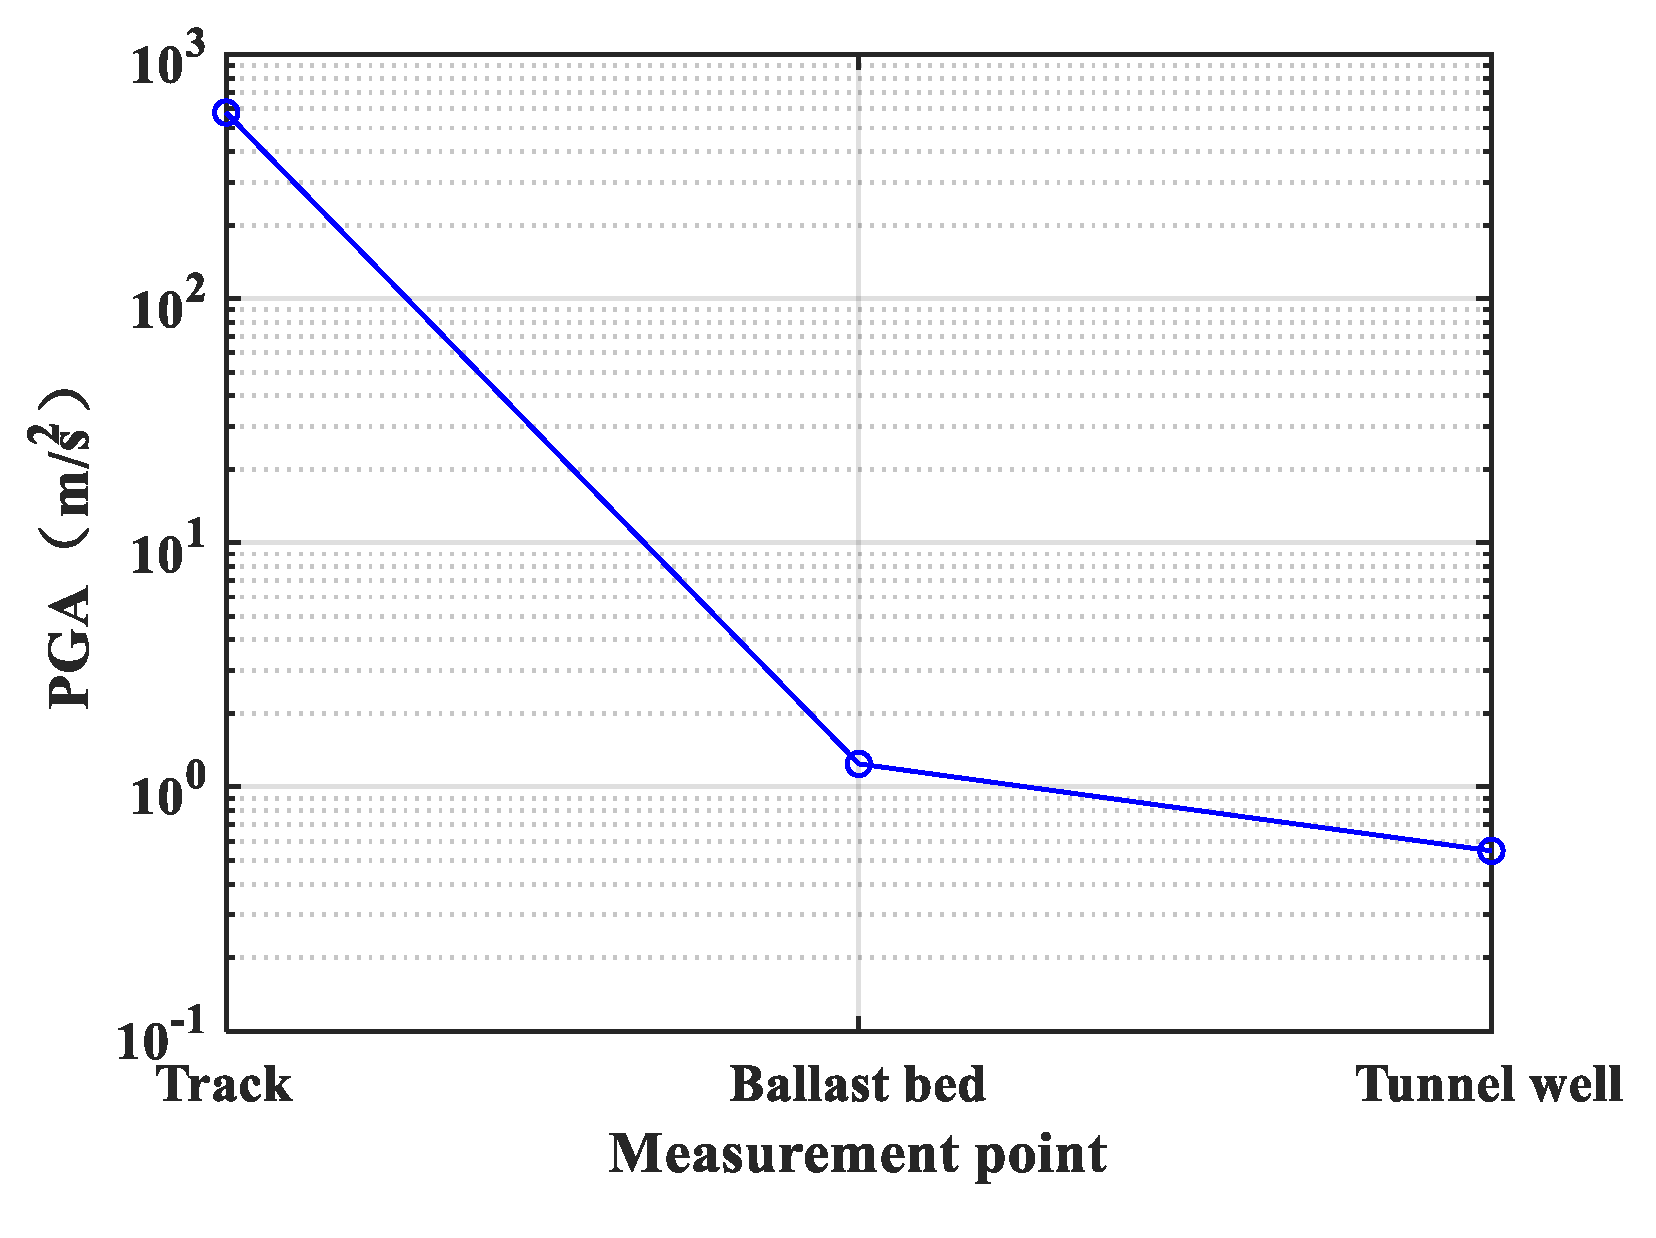
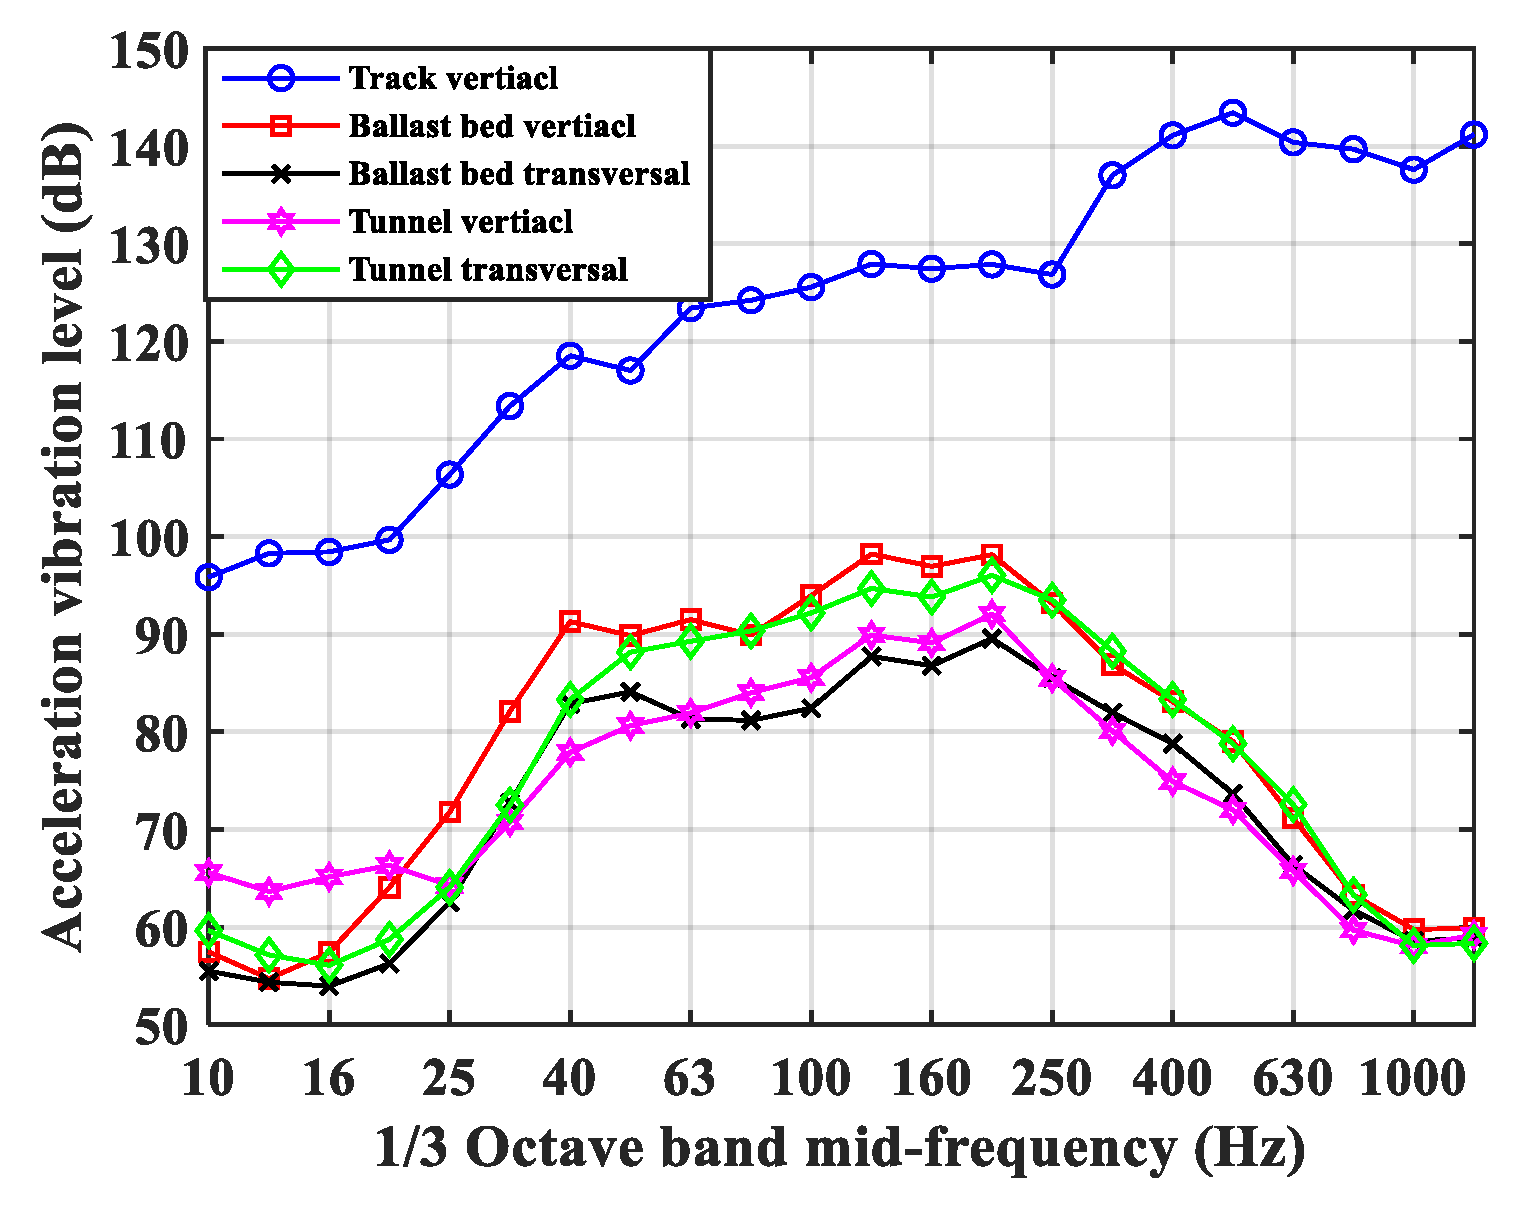
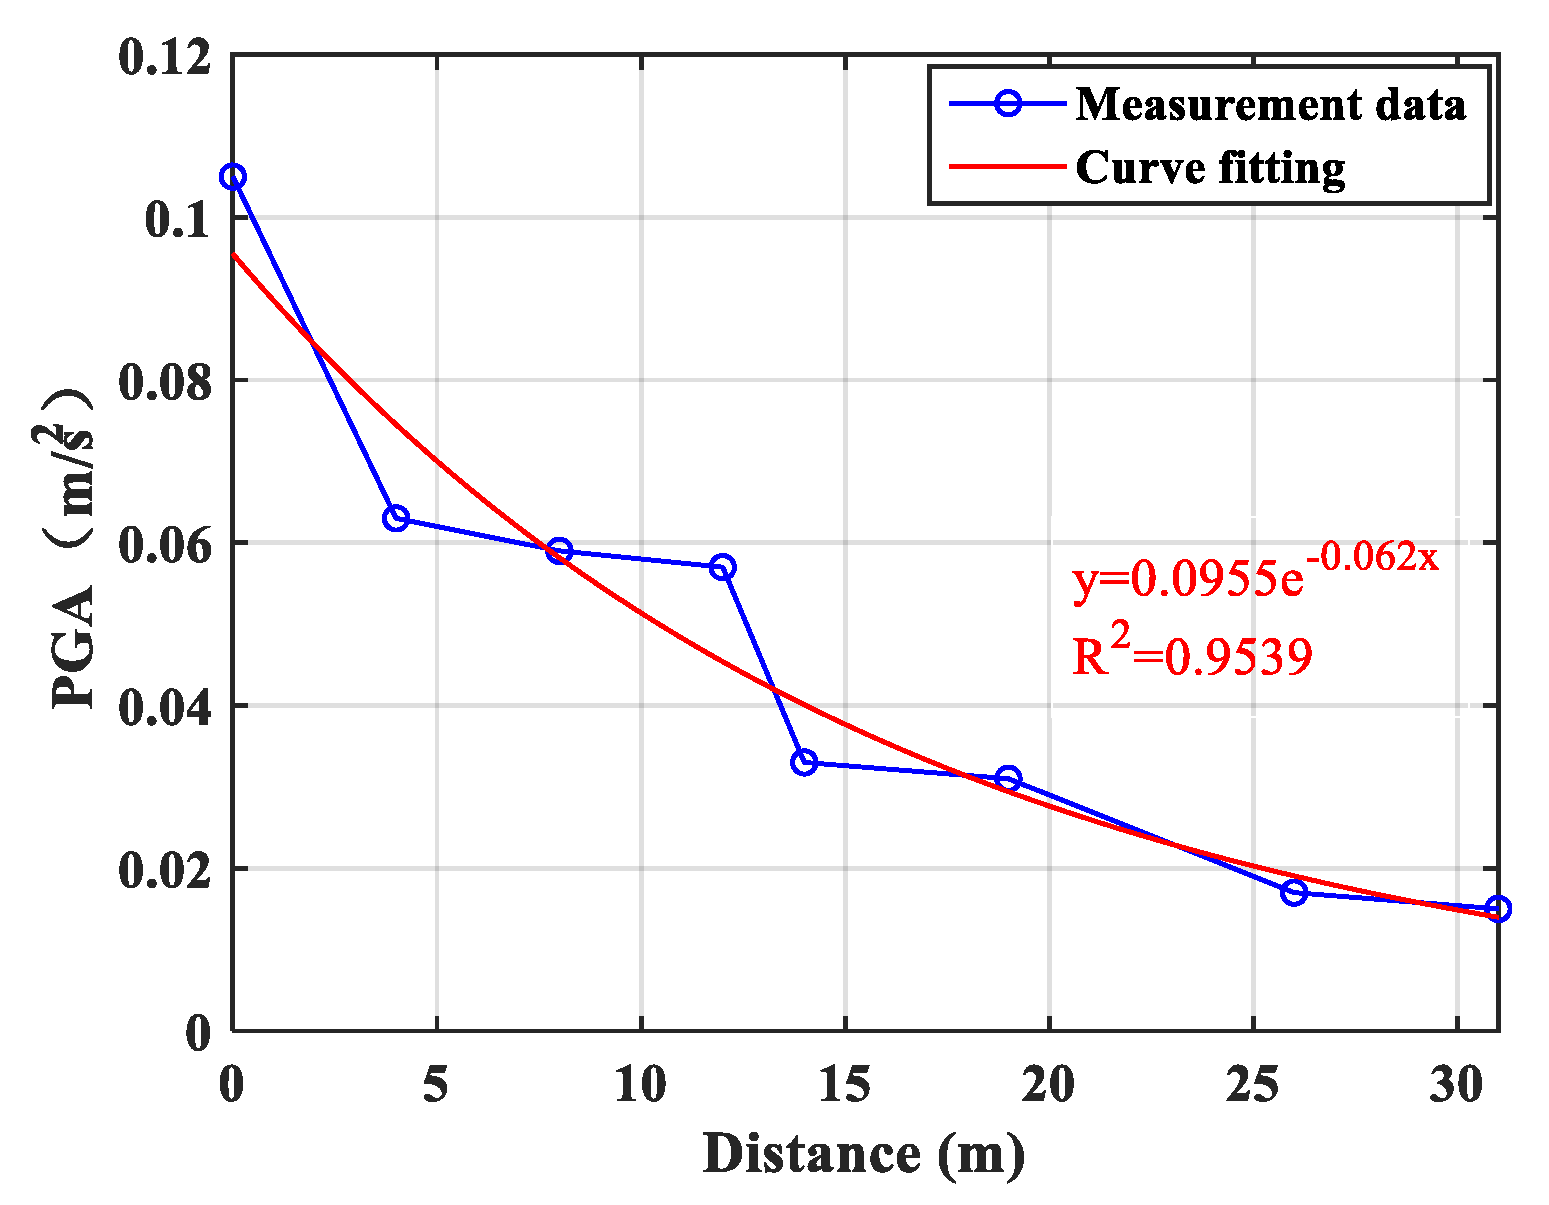
4.1. Characteristic of the Vibration Attenuation Transmitted from Subway

The main goal of current research on subway vibration is to develop predictive models of vibration and to design effective vibration mitigation measures. However, it is necessary to first understand the characteristic of vibration attenuation transmitted from subway. Generally speaking, the system for propagation and attenuation of subway vibration is composed of three autonomous models: (i) vibration source (train-track interaction); (ii) vibration propagation (tunnel-ground); (iii) vibration reception (building) [16,17,18]. As mentioned before, the vibrations always decrease with distance from the vibration source.
The first thing to consider here is the vibration source (train-track interaction). The change in vertical acceleration vibration levels in the 1/3 octave band (Figure 6) at 50, 200 and 800 Hz for one train pass-by event is shown in Figure 10. At different frequencies, there was an average attenuation of about 6 dB from the ballast bed to tunnel inner wall. However, the attenuations from track to ballast bed were about 30 dB and 77 dB at 200 and 800 Hz respectively, about 5 and 21 times that from ballast bed to tunnel inner wall, consistent with the statistics of PGA in Figure 5 (the PGA in the track was about 1000 times that in the ballast bed). In other words, it is observed that there is a substantial reduction of vibration level from the track to the ballast bed, thus reducing vibration source excitation intensity is the most effective vibration isolation method. Secondly, under the range of 200 Hz, the attenuation of vibration from the track to the ballast bed is about less than 40 dB, and this attenuation becomes steadily more significant with advancing frequency above the range of 200 Hz (for example, 77 dB at 800 Hz vs. 30 dB at 200 Hz).
As compared to the vibration source, the vibration attenuation in vibration propagation system (tunnel-ground) changes with the increasing distance in accordance with some certain mathematical law. Based on the statistical analysis of large amounts of monitored data (Figure 7), the relationship between the PGA of ground-borne vibration and the distance vertical to the subway tunnel axis is: PGA = 0.0955e−0.062x, where x is the distance away from the axis of the subway tunnel. Using this exponential function, the relation between distance of influence and amplitude of dynamic response can be estimated, as well as the effect that vibration has on residents. The damping of soil makes the dynamic loading attenuating rapidly on the ground with the increasing distance, but this exponential fitting curve smooths as the distance x increases. The influence distance on the ground is about 20–25 m obtained from the above fitting formula, which can provide a theoretical reference to the design and construction of the building near the subway tunnel. Another noticeable feature from the viewpoint of the frequency domain is that higher frequencies are generally attenuated rapidly with distance along the transmission path through the soil (Figure 8), similar to that in the tunnel (Figure 6 and Figure 10).
When vibrations have reached the surrounding environment, vertical vibrations are dominant [15]. Therefore, the Chinese standard of ‘GB 10071-88’ uses the maximum vibration level of Z direction (VLzmax) as an evaluation index for environmental impact assessment [19]. Figure 11 shows the statistics of the maximum vibration level of Z direction (VLzmax) on different floors of the six-story building (Figure 1), before the transformation of track structure (DTⅢ-2 fastener).
According to the FTA [15], vibration generally reduces in level as it propagates through the building construction with a usually 1 to 2 dB attenuation per floor, but the measured attenuation value of indoor vibration was approximate 0.76 dB on average between each floor from first floor to 3rd floor (Figure 11). The measured decline is slightly less than expected, which may be related to the different building structures. Secondly, to compare the outdoor and indoor (first floor) vibration, the disparity of VLzmax is mostly not greater than 2 dB.

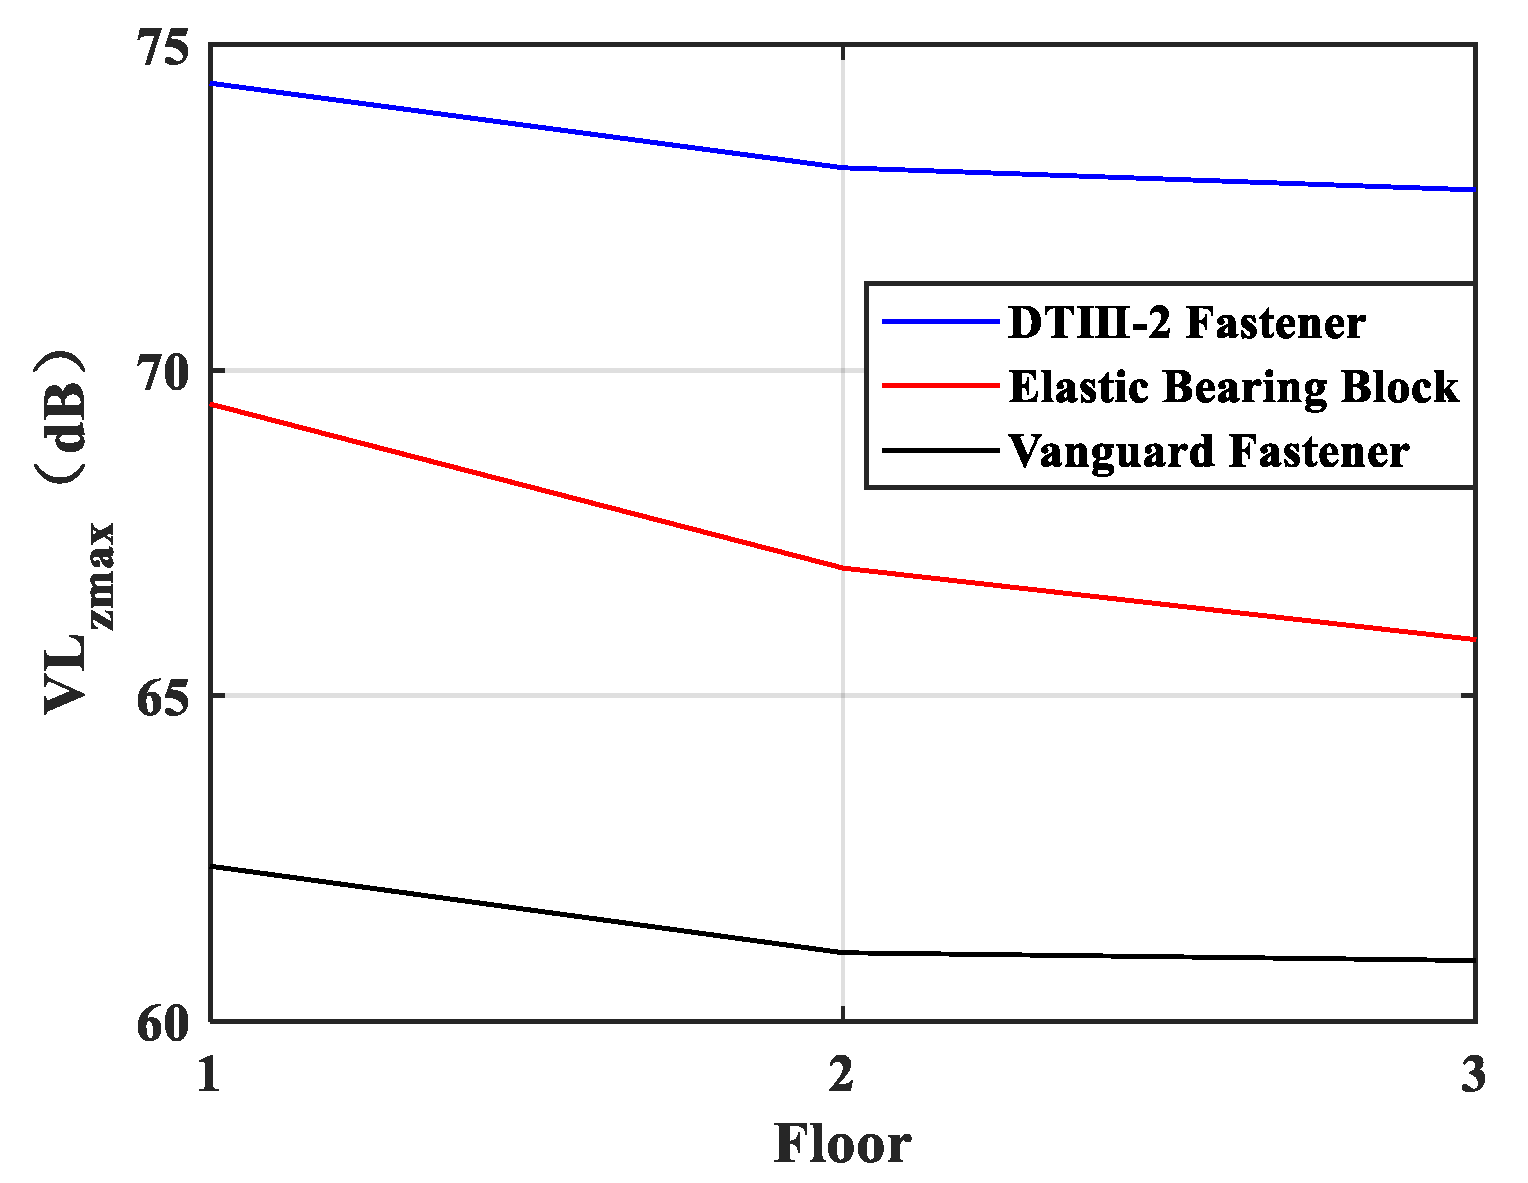
4.2. Vibration Isolation Design

Subway vibration is a kind of wave, which could transmit from tunnel structure and surrounding strata to building construction. Therefore, the vibration insulation system is generally divided into three parts [9,20]: changing wheel-rail contact characteristics [18,21,22], cutting off or reducing vibration transmission [23] and passive isolation measure for objects [24,25,26,27,28,29]. As mentioned above, it is observed that the most prominent and visible attenuation of vibration is from the track to the ballast bed (Figure 5 and Figure 7), so the reducing vibration source excitation intensity is the most effective vibration isolation method.
By comparing the vibrational data of three track structures (i.e., DTⅢ-2 fastener, elastic bearing block and vanguard fastener) before and after the transformation, the damping effect of three track structures was experimentally studied. The typical PGA on first floor of three track structures is given in Figure 12. As shown in Figure 12, the reduction of extreme values of vibration acceleration amplitude is observed significantly with track structural transformation. The statistical averages of the maximum vibration level of Z direction (VLzmax) on different floors of the six-story building (Figure 1), in accordance with the standard of ‘GB 10071-88’, is shown in Figure 13, which indicates that the vibration reduction effect of track structural transformation is very obvious due to the difference of stiffness and damping parameters among the three track structures. Moreover, track structural transformation has obvious advantage over others used usually. For example, by analyzing measured data in this six-story building at different subway speed (80, 60 and 40 km/h), it was shown that subway speed limits could only reduce vibration by no more than about 2–3 dB in each reduction of 20 km/h.
By comparing the vibrational data of three track structures (i.e., DTⅢ-2 fastener, elastic bearing block and vanguard fastener) before and after the transformation, the damping effect of three track structures was experimentally studied. The typical PGA on the first floor of three track structures is given in Figure 12. As shown in Figure 12, the reduction of extreme values of vibration acceleration amplitude is observed significantly with track structural transformation. The statistical averages of the maximum vibration level of Z direction (VLzmax) on different floors of the six-story building (Figure 1), in accordance with the standard of ‘GB 10071-88’, is shown in Figure 13, which indicates that the vibration reduction effect of track structural transformation is very obvious due to the difference of stiffness and damping parameters among the three track structures. Moreover, track structural transformation has obvious advantage over others used usually. For example, by analyzing measured data in this six-story building at different subway speeds (80, 60 and 40 km/h), it was shown that subway speed limits could only reduce vibration no more than about 2–3 dB in each reduction of 20 km/h.
As this research shown, although field measurement involves a lot of data collection and analysis, it is the most direct and reliable method in studying subway vibration propagation. Moreover, field measurement may be an original method of using elastic waves of acoustic emission to assess the technical condition of subway system, such as rail wear and structural damage [30,31].

5. Conclusions

(a)
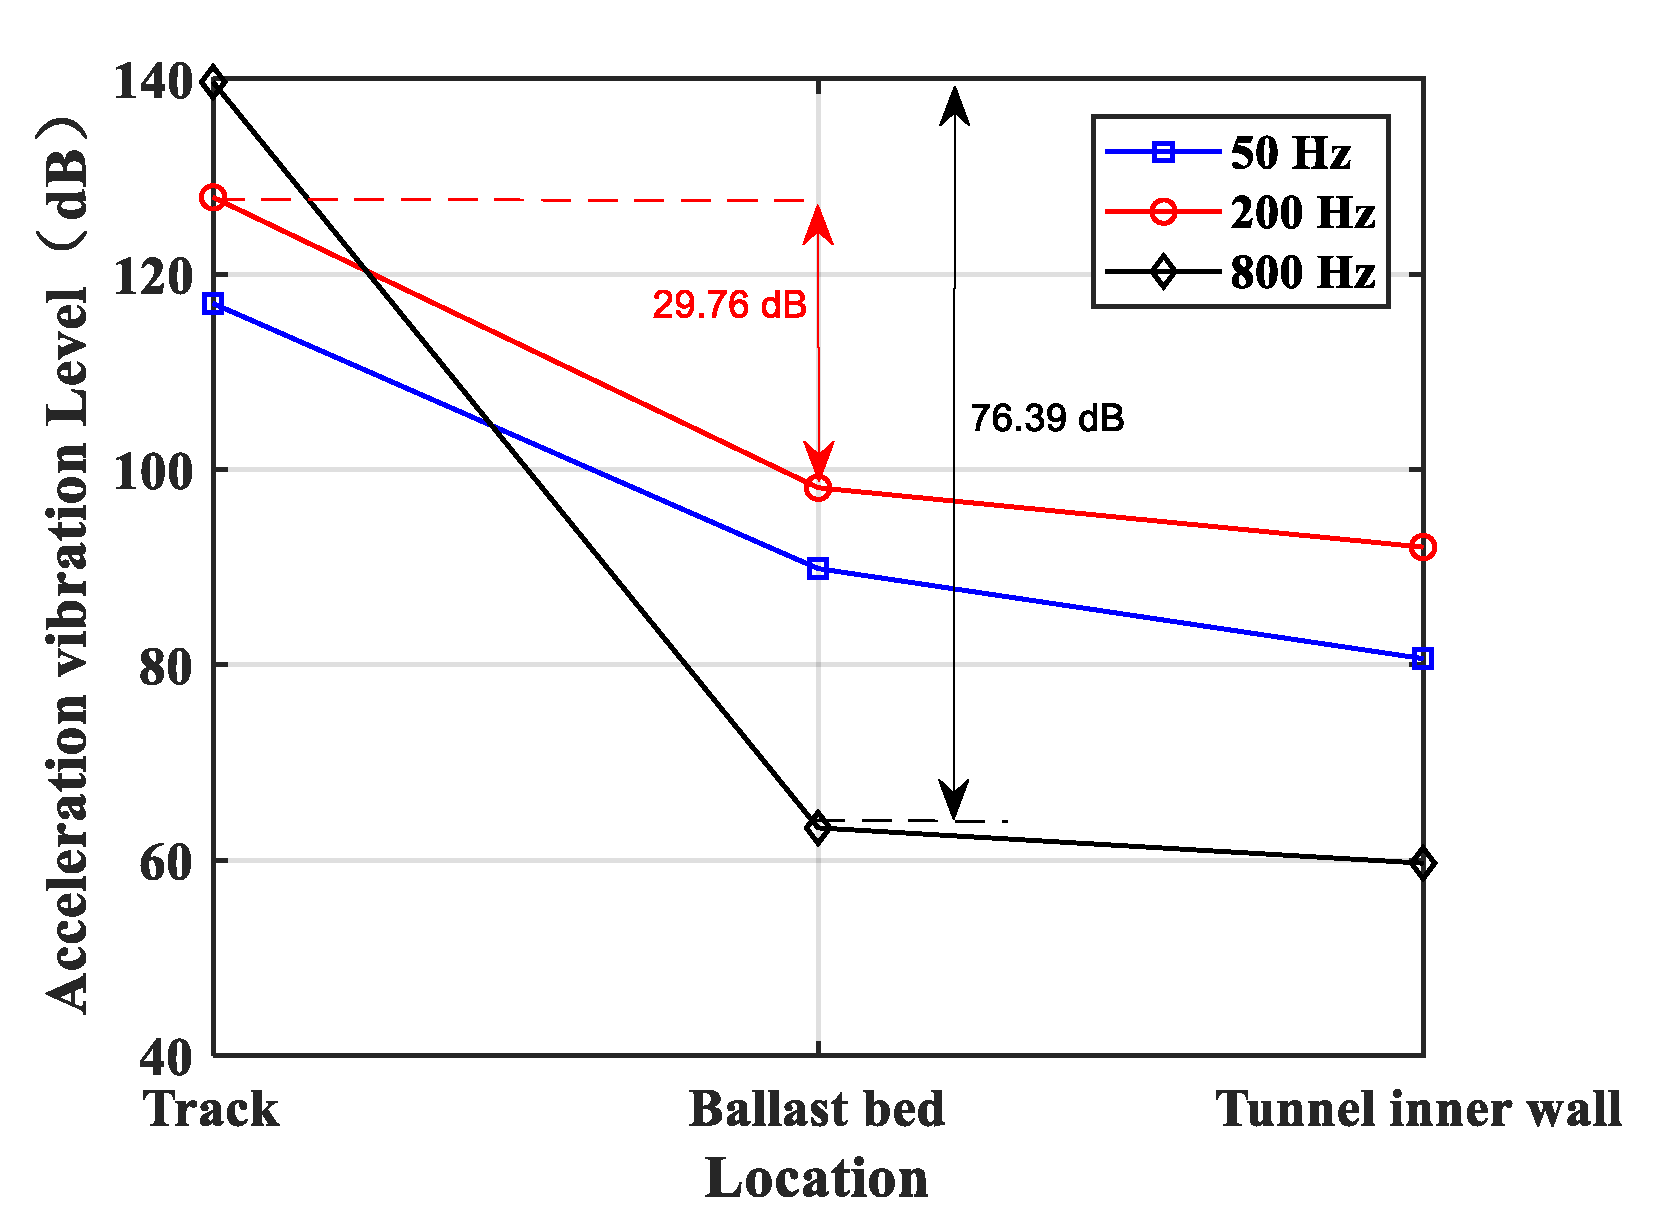
The reduction of extreme values of vibration acceleration amplitude is observed significantly with distance from the vibration source, especially when vibration wave spreads between the track and ballast bed. In other words, the most prominent and visible attenuation of vibration is from the track to the ballast bed.
(b)
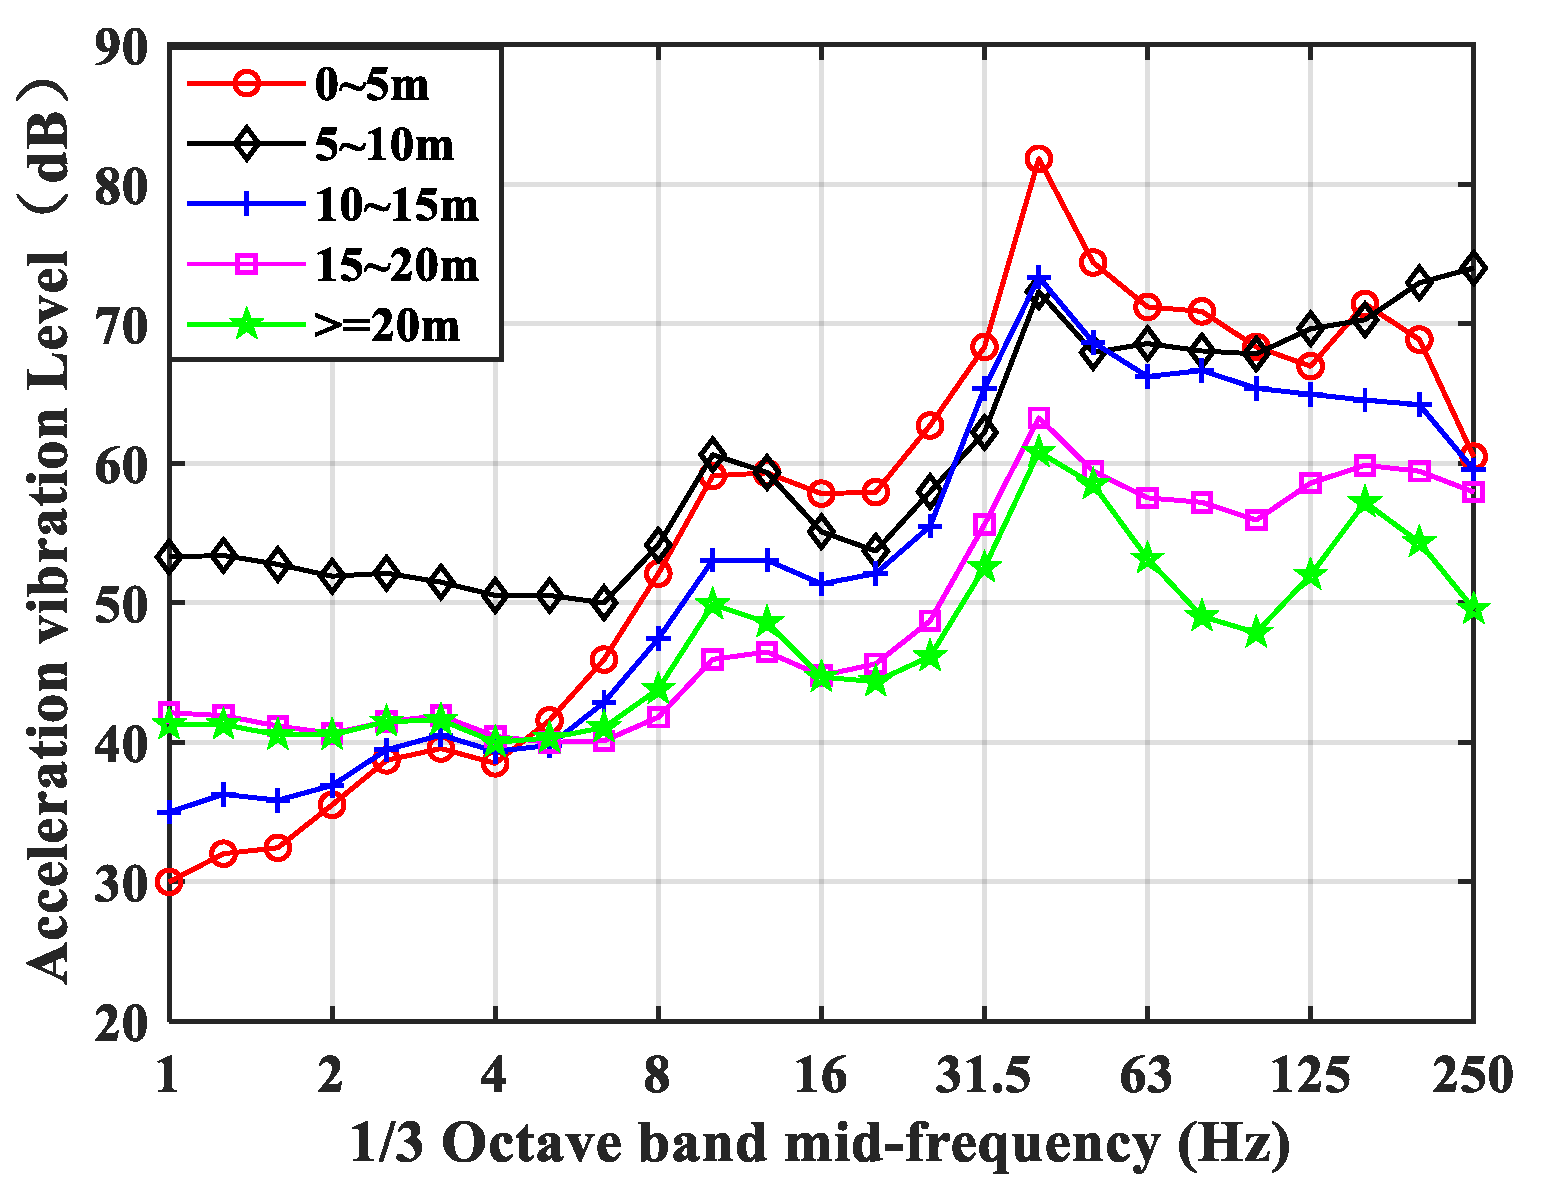
The ground-borne vibration would quickly decrease with distance from the centerline of the subway tunnel, and the decay ratio of the vibration increases with the increase in frequency range, similar to that in tunnel.
(c)
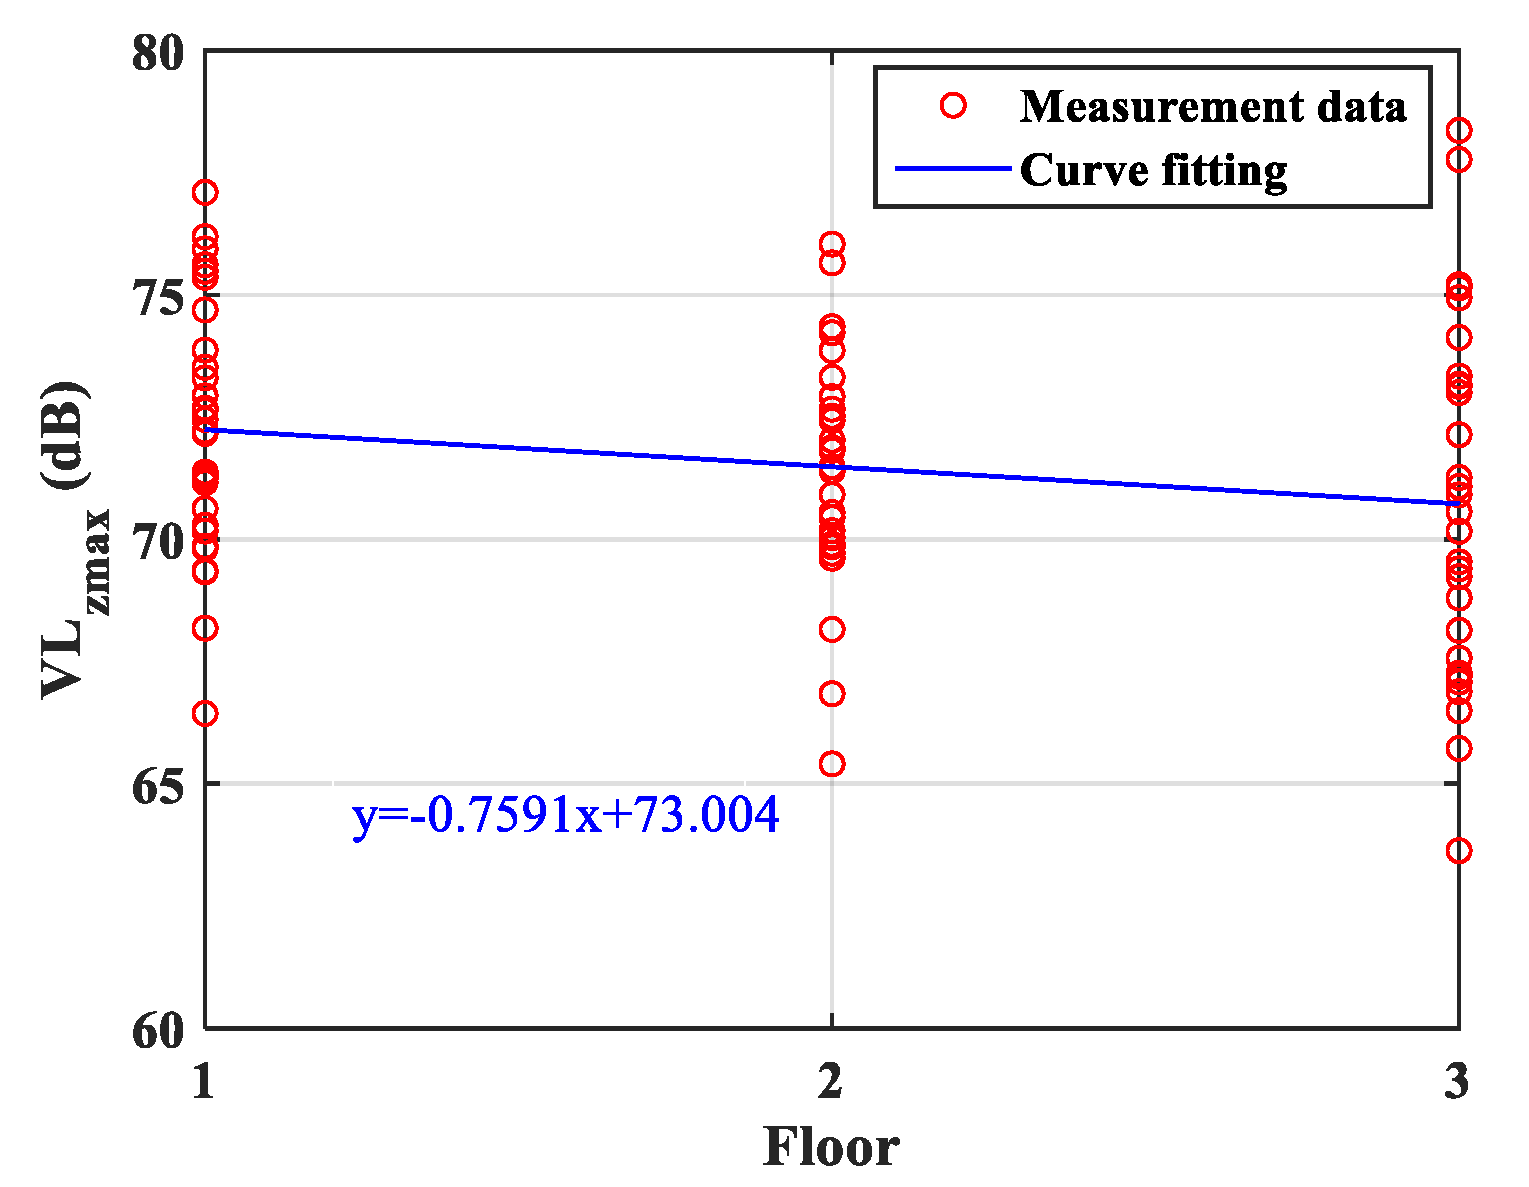
The measured attenuation value of indoor vibration was approximate 0.76 dB on average between each floor from 1st floor to 3rd floor, and there is little difference between the outdoor vibration and the corresponding indoor vibration on the 1st floor.
(d)
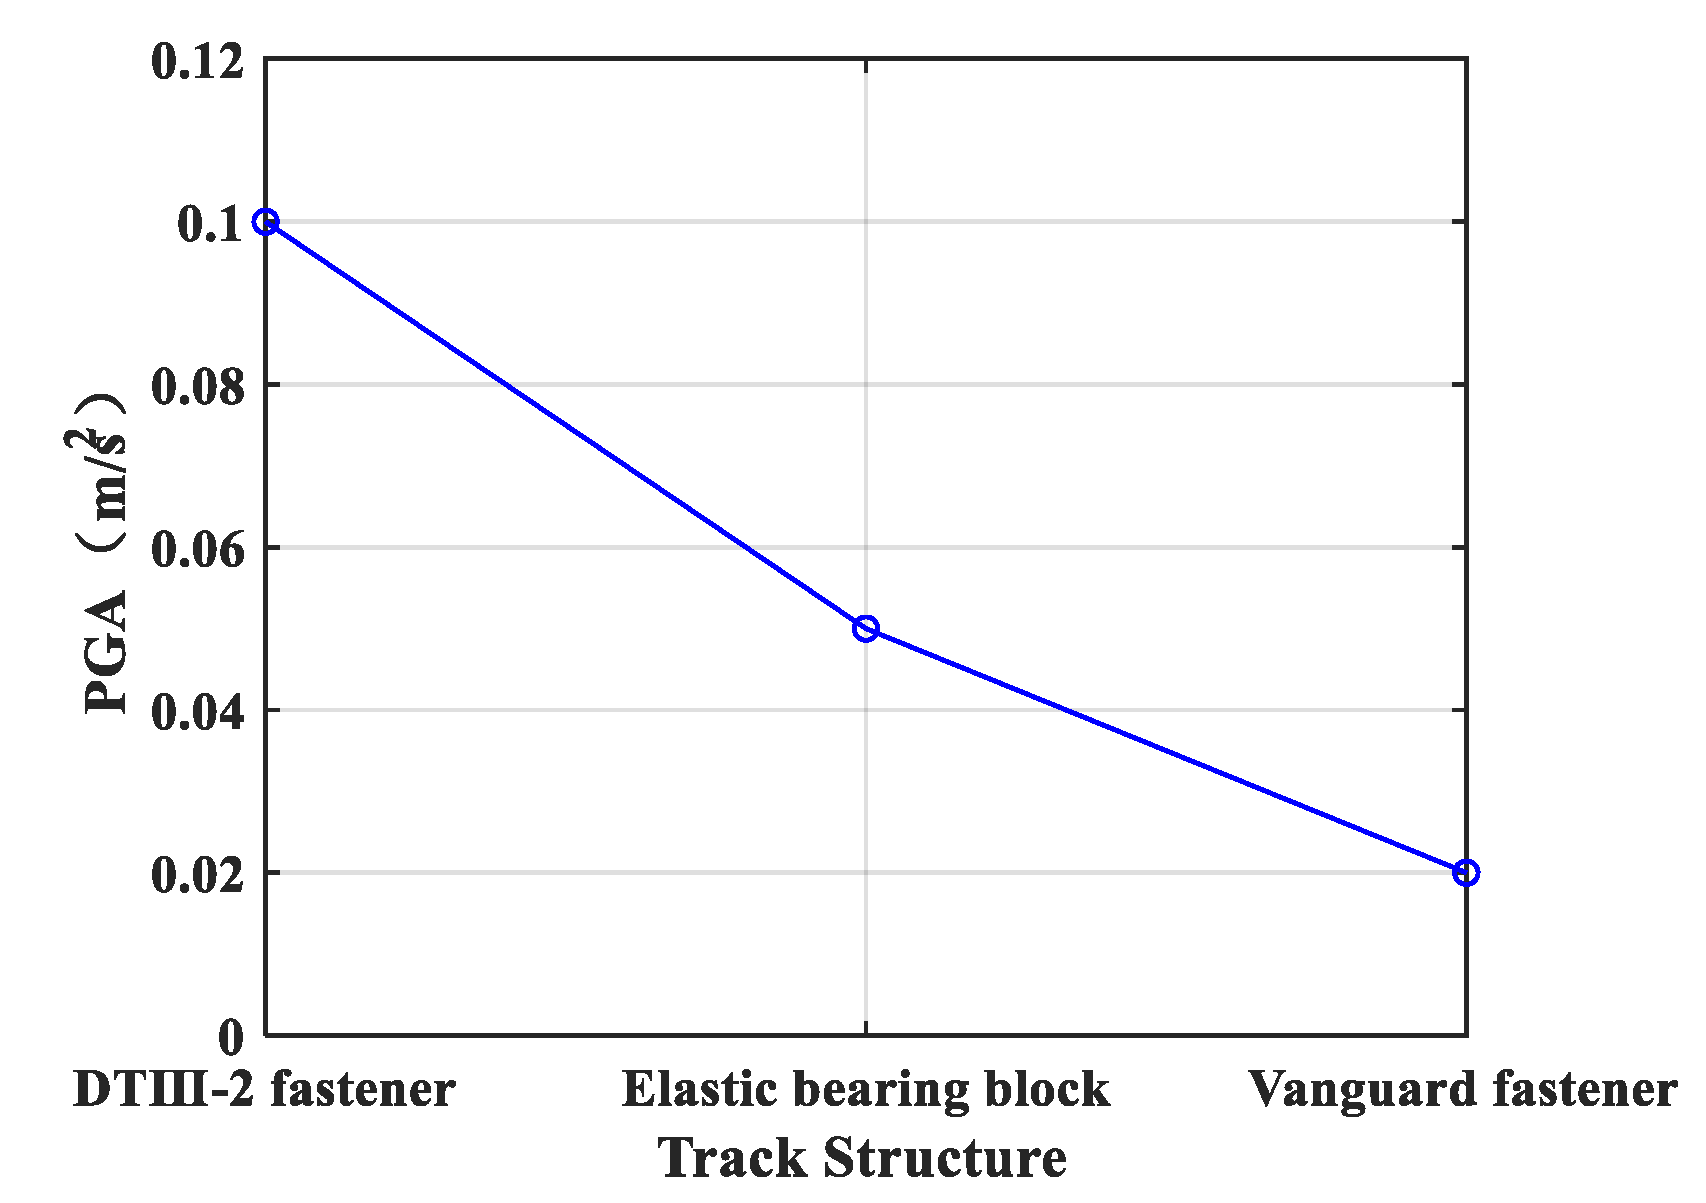
It is recommended to take a construction gauge of 20–25 m outside of the tunnel. Further, reducing vibration source excitation intensity is the most effective vibration isolation method, especially track structural transformation.
In future studies, more detailed analysis on the structural damage identification based on acoustic emission will be addressed by continuous measurements and theoretical analysis.

Author Contributions

Conceptualization, R.X.; Data curation, R.X.; Formal analysis, W.Y.; Funding acquisition, X.L. and S.X.; Methodology, X.L.; Writing—review & editing, M.R. and C.Y.

Funding

This work was supported by the Fundamental Research Funds for the Central Universities (No. 310826171013, 310826172203), Natural Science Basic Research Plan in Shaanxi Province of China (No. 2018JQ4044), Shaanxi Science & Technology Co-ordination & Innovation Project (2016KTZDSF04-05-04) and Shaanxi Key Science and Technology Innovation Team Project (No. 2016KCT-13).

Acknowledgments

The award of a China Scholarship Council (CSC) Visiting Scholar grant to Rui Xu (No. 201706565054) supported the development of this paper at The University of North Dakota. Finally, the authors would like to thank Vamegh Rasouli, University of North Dakota, for valuable comments on an earlier draft of this paper.

Conflicts of Interest

The authors declare no conflict of interest.

References

  1. Xu, R.; Li, X.; Yang, W.; Jiang, C.; Rabiei, M. Use of local plants for ecological restoration and slope stability: A possible application in Yan’an, Loess Plateau, China. Geomat. Nat. Hazards Risk 2019, 10, 2106–2128. [Google Scholar] [CrossRef]
  2. Chao, Z.; Wang, Y.; Moore, J.A.; Sanayei, M. Train-induced field vibration measurements of ground and over-track buildings. Sci. Total Environ. 2016, 575, 1339–1351. [Google Scholar]
  3. Connolly, D.P.; Marecki, G.P.; Kouroussis, G.; Thalassinakis, I.; Woodward, P.K. The growth of railway ground vibration problems—A review. Sci. Total Environ. 2016, 568, 1276–1282. [Google Scholar] [CrossRef] [PubMed]
  4. Eitzenberger, A. Train-Induced Vibrations in Tunnels: A Review; Luleå Tekniska Universitet: Luleå, Sweden, 2008. [Google Scholar]
  5. Stiebel, D.; Muller, R.; Bongini, E.; Ekbald, A.; Coquel, G.; Alguacil, A.A. Definition of Reference Cases Typical for Hot-Spots in Europe with Existing Vibration Problems. Rivas Project SCP0-GA-2010-265754; Deliverable D1.5. Report to the EC. 2012. Available online: http://www.rivas-project.eu/fileadmin/documents/rivas_db_wp1_d1_5_v05_definition_hotspots.pdf (accessed on 20 November 2019).
  6. Zhang, Z.L.; Cui, Z.D. Dynamic Response of Soil around the Tunnel Under Subway Vibration Loading. In Proceedings of the GeoShanghai International Conference, Shanghai, China, 27–30 May 2018; pp. 53–61. [Google Scholar]
  7. Zhou, X.; Zhao, X.; Han, J.; He, Y.; Wen, Z.; Jin, X. Study on Transient Rolling Noise Characteristics of Subway Wheel with Rail Corrugation. J. Mech. Eng. 2018, 54, 196–202. [Google Scholar] [CrossRef]
  8. François, S.; Pyl, L.; Masoumi, H.R.; Degrande, G. The influence of dynamic soil–structure interaction on traffic induced vibrations in buildings. Soil Dyn. Earthq. Eng. 2007, 27, 655–674. [Google Scholar] [CrossRef]
  9. Yao, K. Research Development of Subway Vibration Impact on Environment. In Proceedings of the 23 International Congress on Sound &Vibration, Athens, Greece, 10–14 July 2016. [Google Scholar]
  10. Amado-Mendes, P.; Costa, P.A.; Godinho, L.M.; Lopes, P. 2.5D MFS–FEM model for the prediction of vibrations due to underground railway traffic. Eng. Struct. 2015, 104, 141–154. [Google Scholar] [CrossRef]
  11. Jones, S. Ground Vibration from Underground Railways: How Simplifying Assumptions Limit Prediction Accuracy; University of Cambridge: Cambridge, UK, 2010. [Google Scholar]
  12. Federal Railroad Administration. High-Speed Ground Transportation Noise and Vibration Impact Assessment; U.S. Department of Transportation: Washington, DC, USA, 2012.
  13. Verbraken, H.; Lombaert, G.; Degrande, G. Verification of an empirical prediction method for railway induced vibrations by means of numerical simulations. J. Sound Vib. 2011, 330, 1692–1703. [Google Scholar] [CrossRef]
  14. With, C.; Bodare, A. Prediction of train-induced vibrations inside buildings using transfer functions. Soil Dyn. Earthq. Eng. 2007, 27, 93–98. [Google Scholar] [CrossRef]
  15. Federal Transit Administration (USA). Transit Noise and Vibration Impact Assessment; The Administration: Washington, DC, USA, 2006.
  16. Lai, C.G.; Callerio, A.; Faccioli, E.; Morelli, V.; Romani, P. Prediction of railway-induced ground vibrations in tunnels. J. Vib. Acoust. 2005, 127, 503–514. [Google Scholar] [CrossRef]
  17. Gupta, S.; Degrande, G.; Lombaert, G. Experimental validation of a numerical model for subway induced vibrations. J. Sound Vib. 2009, 321, 786–812. [Google Scholar] [CrossRef]
  18. Lombaert, G.; François, S.; Verbraken, H.; Degrande, G.; Thompson, D.J. Numerical, experimental and hybrid methods for the prediction of railway-induced ground vibration. In Proceedings of the 9th International Conference on Structural Dynamics, EURODYN, Porto, Portugal, 30 June–2 July 2014; pp. 91–99. [Google Scholar]
  19. National Environmental Protection Agency. Measurement Method of Environmental Vibration of Urban Area; GB10071-88; Press of China Standards: Beijing, China, 1989.
  20. Fiala, P.; Degrande, G.; Augusztinovicz, F. Numerical modelling of ground-borne noise and vibration in buildings due to surface rail traffic. J. Sound Vib. 2007, 301, 718–738. [Google Scholar] [CrossRef]
  21. Ding, D.Y.; Liu, W.N.; Gupta, S.; Lombaert, G.; Degrande, G. Prediction of vibrations from underground trains on Beijing metro line 15. J. Cent. South Univ. Technol. 2010, 17, 1109–1118. [Google Scholar] [CrossRef]
  22. Wei, K.; Zhao, Z.; Du, X.; Li, H.; Wang, P. A theoretical study on the train-induced vibrations of a semi-active magneto-rheological steel-spring floating slab track. Constr. Build. Mater. 2019, 204, 703–715. [Google Scholar] [CrossRef]
  23. Zhou, M.; Wei, K.; Zhou, S.; Xiao, J.; Gong, Q. Influence of different track types on the vibration response of the jointly-built structure of subway and the buildings. China Railw. Sci. 2011, 32, 33–40. [Google Scholar]
  24. Connolly, D.; Giannopoulos, A.; Forde, M.C. Numerical modelling of ground borne vibrations from high speed rail lines on embankments. Soil Dyn. Earthq. Eng. 2013, 46, 13–19. [Google Scholar] [CrossRef]
  25. Andersen, L.; Nielsen, S.R.K. Reduction of ground vibration by means of barriers or soil improvement along a railway track. Soil Dyn. Earthq. Eng. 2005, 25, 701–716. [Google Scholar] [CrossRef]
  26. Coulier, P.; François, S.; Degrande, G.; Lombaert, G. Subgrade stiffening next to the track as a wave impeding barrier for railway induced vibrations. Soil Dyn. Earthq. Eng. 2013, 48, 119–131. [Google Scholar] [CrossRef]
  27. Thompson, D. Railway Noise and Vibration. Mechanisms, Modelling and Means of Control; Elsevier Ltd.: Oxford, UK, 2009. [Google Scholar]
  28. Xu, S.Y.; Jiang, C.; Huang, L. Public health impacts from subway noise: Case study Hong Kong. J. Acoust. Soc. Am. 2019, 145, 1867. [Google Scholar] [CrossRef]
  29. Sadeghi, J.; Hasheminezhad, A. Correlation between rolling noise generation and rail roughness of tangent tracks and curves in time and frequency domains. Appl. Acoust. 2016, 107, 10–18. [Google Scholar] [CrossRef]
  30. Bejger, A.; Chybowski, L.; Gawdzińska, K. Utilising elastic waves of acoustic emission to assess the condition of spray nozzles in a marine diesel engine. J. Mar. Eng. Technol. 2018, 17, 153–159. [Google Scholar] [CrossRef]
  31. Luo, D.; Su, G.; Zhang, G. True-Triaxial Experimental Study on Mechanical Behaviours and Acoustic Emission Characteristics of Dynamically Induced Rock Failure. Rock Mech. Rock Eng. 2019, 1–19. [Google Scholar] [CrossRef]
Figure 1. Sketch map of the measurement site.
Sustainability 11 06835 g001
Figure 2. Location of the accelerometers in the tunnel. (a) Accelerometers setup in the tunnel, (b) Accelerometers on the track and ballast bed, (c) Accelerometers on the tunnel inner wall.
Sustainability 11 06835 g002
Figure 3. Accelerometer on the ground.
Sustainability 11 06835 g003
Figure 4. Typical time history curve of vertical vibration acceleration period. (a) Track vertical vibration acceleration, (b) Ballast bed vibration acceleration.
Sustainability 11 06835 g004
Figure 5. Statistics of PGA in the tunnel.
Sustainability 11 06835 g005
Figure 6. Comparison of 1/3 octave in the tunnel.
Sustainability 11 06835 g006
Figure 7. Statistics of PGA on the ground.
Sustainability 11 06835 g007
Figure 8. Comparison of 1/3 octave on the ground.
Sustainability 11 06835 g008
Figure 9. Typical measured data of vertical vibration acceleration in some test room (a) Time history curve, (b) Frequency domain curve.
Sustainability 11 06835 g009
Figure 10. Comparison of acceleration level in tunnel.
Sustainability 11 06835 g010
Figure 11. Statistics of VLzmax on different floors.
Sustainability 11 06835 g011
Figure 12. Statistics of PGA on 1st floor.
Sustainability 11 06835 g012
Figure 13. Damping effect of different track structures.
Sustainability 11 06835 g013

