A Methodology for Buildings Access to Solar Radiation in Sustainable Cities

 ,
,  ,
,
Abstract
1. Introduction
2. Data: Neighborhoods Selected
2.1. Case A. U-Shaped Blocks and L-Shaped Blocks Neighborhood
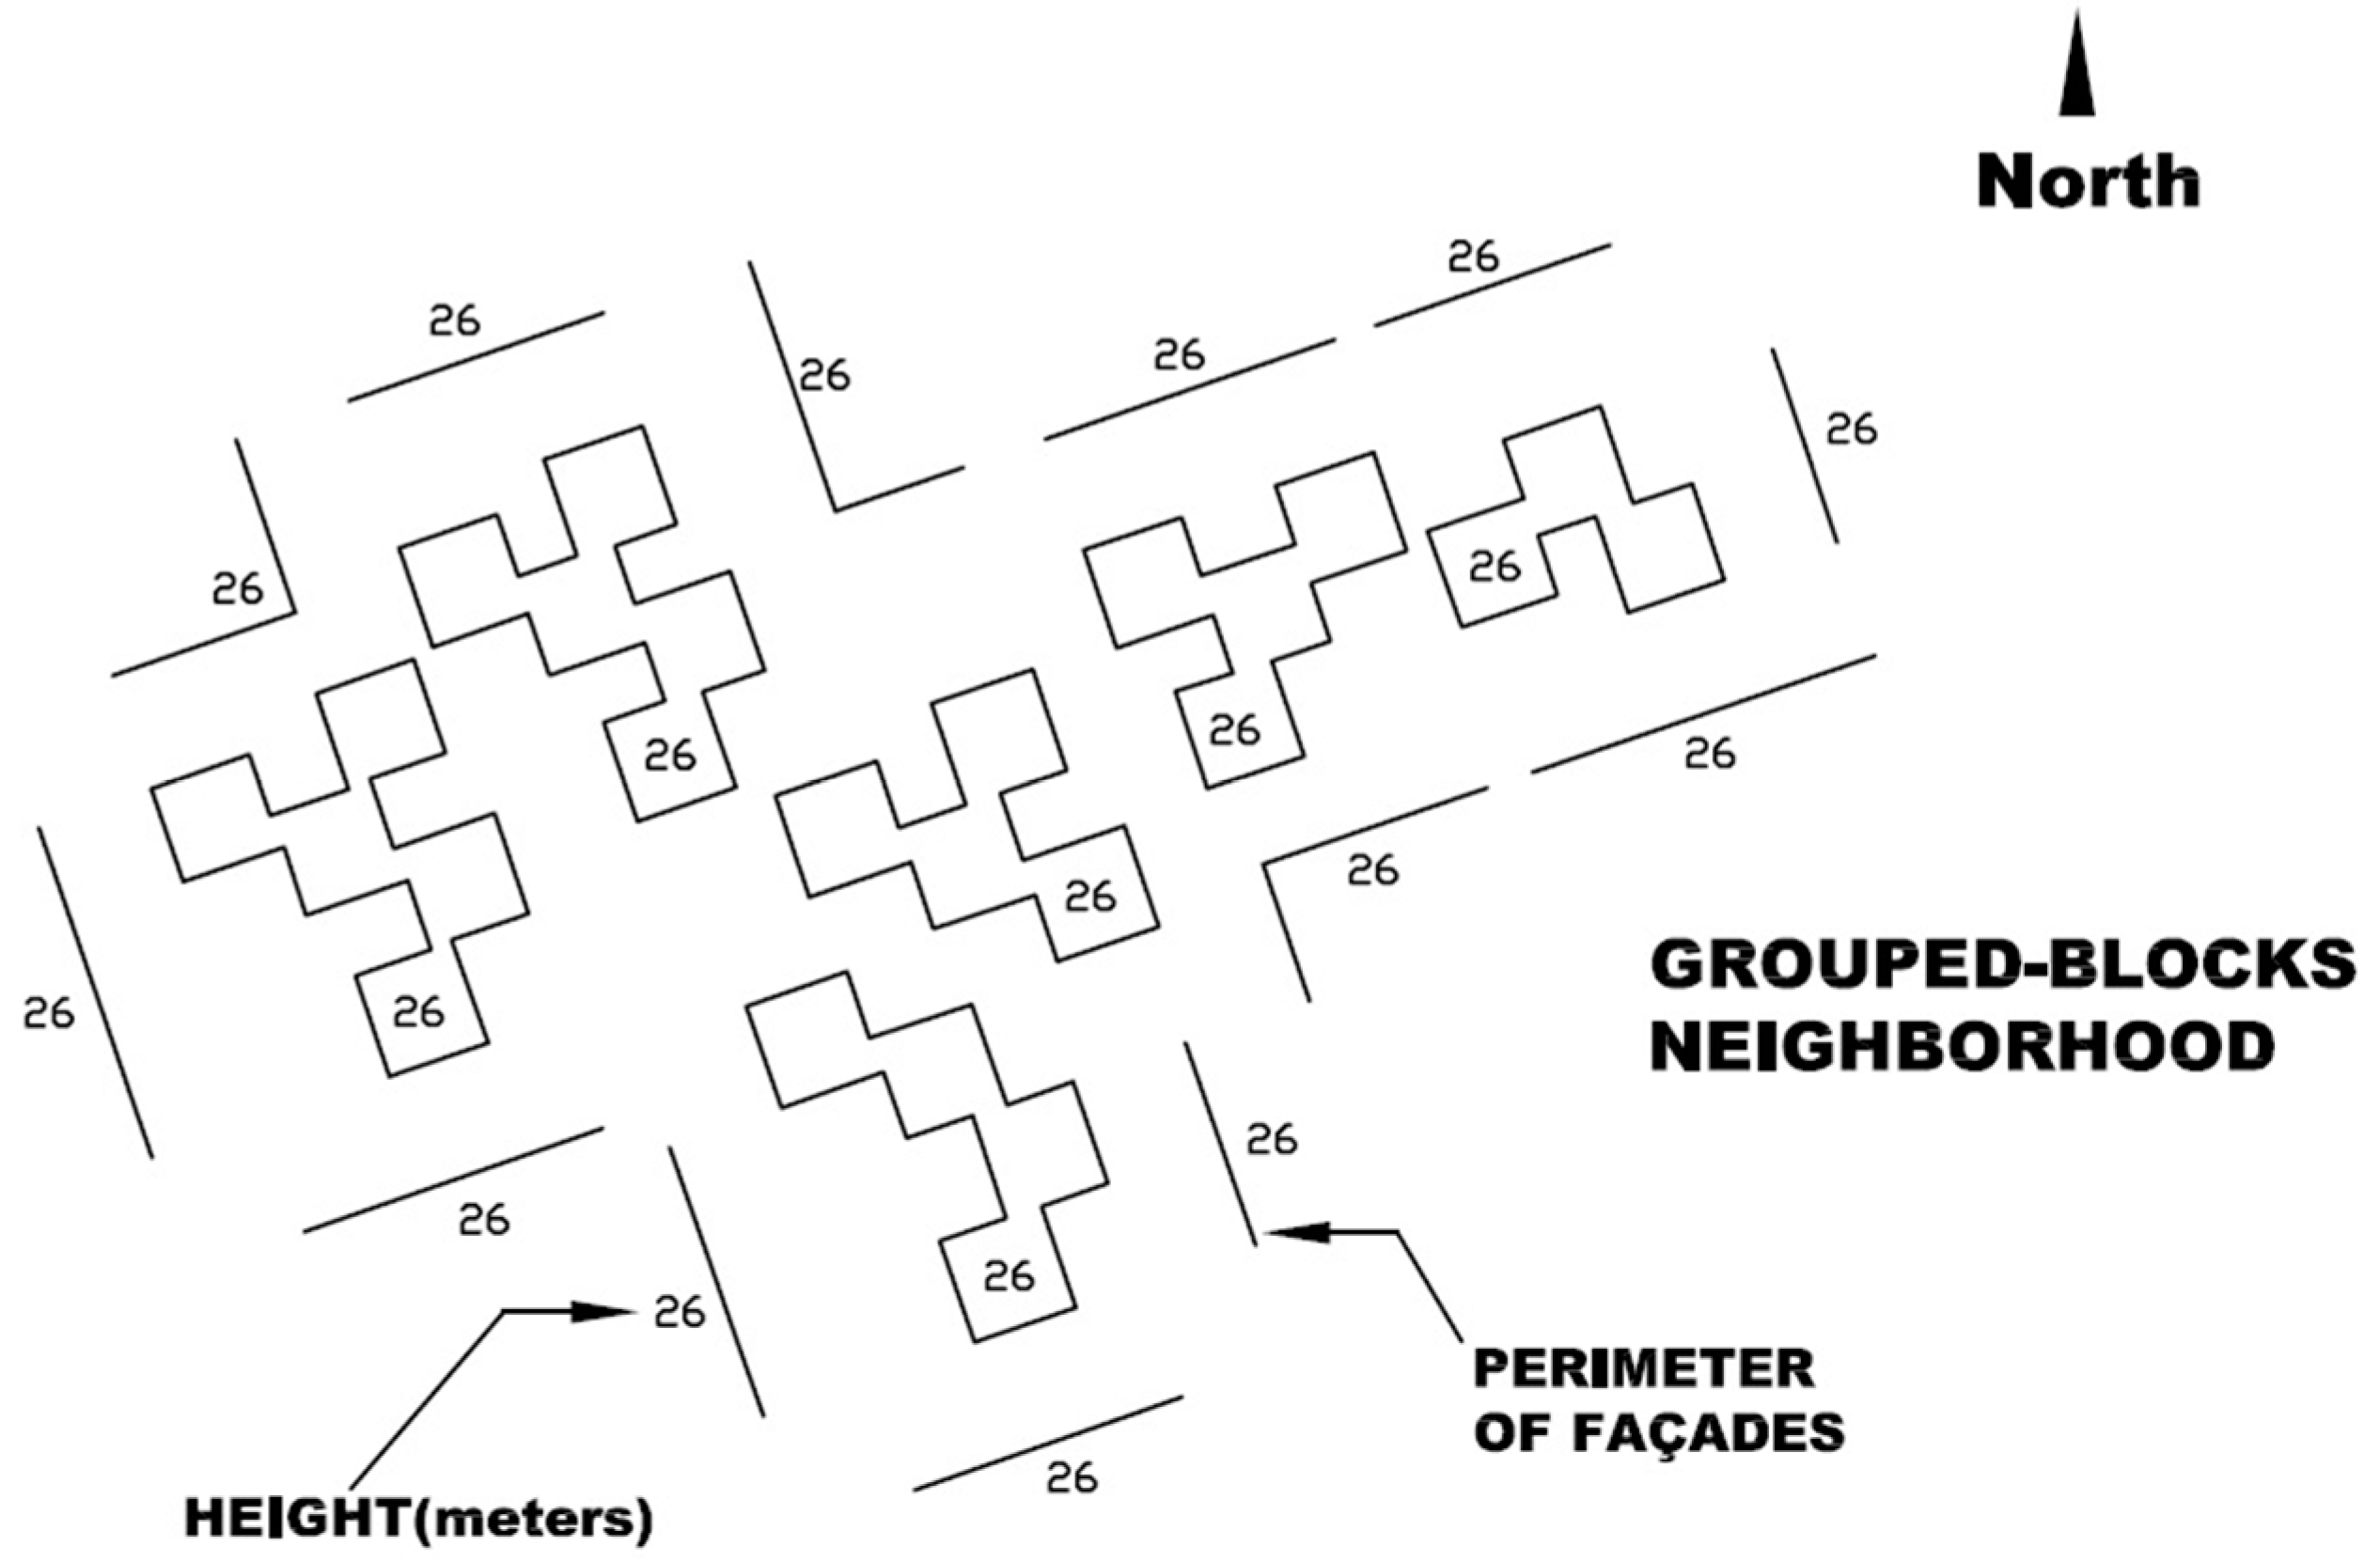
2.2. Case B. Grouped Blocks Neighborhood
3. Methodology
- : Height of the studied point (in meters)
- : Distance between the façade studied and the closest one (in meters)
- : Azimuth angle of the selected façade (in degrees)
- : Correlation coefficients. They may be estimated for each neighborhood typology.
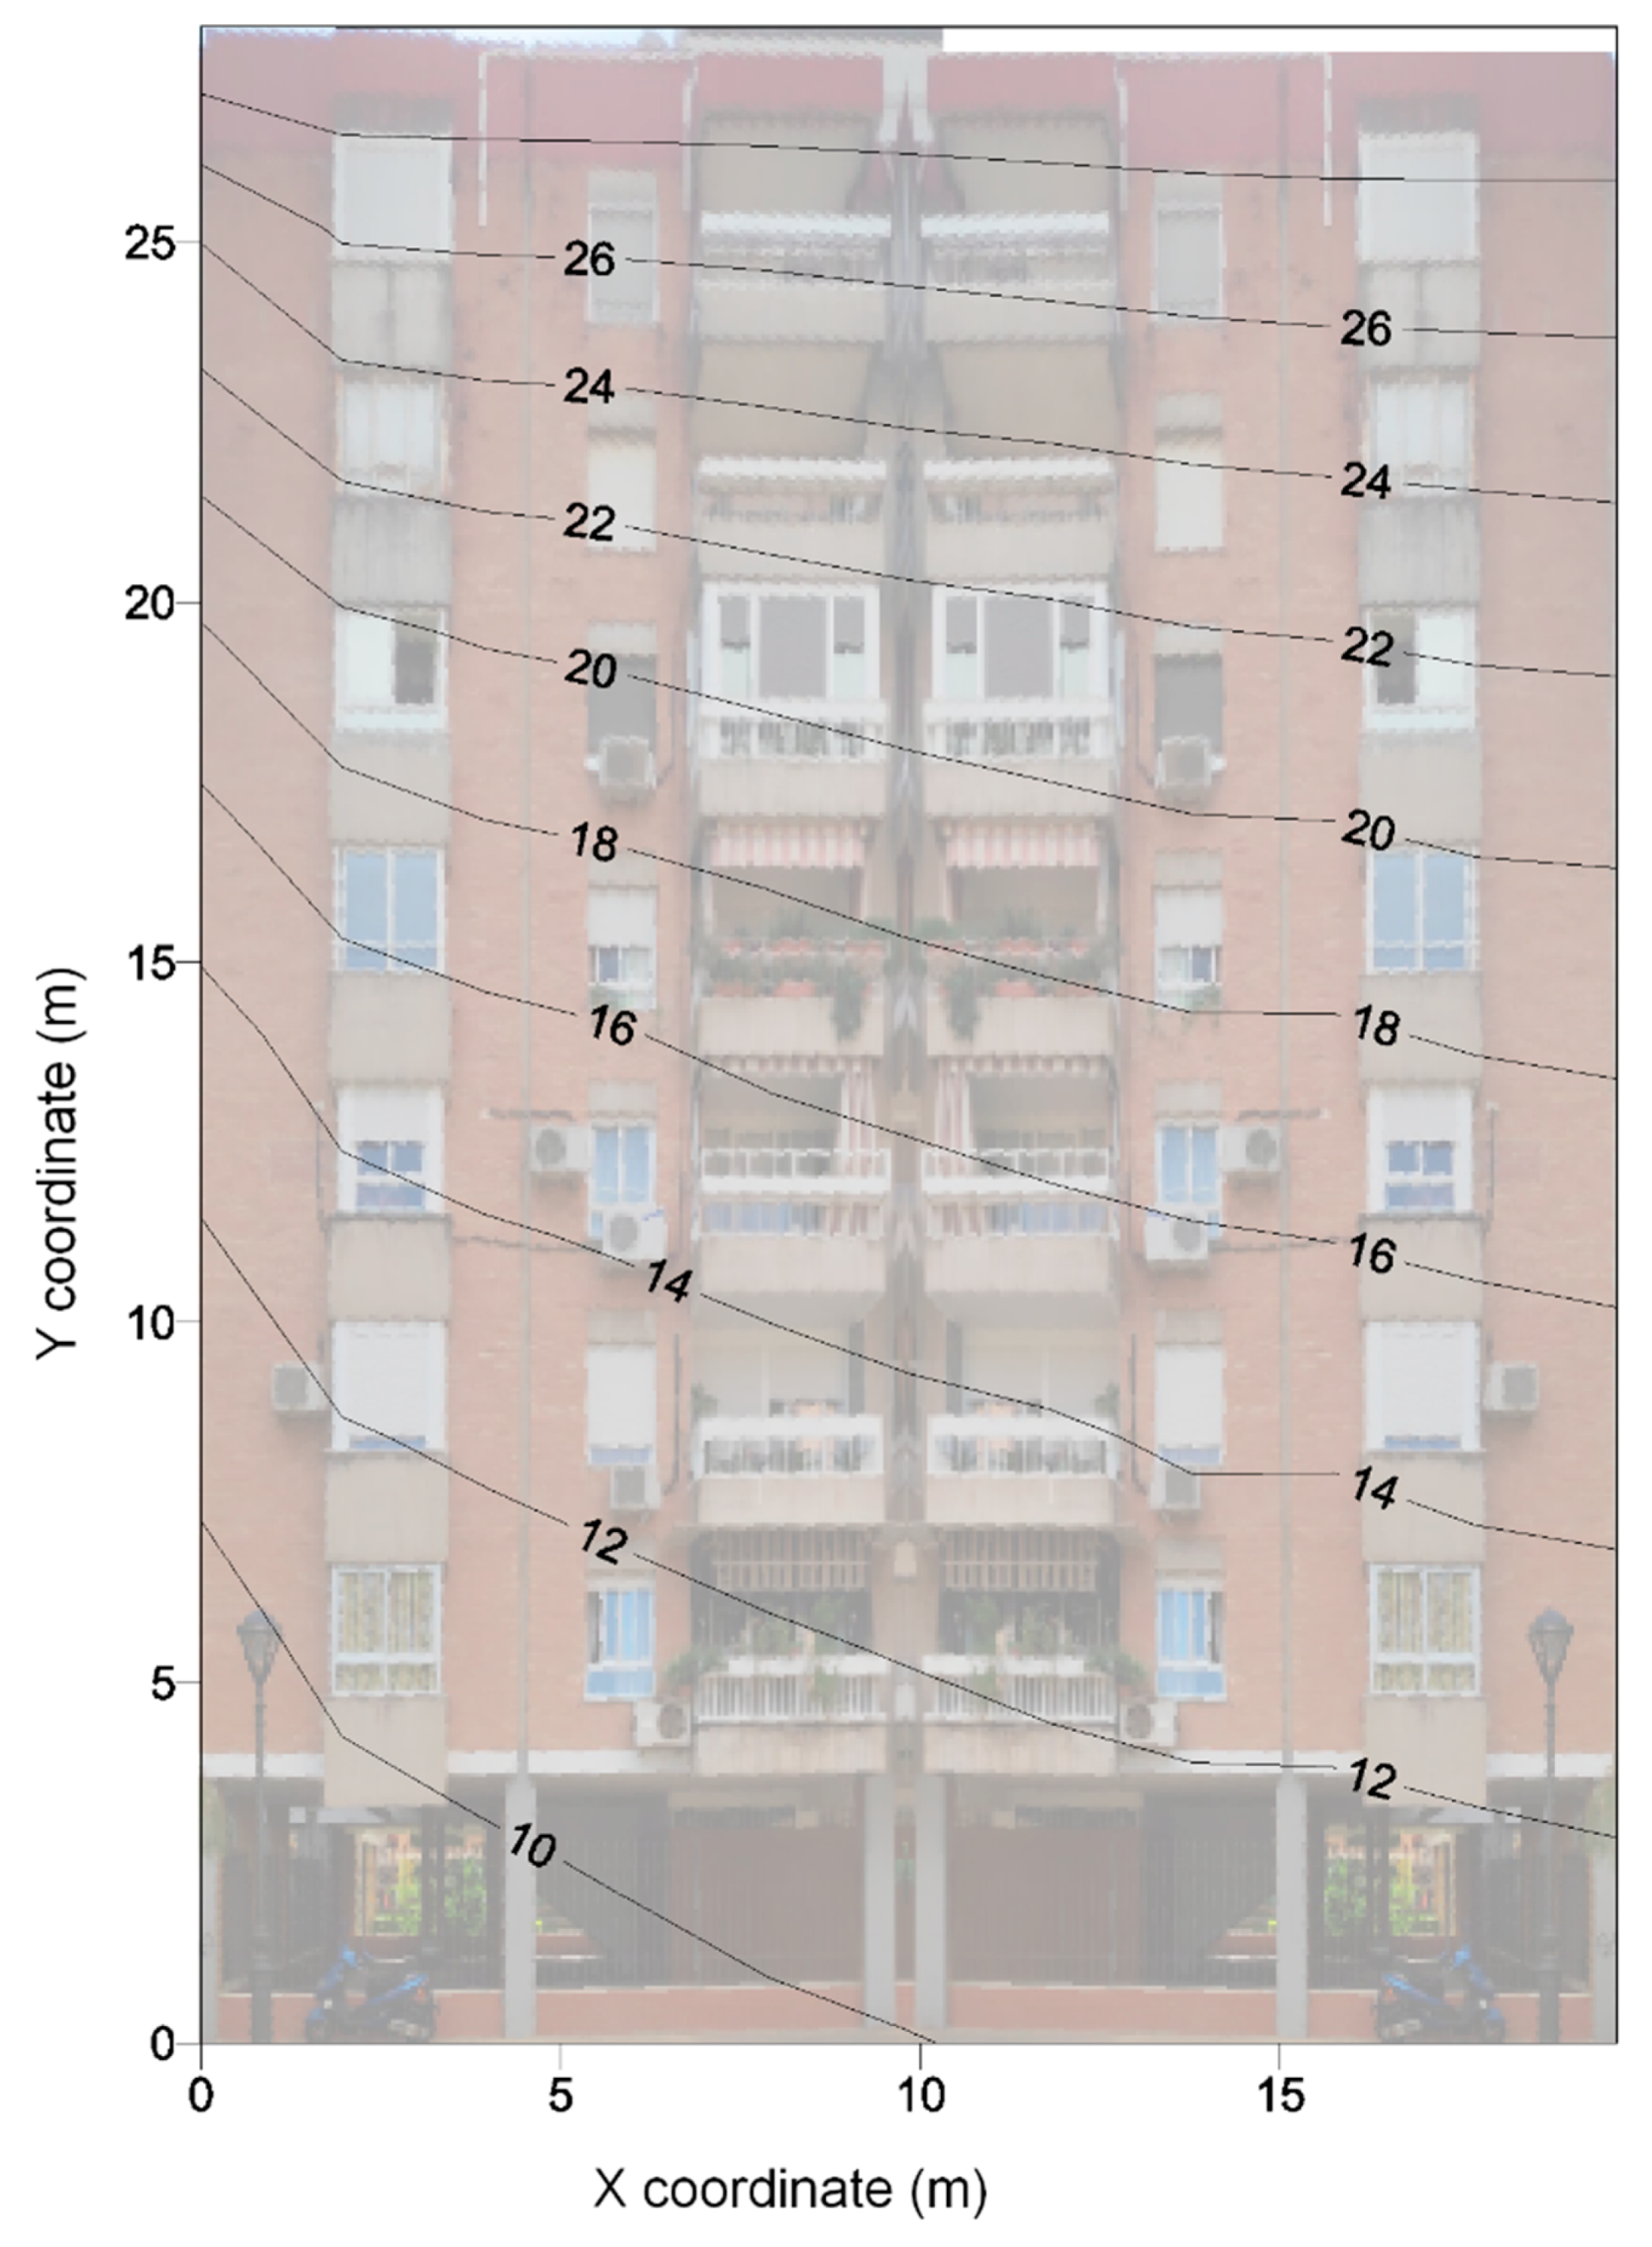
3.1. Solar Radiation Model
- : Normal vector to the external surface of the façade of the building
- : Solar vector
- : Normal vector of the tangent plane of the location considered
- : Albedo
- : Direct irradiance on horizontal surface
- : Diffuse irradiance on horizontal surface
3.2. Software Application for the Analysis
3.2.1. Shadow Subroutine
3.2.2. Sky View Factor Subroutine
3.2.3. Instantaneous Irradiance Subroutine
3.2.4. Daily Solar Radiation Subroutine
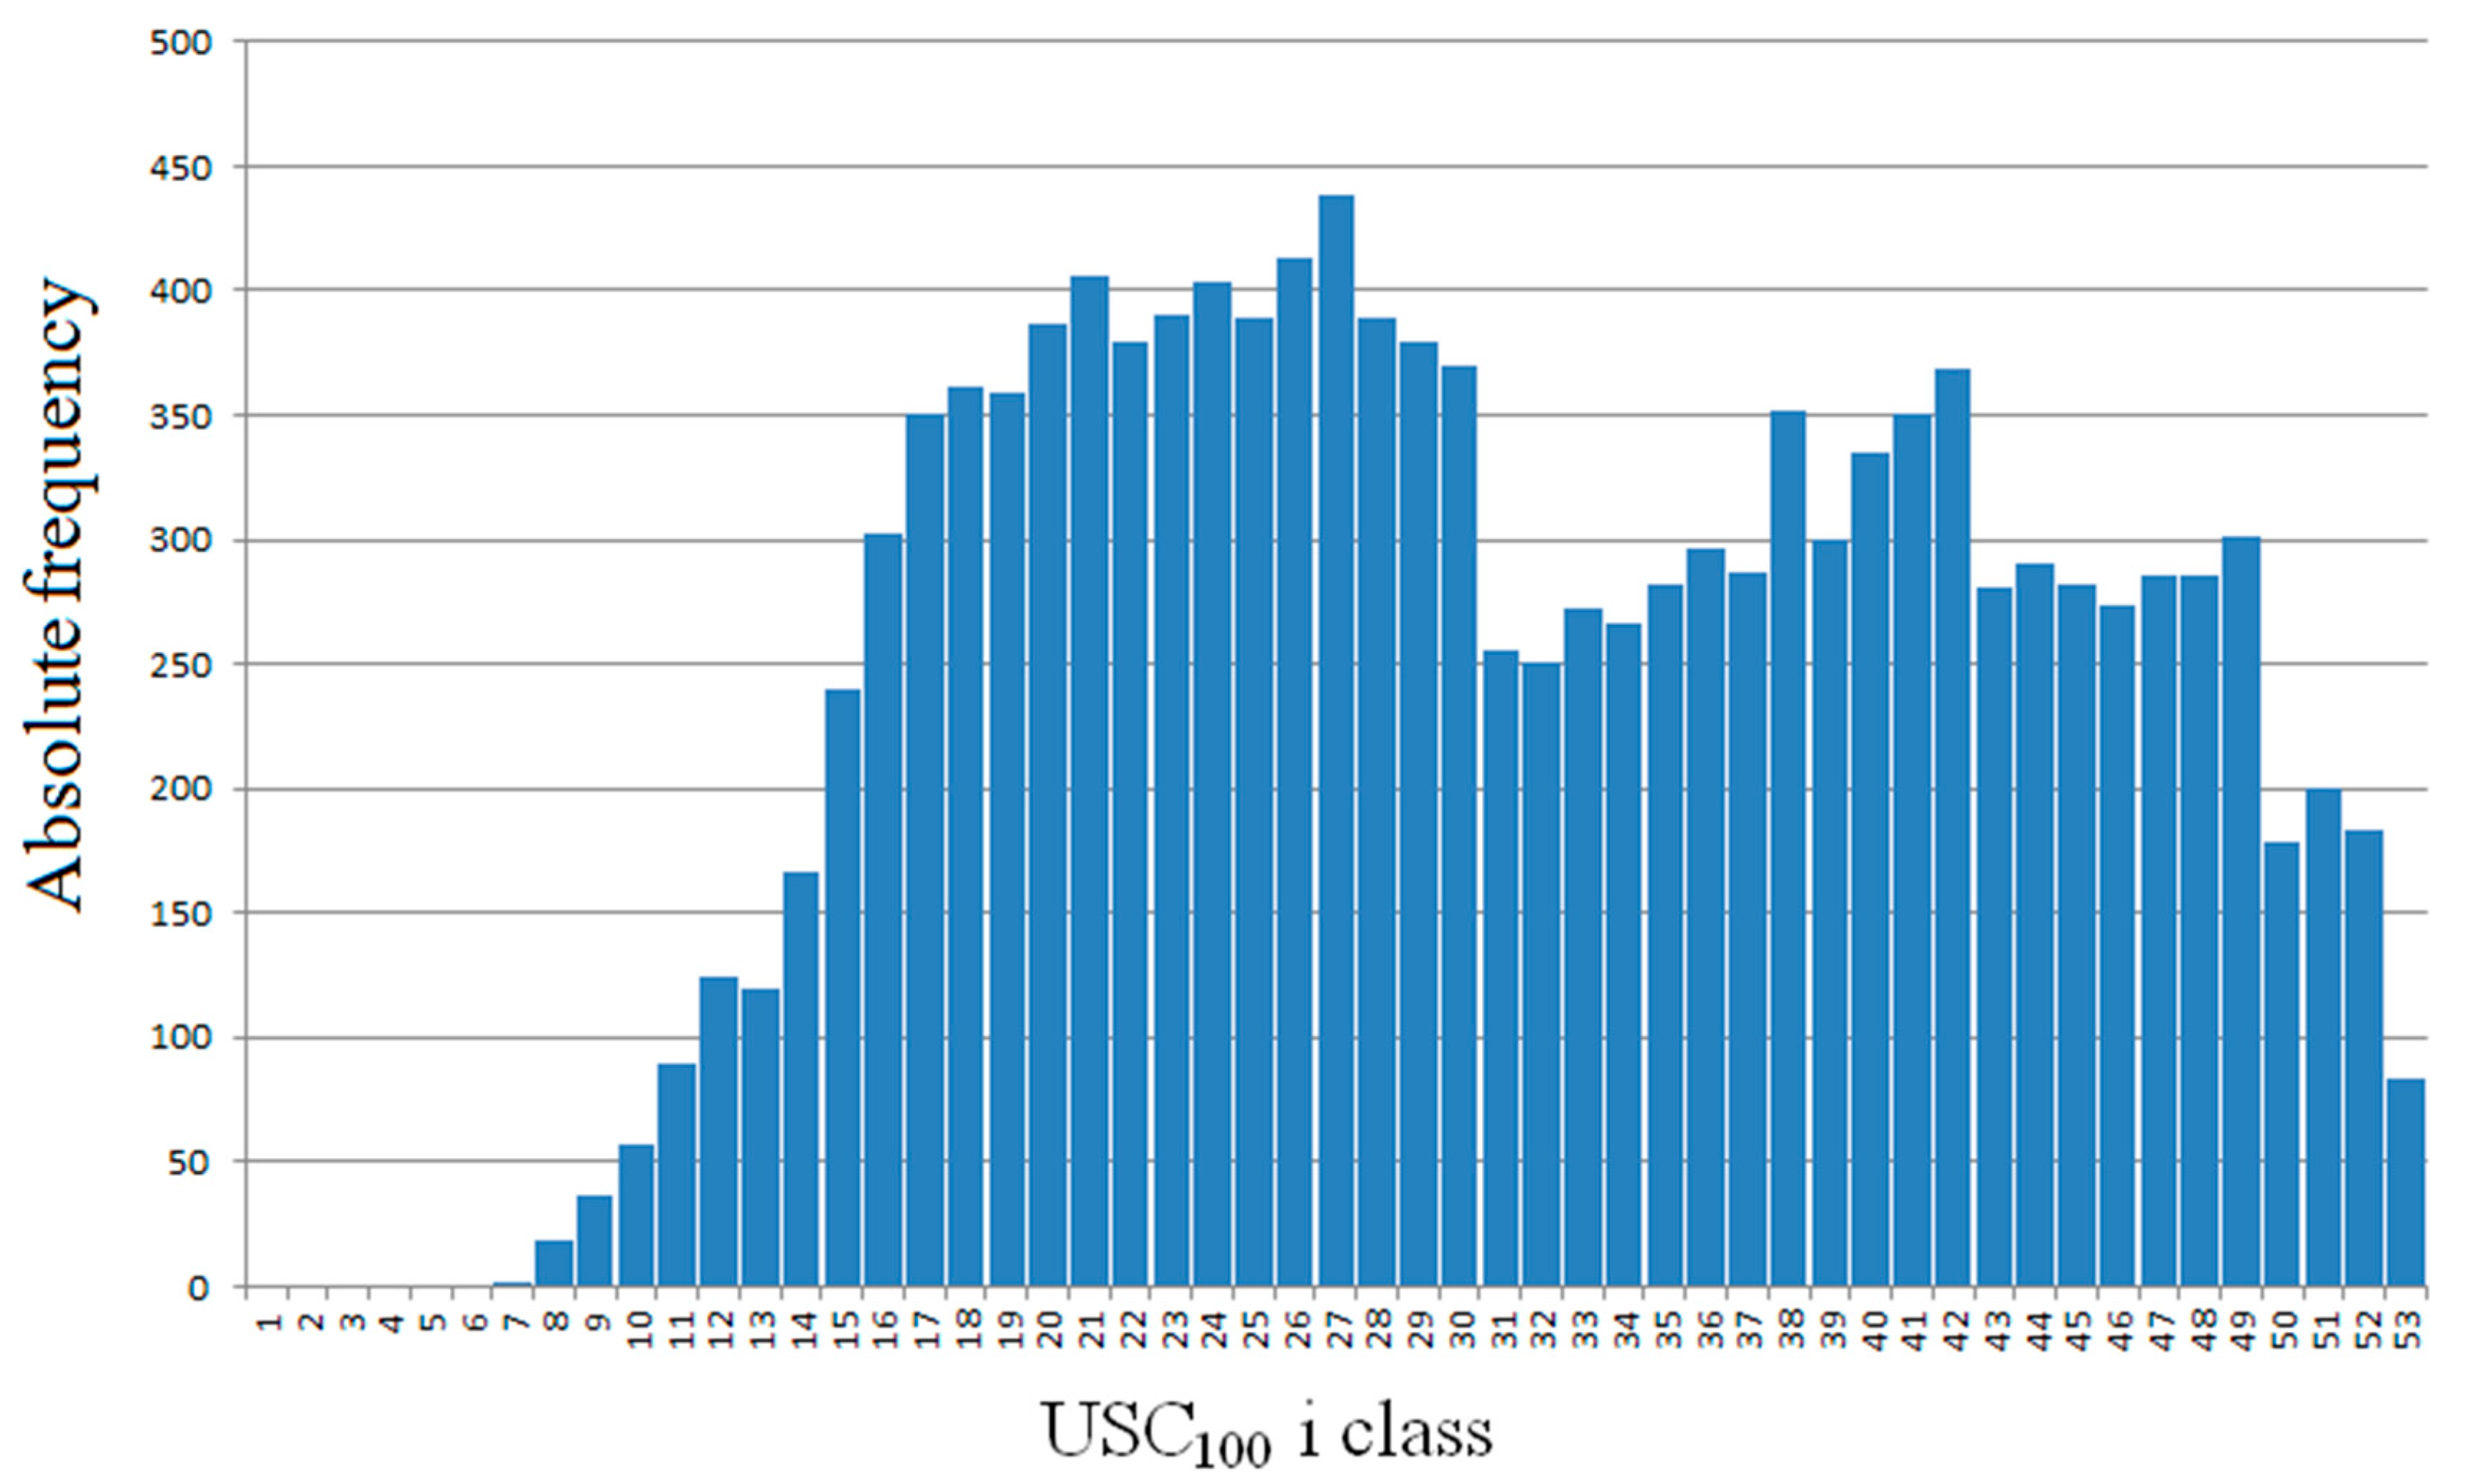
4. Discussion and Regressions
- : Height of the studied point over the ground (in meters)
- : Street width (in meters)
- : Façade facing (in grades)
- : Constants
5. Conclusions
Author Contributions
Funding
Conflicts of Interest
References
- United Nations. World Population Prospects 2019 (Report). Available online: https://population.un.org/wpp/Publications/Files/WPP2019_Highlights.pdf (accessed on 18 September 2019).
- Eremia, M.; Toma, L.; Sanduleac, M. The smart city concept in the 21st century. Procedia Eng. 2017, 181, 12–19. [Google Scholar] [CrossRef]
- Milošević, M.R.; Milošević, D.M.; Stević, D.M.; Stanojević, A.D. Smart city: Modeling key indicators in Serbia using IT2FS. Sustainability 2019, 11, 3536. [Google Scholar] [CrossRef]
- United Nations. World Urbanization Prospects 2018 (Report). Available online: https://population.un.org/wup/Publications/Files/WUP2018-Report.pdf (accessed on 18 September 2019).
- Sandman, H.; Levänen, J.; Savela, N. Using empathic design as a tool for urban sustainability in low-resource settings. Sustainability 2018, 10, 2493. [Google Scholar] [CrossRef]
- Martos, A.; Pacheco-Torres, R.; Ordóñez, J.; Jadraque-Gago, E. Towards successful environmental performance of sustainable cities: Intervening sectors. A review. Renew. Sustain. Energy Rev. 2016, 57, 479–495. [Google Scholar] [CrossRef]
- Lindfors, A.; Feiz, R.; Eklund, M.; Ammenberg, J. Assessing the potential, performance and feasibility of urban solutions: methodological considerations and learnings from biogas solutions. Sustainability 2019, 11, 3756. [Google Scholar] [CrossRef]
- Alamdari, P.; Nematollahi, O.; Alemrajabi, A.A. Solar energy potentials in Iran: A review. Renew. Sustain. Energy Rev. 2013, 21, 778–788. [Google Scholar] [CrossRef]
- Mardonova, M.; Choi, Y. Assessment of photovoltaic potential of mining sites in Uzbekistan. Sustainability 2019, 11, 2988. [Google Scholar] [CrossRef]
- Østergaard, P.A.; Duic, N.; Noorollahi, Y.; Mikulcic, H.; Kalogirou, S. Sustainable development using renewable energy technology. Renew. Energy 2020, 146, 2430–2437. [Google Scholar] [CrossRef]
- Panwar, N.L.; Kaushik, S.C.; Kothari, S. Role of renewable energy sources in environmental protection: A review. Renew. Sustain. Energy Rev. 2011, 15, 1513–1524. [Google Scholar] [CrossRef]
- Belakehal, A.; Tabet Aoul, K.; Bennadji, A. Sunlighting and daylighting strategies in the traditional urban spaces and buildings of the hot arid regions. Renew. Energy 2004, 29, 687–702. [Google Scholar] [CrossRef][Green Version]
- Glaeser, E.L.; Kahn, M.E. Sprawl and urban growth. Handb. Reg. Urban Econ. 2004, 4, 2481–2527. [Google Scholar]
- Van Esch, M.M.E.; Looman, R.H.J.; De Bruin-Hordijk, G.J. The effects of urban and building design parameters on solar access to the urban canyon and the potential for direct passive solar heating strategies. Energy Build. 2012, 47, 189–200. [Google Scholar] [CrossRef]
- Drif, M.; Pérez, P.J.; Aguilera, J.; Aguilar, J.D. A new estimation method of irradiance on a partially shaded PV generator in grid-connected photovoltaic systems. Renew. Energy 2008, 33, 2048–2056. [Google Scholar] [CrossRef]
- Zhang, X.; Wei, Z. A hybrid model based on principal component analysis, wavelet transform, and extreme learning machine optimized by Bat algorithm for daily solar radiation forecasting. Sustainability 2019, 11, 4138. [Google Scholar] [CrossRef]
- Alzoubi, H.H.; Alshboul, A.A. Low energy architecture and solar rights: Restructuring urban regulations, view from Jordan. Renew. Energy 2010, 35, 333–342. [Google Scholar] [CrossRef]
- Edwards, L.; Torcellini, P. A Literature Review of the Effects of Natural Light on Building Occupants. Available online: https://www.nrel.gov/docs/fy02osti/30769.pdf (accessed on 18 September 2019).
- Calama-González, C.; León-Rodríguez, Á.; Suárez, R. Daylighting and energy performance evaluation of an egg-crate device for hospital building retrofitting in a Mediterranean climate. Sustainability 2018, 10, 2714. [Google Scholar] [CrossRef]
- Ihm, P.; Nemri, A.; Krarti, M. Estimation of lighting energy savings from daylighting. Build. Environ. 2009, 44, 509–514. [Google Scholar] [CrossRef]
- Gago, E.J.; Muneer, T.; Knez, M.; Köster, H. Natural light controls and guides in buildings. Energy saving for electrical lighting, reduction of cooling load. Renew. Sustain. Energy Rev. 2015, 41, 1–13. [Google Scholar] [CrossRef]
- Torres-Roldán, M.; López-Luque, R.; Varo-Martínez, M. Design of an innovative and simplified polar heliostat for integration in buildings and urban environments. Sol. Energy 2015, 119, 159–168. [Google Scholar] [CrossRef]
- Torres-Roldán, M.; López-Luque, R.; Varo-Martínez, M. Assessment of the pointing error of heliostats with a single not polar rotation axis for urban applications. Sol. Energy 2016, 137, 281–289. [Google Scholar] [CrossRef]
- Spacek, A.D.; Neto, J.M.; Biléssimo, L.D.; Junior, O.H.A.; Neto, G.P.D.F.; Giansella, R.D.S.; De Santana, M.V.F.; Malfatti, C.D.F. Proposal for an experimental methodology for evaluation of natural lighting systems applied in buildings. Energies 2017, 10, 1014. [Google Scholar] [CrossRef]
- Polo, M.-E.; Pozo, M.; Quirós, E. Directional statistics in solar potential of rooftops at three different neighborhoods of a medium size city. Proceedings 2018, 2, 1275. [Google Scholar] [CrossRef]
- Gómez-Munoz, V.M.; Porta-Gándara, M.A. General model to build awnings and external walls with optimum shading interaction. Renew. Energy 2004, 29, 605–613. [Google Scholar] [CrossRef]
- Smith, G.B. Materials and systems for efficient lighting and delivery of daylight. Sol. Energy Mater. Sol. Cells 2004, 84, 395–409. [Google Scholar] [CrossRef]
- Kanters, J.; Horvat, M.; Dubois, M.C. Tools and methods used by architects for solar design. Energy Build. 2014, 68, 721–731. [Google Scholar] [CrossRef]
- Brito, M.C.; Freitas, S.; Guimarães, S.; Catita, C.; Redweik, P. The importance of facades for the solar PV potential of a Mediterranean city using LiDAR data. Renew. Energy 2017, 111, 85–94. [Google Scholar] [CrossRef]
- Bayón-Cueli, C.; Barbón, A.; Bayón, L.; Barbón, N. A cost-energy based methodology for small-scale linear Fresnel reflectors on flat roofs of urban buildings. Renew. Energy 2020, 146, 944–959. [Google Scholar] [CrossRef]
- Mingfang, T. Solar control for buildings. Build. Environ. 2002, 37, 659–664. [Google Scholar] [CrossRef]
- Salazar Trujillo, J.H. Solar performance and shadow behaviour in buildings. Case study with computer modelling of a building in Loranca, Spain. Build. Environ. 1998, 33, 117–130. [Google Scholar] [CrossRef]
- Gómez-Muñoz, V.M.; Porta-Gándara, M.A.; Fernández, J.L. Effect of tree shades in urban planning in hot-arid climatic regions. Landsc. Urban Plan. 2010, 94, 149–157. [Google Scholar] [CrossRef]
- Shao, J. Calculation of sunshine duration and saving of land use in urban building design. Energy Build. 1990, 15, 407–415. [Google Scholar] [CrossRef]
- La Gennusa, M.; Lascari, G.; Rizzo, G.; Scaccianoce, G.; Sorrentino, G. A model for predicting the potential diffusion of solar energy systems in complex urban environments. Energy Policy 2011, 39, 5335–5343. [Google Scholar] [CrossRef]
- Abd Alla, S.; Bianco, V.; Tagliafico, L.A.; Scarpa, F. An innovative approach to local solar energy planning in Riva Trigoso, Italy. J. Build. Eng. 2020, 27, 100968. [Google Scholar] [CrossRef]
- Mardaljevic, J.; Rylatt, M. Irradiation mapping of complex urban environments: An image-based approach. Energy Build. 2003, 35, 27–35. [Google Scholar] [CrossRef]
- Gadsden, S.; Rylatt, M.; Lomas, K.; Robinson, D. Predicting the urban solar fraction: A methodology for energy advisers and planners based on GIS. Energy Build. 2003, 35, 37–48. [Google Scholar] [CrossRef]
- Antaluca, E.; Merino, L.; Beckers, B. Correlation between Measured and Calculated Solar Radiation Data in Compiègne, France. Available online: http://www.worldses.org/journals/environment/environment-2010.htm (accessed on 18 September 2019).
- Miguet, F. A Further Step in Environment and Bioclimatic Analysis: The Software Tool Solene. Available online: http://www.ibpsa.org/proceedings/BS2007/p126_final.pdf (accessed on 18 September 2019).
- Ayuntamiento de Córdoba (Spain) Plan General de Ordenación Urbanística (PGOU). Available online: http://www.gmucordoba.es/urbanismo/plan-general-de-ordenacion-urbanistica-pgou (accessed on 7 November 2019).
- Instituto de Estadística y Cartografía de Andalucía. Distribución Espacial de la Población en Andalucía. Available online: http://www.juntadeandalucia.es/institutodeestadisticaycartografia/distribucionpob/index.htm (accessed on 7 November 2019).
- Ramírez-Faz, J.; López-Luque, R.; Casares, F.J. Development of synthetic hemispheric projections suitable for assessing the sky view factor on vertical planes. Renew. Energy 2015, 74, 279–286. [Google Scholar] [CrossRef]
- Fernández-Ahumada, L.M.; Casares, F.J.; Ramírez-Faz, J.; López-Luque, R. Mathematical study of the movement of solar tracking systems based on rational models. Sol. Energy 2017, 150, 20–29. [Google Scholar] [CrossRef]
- Márquez-García, A.; Varo-Martínez, M.; López-Luque, R. Solar Energy in Urban Environments: A New Solar Radiation Model for the Analysis of Energy on Façades; LAP Lambert Academic Publishing: Alemania, Germany, 2013. [Google Scholar]
- Duffie, J.A.; Beckman, W.A. Solar Engineering of Thermal Processes: Fourth Edition; John Wiley and Sons: Hoboken, NJ, USA, 2013. [Google Scholar]


| Name of Subroutine | Features |
|---|---|
| Shadow | It takes the value 0 if the point is Shaded and 1 if it is lighted |
| Sky View Factor | Portion of the sky seen from the point [0–0.5] |
| Daily Radiation | Energy in kWh/ m2 with a 6 min integration interval |
| Irradiance | Measure of the irradiance in W/m2 on the point |
| Descriptive Statistic Values | Neighborhood A | Neighborhood B |
|---|---|---|
| N sample | 14,036 | 13,673 |
| Minimum | 0.063 | 0.012 |
| Maximum | 0.528 | 0.540 |
| Average | 0.317 | 0.260 |
| Median | 0.304 | 0.249 |
| Variance | 0.013 | 0.017 |
| Standard Deviation | 0.116 | 0.132 |
© 2019 by the authors. Licensee MDPI, Basel, Switzerland. This article is an open access article distributed under the terms and conditions of the Creative Commons Attribution (CC BY) license (http://creativecommons.org/licenses/by/4.0/).
Share and Cite
Fernández-Ahumada, L.M.; Ramírez-Faz, J.; López-Luque, R.; Márquez-García, A.; Varo-Martínez, M. A Methodology for Buildings Access to Solar Radiation in Sustainable Cities. Sustainability 2019, 11, 6596. https://doi.org/10.3390/su11236596
Fernández-Ahumada LM, Ramírez-Faz J, López-Luque R, Márquez-García A, Varo-Martínez M. A Methodology for Buildings Access to Solar Radiation in Sustainable Cities. Sustainability. 2019; 11(23):6596. https://doi.org/10.3390/su11236596
Chicago/Turabian StyleFernández-Ahumada, L. M., J. Ramírez-Faz, R. López-Luque, A. Márquez-García, and M. Varo-Martínez. 2019. "A Methodology for Buildings Access to Solar Radiation in Sustainable Cities" Sustainability 11, no. 23: 6596. https://doi.org/10.3390/su11236596
APA StyleFernández-Ahumada, L. M., Ramírez-Faz, J., López-Luque, R., Márquez-García, A., & Varo-Martínez, M. (2019). A Methodology for Buildings Access to Solar Radiation in Sustainable Cities. Sustainability, 11(23), 6596. https://doi.org/10.3390/su11236596