1. Introduction
A city is a complex system, a dense combination of people and houses with convenient transportation which covers a certain region [
1,
2,
3]. With the continuous development of cities, different functional regions are gradually formed, such as residential, commercial, and industrial regions, and so on. This also makes the spatial structure of cities more and more complex [
4,
5,
6].
Accurate identification of urban functional regions is of great significance to the correct cognition of the functional structure and spatial structure of cities. The traditional functional urban region survey is usually carried out by a field survey to update the existing historical urban planning map of a city. This process is laborious, and the survey accuracy is subject to subjective factors. The emergence of massive urban big data has created new opportunities for urban geographical computing and analysis, and has provided abundant means for the identification of urban functional regions [
7,
8,
9,
10].
In recent years, many scholars have conduct relevant research on the identification of urban functional zones based on urban big data. Gao et al. [
11] used different types of point of interest (POI) data to apply potential Dirichlet topic modeling and to identify the regions with the same functional attributes. Hu et al. [
12] proposed a method based on the frequency density and POI type ratio which was based on the POI data of a Gaode map, which identified the functional attribute of the regular grid by calculating the frequency and type ratio. Based on POI data, Zhang et al. [
13] used thematic modeling, unsupervised clustering, and visual analysis to map and describe land use. Cai et al. [
14] used the high-order decomposition method to study the crowdsourcing positioning data, based on which the temporal and spatial patterns of human activities were found and the dynamic semantics of urban space was(were) extracted. Chen et al. [
15] proposed an urban functional region division method based on building-level social media data by using the hourly density map of Tencent users. Zhang et al. [
16] proposed a linear Dirichlet hybrid model to decompose mixed urban scenes based on remote sensing image data. Zhou et al. [
17] used the kernel density analysis method to carry out semantic mining on the floating vehicle track data in Shenzhen, and identified the dual commercial centers in Shenzhen. Wang et al. [
18] combined taxi data with POI data to identify urban functional regions through the NMF method and semantic mining. Zhi et al. [
19] used social media registration data to infer urban internal functional regions by k-means algorithm.
In the above research identifying urban functional regions, most of the examples used single-source data, multi-sources data, or multi-source data but the data complementarity was poor. In the research unit division, most of the relevant research used the rule-grid division. The ignoring of the integrity of the internals of the units and the differences between them could lead to big recognition errors and low precision.
To this end, we propose a method of urban functional region identification based on the floating car track data and POI data. There are two main contributions of this research. (1) During the division of research units, based on the concept of the traffic community [
20] and semantic analysis of POI, the research region is divided into several small units by using the main road as the smallest research unit in this study. (2) Meanwhile, dynamic floating car track data and relatively static electronic map POI data are integrated to be used from the perspectives of "dynamic" and "static", so as to improve the identification accuracy of functional regions. This may provide an effective research thread for future exploration of the spatial distribution of urban functional regions. The results show that this method can identify a single functional region and a mixed functional region. It provides an effective research idea of the future exploration of urban functional regions, and can provide a means for future scientific planning of urban functional areas and improvements in the urban land used rate.
The rest of this paper is arranged as follows:
Section 2 reviews the related work of this paper.
Section 3 introduces the research area, data set, and the experimental method.
Section 4 introduces the experimental results and analysis. Finally, we summarize the thesis in
Section 5 and
Section 6.
2. Related Work
In the era of time and space big data, the means of urban-related research are becoming more and more abundant. Some researchers conduct research based on location services, and researchers use in-depth data sets from different sources to conduct in-depth research on human activities. For example: Modsching et al. [
21] proposed a method based on GPS data to track and analyze the spatial behavior of tourists. This method can visualize the display and analysis of the tourist’s activity area, providing an example for the subsequent identification of the activity area. Ratti et al. [
22] graphically demonstrated the human activity trajectory and space-time evolution in Milan, Italy through LBS (Location Based Services) data, and explored how to plan for the future Milan city through this technology. Novak, J et al. [
23] used mobile location data to analyze commuter traffic, and to study commuter and urban functional regions in Estonia. Thomson et al. [
24] used remote sensing and GIS technology to identify potential low-income houses in Bangkok’s metropolitan area. Cai et al. [
25] merge nighttime lighting images with social media data to successfully identify urban multi-centers [
26]. Analysis of employment centers in metropolitan areas found that employment centers have a high degree of agreement with the distribution of economic activities. Marcińczak [
27] uses the census data to analyze the urban form of Central Europe.
In recent research, researchers have seen many innovations in methods for urban functional region identification research. Sun et al. [
28] used three clustering methods to identify urban centers based on social network data. The results show that different types of clustering algorithms are suitable for different types of cities. Kim, H et al. proposed a functional area recognition optimization model and an analysis target reduction method to identify urban functional areas through the indicator of population mobility. The correctness of the model was verified by the data of working distances in Seoul, South Korea and South Carolina, USA [
29]. Song, J et al. explored a method for identifying urban functional regions that combines point of interest data with high-resolution remote sensing images. The high-resolution remote sensing image is used to extract the built-up region and the non-built-up region, and the roof feature of the building is used to divide the research region. Finally, the POI semantic attribute is combined to divide the urban functional region into functional regions such as a residential region, commercial region, and traffic region. This method has been verified in Xiamen, China [
30].
In summary, the research results of urban spatial structure cognition through mass data are very rich. However, as long as a small number of researchers consider the combination of POI data and human trajectory data, the urban functional region is identified. In addition, to the best of our knowledge, few researchers have focused on the division of research units and the analysis of urban mixed functional regions.
3. Materials and Methods
The research area of this paper is located in Chengdu, China. The floating car track data and POI data were used as the experimental data of this study. The traffic community was selected as the smallest research unit in the study area, and the Expectation-Maximization algorithm and Delphi method were used as the main methods of research.
3.1. Study Area
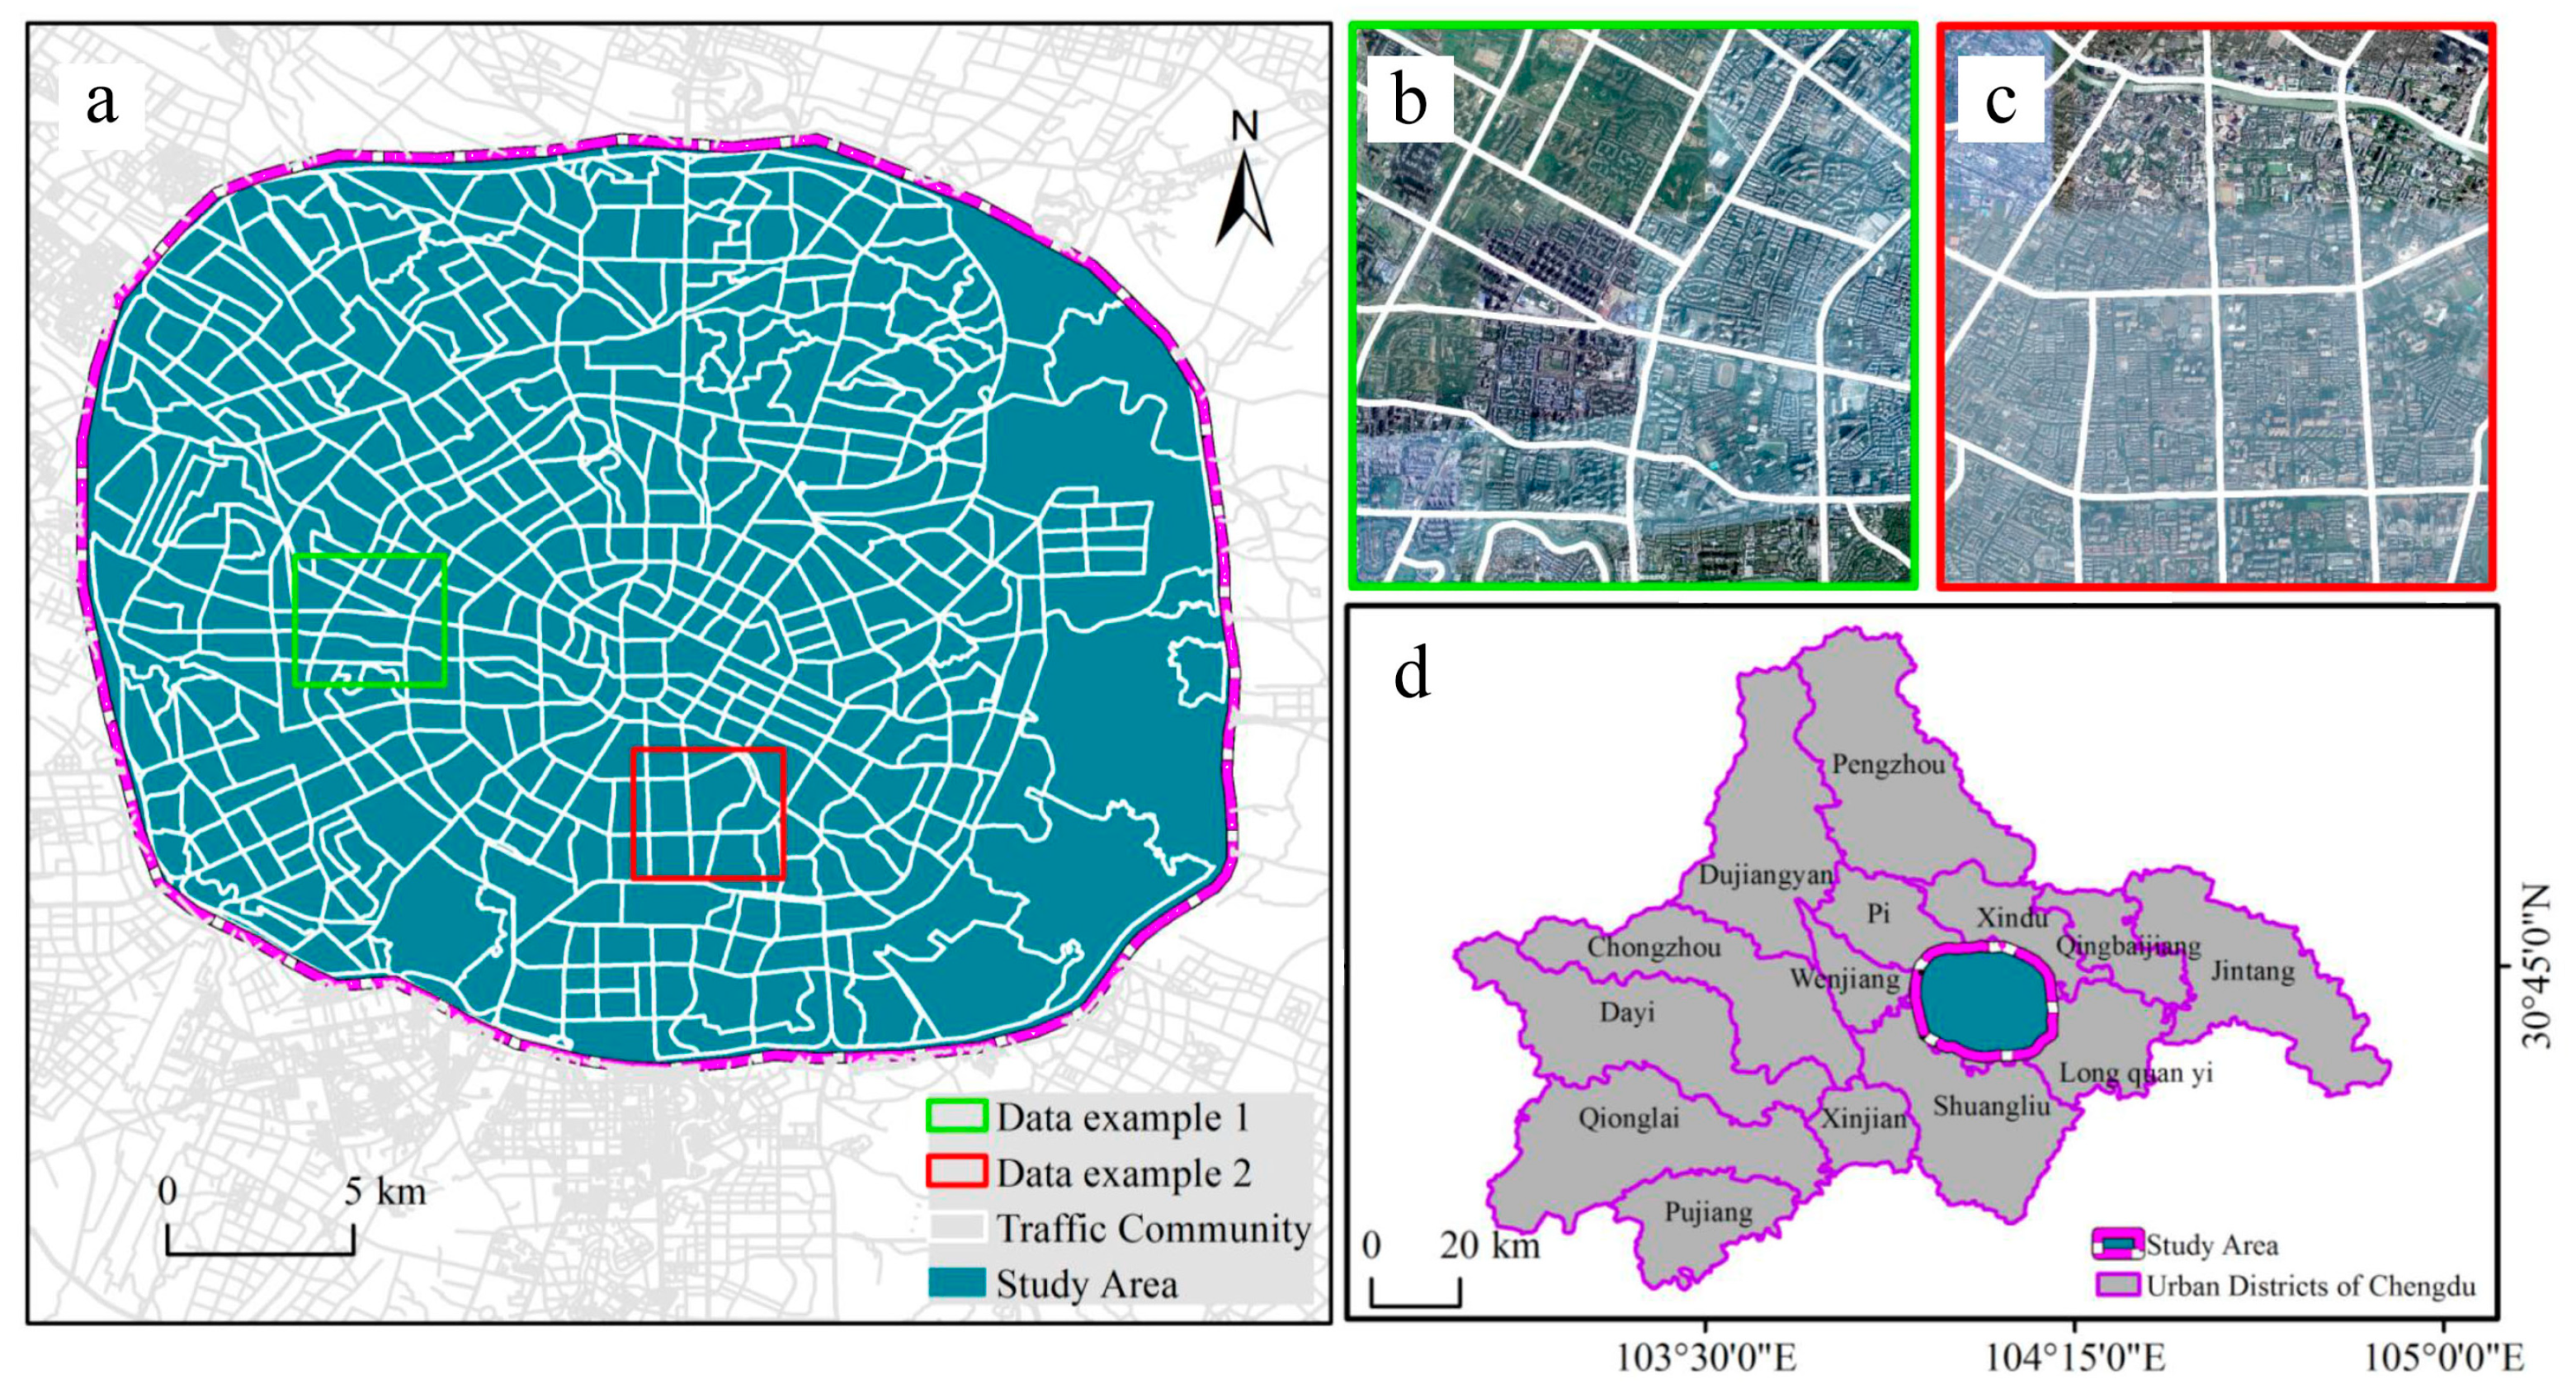
Chengdu is the capital of Sichuan Province, a national central city, and one of the most economically and technologically prosperous regions in China’s western region. In recent years, Chengdu has become more urbanized and the city has expanded rapidly. Studying Chengdu’s urban functional regions will promote the healthy development of Chengdu. It also provides a new way for urban functional area identification in emerging cities in China. As of 2019, the resident population will be nearly 17 million. This paper delineates the research area of Chengdu Third Ring Road as the boundary, including Jinjiang District, Jinniu District, Qingyang District, Wuhou District, Chenghua District, and some regions of the High-tech Zone. This area is the main built-up area of Chengdu, and the research area is shown in
Figure 1.
3.2. Data and Preprocessing
3.2.1. Floating Car Track Data
Didi company is the largest online ride-hailing service platform in China, which is highly recognized by Internet users. The company uses data location data, which is more accurate than traditional taxi data. At the same time, Didi company provides an open data platform, which makes trajectory data acquisition easier. The original floating car data within research regions comes from the trajectory data openly released by Didi Company (
https://gaia.didichuxing.com) on November 2016. The one-week data has been chosen and the temporal sample frequency of the data is 2–4 s. The order data are shown in in
Table 1. The ordering data include the order number, the start and end point coordinates of the order, and the start and end time. A total of 885,387 effective order records were elected. The coordinate data in
Table 1 is under the WGS84 coordinate system. The data format is given in
Table 1 below.
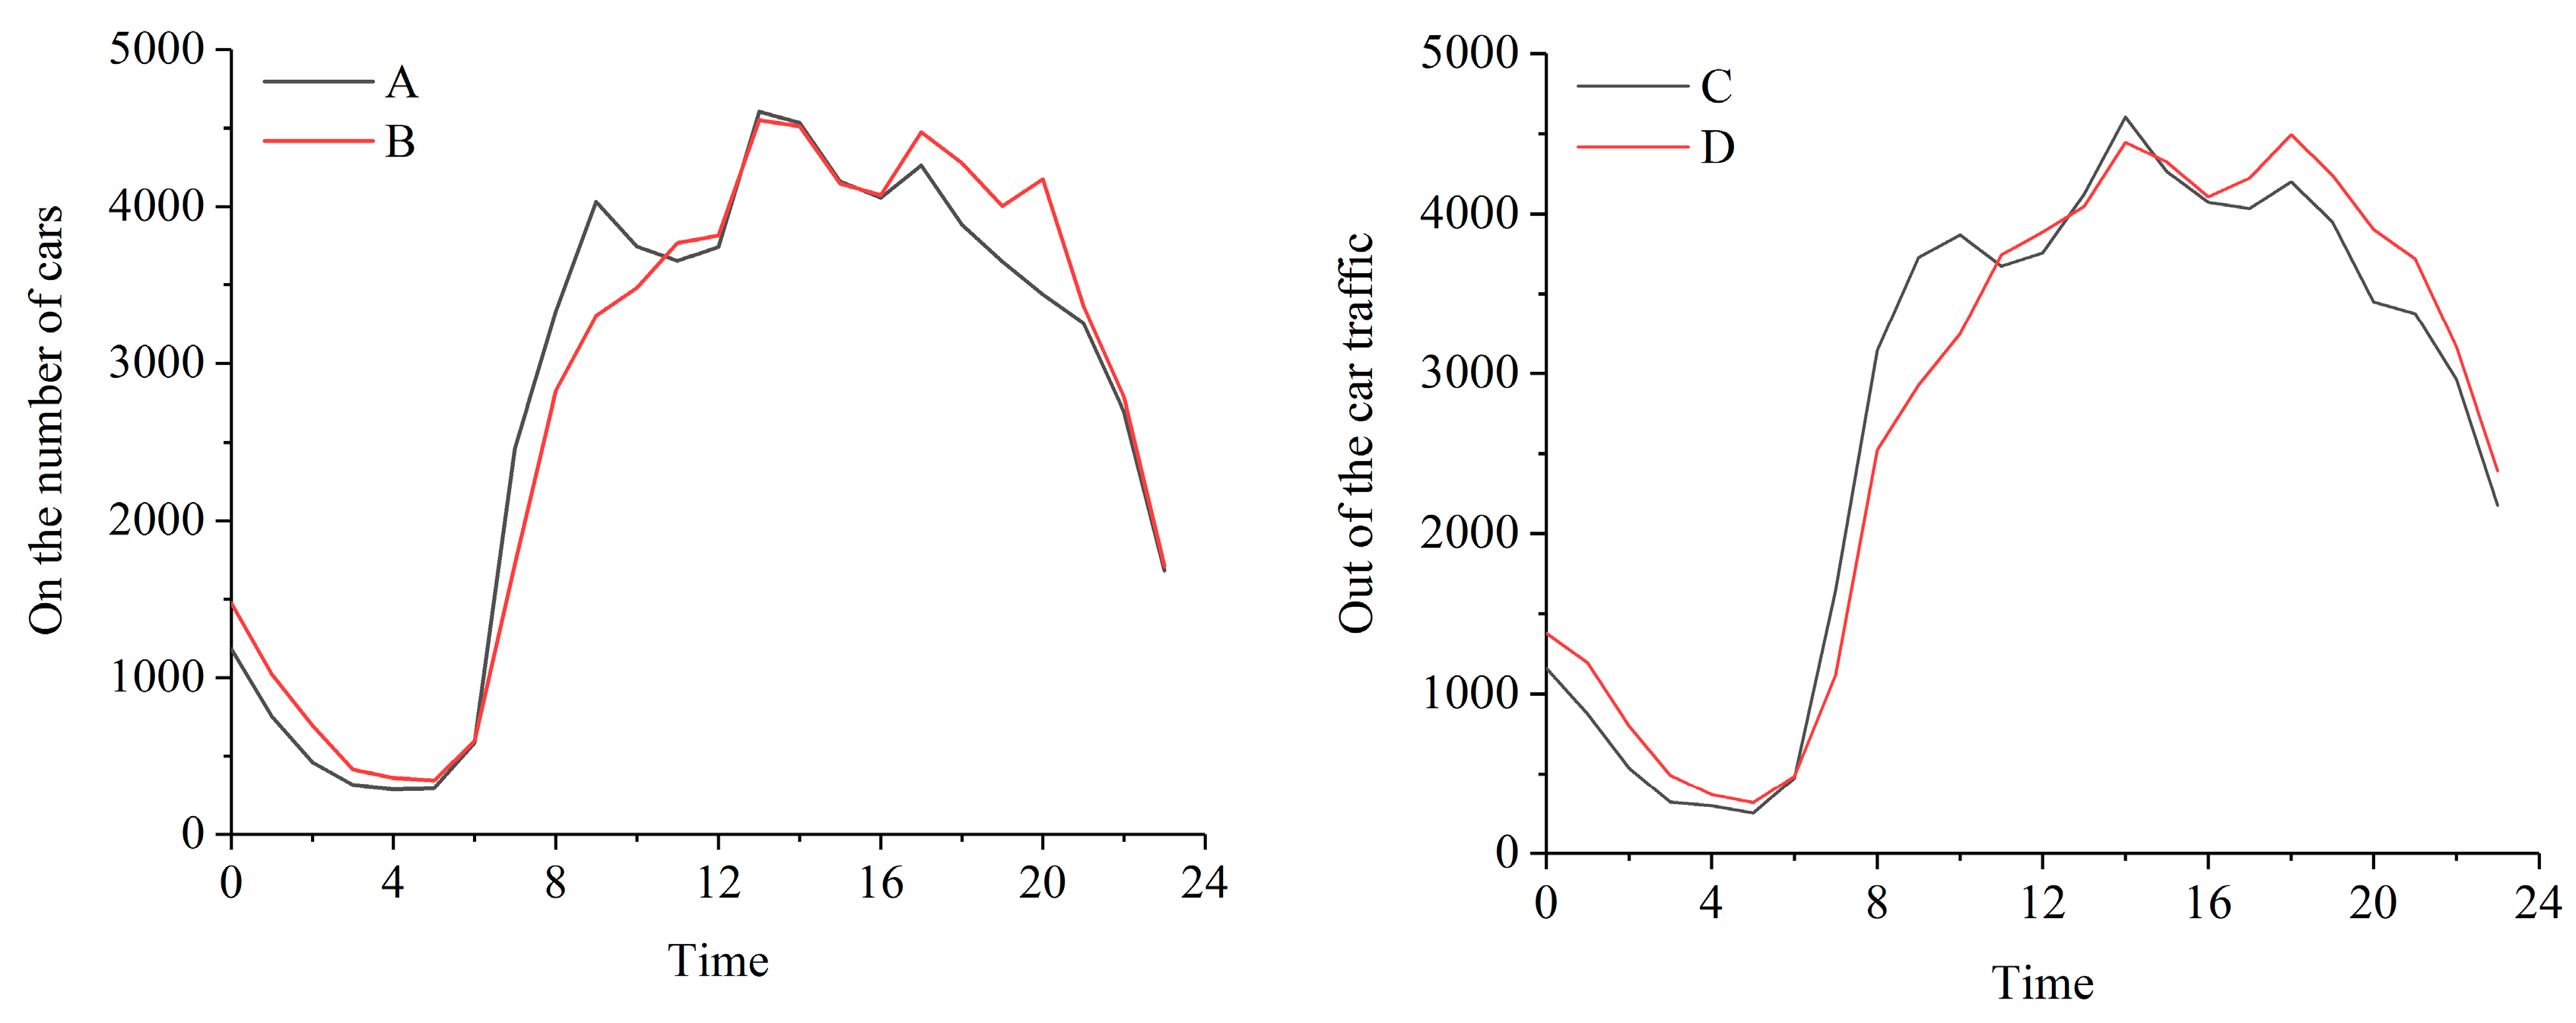
The time series of both numbers of pick-ups and drop-off in one hour during weekdays and weekends are averaged into one day. The differences between time series of numbers of pick-ups on weekdays and weekends are shown in
Figure 2.
From 0:00 to 6:00, both the numbers of pick-ups and drop-offs are slightly higher than during the working day. The number of pick-ups and drop-offs on the working day from 7:00 to 12:00 are slightly higher than that on the weekends. From 17:00 to 24:00, the numbers of passenger pick-ups and drop-offs the weekend are slightly higher than the number during the working day. The morning peak appeared at 9:00–10:30, and the maximum value of the whole day appeared at around 3 o’clock pm. A trough appeared at around 12 o’clock. Floating car passengers generally urban residents and tourists, mostly traveling over and short and middle-length distances. In addition, since Chengdu’s unique climate gets dark later in the day than other parts of China, people often travel later. Secondly, some office workers generally choose public transportation such as the subway to avoid traffic jams. Floating cars are more flexible than public transportation, and the trips are for more specific purposes, so the peak period of floating cars occurs after the general early peaks. The trough around 12 o’clock is mainly attributed to the fact that people travel less frequently during their lunch break. After 5 o’clock, the number of pick-ups and drop-offs on weekends are more important than the numbers on working days, mainly because people conduct more entertainment and leisure trips on weekends. In other periods, the amount of on and off peak traffic during workdays and weekends did not change much, and there was no obvious willingness to shift travel times.
According to the user travel report released by Didi company (
https://www.didiglobal.com/), the averaged numbers of pick-ups and drop-offs over the weekend and weekdays did not present obvious differences, which could be explained by the fact that the users are mainly 20 to 50 years old, meaning they have the abilities and intention to either work during workdays or consume during weekdays. Meanwhile, Chengdu is a famous tourist city in China, and weekend travel volume includes the amount of visiting tourists during weekends.
3.2.2. POI Data
The POI data is a kind of social perception data, which consists of a location recorded by a user at a certain time using a GPS device, and their spatial, temporal, and social attributes. POI data types include corporate companies, financial insurance services, transportation facilities services, science and education cultural services, government agencies and social groups, morning residences, scenic spots, health care services, sport and leisure services, lifestyle services, and shopping services. Traditional socioeconomic data based on location attributes tend to be low-grade, slow to update, and difficult to obtain. However, POI data has the characteristics of easy accessibility, good timeliness, high data precision, and rich data semantics.
Gaode company is a leading provider of digital map content, navigation and location services in China. POI data used in this paper are obtained by using the Gaode map (
http://lbs.amap.com/) API. The data acquisition is during September 2016. After data cleaning, coordinate conversion, and finishing, a total of 205,314 POI data were included. The POI data contain information such as a name, category, coordinates, and classification. Referring to the 2011 “Urban Land Classification and Planning and Construction Land Use Standards”, the original POI data is divided into residential land POI, public service and management land POI, commercial facility land POI, office land POI, transportation facility land POI, green space, and square land. There are six categories of POI. The classification is shown in
Table 2.
3.3. Methods
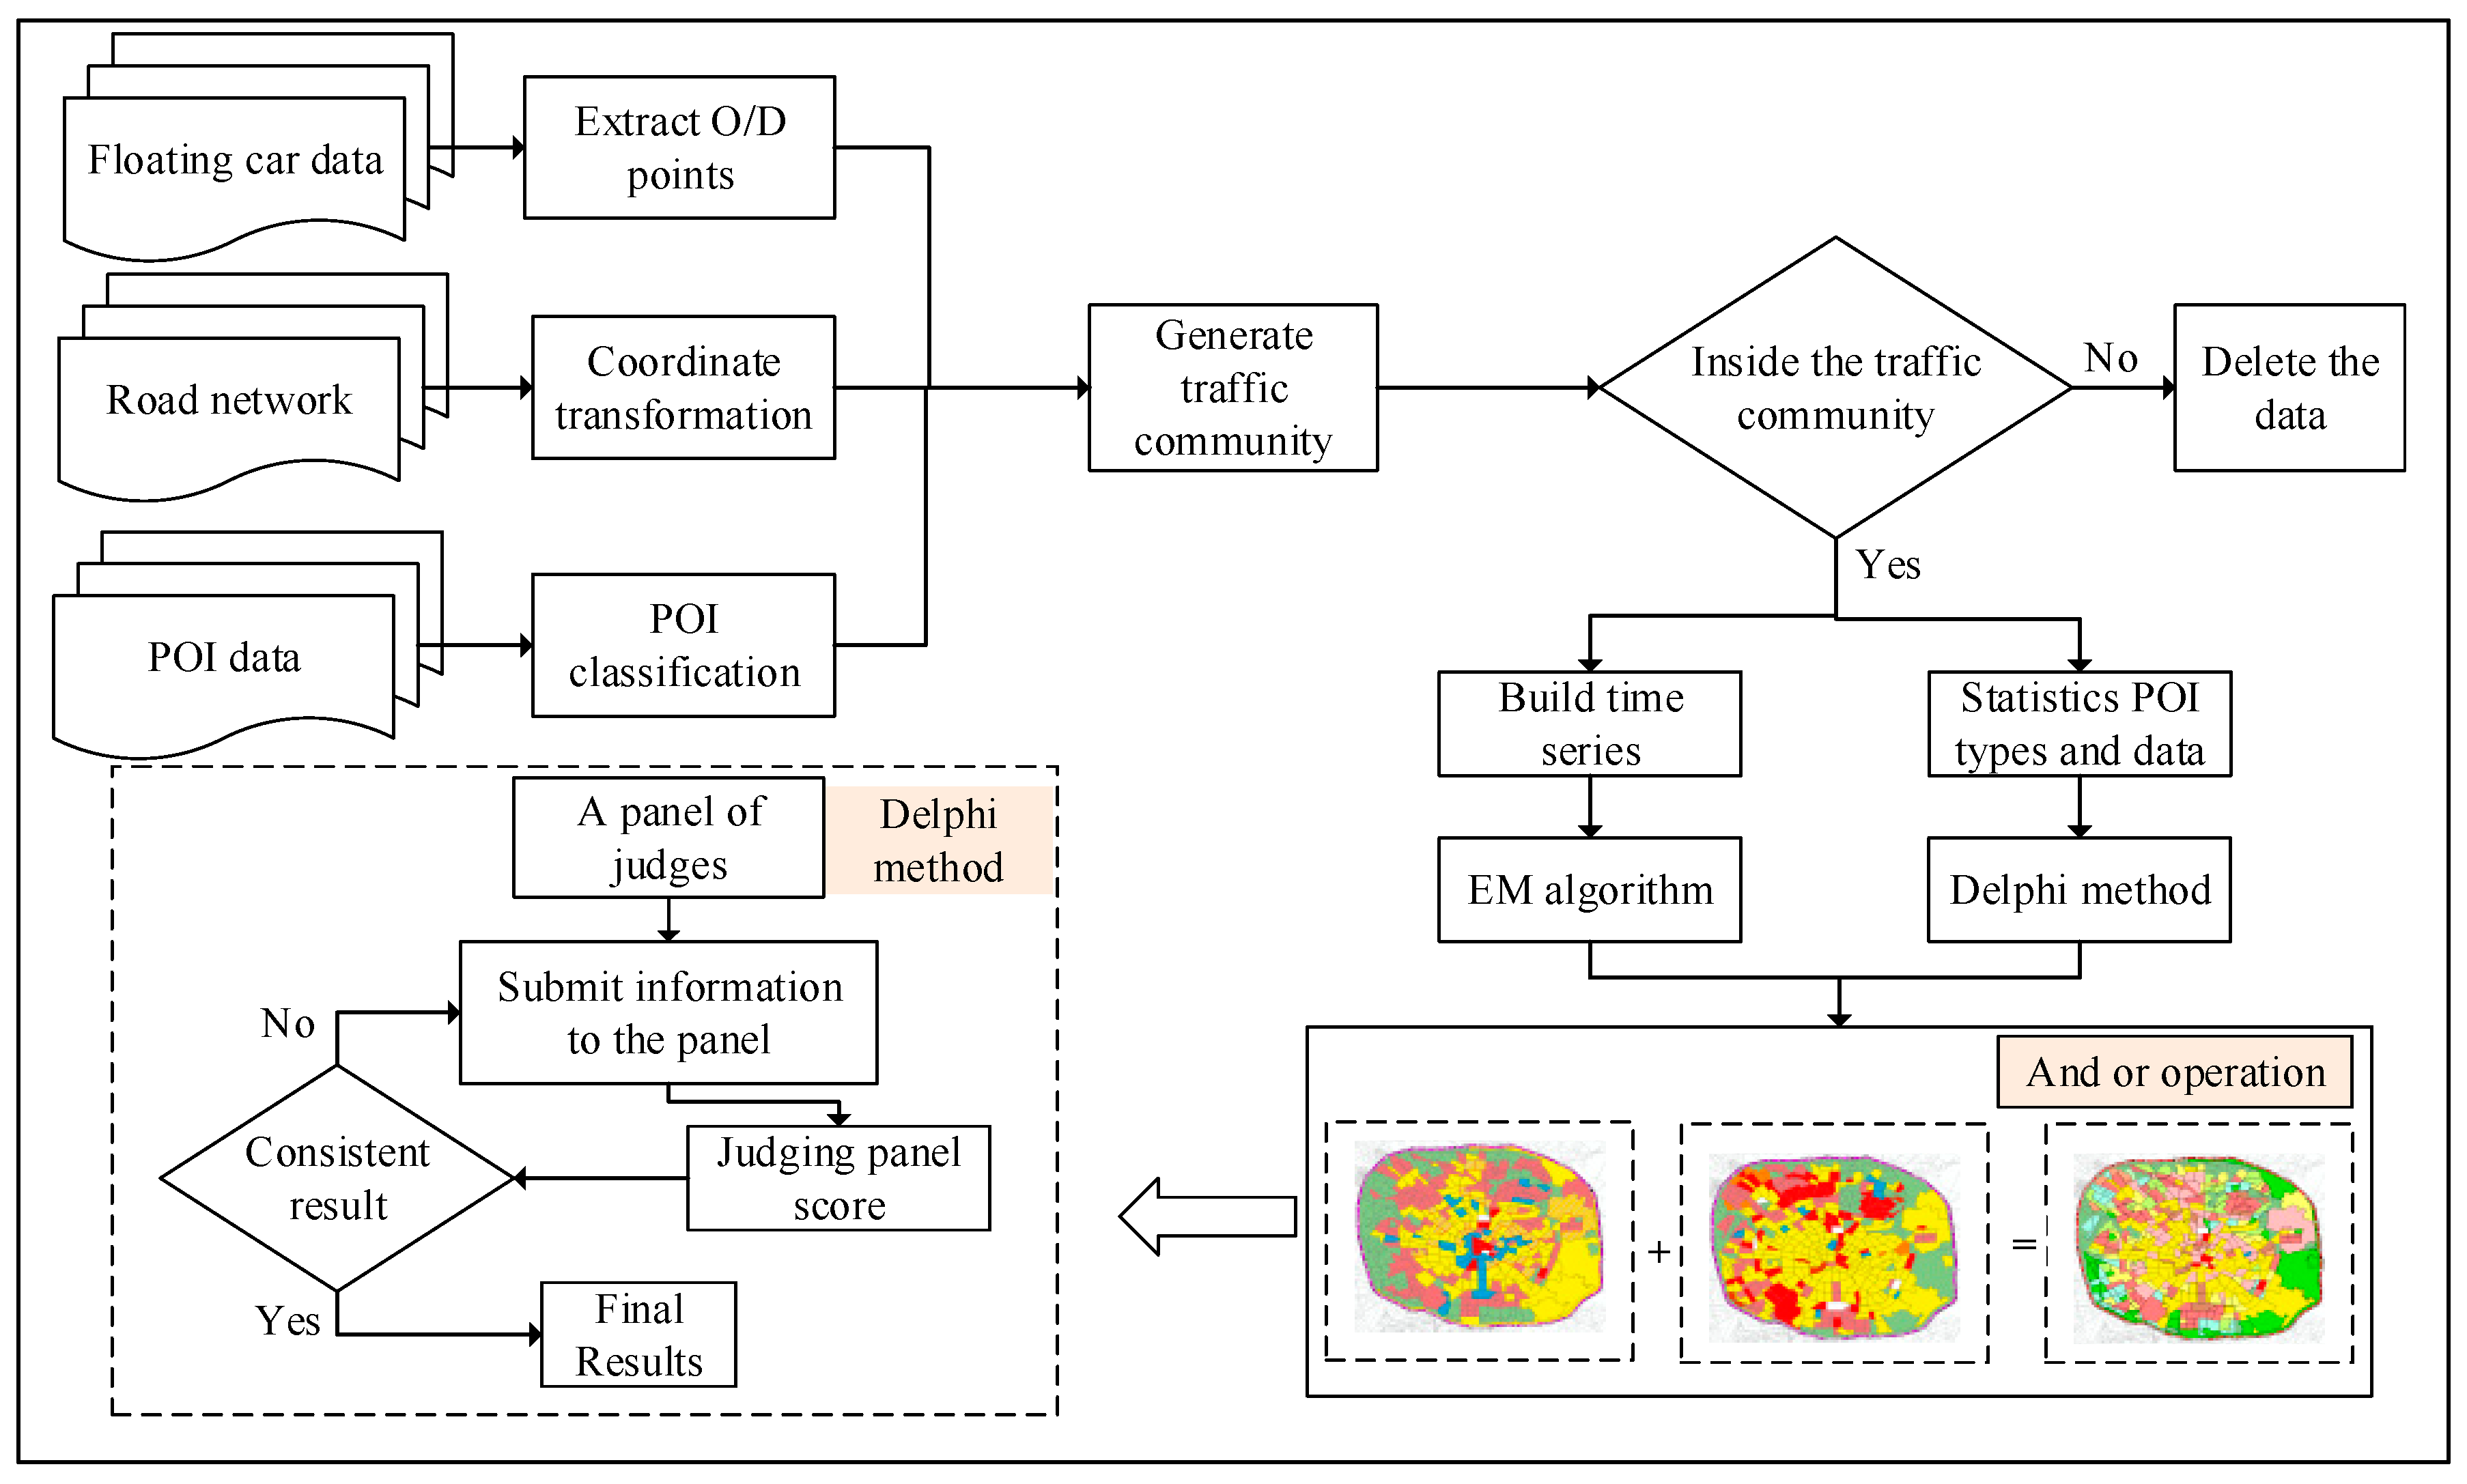
The technical flow chart is shown in
Figure 3. In this paper, the first step is to use the high-level road network to generate traffic communities, and the traffic communities are used as the research units of this paper. The second step is to construct a time series based on a floating vehicle trajectory and to use cluster analysis on it with a maximum expectation algorithm for identifying urban functional regions [
31]. In the third step, a method of semantic information mining based on POI data density and type using the Delphi method [
32] is proposed. Finally, the final recognition result is obtained by using the two results.
3.3.1. Divide Study Region into Research Units
Urban blocks have received increasing attention in urban research [
33,
34,
35]. This paper selected the traffic community as the research unit based on the concept of urban block. Because the traffic community has a set of similar traffic characteristics and traffic associations within a definite region, and the division of the traffic community is coordinated with the census cell boundary [
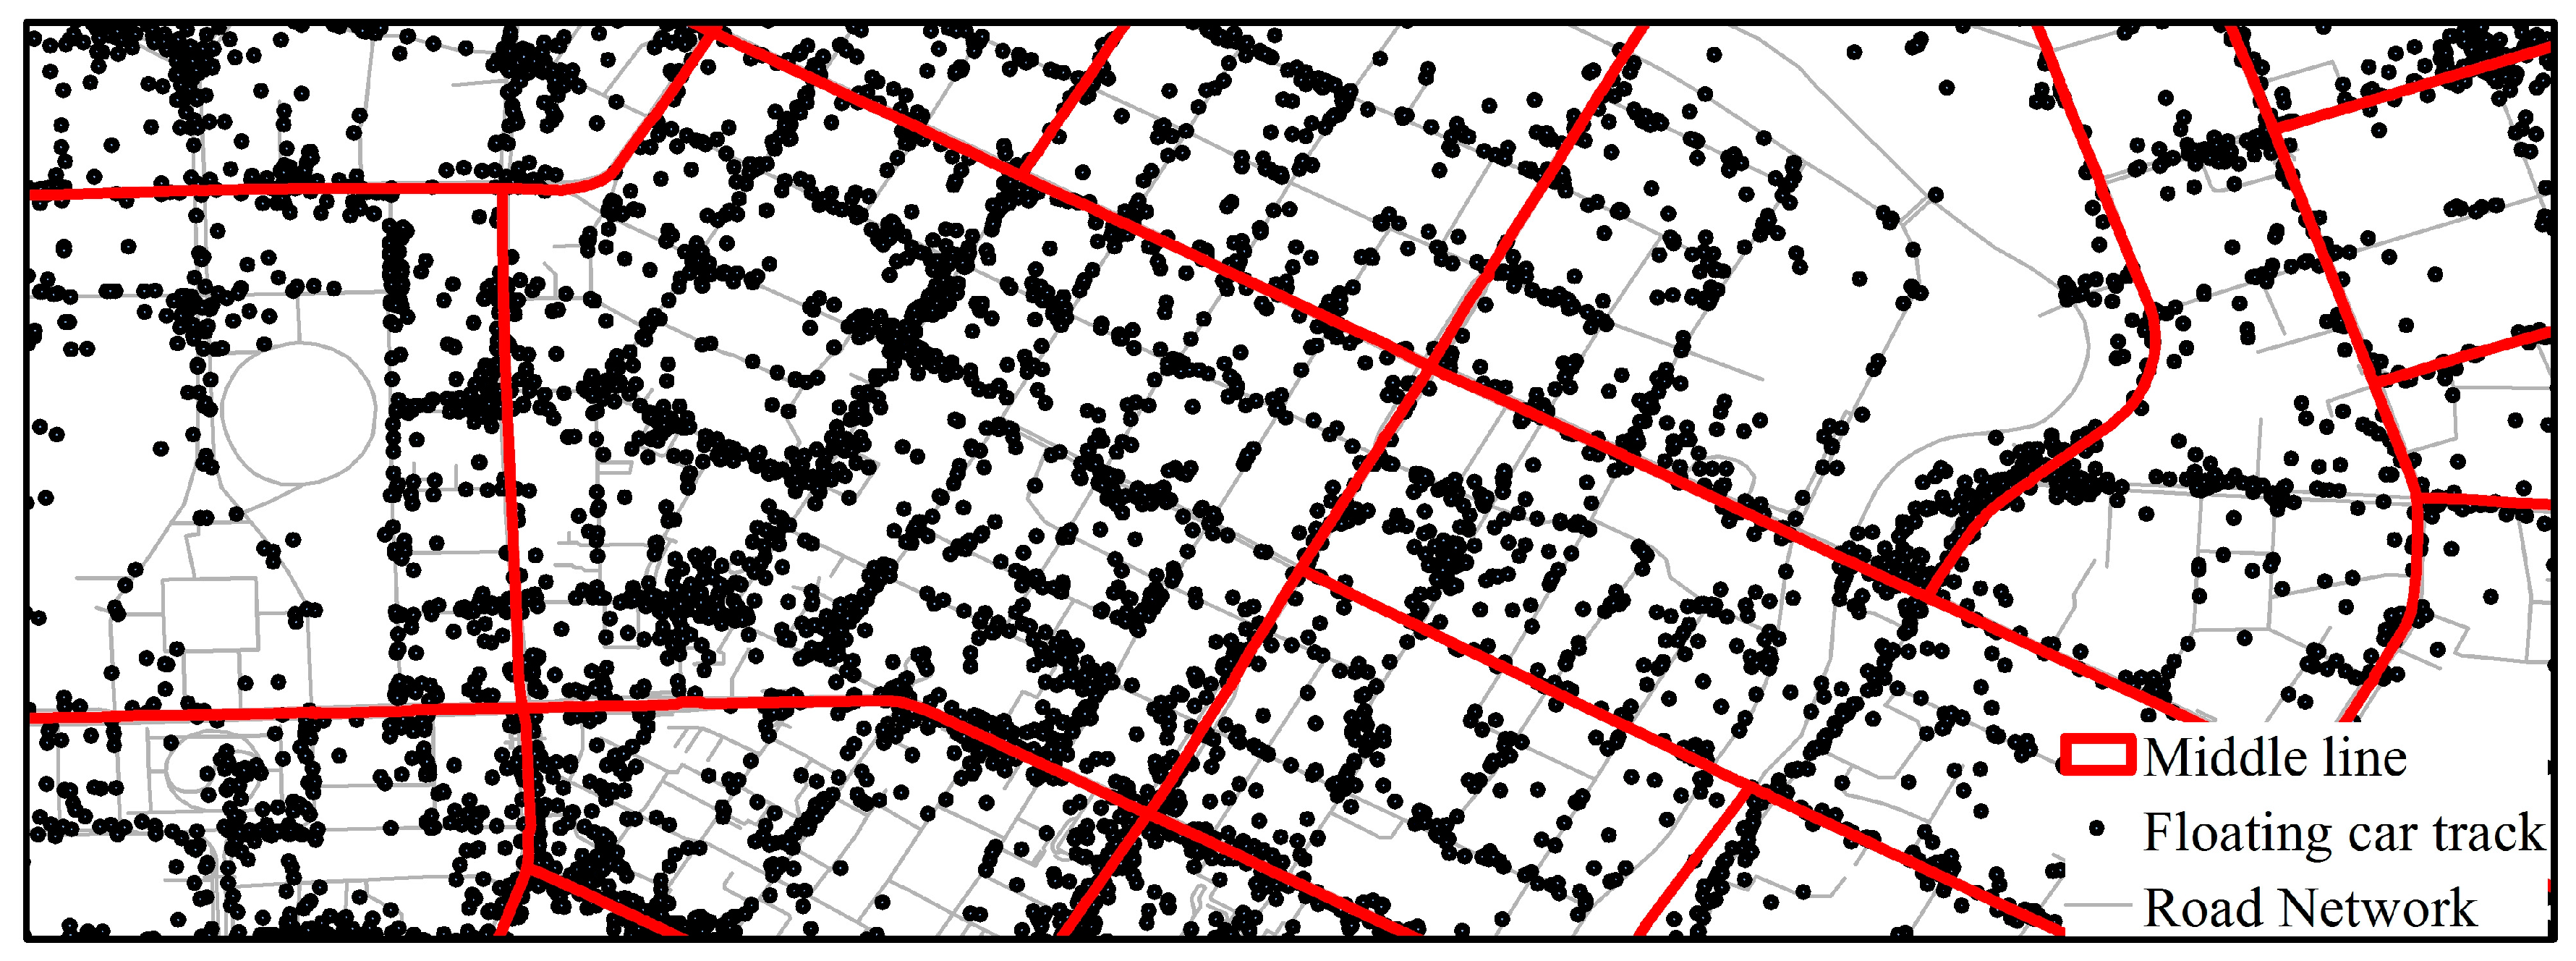
36]. The main roads within the study region were used to partition it into research units. Since the floating vehicle trajectory data is distributed on both sides of the road, the middle line of the extracted main roads was used as community boundaries, and the redundant part was manually modified as shown in
Figure 4, with 612 traffic communities obtained. The region of traffic communities between the first ring of the third ring traffic community is getting bigger and bigger, which is consistent with the increasingly sparse high-level roads in Chengdu.
3.3.2. Build a Traffic Community Net Traffic Time Series
After analyzing the distribution characteristics of the floating car data recording the getting on and off time at different periods, it is ideal to divide the data into two groups for processing in accordance with working days and weekdays, and the hourly traffic volume of each traffic community is first counted. The traffic volume represents the traffic flow in the traffic community, while the amount of traffic represents the inflow [
37]. The formula for establishing the net traffic in a traffic community is as shown in Equation (1)
where:
represents the traffic community number (
= 1, 2 …, 612);
represents time (
= 1, 2 …, 24);
represents the traffic flow of the community;
represents the amount of drop-offs;
represents the amount of pick-ups.
Then, the daily average number of time of pick-ups and drop-offs on working days and weekends is calculated. Finally, the two groups of time series of 612 traffic community working days and weekends are clustered.
3.3.3. Time Series Clustering Algorithm Selection
Cluster analysis is used to divide the research data set into several clusters, and the objects within each cluster are similar. In the research of urban functional region identification, the clustering algorithm has been widely used in various forms, such as the K-mean [
38], K-median [
39], and OPTICS clustering algorithm [
40].
In this paper, the Expectation-Maximization algorithm (EM) is used to cluster time series. The EM algorithm starts from the initial value until convergence, and the EM algorithm is relatively scalable and efficient for processing large data sets. And it is more suitable for high dimensional data clustering. The EM algorithm first calculates the network traffic of each traffic community in the E step, and cluster traffic communities in accordance to the net traffic, and then performs the M step to assign the K value to a similar traffic community based on their attributes. The determination of the K value needs to consider the characteristics of the data set, the purpose of the classification, and the effectiveness of the final clustering effect. This paper mainly uses the contour coefficient Silhouette [
41] and the error square sum (SSE) to select the optimal aggregation and the number of classes. Due to the concentrated sample data set, there are many regions with a net traffic value of zero. Therefore, we divide the regions with a residual flow of zero value into one class. The calculated clustering contour coefficient value and SSE value for other traffic communities is shown in
Figure 5. As can be seen from the figure below, when the K value is equal to two values, the contour coefficient and the sum of error square begin to decrease. When K = 6, the inflection point appears. It is clear that the larger the contour coefficient and the smaller the squared error, the better the clustering effect. So in this paper, the number of clusters K is taken as a value of six.
3.3.4. Delphi Method
The Delphi method is a mutually anonymous expert scoring method, which is especially effective in improving our prediction of problems, opportunities, solutions, or development [
42]. POI data in cities mainly refer to activity regions that are highly relevant to people’s daily lives. By combining specific POI data, the semantic information of POI data can be mined. The Delphi method is used to determine the inner functional regions of the city. In this experiment, five doctors and 10 postgraduates of urban planning and geographic information were selected to form the evaluation group, which scored the importance ratings of different types of POI data. Finally, this method was used to calculate the score of every kind of POI data in accordance with the summary of previous rating result. The types of POI data whose standard deviations are within a reasonable range interval were retained, otherwise they have been resubmitted to the expert group for evaluation. Then the means of scores of POI data types within a tolerable range were retained as the empirical values. The empirical values of various types of POI are given in
Table 3.
The number and category of POI are important parameters while identifying the functional region properties of each traffic community. And the ratio of POI functions in the traffic community is calculated and analyzed to calculate the Functional Properties (FP) value of each community district. The calculation formula of function attribute value is the following:
where:
represents the POI category;
represents the number of the category;
C represents the experience value;
Count represents the number of calculations;
n represents the number of POI categories in the traffic community.
Therefore, in accordance with the empirical formula of the value of the functional attributes of the traffic community, the value of the functional attributes of each traffic community can be calculated. Thus this paper achieved the functional region recognition of the research region.
4. Results
4.1. Clustering Algorithm Recognition Result
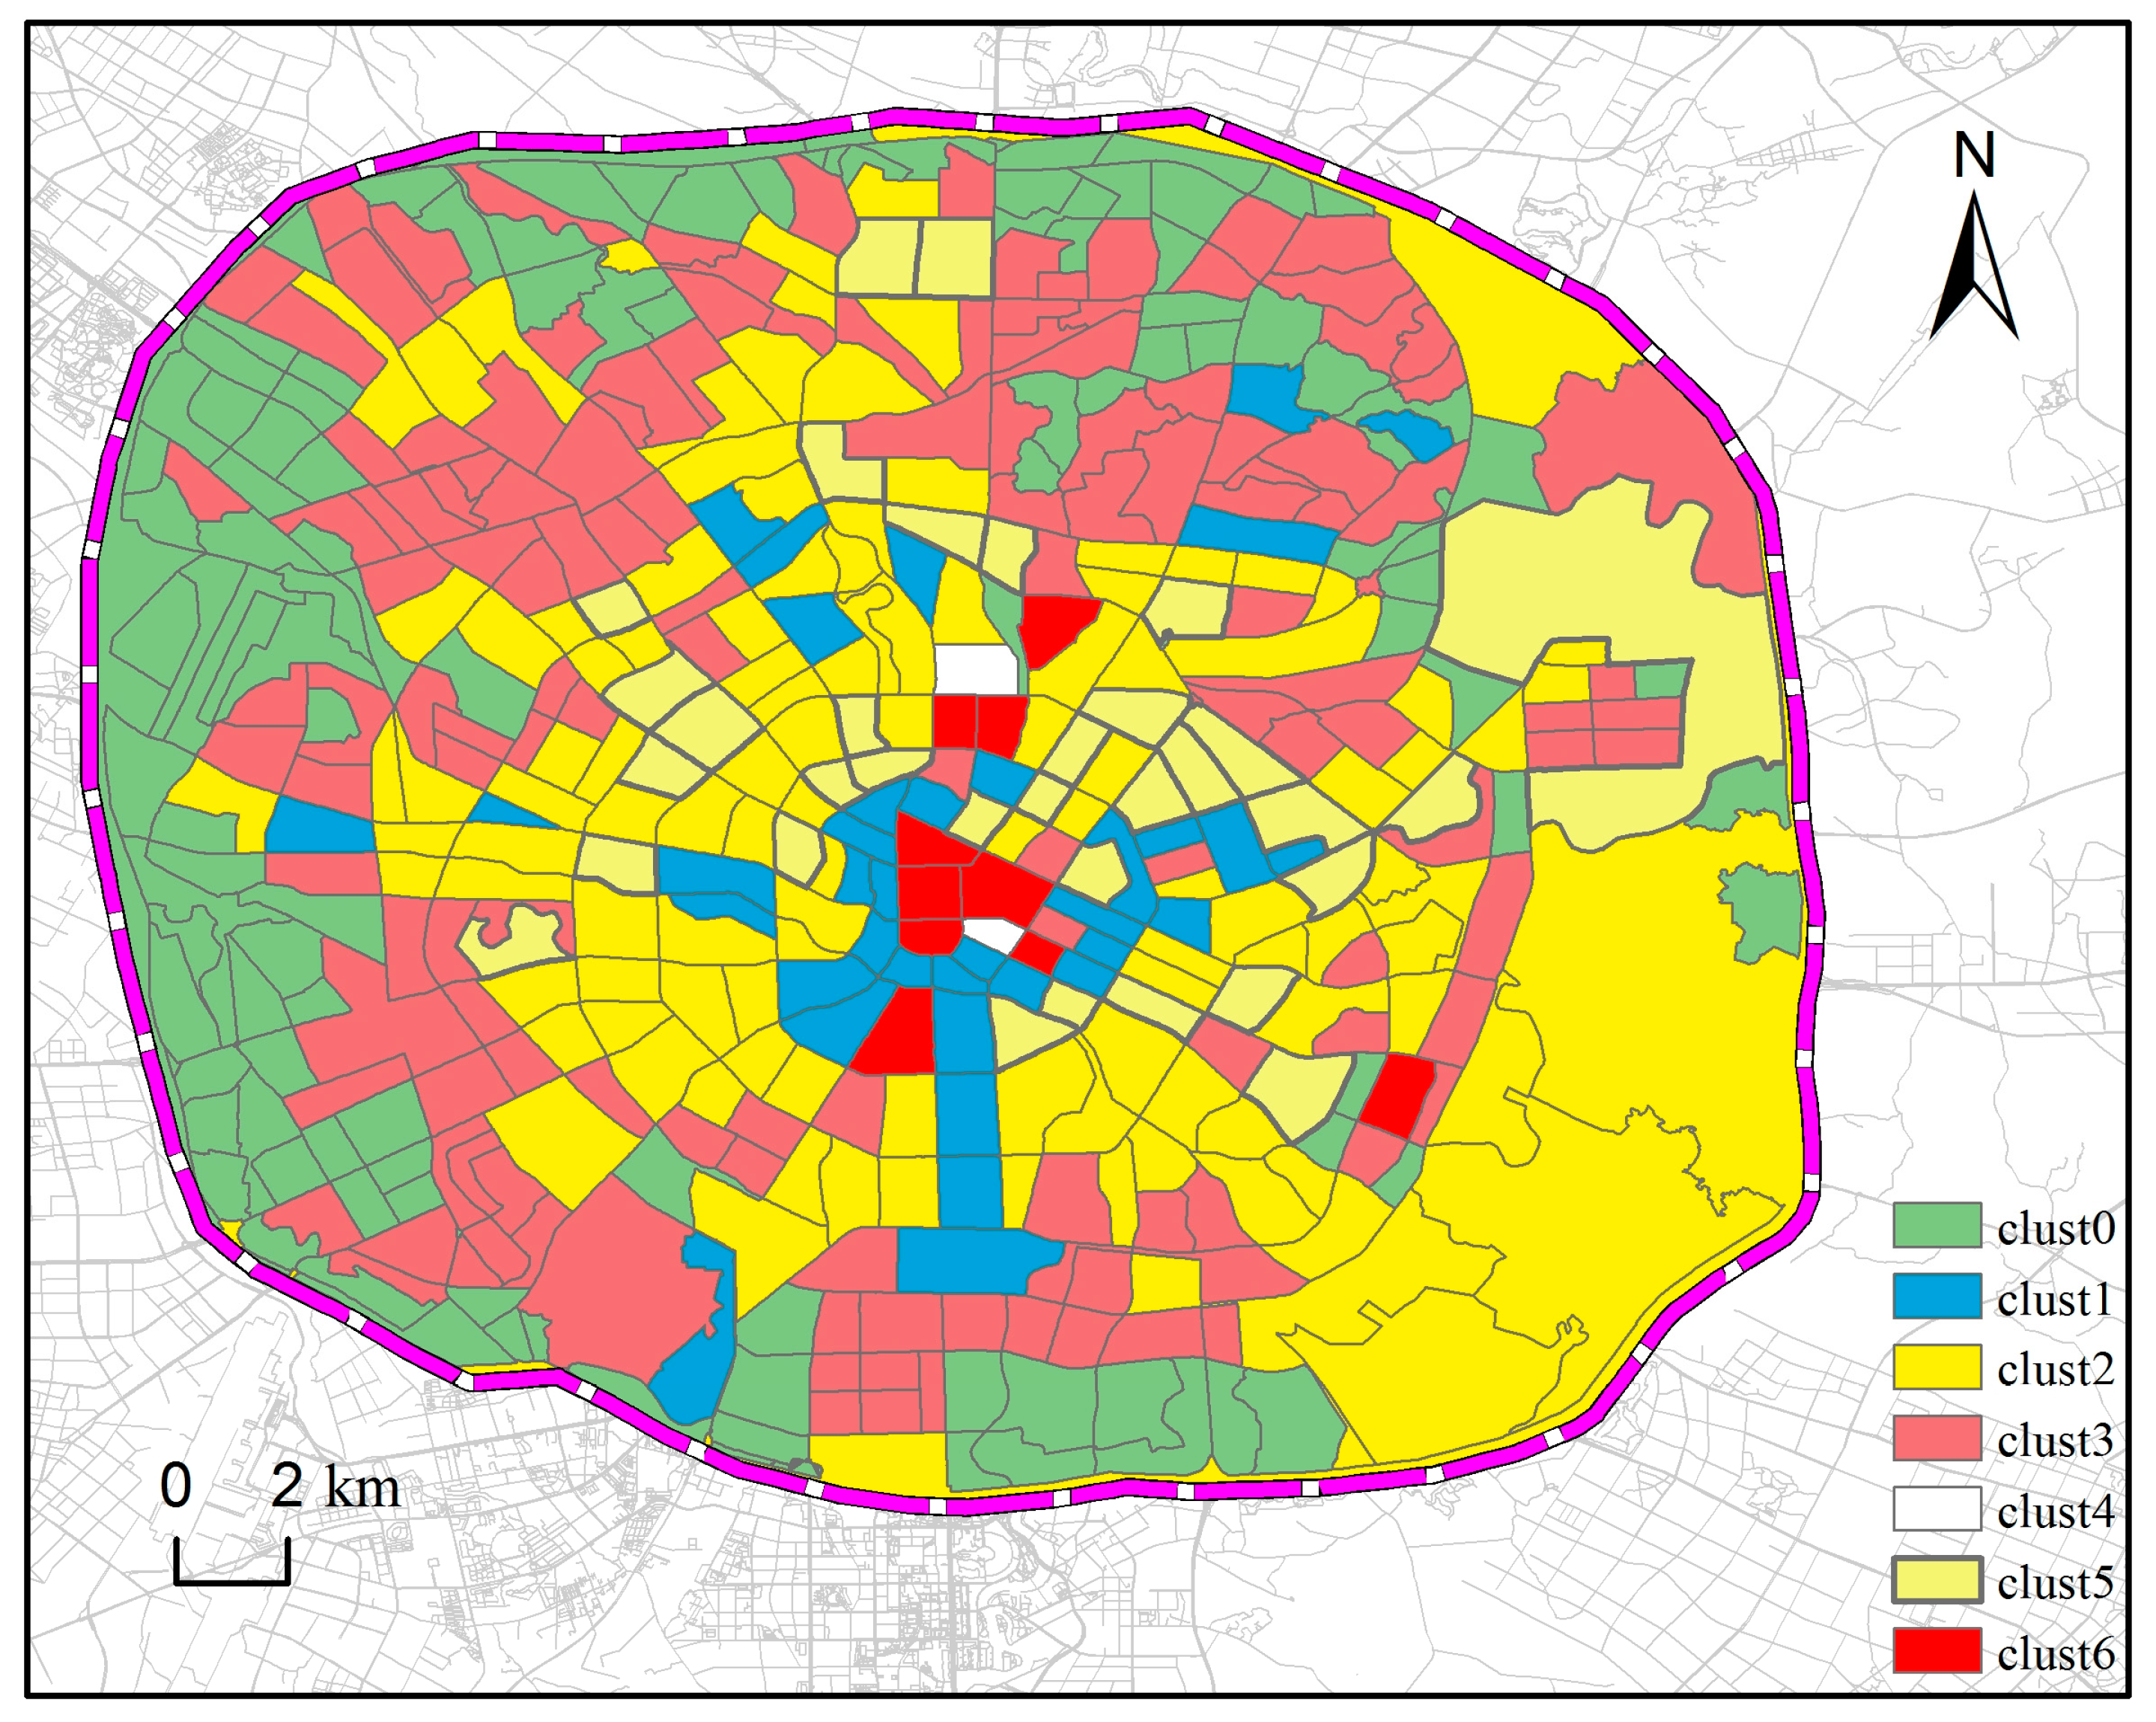
Through the establishment of a time series, the EM clustering algorithm is selected to identify the functional regions of the clustering results. This can be seen in
Figure 6.
Through multiple iterations, the variety of clusters (clust0–clust6) are obtained. From
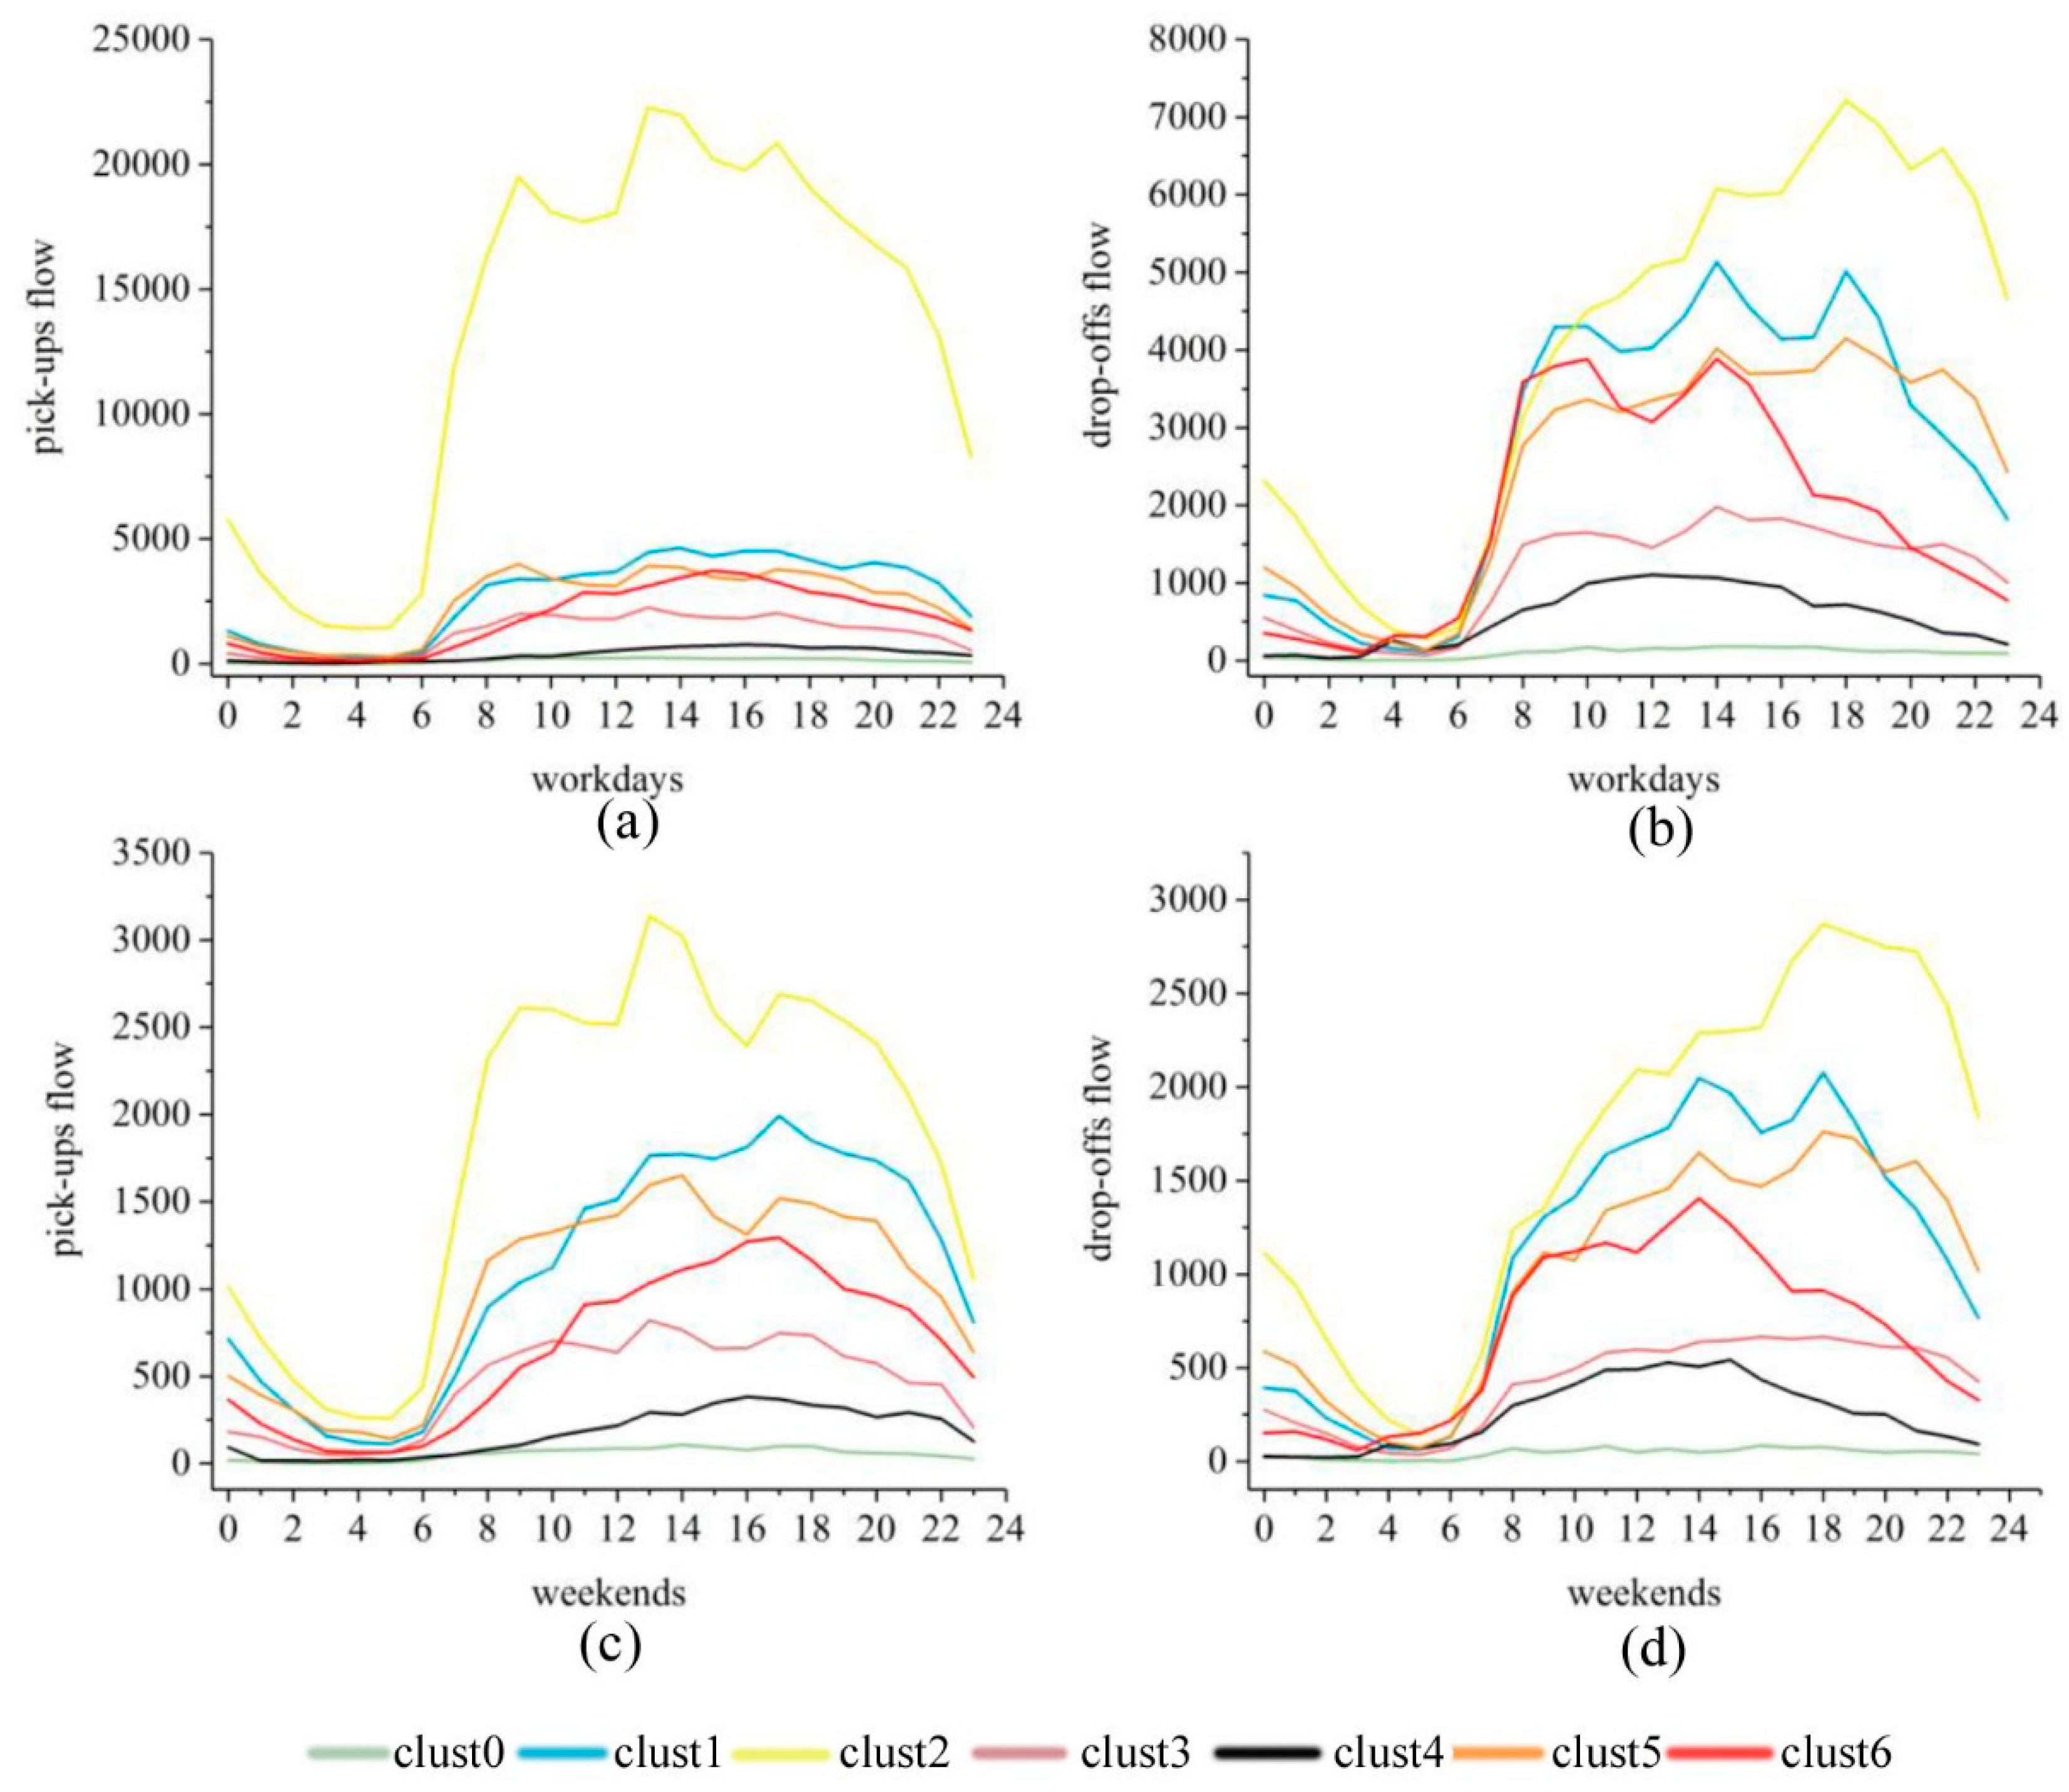
Figure 6, it can be found that the main functional regions of Chengdu are roughly concentric circles distributed around the city center. Among them, clust0 category accounts for 21.36% of the total region, clust1 category accounts for 5.93% of the total region, clust2 category accounts for 34.50% of the total region, clust3 category accounts for 26.87% of the total region, clust4 category accounts for 0.28% of the total region, clust5 category accounts for 9.39% of the total region, and clust6 category accounts for 1.66% of the total region. Then we aggregate the pick-ups and drop-offs records within the same cluster into the flows, as is shown in
Figure 7.
(1) Green land Plaza land (clust0). The clust0 category is the category with the least numbers of pick-ups and drop-offs at any time, indicating that the traffic is sparse and mainly located at the edge of the Third Ring.
(2) Public service management and public service facility land (clust1). The clust1 category has obvious peaks after 8:00 on weekdays, and there is a clear downward trend after 20:00, indicating that the region is mainly used by public service agencies, schools and hospitals, and the main flow of people involves students and is transactional.
(3) Living land (clust2). The clust2 category distribution occupies most of the main urban regions. There are many mature residential regions in the region. The clust2 region is also the region with the largest flow of people. The peaks of the workday appear at 8:00–9:00, 13:00–14:00, and the 18:00–22:00 period, the three periods coinciding with the commuting period. At the same time, on the rest day, the numbers of pick-ups and drop-offs in the clust2 region was significantly reduced, and there was no obvious peak travel time.
(4) Industrial and logistics land (clust3). The clust3 category is mainly distributed outside the residential region, there is no obvious peak on working days and rest days, and the flow of people is stable.
(5) Land for transportation facilities (clust4). The clust4 category has a small region with only two plots. The flow of a single plot is large and the number of vehicles getting on and off is large. In the morning and evening, the flow of people is relatively small, and the characteristics of the region are consistent with traffic facilities such as railway stations.
(6) Commercial mixed land (clust5). The clust5 category is mainly distributed in the mature residential region, with peaks in the off-duty period between 12:00–14:00 and around 18:00, which is similar to the outflow volume of the working day and the outflow volume of the residential region; from 8:00–21:00 time period, the amount of drop-offs on the day of rest fluctuates, and the amount of drop-offs on the rest day is similar to that of the business district. This shows that there is mixed land for residential and commercial functions.
(7) Commercial and office land (clust6). The clust6 category is distributed in the center of the city. The peak of getting off and landing on the rest day is obviously staggered, and the flow of people is large. The peak of the drop-offs is around 10:00, and the peak of the pick-ups is around 15:00. This indicates a significant consuming and shopping pattern rather than a commuting pattern and furthermore implies the dominance of commercial regions in the cluster.
4.2. Identification Results Based on POI Density and Type
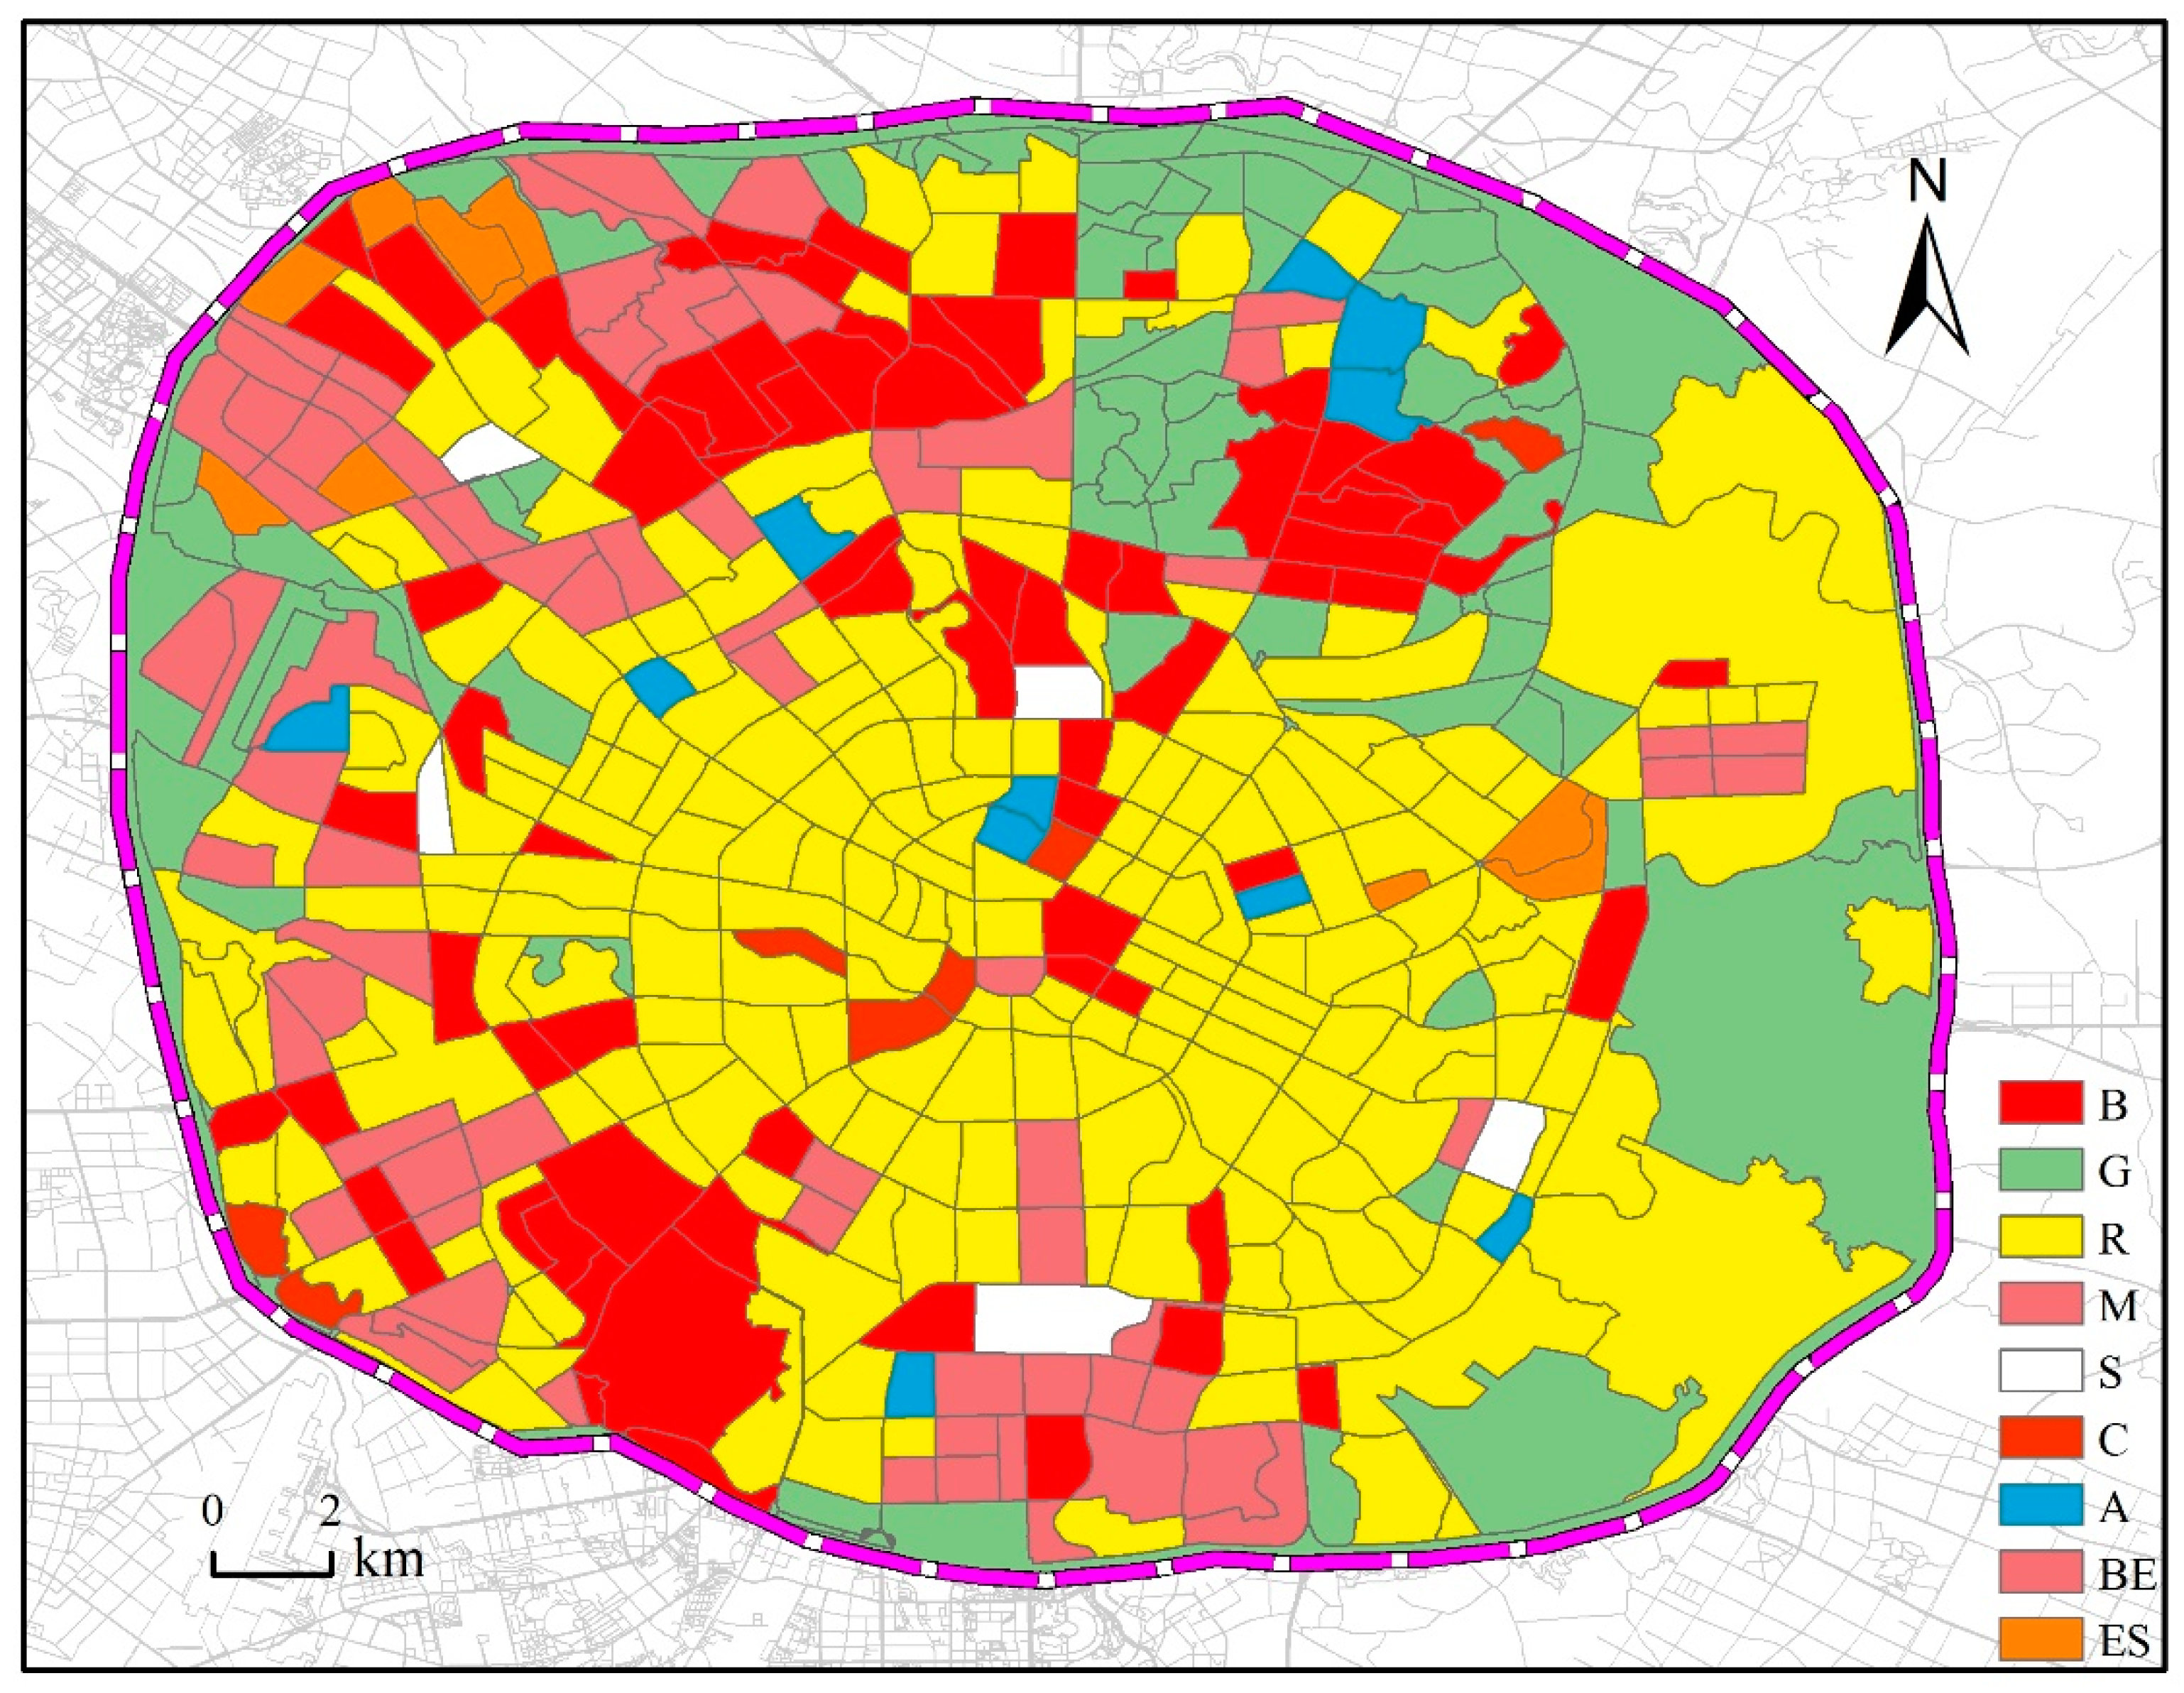
According to the number and type characteristics of the POI in the study region, the semantic information mining of the POI data inside each traffic community is carried out, and the functional zoning map of the research region is obtained, as shown in
Figure 8. We identified nine types of land for commercial office land, green space plaza land, residential land, industrial logistics land, land for important transportation facilities, land for commercial enterprises, land for education and scientific research, land for cultural relics, and land for public facilities. Commercial office land appears in urban centers and residential land; Green space plaza land is mainly located along the Third Ring Road; residential land occupies most of the urban regions; industrial logistics land mainly appears in the northern part of the Third Ring Road; important transportation facilities are evenly distributed in urban regions; The urban regions of enterprise land are less distributed, mainly distributed in the periphery of residential regions; the educational and scientific research land is mainly distributed in the northwest of the study region, around the green land park; the cultural relics land is mainly distributed in the downtown region; the public facilities land is accompanied by the green land square. Commercial office land accounts for 14.41% of the total area, green space plaza land accounts for 21.95% of the total area, residential land accounts for 45.29% of the total area, and industrial logistics land accounts for 3.59% of the total area. Land for important transportation facilities accounts for 1.17% of the total area, land for commercial enterprises accounts for 9.40% of the total area, land for education and scientific research accounts for 1.68% of the total area, land for cultural relics and landscape accounts for 0.94% of the total area, and land for public facilities accounts for 1.59% of the total area.
B stands for commercial office space; G stands for green square; R stands for residential land; M stands for industrial logistics land; S stands for transportation facilities; C stands for cultural relics and landscape land; A stands for land for public service management and facilities; BE stands for commercial enterprises; ES stands for educational facilities.
4.3. Final Identification Result
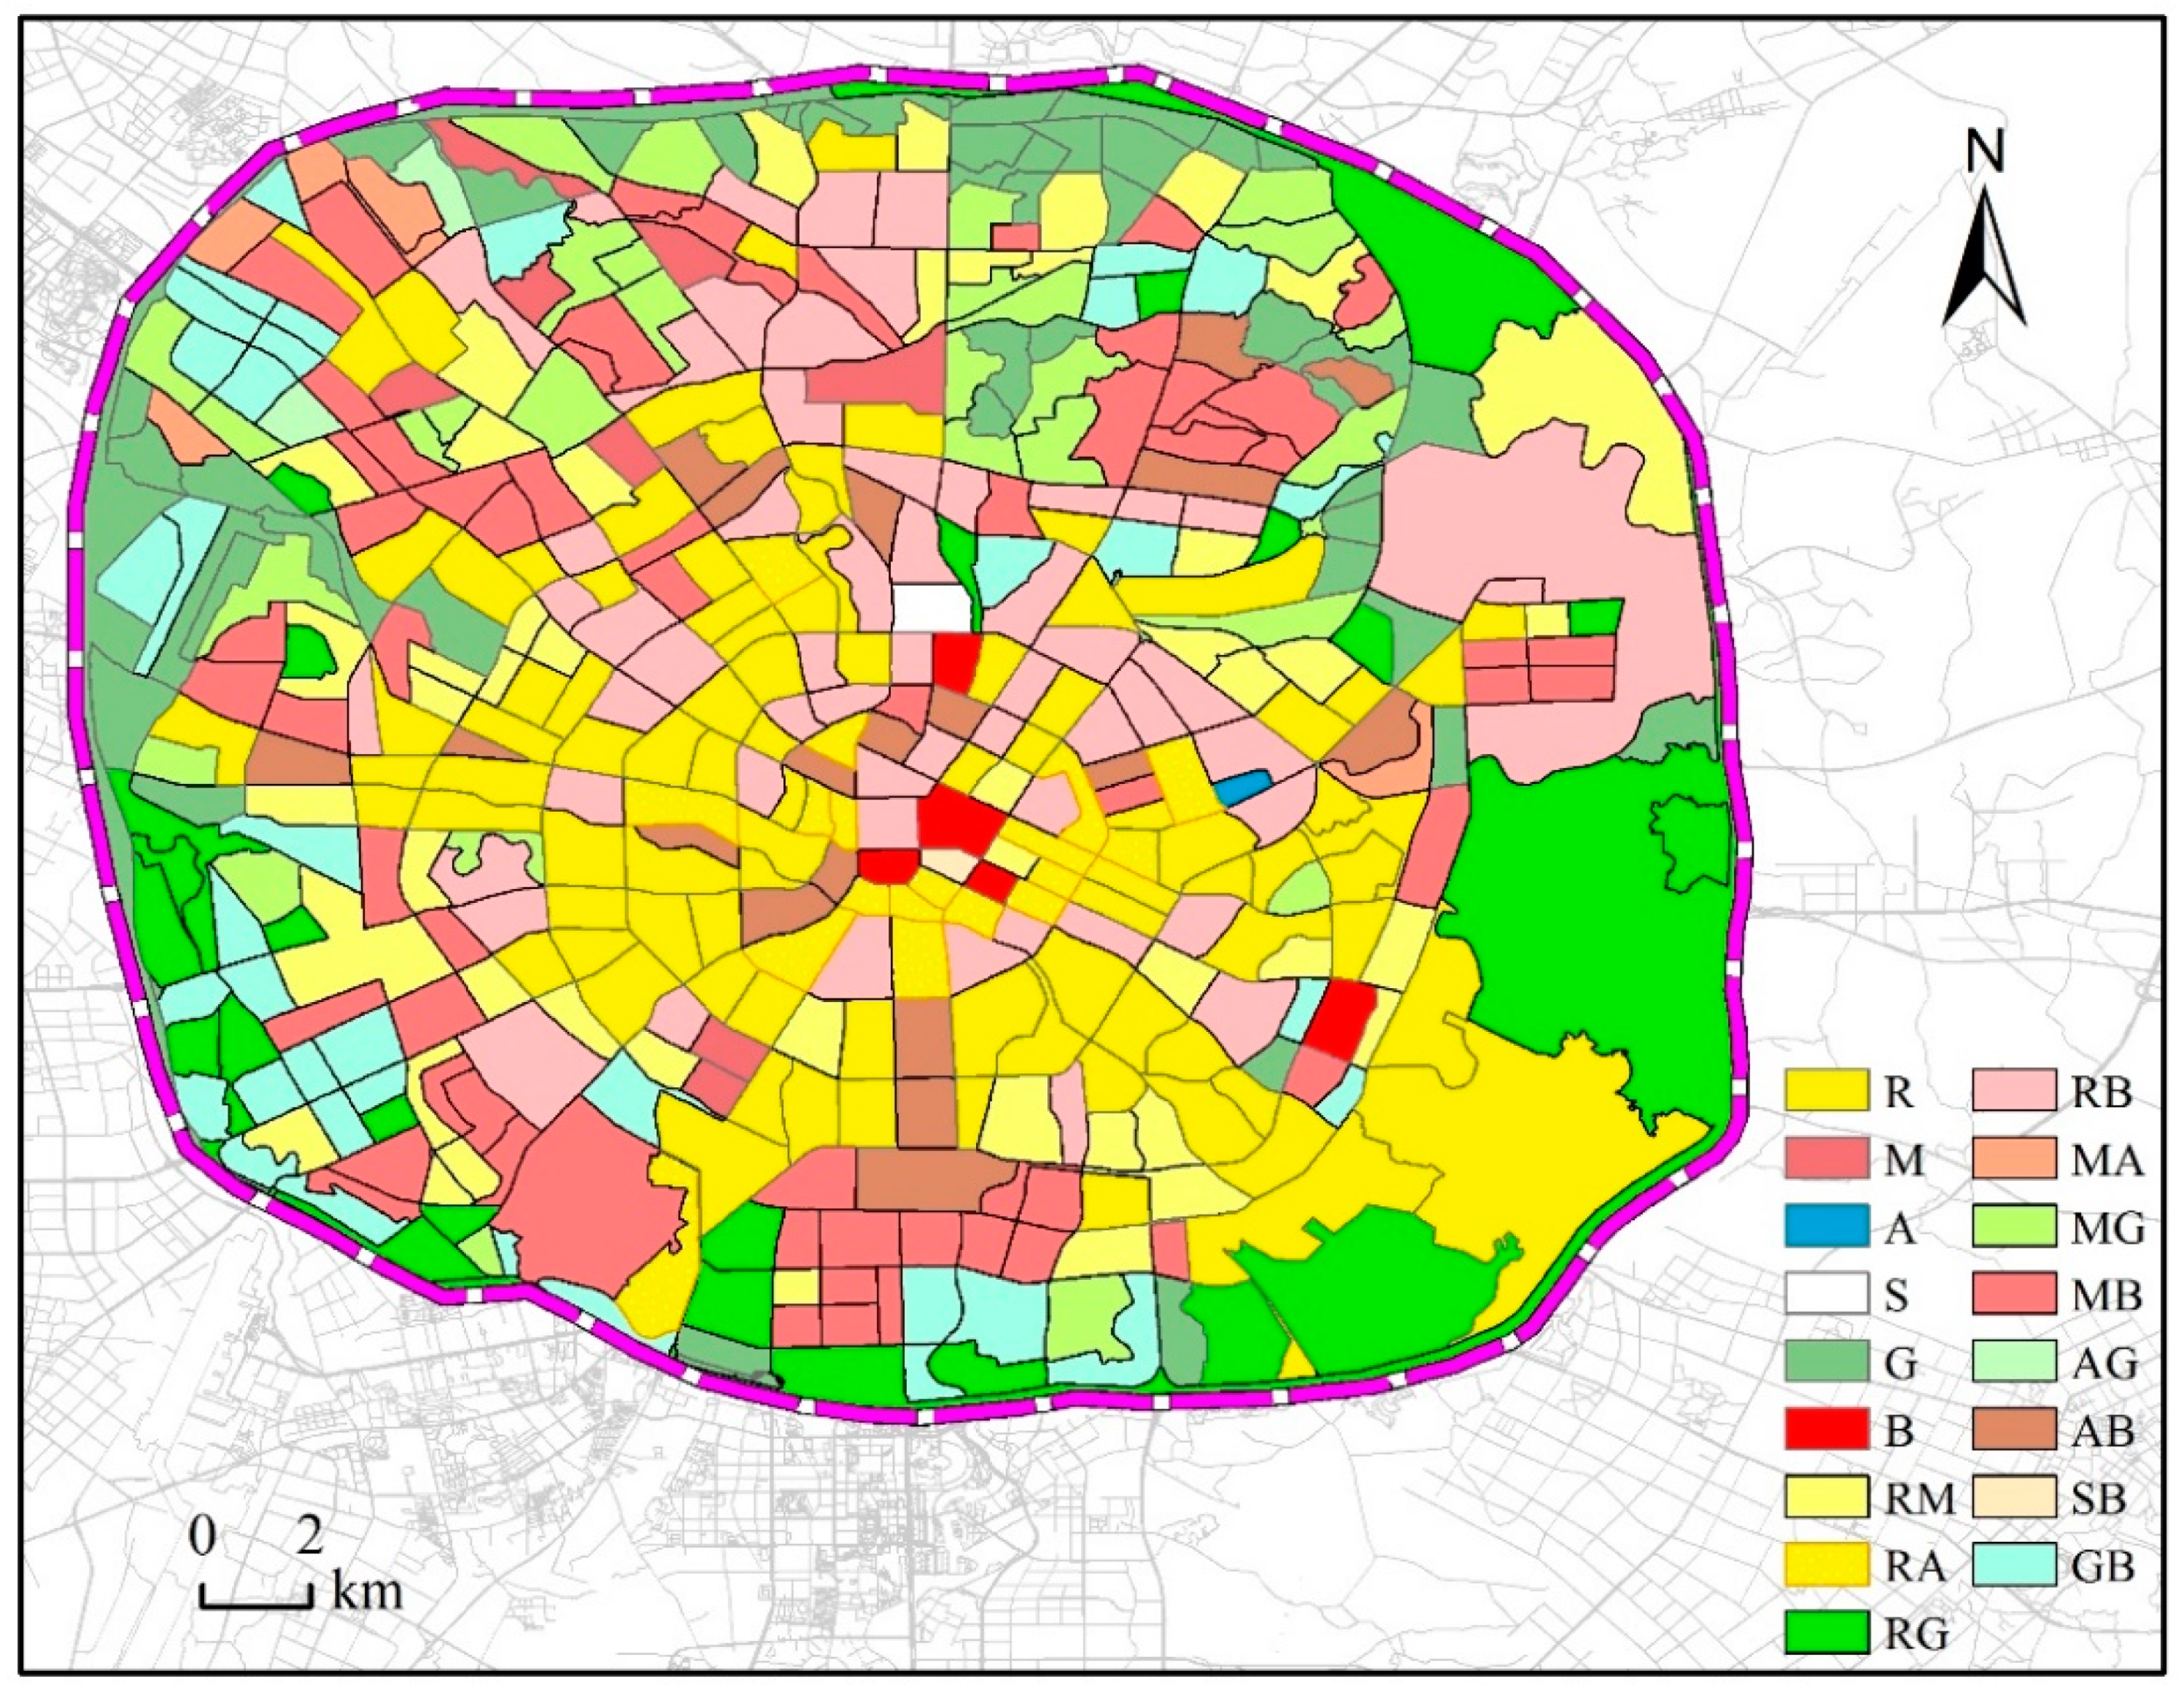
The result based on the clustering algorithm and the result based on POI data are fused through the AND-OR operation to realize the final functional urban region identification. The plots which have the same land type under the two classification reserve their type, while plots which have different types are classified as mixed land types. This mixed operative region is in line with the Charter of Machu Picchu’s pursuit of comprehensive and multi-functional urban functional regions. Finally, the identification of urban functional regions within the third ring road of Chengdu is obtained, as shown in
Figure 9.
R is for residential land; M stands for industrial logistics land; A represents land for public service management and facilities; S is for transportation facilities; G is for green square; B stands for commercial office space; RM represents mixed land for residential life and industrial logistics; RA stands for mixed-use of residential and public service management and public service facilities; RG stands for residential and green square mix; RB stands for mixed residential and commercial land; MA stands for mixed-use of industrial logistics and public service management and public service facilities; MG represents the mixed land of industrial logistics and Greenland squares; MB represents a mix of industrial logistics and commercial office land; AG stands for public service management and mixed-use of public service facilities and green square; AB stands for public service management and mixed-use of public service facilities and commercial offices; SB stands for a mix of transportation and commercial and office space; GB stands for green squares and mixed commercial and office land.
The main function region of Chengdu is the mixed-function region with the main functional form. Specifically, as shown in
Figure 8, the single functional region accounts for 31.91% of the total region of the study area, and the mixed functional region accounts for 68.09% of the total region of the study area. From a spatial point of view, the primary and tertiary ring regions are mainly single functional zones, the second ring regions are mixed functional zones, and the mixed functional zone region is larger than the single functional zone region.
In the single functional region, the residential land is mainly located in the second ring, showing a circular distribution. The main reason is that the price of the second ring is lower than that of the ring. The second ring is closer to the commercial region than the third ring, and the life is more convenient. The distribution of industrial logistics land is reduced and is mainly distributed in the third ring zone in the northwest of the study area, because the land price that the industry can bear is low, the transportation outside the second ring is convenient, and the environmental policies are limited there; the green land and the square land are distributed on the edge of the third ring of the study area, forming a ring. Distribution and natural conditions are very consistent, as there is a three-ring edge with natural rivers, local conditions trigger green space development; commercial office land is distributed in the city center, which is why business is in the city center since it can access the largest consumer groups, and get the most economic benefits.
In the mixed functional region, the mixed land for residential life and industrial logistics is mainly distributed at the junction of the second ring and the third ring, and is as close to the working areas and living regions as possible; the mixed land for residential life and public service management and public service facilities is mainly distributed in a ring region. This is mainly because urban institutions and hospitals are distributed in that region; residential and commercial office-mixed land is associated with residential regions, which is an extension of commercial functions and meets residential functions; industrial logistics and commercial office-mixed land are mainly distributed in three ring regions, mainly outside the living region. It is distributed in a ring shape; the mixed land of residential life and green space square mainly exists on the edge of the Third Ring Road. The green environment of this area is good, and there are many high-end residential regions; other mixed regions have less area and less mixed distribution.
The recognition results of the clustering algorithm are combined with the recognition results based on POI density and type to conduct and or operation, and the final recognition results are obtained, which are verified by Google earth image and Baidu map. The validation results are shown in
Table 4. Through the verification results, we can find that the transportation facilities are accurately identified; the main commercial office land in the study area can be identified, especially on the main commercial street; the living region has a better recognition effect, and there are some mixed functional regions. The function of living can be utilized, most of the industrial logistics land can be identified, and the rest appears in the mixed-function region. Also, the green space square can identify the ecological region around the city, and some large squares and parks. Some small region park squares are mistakenly identified in the Greenland Plaza site, while public service management and public service facilities are mainly located in the mixed-function region, and the single recognition effect is not good.
5. Discussion
POI data have better spatial timeliness and spatial resolution than traditional statistics data. Therefore, using POI data to identify the attributes of urban functional regions is more objective, simple, and efficient than using traditional methods. However, POI data also has some limitations. POI data is static data that cannot reflect dynamic information in real-time. Therefore, the floating car track data and POI data were combined to analyze the attributes of urban functional regions from dynamic and static perspectives. This method not only can identify the attributes of a single urban functional region, but also can distinguish the attribute of mixed urban functional regions. This paper introduces the concept of traffic community and uses the block as the research unit to fit the urban form more accurately and make the identification result more accurate. The experimental results show that the single functional region accounts for 41% of the total region, and the mixed functional region accounts for 59% of the total region. This is in line with the status quo of modern urban development. Through accurate identification of urban functional regions, it is convenient for the government to conduct reasonable urban planning and scientific decision-making, thus improving the urban environment and resource allocation, which is conducive to Chengdu becoming a city with an increasingly high-quality life.
The spatial distribution of the final recognition results of the traffic community show that the functional urban region is roughly concentric with the center of the city center and the farther away from the city center a traffic community is, the smaller its flow of people and the POI density. There are fewer single functional regions in the main urban region of Chengdu, and the functional region types are more mixed functional regions. The recognition results show that industrial and logistics land is very small, commercial office land has a tendency to expand outward, many characteristic commercial streets can be identified, and the functional regions with residential attributes account for nearly 60% of the research region, which is consistent with the slogan of a city with a high quality standard of living promoted by the Chengdu government. From the perspective of recognition effectiveness, using the traffic community as a research unit can help to identify current complex functional urban regions, particularly complex mixed functional regions.
6. Conclusions
With the rapid development of China’s economy and continuous improvement in the level of urbanization, the problem of urban development space is prominent. Identification of the distribution status of urban functional regions and the compound analysis of land use functions has played an important role in urban planning and sustainable development. Urban functional region identification is a challenging research area. In the era of big data, the emergence of mass source data adds new data sources for urban functional region identification. However, single data has inevitable defects during functional region identification. Therefore, this paper uses the combination of multi-source data to improve the accuracy and reliability of functional region identification. However, the POI data and floating vehicle trajectory data have some deviations from the urban simulation results and actual conditions. In the future, additional types of spatio-temporal big data, such as refined block data, remote sensing data, mobile phone signaling data, bus and subway travel data, and social check-in data are expected to be used to further improve the simulation ability of urban environments over different times and spaces. Data mining at scale can achieve more accurate identification of urban functional regions.
Using social perception, the realization of “move” and “static”, this paper proposes a method involving floating car trajectory data and electronic map data with the combination of an urban functional regions of interest points identification method and identification. The results were then compared with the actual scene analysis and verified to determine the functionality of various regions. Firstly, the maximum expectation algorithm was adopted to carry out cluster analysis of traffic residential regions communities in line with time series, and six types of urban functional regions were obtained, which were then distributed as green square land, public service management and public service facilities land, residential and living land, traffic facilities land, traffic facilities land, commercial and residential mixed land, and commercial and office land. Secondly the traffic communities were identified using the Delphi method based on the density and type of electronic map POI data, then the commercial office space, the green square land, residential land for living, industrial logistics land, land for important traffic facilities, land for business enterprise, education, scientific research, cultural landscape, and land for public facilities, a total of nine types of land use, could be classified. Six single functional regions and 11 mixed functional regions were obtained by conducting AND-OR operations on the two kind of recognition results.


