Article

Comparison of Methods for Pretreatment and Quantification of Bulk Asbestos Samples for Polarized Light Microscopy Analysis to Evaluate Asbestos-Containing Waste

1
Department of Occupational and Environmental Medicine, Gil Medical Center, Gachon University College of Medicine, Incheon 21565, Korea
2
National Cancer Control Institute, National Cancer Center, Goyang-si Gyeonggi-do 10408, Korea
3
Institute of Health and Environment, Department of Environmental Health Sciences, Graduate School of Public Health, Seoul National University, 1 Gwanak-ro, Gwanak-gu, Seoul 08826, Korea
*
Author to whom correspondence should be addressed.
Sustainability 2019, 11(22), 6440; https://doi.org/10.3390/su11226440
Submission received: 15 October 2019 / Revised: 8 November 2019 / Accepted: 11 November 2019 / Published: 15 November 2019
(This article belongs to the Special Issue Towards Circular Economy: Evaluation of Waste Treatment)

Abstract

:
This study aimed to compare sample pretreatment procedures for the identification and quantification of asbestos. The performance of visual estimation and point counting procedures for evaluating asbestos-containing waste was investigated, and the effect of analytical experience was studied. The efficacy of pretreatments for the identification and quantification of asbestos in various sample matrices was compared. To evaluate the effect of experience on analytical accuracy, three analysts with different analytical experiences were selected. There were significant differences in the quantitative analysis results obtained using different pretreatments. False negatives were reported when asbestos, especially amphiboles, were analyzed by a less-experienced analyst. Quantification via point counting and visual estimation resulted in differences in the asbestos content. The results of point counting were more accurate than those of visual estimation for all analysts, regardless of the asbestos type and concentration. Experience in asbestos analysis affected accuracy and precision. The findings show that pretreatment is an important factor in qualitative analysis. Appropriate pretreatments should be assigned based on the properties of the sample. For quantitative analysis, the accuracy of the results depends on the experience of the analyst. Until analysts are fully trained, all their analysis results should be checked by an experienced analyst. Point counting is an adequate quantitative method for analyzing samples with low concentrations.

1. Introduction

Asbestos is a naturally occurring fibrous mineral. It has many advantages, such as good heat and electrical resistance, wear and friction characteristics, tensile strength, sound insulation, and resistance to chemicals [1]. However, because of its carcinogenicity, the use of asbestos is banned in many countries, including the Republic of Korea, Italy, etc., owing to public health concerns. The latency period for asbestos-related diseases is 10–30 years, and asbestos can cause asbestosis, mesothelioma, and lung cancer [2,3,4,5,6].
Due to its adverse health impacts, qualitative and quantitative analysis are important to characterize the asbestos status of bulk waste samples. In Korea, suspected asbestos contained waste is classified into categories: non-asbestos-containing waste and waste containing asbestos higher than 1%. The quality of the analysis must be ensured to accurately distinguish whether or not it is asbestos waste. For quality control purposes, the management of analysts and institutes is required to assure the accuracy of asbestos analysis as asbestos has remained a social issue in Korea since 2005 [7]. It is possible to identify the six types of asbestos by polarized light microscopy (PLM). PLM analysis procedures require careful sample pretreatment. Asbestos is used in mixtures with other structural materials; for PLM to be effective, sample pretreatment is required to remove these materials to reduce analytical errors and obtain reliable qualitative and quantitative results by eliminating the interference from binders. For example, it is difficult to detect asbestos in floor tiles because of the size and shape of the fibers used and the challenge involved in removing the binder. If binders are present during analysis, it is difficult to detect asbestos, and sample pretreatment guidelines are required to eliminate the interference and allow reliable qualitative and quantitative analysis.
An investigation procedure for asbestos is mandatory for the demolition or renovation of buildings as well as waste handling in many countries [5,8,9]. Accurate quantification of asbestos is critical as the process of demolition, renovation, and waste handling must be approved by the government when building materials contain more than 1% asbestos. Hence, accurate quantitative analysis is most important for concentrations less than or around 1%. The visual estimation (VE) method is widely used for quantitative analysis [9,10,11,12,13]. Point counting (PC) was introduced by the U.S. Environmental Protection Agency (EPA) and is intended as a point counting or equivalent estimation method for determining the amount of asbestos in bulk samples [14,15,16]. Subsequent to revision of the interim method, the “equivalent” visual estimation method has generally been used for quantitative analysis because it requires less time than the EPA 400-point count method. However, it has been reported that visual estimation is significantly less accurate than the EPA 400-point count method, especially for samples with low asbestos concentrations [17,18,19].
In the present study, the dependence of the qualitative results on sample pretreatment, the efficacy of visual estimation and point counting, and the dependence of the analysis results on the experience of the investigator were evaluated.

2. Materials and Methods

2.1. Sample Selection

A total of 16 samples were prepared for this study. Ten samples were acquired from the Bulk Asbestos Proficiency Analytical Testing (BAPAT) program conducted by the American Industrial Hygiene Association (AIHA-BAPAT), and three samples were from the Korea Occupational Safety and Health Agency (KOSHA-BAPAT). Three samples of materials found most frequently in the field were also obtained. For BAPAT samples, there was no information on the composition and origin of the samples; they provided only qualitative and quantitative results of asbestos. For field samples, the source of the sample was recognized. These were roof slate, ceiling material, and floor tiles. Table 1 shows the basic information of the samples used in this study; detailed information is given in Supplementary Material (Figure S1). Fifteen samples were used for sample pretreatment. Fourteen samples were used in the quantification study after excluding one sample that had no asbestos fibers. Four samples were selected for asbestos quantification by point counting. The reference values provided by AIHA and KOSHA for the AIHA-BAPAT and KOSHA-BAPAT samples were used for comparison between VE and PC. In the case of the AIHA-BAPAT samples, the official results were used, i.e., the mean values determined by two reference laboratories. The reference values of the KOSHA-BAPAT samples were provided by KOSHA. The three field samples were included in this study despite the lack of reference values to consider the issue of removing roof slates, ceiling material, and floor tiles when a building is demolished. The reference values for the three samples were set as the mean values obtained by three analysts. All samples were dried in an oven at 60 °C for 2 h because moisture can affect the accuracy of the results [9].

2.2. Analyst Selection

The proficiency of the analyst is an important consideration in improving the reliability of the analysis. Analyses were performed by three analysts from the Occupational and Environmental Laboratory at Seoul National University. The analysts had varying experiences of more than 10 years (analyst A), 5 years (analyst B), and 1 year (analyst C).

2.3. Comparison of Sample Pretreatment for Qualitative Analysis and Quantification of Asbestos

Qualitative analysis allows PLM to classify the fibrous components of a sample as asbestos or nonasbestos. The major goal of qualitative preparation is to mount easily visible fibers in appropriate refractive index liquids for complete optical characterization [9]. In this study, four sample pretreatment methods were employed: (1) crushing and mixing, (2) ashing, (3) acid treatment, and (4) ashing and acid treatment [9]. Crushing and mixing procedure is generally required for all samples because samples may consist of inhomogeneous materials [11]. Ashing is performed for six hours using a muffle furnace to remove organic substances, such as vinyl, cellulose, and organic binder. The muffle furnace temperature should be at least 300 °C but not above 500 °C because chrysotile decomposes at about 500 °C and above [9]. If the sample is a floor tile or residual binder remains, acid treatment must be performed. Acid treatment is used to remove calcite, gypsum, magnesite, brucite, portlandite, and dolomite [9]. For some asbestos-containing materials, sequential ashing and acid treatment may be more effective. After carrying out the four sample pretreatment methods, slide mounts were prepared for the identification and quantification (VE) of asbestos in the samples. The qualitative analysis was used to distinguish different properties of the six types of asbestos [9]. Scan slides are generally used to identify asbestos minerals using optical properties, such as morphology, color, pleochroism, birefringence angle of extinction, sign of elongation, refractive indices, and dispersion staining characteristics, according to the standard qualitative analysis method [9]. Color and pleochroism can be found by plane polarized light. Only crocidolite has pleochroism. Birefringence is the difference between the highest and lowest refractive indices of a mineral. As the PLM stage rotates 360°, the asbestos fibers seen between the cross polars “appear” or “disappear” in four positions at 90° intervals, and 45° between each destructive interference color should be visible. The sign of elongation describes the relationship between fiber shape and optical properties. The two vibration directions available are parallel and perpendicular to the long axis. If the high refractive index vibration plane (low-speed rays) is parallel to the long axis, fibers are displayed in positive quantities (blue-green with fiber NE-SW, orange-yellow with fiber NW-SE). If the low refractive index vibration plane is parallel to the long axis, fibers are marked negative (orange-yellow with fiber NW-SE, blue-green with fiber NE-SW). Dispersion staining color is a very important and distinguished characteristic to identify asbestos. Dispersion is a term used to describe the change in refractive index with the wavelength of light. The difference in dispersion of fibers and liquids means that even if refractive index matches at one wavelength, it can be quite different from the other wavelengths. Refractive-index liquids (HD-6-80, Cargille Lab., USA) were used for complete optical characterization of each sample. A stereo microscope (SZ-51, Olympus, Japan) and polarized light microscope (BX-51, Olympus, Japan) were used for the analyses, with McCrones central stop lens used for dispersion staining.

2.4. Comparison of the Quantitative Analysis by VE and PC

The major purpose of quantitative preparation is to provide the analyst with a representative grain mount of the sample in which the asbestos can be observed and distinguished from the nonasbestos matrix [9]. The amount of asbestos in the slide-mounted samples was quantified by VE and PC. Four samples were used to evaluate the two methods. Visual estimation was employed to determine the percentage of each asbestos species identified by qualitative analysis by comparing it to standard projections under the National Institute for Occupational Safety and Health (NIOSH) 9002 standards [11]. A slide was scanned in its entirety, and the relative proportions of asbestos and nonasbestos material was noted using PLM at 100× magnification. The percentage of each asbestos fiber identified was determined by comparing it with the standards provided by NIOSH 9002. For point counting, a cross-line reticule was used to visually superimpose a point or points on the microscope field of view using the U.S. EPA procedure. According to this procedure, the analyst should count only points directly over nonempty areas. Empty points should not be counted on the basis of the closest particle. Point counting should always be done at 100 × magnification. The limit of detection (LOD) is 0.25% for the 400-point count method (LOD: 0.1% with the 1000-point count method) [9,16].
Four slides per sample were prepared for point counting. Counting was done at a magnification of 100×. The points that coincided with an asbestos fiber were counted separately for each asbestos type. A total of 100 points was counted for one slide; hence, 400 points were counted for the four slides. The percentage of each asbestos type was calculated by dividing the number of nonempty points of that component by the total number of nonempty points counted for the sample. Point counting analysis was performed for the sample with ashing and acid treatment to clarify the comparison between VE and PC.
% Asbestos = (AP/NEP) × 100
AP: number of points counted for a specific asbestos type.
NEP: total number of nonempty points counted.

2.5. Statistical Analysis

SAS 9.1 (SAS Institute Inc., NC, USA) was used for the statistical analysis, and Sigmaplot 14.0 (Systat Software, San Jose, CA, USA) was used to interpret the graphs. The general characteristics of the samples were analyzed using descriptive statistics. The differences between the results obtained by the three analysts were estimated by repeated measurement analysis of variance (ANOVA). The mean and standard deviation were calculated.

3. Results

3.1. Comparison of Sample Pretreatment Methods by Qualitative Analysis and Quantification (VE) of Asbestos

Table 2 lists the characteristics of the 16 samples identified by the analysts according to sample pretreatment to confirm the effectiveness of the pretreatment methods. Fifteen samples contained asbestos, and one sample did not contain asbestos, as shown in Figure S1.
Analysts A and B identified all types of asbestos in five samples when crushing and mixing was done. However, analyst C made a false-negative error for two samples among the 15 samples. Analysts A and B were able to identify 13 samples with ashing, 12 samples with acid treatment, and all samples (n = 15) with the combination of ashing and acid treatment. Crushing and mixing took 10 minutes, ashing took 370 min, acid washing took 140 min, and ashing with acid washing took 520 min.
Figure 1 shows examples of microscopy images of qualitative analysis with the different pretreatment methods. As can be seen, except for the pretreatment with ashing and acid treatment (Figure 1d), it was impossible to identify the asbestos in the samples. A detailed image showing the difference between the sample preparation methods is given in Figure S1.
Table 3 lists the concentrations of asbestos determined after removal of the binder by sample pretreatment for three field samples with VE quantitative analysis, as determined by analyst A with 10 years of experiences. There was one false negative in the case of crushing and mixing in sample 3000.
The analytical errors, misclassifications, and false negatives are listed in Table 4. All analysts misclassified sample 9583, where amosite was misclassified as crocidolite and crocidolite was misclassified as amosite.

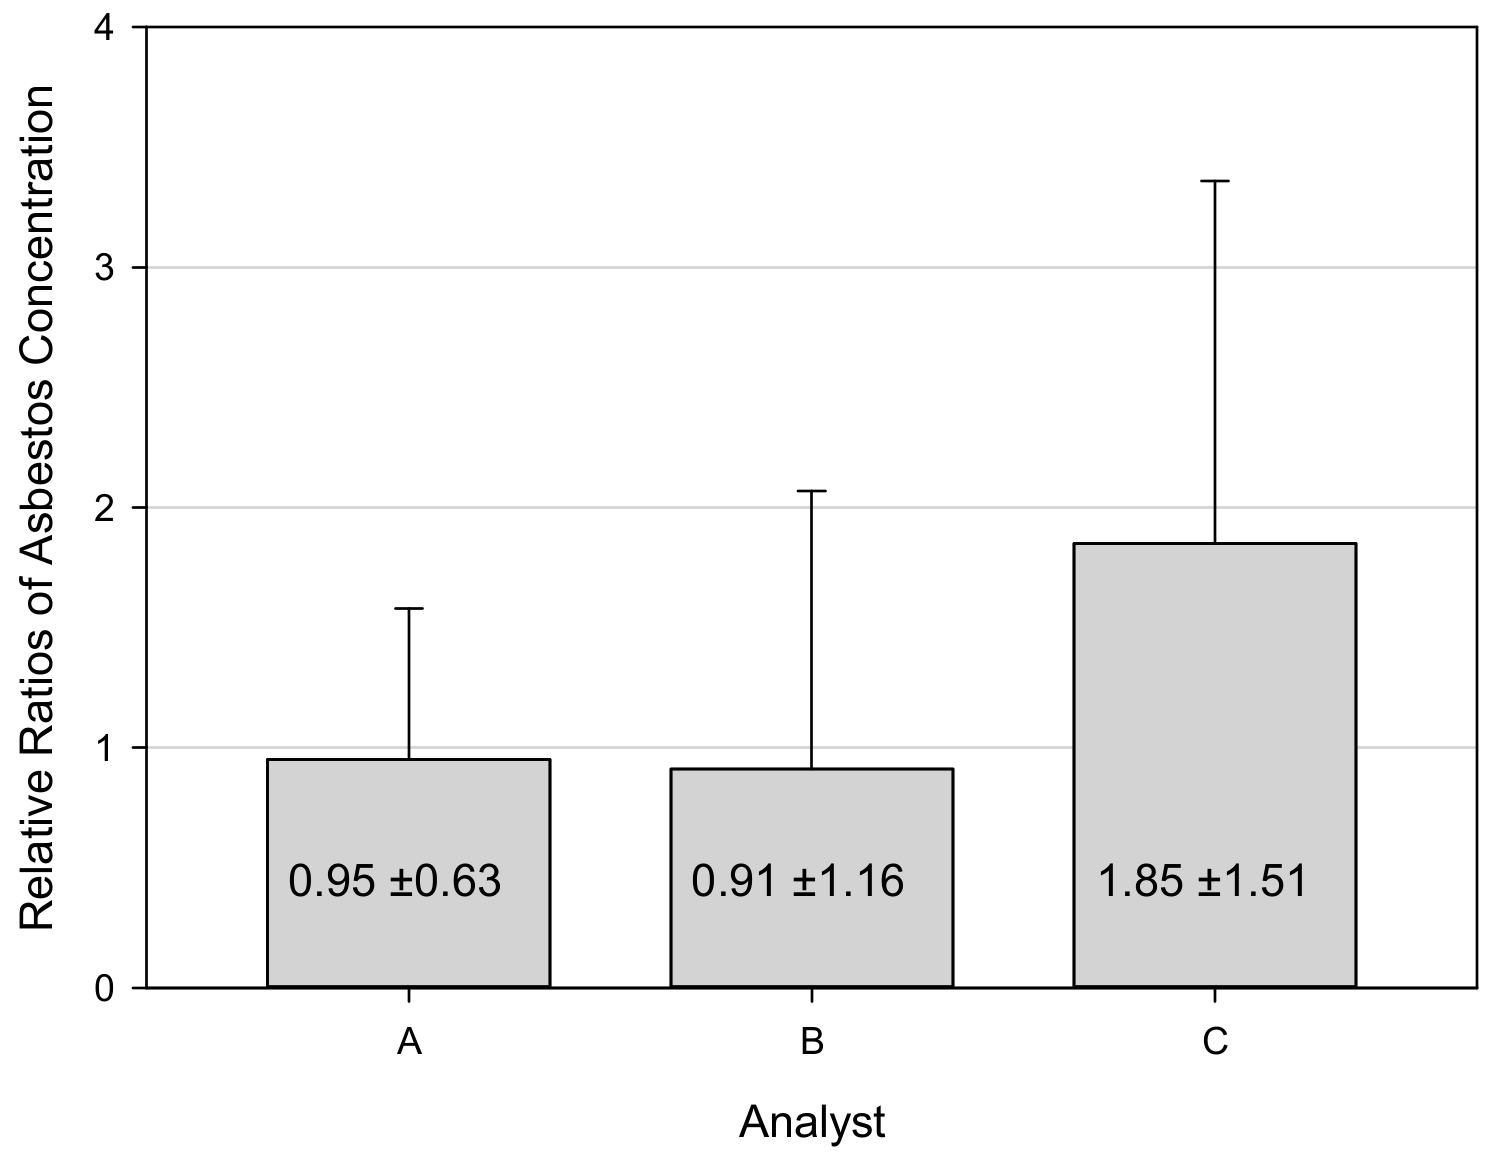
3.2. Quantitative Analysis (VE) Result by Experience of Analysts

Figure 2 compares the ratio of asbestos concentrations and reference concentrations measured by the analysts by visual estimation, a conventional method of quantifying asbestos content. The average ratios for analysts A, B, and C were 0.95, 0.91, and 1.85, respectively. The mean asbestos concentrations determined by the three analysts are compared in Table 5. Repeated measurement ANOVA was used to examine the differences in the results for the same samples. There was no significant difference between the results obtained by analysts A and B. However, there were significant differences between the results of analysts A and C (p = 0.021) and between the results of analysts B and C (p = 0.037).
The results of the ratio between the concentration and the reference obtained based on the actual asbestos levels in the samples are given in Table 6. For low asbestos concentrations, the ratios of the concentrations determined by analysts A, B, and C to the reference concentrations were 0.93 (−7%), 1.11 (11%), and 2.15 (115%), respectively. In the case of high asbestos concentrations, the ratios were 1.11 (11%), 0.77 (−23%), and 1.73 (73%), respectively. The standard deviation of the concentration data was less for the analysts with greater experience. Figure 3 compares the mean asbestos concentrations versus the actual concentration. The results suggest that the most experienced analyst was the most accurate.

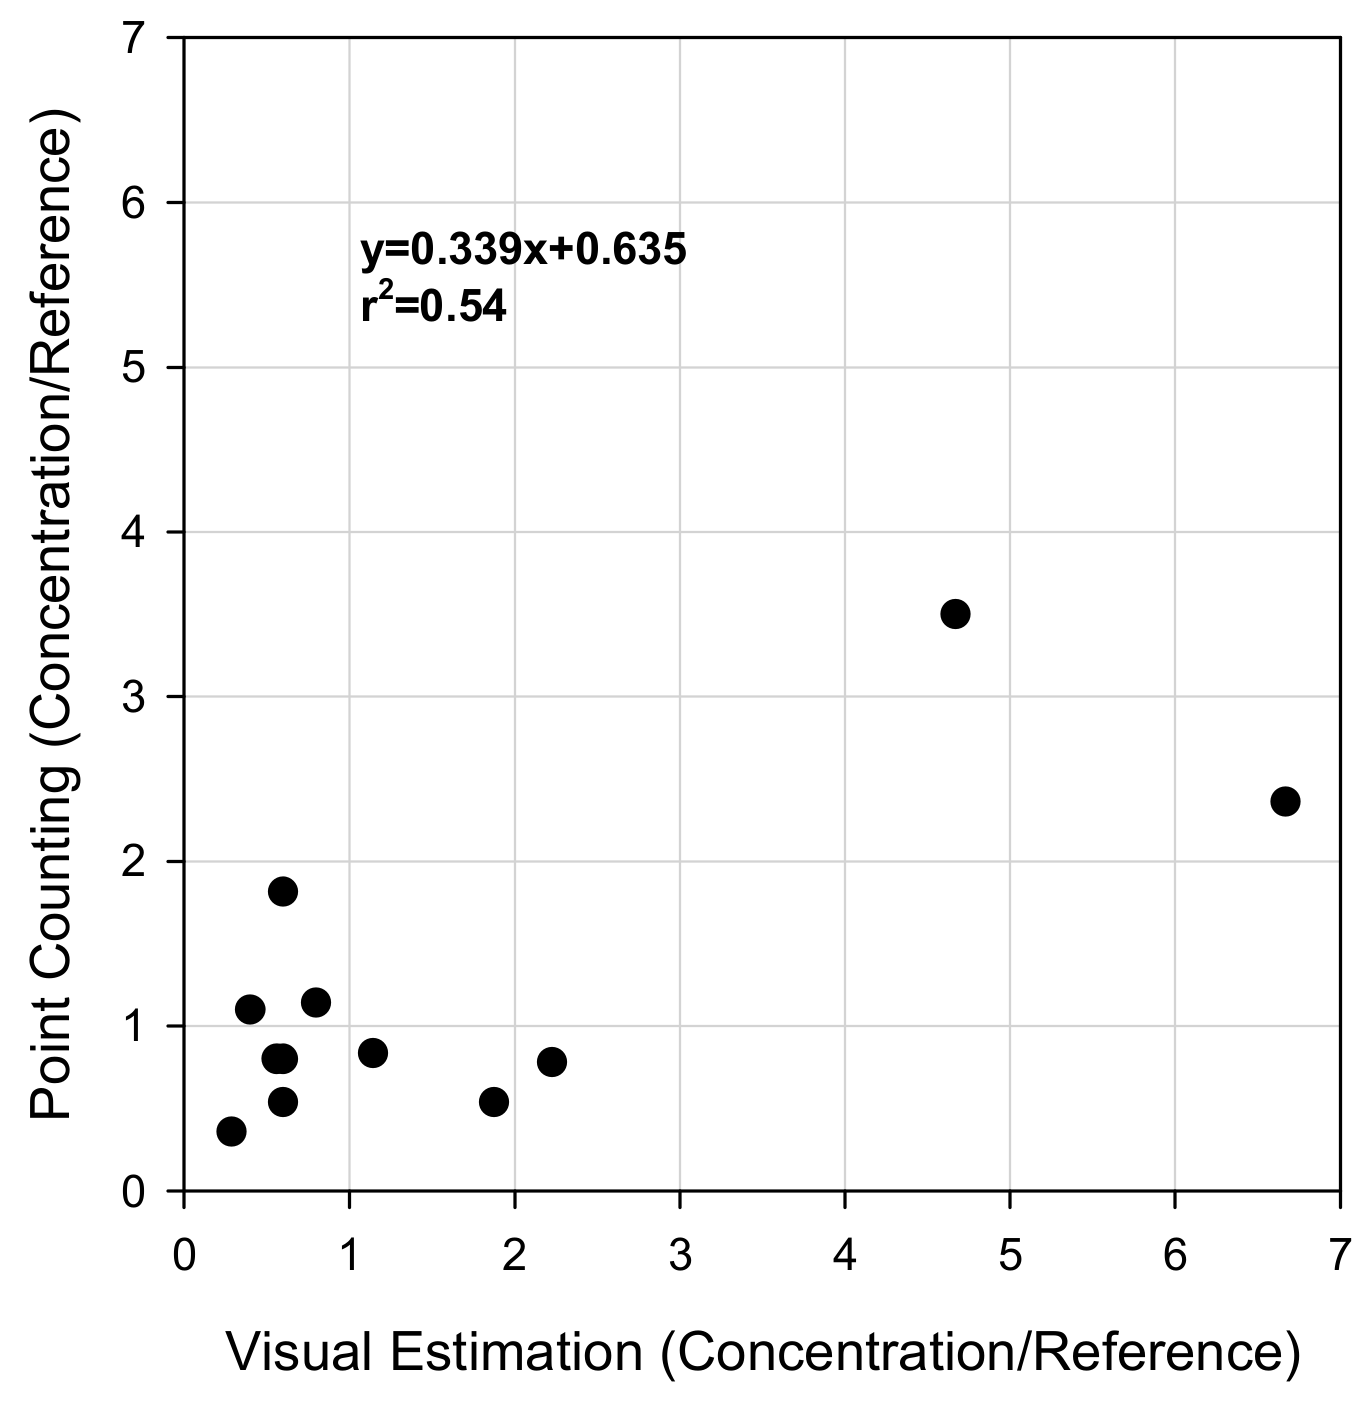
3.3. Comparison of the Quantitative Analysis by VE and PC

The correlation between the results obtained by visual estimation and point counting (R2 = 0.54) is illustrated in Figure 4. The ratio of the determined concentrations to the reference concentration of sample 9583 is presented in Figure 5; this sample had the highest asbestos concentration. Analyst B overestimated the asbestos concentration by a factor of 4.67 in the visual estimation and 3.5 in point counting of the sample. Analyst C overestimated the asbestos concentration by a factor of 6.67 in the visual estimation and 2.36 in point counting. The ratios for analyst A were below 1 for both visual estimation and point counting.
Table 7 shows that analyst A reported the most accurate results, even though there were underestimations. The point counting results were closer to the reference value for all analysts.

4. Discussion

This study examined the impact of sample pretreatment on qualitative analysis of asbestos, assessed the quantitative comparison between visual estimation and point counting, and investigated the dependence of the analytical results on the experience of the analyst. It is particularly important to improve the method of identifying and quantifying bulk asbestos, especially for asbestos-containing materials such as building materials and waste, in countries that require waste disposal, such as the Republic of Korea, Italy etc.
Table 1 and Figure S1 show the different types of samples. Analysts need to analyze them correctly when requested. Crushing and mixing pretreatment should be performed prior to any other pretreatment because it requires the least time and is the primary method of homogenizing a sample and reducing the grain size (Table 2). However, other pretreatments may be used when a sample contains interfering substances. In the ashing pretreatment, combustible materials, such as organic compounds and cellulose, are burned off in a furnace at 450 °C for six hours. Acid treatment with 25% concentration of hydrochloric acid is commonly used to remove interfering substances such as calcium binders, gypsum, and fiberglass [9,18].
In the present study, the combination of ashing and acid treatment was found to be the most accurate pretreatment technique for identifying asbestos fibers according to the optical properties [9], even though this procedure requires a long time (Table 2). Therefore, this method is recommended for samples with complex binders, such as floor tiles, which contain organic matter rather than calcium and plaster [9,12]. For floor tiles, it is especially difficult to remove the binder. Figure 1a–c shows the worst cases of analysis. In such situations, analysts cannot identify whether a sample has asbestos or not. Table 3 shows results of the field samples analyzed by analyst A. It can be seen that false-negative results were obtained when there was only crushing and mixing pretreatment. Even for analyst A, who had 10 years of experience, crushing and mixing pretreatment did not affect the identification of asbestos in floor tiles. Therefore, ashing and acid treatment must be performed for the preparation of floor tile samples. Asbestos is difficult to identify by crushing and mixing or acid pretreatment alone as the samples may contain cellulose or organic matter [18]. Applying ashing and acid pretreatment simultaneously for difficult-to-identify samples eliminates both interferences, making it easier to identify asbestos [19]. In reality, there are many samples like floor tile waste that pose difficulties in identification. Furthermore, analysts need time to explore samples and decide on the sample pretreatment method, as shown in Table 2. However, analysts usually do not have enough time to analyze samples accurately and precisely. Therefore, it is necessary to regulate the procedure of analysis for asbestos or train analysts with a constructive curriculum to perform the task as professionals.
Analyst C (with one year experience) reported false negatives in the identification of anthophyllite and amosite (Table 4). There are several types of analytical error, such as misclassification and false negatives. In this study, crocidolite and amosite were misclassified by all analysts. The optical properties of samples change when these two asbestos types are continuously exposed to high temperatures of 300–500 °C, with an accompanying color change [20]. In addition, exposure of amosite to high temperature changes the refractive index [21]. We believe that the false negatives reported by analyst C for two samples were due to the analyst’s limited experience. The quantitative asbestos concentrations reported by analyst C also differed from the reference values (Figure 2). These qualitative and quantitative errors could be overcome by intensive training and with accumulated experience in asbestos analysis. Adjustment with a calibration standard and experience might be necessary for such samples.
There were significant differences in the analysis results obtained by analysts A and C (p = 0.021) and B and C (p = 0.037), as shown in Table 5. The results tended to be closer to the reference values when the analyst had greater experience. The U.K. HSE [20] suggests that experience is important, and until analysts are fully trained, all their analyses should be checked by experienced analysts. Systemic bias and random error are often present in analysis results. Systematic bias can be reduced through comparison of the results obtained by different analysts and calibrations with standard materials. Random error can arise from random fluctuations in the measurements and can thus be reduced by repeating an experiment many times. However, systemic bias cannot be addressed by measurement repetition. Therefore, internal quality control is an essential aspect to ensure that data released from a laboratory are fit for their intended purpose [22].
The point counting results were closer to the reference concentrations (Table 7). Point counting is generally more accurate than visual estimation for quantifying asbestos in bulk samples, especially at low concentrations [23,24,25]. In addition, historical data has shown that visual estimation tends to have a high bias [26]. A mixture of materials also seems to cause biases; for example, the existence of cellulose may result in an underestimation of chrysotile, and amosite in plaster is normally overestimated. Nevertheless, point counting results are commonly closer to the actual weight percentage than visual estimation results. For asbestos concentrations below 1%, there is also a tendency toward overestimation when visual estimation is applied [24], and point counting is suggested for the analysis of samples with low levels of asbestos [27].
Analysts B and C overestimated the asbestos content of sample 9583, which contained crocidolite (Figure 5). Crocidolite fibrils are shorter and thinner than other amphibole fibrils, but they are not as narrow as fibrils of chrysotile [28]. Furthermore, among the six regulated types of asbestos, crocidolite is the only type that generally indicates negative sign of elongation. However, when exposed to heat above about 300 °C, sign of elongation of crocidolite can change to positive sign of elongation [20].
This study might be particularly valuable for developing countries that have begun a ban on asbestos or enacted policies regarding asbestos waste during building demolition. Furthermore, electron microscopy, such as SEM and TEM, is more accurate and precise to analyze the characteristics of asbestos [2,29]. However, it is only available in developed countries and is difficult to apply due to the high cost of analysis; therefore, most standard procedures still use the PLM method due to availability. Also, it is necessary to refer the standard procedures and images from standard samples [30].
There are limitations in the present study. The results may not be representative of all bulk asbestos samples because this study was performed with a small number of samples. Therefore, further study using many samples is necessary. In addition, samples from proficiency testing programs and field samples should be compared, which again requires a greater number of samples. Nevertheless, this study is still valuable for emphasizing the importance of asbestos analysis for asbestos containing waste.

5. Conclusions

The results of qualitative analysis depend on the sample pretreatment method. This study suggests that appropriate sample pretreatment, such as combination of ashing and acid treatment, should be assigned according to the characteristics of a sample. The determination of the type and concentration of asbestos depends on the experience of the analyst. Therefore, the results obtained by less-experienced analysts should be confirmed by analysts with more experience. Point counting was found to be more accurate than visual estimation for quantitative analysis. Therefore, point counting should be used for low-level concentrations of asbestos. This study is useful not only for the developing countries but also the developed countries to evaluate asbestos-containing waste in bulk samples.

Supplementary Materials

The following are available online at https://www.mdpi.com/2071-1050/11/22/6440/s1, Figure S1: Sample preparation for asbestos identification.

Author Contributions

Conceptualization, C.Y.; methodology, C.Y. and S.H. (Seunghon Ham); software, S.H. (Seunghon Ham); validation, C.Y., S.H. (Seunghon Ham) and S.H. (Sungho Hwang); formal analysis, C.Y., S.H. (Seunghon Ham), and S.H. (Sungho Hwang); investigation, C.Y., S.H. (Seunghon Ham), and S.H. (Sungho Hwang); resources, C.Y.; data curation, S.H. (Seunghon Ham); writing—original draft preparation, S.H. (Seunghon Ham) and S.H. (Sungho Hwang); writing—review and editing, C.Y.; visualization, S.H. (Seunghon Ham); supervision, C.Y.; project administration, S.H. (Seunghon Ham); funding acquisition, C.Y. and S.H. (Seunghon Ham).

Acknowledgments

This work was supported by the Gachon University research of 2018(GCU-2018-5259) and the Basic Science Research Program of the National Research Foundation of Korea (NRF), funded by the Ministry of Science, ICT & Future Planning (2017R1C1B1002717).

Conflicts of Interest

The authors declare no conflict of interest.

References

  1. ATSDR. Toxicological Profile for Asbestos. US Department of Health and Human Services, Public Health Service, Agency for Toxic Substances and Disease Registry. Available online: https://www.atsdr.cdc.gov/toxprofiles/tp61.pdf (accessed on 2 September 2019).
  2. Wilk, E.; Krówczyńska, M.; Zagajewski, B. Modelling the Spatial Distribution of Asbestos—Cement Products in Poland with the Use of the Random Forest Algorithm. Sustainability 2019, 11, 4355. [Google Scholar] [CrossRef]
  3. IARC. IARC Monographs: Vol. 100C Asbestos, International Agency for Research on Cancer. 2012. Available online: http://monographs.iarc.fr/ENG/Monographs/vol100C/mono100C-11.pdf (accessed on 2 September 2019).
  4. Jo, H.; Jang, Y.N.; Jo, J.H. A low temperature detoxification method for treatment of chrysotile-containing waste roofing slate. Minerals 2017, 7, 144. [Google Scholar] [CrossRef]
  5. Ham, S.; Hwang, S.; Yoon, C.; Park, D. Review on asbestos analysis. J. Korean Soc. Occup. Environ. Hyg. 2009, 19, 213–232. [Google Scholar]
  6. Hwang, S.; Park, W. Application of asbestos management index and asbestos recognition in public buildings in South Korea. Hum. Ecol. Risk Assess. 2016, 22, 1542–1551. [Google Scholar] [CrossRef]
  7. Yi, G.; Yoon, C.; Han, J.; Yoon, M.; Jung, S.; Lee, J.; Lee, I.; Park, D. Development of asbestos quality control samples for proficiency analytical testing–evaluation of amosite and chrysotile quality control samples. J. Korean Soc. Occup. Environ. Hyg. 2009, 19, 288–296. [Google Scholar]
  8. U.K.HSE. Asbestos: The Survey Guide 2nd Ed., HSG264. 2012. Available online: http://www.hse.gov.uk/pUbns/priced/hsg264.pdf (accessed on 2 September 2019).
  9. U.S.EPA. Method for the Determination of Asbestos in Bulk Building Materials, EPA/600/R-93/116. 1993. Available online: http://nepis.epa.gov/Exe/ZyPURL.cgi?Dockey=9100TKSO.TXT (accessed on 2 September 2019).
  10. OSHA. Polarized Light Microscopy of Asbestos, ID-191, Occupational Safety and Health Administration. 1992. Available online: https://www.osha.gov/dts/sltc/methods/inorganic/id191/id191.pdf (accessed on 2 September 2019).
  11. NIOSH. ASBESTOS (bulk) by PLM, NMAM 9002 (Issue 2), National Institute for Occupational Safety and Health. 1994. Available online: https://www.cdc.gov/niosh/docs/2003-154/pdfs/9002.pdf (accessed on 2 September 2019).
  12. KOSHA. Guidelines for Workplace Measurement Analysis: Asbestos; KOSHA CODE A-1-022; Korea Occupational Safety and Health Agency: Ulsan, Korea, 2006. [Google Scholar]
  13. MOE. Guidelines for Asbestos Management in Buildings; Ministry of Environment: Sejong-si, Korea, 2009.
  14. U.S.EPA. Interim Method for the Determination of Asbestos in Bulk Insulation Samples, EPA-600/M4-82-020. 1982. Available online: http://nepis.epa.gov/Exe/ZyPURL.cgi?Dockey=20009K0U.TXT (accessed on 2 September 2019).
  15. U.S.EPA. Asbestos Content in Bulk Insulation Samples: Visual Estimates and Weight Composition. 1988. Available online: http://nepis.epa.gov/Exe/ZyPURL.cgi?Dockey=20012KKM.TXT (accessed on 2 September 2019).
  16. CARB. Determination of Asbestos: Content of Serpentine Aggregate, Method 435, California Air Resources Board. 1991. Available online: https://www.arb.ca.gov/testmeth/vol3/m_435.pdf (accessed on 2 September 2019).
  17. Webber, J.; Janulis, R.; Carhart, L.; Gillespie, M. Quantitating asbestos content in friable bulk samples: Development of a stratified point-counting method. Am. Ind. Hyg. Assoc. J. 1990, 51, 447–452. [Google Scholar] [CrossRef]
  18. Santee, K.; Lott, P. Asbestos analysis: A review. App. Spec. Rev. 2003, 38, 355–394. [Google Scholar] [CrossRef]
  19. KOSHA. Bulk Asbestos Analysis Method Using Polarized Light Microscope; Korea Occupational Safety and Health Agency: Ulsan, Korea, 2009. [Google Scholar]
  20. U.K.HSE. Asbestos: The Analysts’ Guide for Sampling, Analysis and Clearance Procedures, HSG248. 2006. Available online: http://www.hse.gov.uk/pUbns/priced/hsg248.pdf (accessed on 2 September 2019).
  21. McCrone, W. Asbestos Identification; McCrone Research Institute: Chicago, IL, USA, 1988. [Google Scholar]
  22. Thompson, M.; Wood, R. The international harmonised protocol for the proficiency testing of (chemical) analytical laboratories. Pure Appl. Chem. 1993, 65, 2123–2144. [Google Scholar] [CrossRef]
  23. Harvey, B.; Perkins, R.; Nickerson, J.; Newland, A.; Beard, M. Formulating bulk asbestos standards. Asbestos Issues 1991, 4, 22–29. [Google Scholar]
  24. U.S.EPA. Procedure for Measuring Low Levels of Asbestos in Bulk Materials. In Development and Evaluation of Polarized Light Microscopy (PLM); U.S.EPA: Washington, DC, USA, 1989. [Google Scholar]
  25. Perkins, R. Point-counting technique for friable asbestos-containing materials. Microscope 1990, 38, 29–39. [Google Scholar]
  26. NIST. Bulk Asbestos Analysis, NIST Handbook 150-3, National Voluntary Laboratory Accreditation Program. 2006. Available online: https://www.nist.gov/document-16550 (accessed on 8 November 2019).
  27. New York State. Polarized-Light Microscope Methods for Identifying and Quantitating Asbestos in Bulk Samples, New York State Department of Health, 198.1. 2005. Available online: https://www.wadsworth.org/sites/default/files/WebDoc/I198_1_09_0.pdf (accessed on 2 September 2019).
  28. Chrysotile Institute. Monographs and Reports, Report of an IPCS Working Group Meeting on the Reduction of Asbestos in the Environment—Internal Technical Report. 1988. Available online: http://www.chrysotileassociation.com/fr/sc_publi/ipcs_report.php (accessed on 2 September 2019).
  29. Militello, G.M.; Sanguineti, E.; Yus González, A.; Mantovani, F.; Gaggero, L. The Concentration of Asbestos Fibers in Bulk Samples and Its Variation with Grain Size. Minerals 2019, 9, 539. [Google Scholar] [CrossRef] [Green Version]
  30. U.K.HSE. Asbestos: The analysts’ guide for sampling, analysis and clearance procedures, HSG248. 2005. Available online: http://www.hse.gov.uk/pUbns/priced/hsg248.pdf (accessed on 8 November 2019).
Figure 1. Qualitative analysis image by polarized light microscopy (PLM) from field sample (floor tile) with different pretreatment methods: (a) crushing and mixing, (b) ashing, (c) acid treatment, and (d) ashing and acid treatment.
Sustainability 11 06440 g001
Figure 2. Difference in asbestos concentrations by quantitative analysis (VE) for analysts based on reference sample (numbers in the box: concentration/reference, mean ± S.D).
Sustainability 11 06440 g002
Figure 3. Comparison of mean asbestos concentrations determined by each analyst from quantitative analysis. Boxes show the 25th and 75th percentiles. Median is indicated by the black line inside the box, mean is indicated by the dashed line, and reference is indicated by dash–dot–dot line.
Sustainability 11 06440 g003
Figure 4. Relationship between visual estimation and point counting results.
Sustainability 11 06440 g004
Figure 5. Comparison of VE and point counting (PC).
Sustainability 11 06440 g005
Table 1. Information on origin, number, ID, and asbestos content of the samples.
Origin of SamplesNSample IDAsbestos Content (%)Image of Sample
5715Not containing asbestos (0) Sustainability 11 06440 i001
6953CHRY (5) Sustainability 11 06440 i002
7831CHRY (6) Sustainability 11 06440 i003
9616CHRY (4) Sustainability 11 06440 i004
6624AMOS (4)
CHRY (1)
Sustainability 11 06440 i005
BAPAT109583CROC (2) Sustainability 11 06440 i006
9622CHRY (4) Sustainability 11 06440 i007
3428CHRY (3) Sustainability 11 06440 i008
8615CHRY (6) Sustainability 11 06440 i009
8993ANTH (3) Sustainability 11 06440 i010
091CHRY (20)
AMOS (1)
Sustainability 11 06440 i011
KOSHA-PAT3092CHRY (11) Sustainability 11 06440 i012
094CHRY (50) Sustainability 11 06440 i013
1000
(Roof slate)
CHRY (8) Sustainability 11 06440 i014
Field sample32000
(Ceiling textile)
CHRY (8) Sustainability 11 06440 i015
3000
(Floor tile)
CHRY (3) Sustainability 11 06440 i016
Total16
BAPAT: Bulk Asbestos Proficiency Analytical Testing program, KOSHA-PAT: Korea Occupational Safety and Health Agency Proficiency Analytical Testing program, CHRY: chrysotile, AMOS: amosite, CROC: crocidolite, ANTH: anthophyllite.
Table 2. Characteristics of samples identified by qualitative analysis and the time consumed for sample pretreatments.
Category Crushing and MixingAshingAcid WashingAshing and Acid Washing
A5
(33.3)
13
(86.6)
12
(80.0)
15
(100.0)
No. of samples with
asbestos identified by analysts among 15 asbestos-containing samples (%)
B5
(33.3)
13
(86.6)
12
(80.0)
15
(100.0)
C3
(20.0)
11
(73.3)
10
(66.7)
13
(86.6)
Sample pretreatment
time consumed
(min)
Act. 1Crushing
5
Weighing
5
Weighing
5
Weighing
5
Act. 2Slide
5
Heating
360
Acid
10
Heating
360
Act. 3-Slide
5
Drying
120
Acid
30
Act. 4--Slide
5
Drying
120
Act. 5---Slide
5
Total time consumed (min) 10370140520
Table 3. Difference in asbestos concentrations for quantitative analysis (visual estimation, VE) with different sample pretreatments (unit: %).
Sample IDStatusCrushing and MixingAshingAcid WashingAshing and Acid Washing
1000Chrysotile
content
5.07.020.060.0
Residue100.087.995.050.9
Chrysotile concentration5.06.219.030.5
Reference
concentration
8.0
2000Chrysotile
content
7.010.010.030.0
Residue100.082.783.326.7
Chrysotile concentration7.08.38.38.0
Reference
concentration
7.3
3000Chrysotile
content
N.D.2.02.05.0
Residue100.075.199.267.2
Chrysotile concentrationN.D.1.52.03.4
Reference
concentration
2.5
Residue: percentage of remaining weight after sample pretreatment procedure, chrysotile concentration: (chrysotile content × residue content)/100%, N.D.: non detection. All samples above contained chrysotile.
Table 4. Types of analytical errors in asbestos identification by qualitative analysis.
Sample IDTypes of ErrorTrue Asbestos TypeAnalyst
ABC
9583 1MisclassificationCROCAMOSAMOSAMOS
AMOSCROCCROCCROC
8893 1False negativeANTHANTHANTHN.D.
091 2AMOSAMOSAMOSN.D.
1 American Industrial Hygiene Association (AIHA)-PAT sample; 2 KOSHA-PAT sample. CROC: crocidolite, AMOS: amosite, ANTH: anthophyllite, N.D.: non detection.
Table 5. Comparison of the mean difference between data from different analysts.
SubjectMean ± SDRepeated Measurement ANOVA
p-value
A vs. B0.95 ± 0.630.91 ± 1.160.889
A vs. C0.95 ± 0.631.85 ± 1.510.021
B vs. C0.91 ± 1.161.85 ± 1.510.037
Table 6. Difference in determined asbestos concentrations by quantitative analysis (VE) based on actual levels.
Level of ConcentrationsConcentration/Reference
(Mean ± SD)
Analyst AAnalyst BAnalyst C
Less than 10%0.93 ± 0.811.11 ± 1.492.15 ± 1.85
10% or higher1.11 ± 0.380.77 ± 0.621.73 ± 1.00
Table 7. Comparison of data from analysts using two quantitative methods.
AnalystEstimated
Method
Concentration/ReferenceMean ± SD
1234
AVE1.140.600.800.600.79 ± 0.26
PC0.840.801.140.540.83 ± 0.25
BVE0.294.670.400.561.48 ± 2.13
PC0.363.501.100.801.44 ± 1.41
CVE2.236.670.601.882.84 ± 2.65
PC0.782.361.810.541.37 ± 0.86
VE: visual estimation; PC: point counting; Sample number: 1(9616); 2(9583); 3(3428);4(3000).

