Article

Spatiotemporal Change Characteristics of Nodes’ Heterogeneity in the Directed and Weighted Spatial Interaction Networks: Case Study within the Sixth Ring Road of Beijing, China

1
College of Resources Environment and Tourism, Capital Normal University, Beijing 100048, China
2
3D Information Collection and Application Key Lab of Education Ministry, Capital Normal University, Beijing 100048, China
3
Beijing State key Laboratory Incubation Base of Urban Environmental Processes and Digital Simulation, Capital Normal University, Beijing 100048, China
*
Author to whom correspondence should be addressed.
Sustainability 2019, 11(22), 6359; https://doi.org/10.3390/su11226359
Submission received: 14 September 2019 / Revised: 7 November 2019 / Accepted: 7 November 2019 / Published: 12 November 2019
(This article belongs to the Special Issue Geographic Data Science and Sustainable Urban Developments)

Abstract

:
Spatial heterogeneity patterns in cities are an essential topic in geographic research and urban planning. This paper analyzes the spatial heterogeneity of places and reflects on the urban structure in cites based on spatial interaction networks. To begin with, we constructed 24 sequentially directed and weighted spatial interaction networks (DWNs) on the basis of points of interest (POIs) and taxi GPS data in Beijing. Then, we merged 24 sequential networks into four clusters: early morning, morning, afternoon, and evening. Next, we introduced the weighted D-core decomposition method in view of the complex network method and weighted distance in a geographic space in order to obtain the in-coreness/out-coreness of places. Finally, three indices (the entropy index, the node symmetry index, and the t-test) were used to measure the heterogeneity of places from both the strength dimension and the direction dimension. The results showed: (1) For the strength dimension, the spatiotemporal strength characteristics of the nodes in the DWN are uneven on weekdays or on the weekends, and the strength heterogeneity on weekdays is more obvious than on weekends; (2) for the direction dimension, out-flows and in-flows are different in the early morning and evening on weekends. In addition, the direction of the DWN is not obvious. The city networks present flat characteristics. This study used the weighted D-core method to identify the heterogeneity of nodes in the DWN, which has certain theoretical and practical value for the planning of urban and urban systems and the coordinated development of cities.

1. Introduction

Spatial heterogeneity is a basic concept of geography which mainly reflects the first-order distribution of geographic phenomena and the spatiotemporal change characteristics of the second-order interaction in places [1]. The wide application of spatiotemporal big data and improvements in the social sensing concept offer a new paradigm for exploring spatial heterogeneity [2]. At the collective level, we can aggregate individuals’ or vehicles’ trajectories to obtain traffic flows between places. In addition to movement, when all individuals have been georeferenced, their connections like mobile phone calls and social ties can be summed up to form spatially-embedded networks which measure spatial interactions from a new perspective [3]. Recently, most studies have constructed spatial-interaction networks by applying social-media check-in data [4,5], mobile-phone records [6], taxi-trajectory data [7,8,9], survey-based migration data [10,11,12], and internet data [13,14] to analyze regional structure.
In recent years, research on identifying influential nodes in complex networks has attracted much attention because of its great theoretical significance, as well as its wide range of applications. Aiming at different types of networks and motivated by different problems and applications, researchers have proposed some methods such as degree centrality, closeness centrality, and betweenness centrality. Degree centrality [15] is based on the degree of a node, that is the number of arcs directly connected to it, which is a fundamental quantity describing the importance of nodes. Closeness centrality [16] relies on the length of the paths from a node to all other nodes in the network and is defined as the inverse total length. Betweenness centrality [17] relies on the identification of the shortest paths and measures the number of them that pass through a node, which characterizes how influential a node is in communicating between node pairs. Another centrality measure is the eigenvector centrality [15], which is defined as the principal or dominant eigenvector of the adjacency matrix A, which represents the connected subgraph or component of the network. Furthermore, the k-core decomposition method [18] and the improved k-core decomposition method that measure the importance of a node have gained popularity due to their low computational complexity and high accuracy compared to those of traditional measurements. For example, considering not only the internal properties of nodes but also the external properties of nodes, such as the community which these nodes belong to, Hu et al. [19] proposed the k-shell and community centrality (KSC) model to identify the most influential nodes. Garas et al. [20] presented a generalized method for calculating the k-shell structure of weighted networks by taking both the weight and the degree of a network into account. Giatsidis et al. [21] capitalized on the concept of graph degeneracy and defined a novel D-core framework, extending the classic graph-theoretic notion of k-cores for undirected graphs to directed ones.
However, most of the previous studies have had several problems in practice: (1) They have only focused on the analysis of undirected networks while ignoring the direction and weight of actual networks. It is natural that directed and weighted networks fit the real situation better, as they can more accurately define the different structure characteristics in each layer of a complex system; (2) lots of studies only use complex network analyzing methods when identifying the importance of nodes, and they barely consider the heterogeneity of a geographic space.
Inspired by these works, we wanted to construct directed and weighted networks and use the weighted D-core decomposition method to analyze the heterogeneity of nodes in networks. To achieve this purpose, we did the following work: Firstly, we constructed multiperiod spatial interaction networks; next, we applied the weighted D-core decomposition method to decompose the networks in order to obtain the out-coreness and in-coreness of nodes. After identifying the coreness, a discussion of the heterogeneity of directed and weighted spatial interaction networks (DWNs) is provided.
The paper is organized as follows. Section 2 introduces the study area and data. Section 3 presents the preprocessing, including extracting place footprints, constructing, and merging the DWNs. Section 4 analyzes the methods of the weighted D-core, the entropy index, the node symmetry index, and the t-test. Section 5 analyzes the characteristics of nodes’ heterogeneity in DWNs on weekdays and weekends. Section 6 provides a summary and a brief discussion.

2. Data Preparation

The study area in this research was within Beijing’s Sixth Ring Road, as shown in Figure 1, and included a large number of commercial and entertainment centers, government agencies, hospitals, and universities. It is the core urban area in Beijing and has a well-developed street network. Taxis are frequently used in the region. The dataset involved in this research included taxi GPS data and points of interest (POIs) from Dianping.com. Like most cities in China, taxis play an important role in intraurban transportation in Beijing (http://www.baogaochina.com/). This research used a dataset of more than 15,000 taxis for seven consecutive days (from 6th June to 3rd July in 2016) from several anonymous taxi companies. All trajectories were cleaned by removing invalid points caused by data recording or transfer errors. A few taxis travel across the Sixth Ring road, and we deleted these taxis’ data. Based on the data, we can identify the locations where passengers were picked up and dropped off and, thus, the origin and destination (OD) of a completed trip. Each trajectory includes only the reserved taxis’ ID, the coordinates of the OD, and the time of the OD. Table 1 shows an example of processed taxi data. Another dataset consisted of POIs from Dianping.com that provide users with a platform to post their ratings and reviews for restaurant and other entertainment services. A convex hull polygon whose vertices are points from the POIs which are filled in by retailers or customers could reflect peoples’ cognition of place footprints. We recorded nearly 80,000 businesses in Beijing on 6 June 2016 with the application programming interface (API) of Dianping.com. We only retained the name, coordinates, and places of the businesses after preprocessing. The data record of a processed POI sample is shown in Table 2.

3. Preprocess

3.1. Extracting Place Footprints

Using an appropriate spatial unit is an important role in geography research. However, there is no clear standard to select one in traditional geographical research. Some studies apply grids, traffic analysis zones (TAZs), and Voronoi polygons, all of which easily lead to discontinuities of geographic property values in a physical space. A place, as a geographical location associated with human activity, provides us with a natural geographical unit for understanding human behaviors in the urban environment because of its characteristics of scale independence and reflection of human cognition [22]. Places are extracted from the cognition of people, who consider vague boundary, land use, and semantic characteristics. The POIs from Dianping.com offer a new way to extract and model vague places. This research applied fuzzy-set theory [23] to extract place footprints based on Dianping.com data. To begin with, we measured the probability density of the place to which the POI belonged based on adaptive kernel-density estimation [24]. Secondly, we transferred the probability density to membership degree according to the relative study of the membership degree of the fuzzy function [25,26]. Finally, we modeled and extracted multiple vague places based on membership degree. The interaction between places accounts for a large proportion of the total interaction within the Sixth Ring Road. Therefore, we used the places as units. Figure 2 shows 150 places within the Sixth Ring Road of Beijing.

3.2. Construction and Aggregation of the Directed and Weighted Spatial Interaction Networks

The globally spatiotemporal patterns of trips exhibit a significant daily regularity [27]. The 30-day taxi-trip data were aggregated into one day from the original taxi GPS data, and we divided the taxi GPS data into hourly segments. Previous studies [27,28] have shown that there are significant differences in the temporal variations of taxi pick-ups and drop-offs between weekdays and weekends, so this research studied the spatial interaction network on workdays and weekends. We constructed a DWN with 150 places and their connections. The nodes are the places, and the edges are the interplace links connected by taxi trips. It is of special note that the weight of edges in the DWN is the number of trips between places. We defined the DWN as a directed and weighted network G = V ,   E ,   W t . The node set was defined as V = v 1 , v 2 , , v n , where n is the number on nodes. The edge set was defined as E = e 1 , e 2 , , e m , , where m is the number of edges. Additionally, the weight of each edge W i j = w 12 , , w 1 n , , w n 1 , w nn was set as the frequency of link directly between places. t = 0 , 1 , , 23 was set as the time. The standard procedure is to collect all links within a time window [t, t + Δ t   ] into a network snapshot. The resolution in this research was Δ t = 1   h   ; therefore, each snapshot aggregated links within one hour. We defined the DWN from 0:01 to 1:00 as the initial network snapshot G 0 , the snapshot G 1 was represented the DWN from 1:01 to 2:00, and the last one, G 23 , was set from 23:01 to 24:00. As a result, we constructed 24 snapshots on weekdays and weekends.
Humans moving with the same purpose will have similar patterns of human moving behavior. In order to study the general patterns of activity, we applied the hierarchical-clustering algorithm to merge snapshots with similar characteristics. According to the direction of the clustering process, hierarchical methods were divided into agglomerative and divisive ones [29]. The hierarchical agglomerative clustering algorithm, a common unsupervised classification method, comprises three repeated steps: (i) Merge the nodes with the highest similarity into a new node/cluster, (ii) update the similarities between the new node and the former existing nodes, and (iii) repeat the procedure until only one node is left. We applied the three steps to merge the snapshots based on [30]. Firstly, we measured the distance between 24 snapshots on the basis of the Jensen–Shannon distance method to obtain a dissimilarity matrix. The Jensen–Shannon distance method, which is an entropy-based measure, was proposed as a similarity measure for networks [31]. In general, the Jensen–Shannon distance evolved from the Kullback–Liebler distance and is a more suitable quantity to measure the dissimilarity between two matrices than the Kullback–Liebler distance. Next, we used the hierarchical agglomerative clustering algorithm to merge the snapshots in view of the dissimilarity matrix; finally, we aggregated 24 snapshots into four clusters based on the ratio of between-cluster variance to the total variance on weekdays and weekends. The four periods were early morning (0:01–7:00), morning (7:01–11:00), afternoon (11:01–17:00), and evening (17:01–24:00) on weekdays, and the periods were early morning (0:00–5:00), morning (5:01–12:00), afternoon (12:01–18:00), and evening (18:01–24:00) on weekends.

4. Methods

4.1. The Weighted D-Core Decomposition Method

A k-core decomposition method was derived by recursively removing all nodes with a degree that was less than or equal to k until all nodes in the remaining network had a degree of at least k [32]. The D-core decomposition method [21], used on directed networks, is an extension of the k-core decomposition method, which is used on undirected networks. We defined a directed network as D = V , E . The node set was defined as V = v 1 , v 2 , , v n . For each node, v V could be seen as a pair v = p , q and we defined p as the in-degree and q as the out-degree. Given an edge set E = e 1 , e 2 , , e m , , each edge e = a , b , we denoted a as the tail of e, while b was denoted the head of e. The D-core of a given network can be obtained by a recursive pruning algorithm that, at each step, removes all existing nodes with in-degrees less than or equal to integer k and out-degrees less than or equal to integer l.
We redefined the weight of nodes in the D-core decomposition method based on [20]. According to the characteristics of degree in the complex network, the number of the edges, and the distance between nodes in geographical space, the weighted in-degree of a node i is defined as:
k i = k i α j k i S ji * D ji β 1 α + β
and the weighted out-degree of a node i is defined as:
l i = l i α j l i S ij * D ij β 1 α + β
where k i is the weighted in-degree of node i in the directed and weighted network, k i is the in-degree of node i, l i is the weight out-degree of node i in the directed and weighted network, l i is the out-degree of node i, and α and β are the adjustment parameters of node degree and node weights. We only considered the case when α = β = 1 in this research. S ij and D ij are the amount and the distance of links between origin node i and destination node j, respectively. We supposed that there were three nodes—A, B, and C. When S AB = S AC and D AB > D AC , nodes A and B have a long distance while having strong connections, that is the weight of Link AB is more important than that of Link AC. As a result, when the distance between nodes is bigger, the edge weight is more important.

4.2. The Measuring Methods of Strength Heterogeneity

The heterogeneity of nodes in spatial interaction networks can be characterized by two dimensions. The first dimension is strength, and the other is direction [33]. Three indices were devised to measure the two dimensions of heterogeneity—the entropy index (EI), the node symmetry index (NSI), and the link symmetry index (LSI). Two indices (EI and NSI) are now proposed to be important for characterizing node strength. LSI is used to measure the direction.
(1)
The Entropy Index
In order to measure the equilibrium in the weighted in-coreness and weighted out-coreness of all nodes in the directed and weighted network, we introduce the method of the entropy index (EI) [34]. The entropy index of weighted out-coreness is defined as:
EI O = i = 1 m RO i Ln RO i Ln m  
and the entropy index of weighted in-coreness is defined as:
EI I = i = 1 m RI i Ln RI i Ln m  
where RO i is the ratio of the weighted out-coreness of node i to the total weight in the directed and weighted network, RI i is the ratio of the weighted in-coreness of node i to the total weight in the directed and weighted network, and m is the number of nodes. It is worth noting that EI O = 0 or EI I = 0 , if there are significant differences between out-coreness or in-coreness, that is the strength of the nodes is significantly hierarchical. The internal difference of the weighted out-coreness or in-coreness in the directed and weighted network gradually becomes smaller as the value of EI O or EI I increases. When EI O = 1 or EI I = 1 , the weighted out-coreness or in-coreness is evenly distributed.
(2)
The Node Symmetry Index
Limtanakool [33] applied the node symmetry index (NSI) to measure the symmetry of nodes based on out-degree and in-degree. We researched the strength of nodes in view of weighted out-coreness and weighted in-coreness. The node symmetry index of node i is defined as:
N S I i = I i O i I i + O i  
where O i and I i are the weighted out-coreness and in-coreness of node i, respectively. N S I i = 1 represents that a node is asymmetrical with a maximum out-coreness, while N S I i = 1 represents that a node is asymmetrical with a maximum in-coreness. In addition, the A network does not have a hierarchical structure when every node in the network has N S I i = 0   , that is a node is fully symmetrical in terms of its net flow. It was found that the difference of the strength of a node increases with the addition of the absolute value of NSI i   .

4.3. The Measuring Methods of Direction Heterogeneity

A t-test is a type of statistical test that is used to compare the differences between the two groups. It is one of the most widely used statistical hypothesis tests in studies [35]. As a type of parametric method, the t-test can be used when the samples satisfy the conditions of normality, equal variance, and independence [36]. Usually, the t-test is divided into the independent t-test and the paired t-test. The independent t-test can be used for a situation where there are two independent groups, while the paired t-test is different than the independent t-test and is used to evaluate two dependent groups. We used the paired t-test in this research to measure the symmetry of direction. Our approach comprised two steps. First, we supposed that there was no difference between the two paired samples. Second, we used the value of significant probability to prove the feasibility of the hypothesis. When the value of significant probability was less than 0.05, it was considered that there was a significant difference between two paired samples and vice versa.
We analyzed the out-flows and in-flows in the DWN with the help of the t-test in order to measure the difference of the direction of places. There were three consecutive steps. First, we created a flow link table for one place and the other 149 places, one of which was the number of in-links and the other was the number of out-links. Next, we supposed that there was a significant difference in the flow direction of place on the basis of the paired t-test method to test the tendency of the in-flow and out-flow. Finally, the direction heterogeneity of places was analyzed by using the value of significant probability.

5. Results

We used places as the unit to construct the DWN in this research and applied the weighted D-core decomposition method to obtain the weighted out-coreness and weighted in-coreness of nodes. Finally, we analyzed the heterogeneity of nodes from both the strength dimension and the direction dimension with the help of the entropy index, the node symmetry index, and the t-test.

5.1. The Heterogeneity of Nodes in DWN on Weekdays

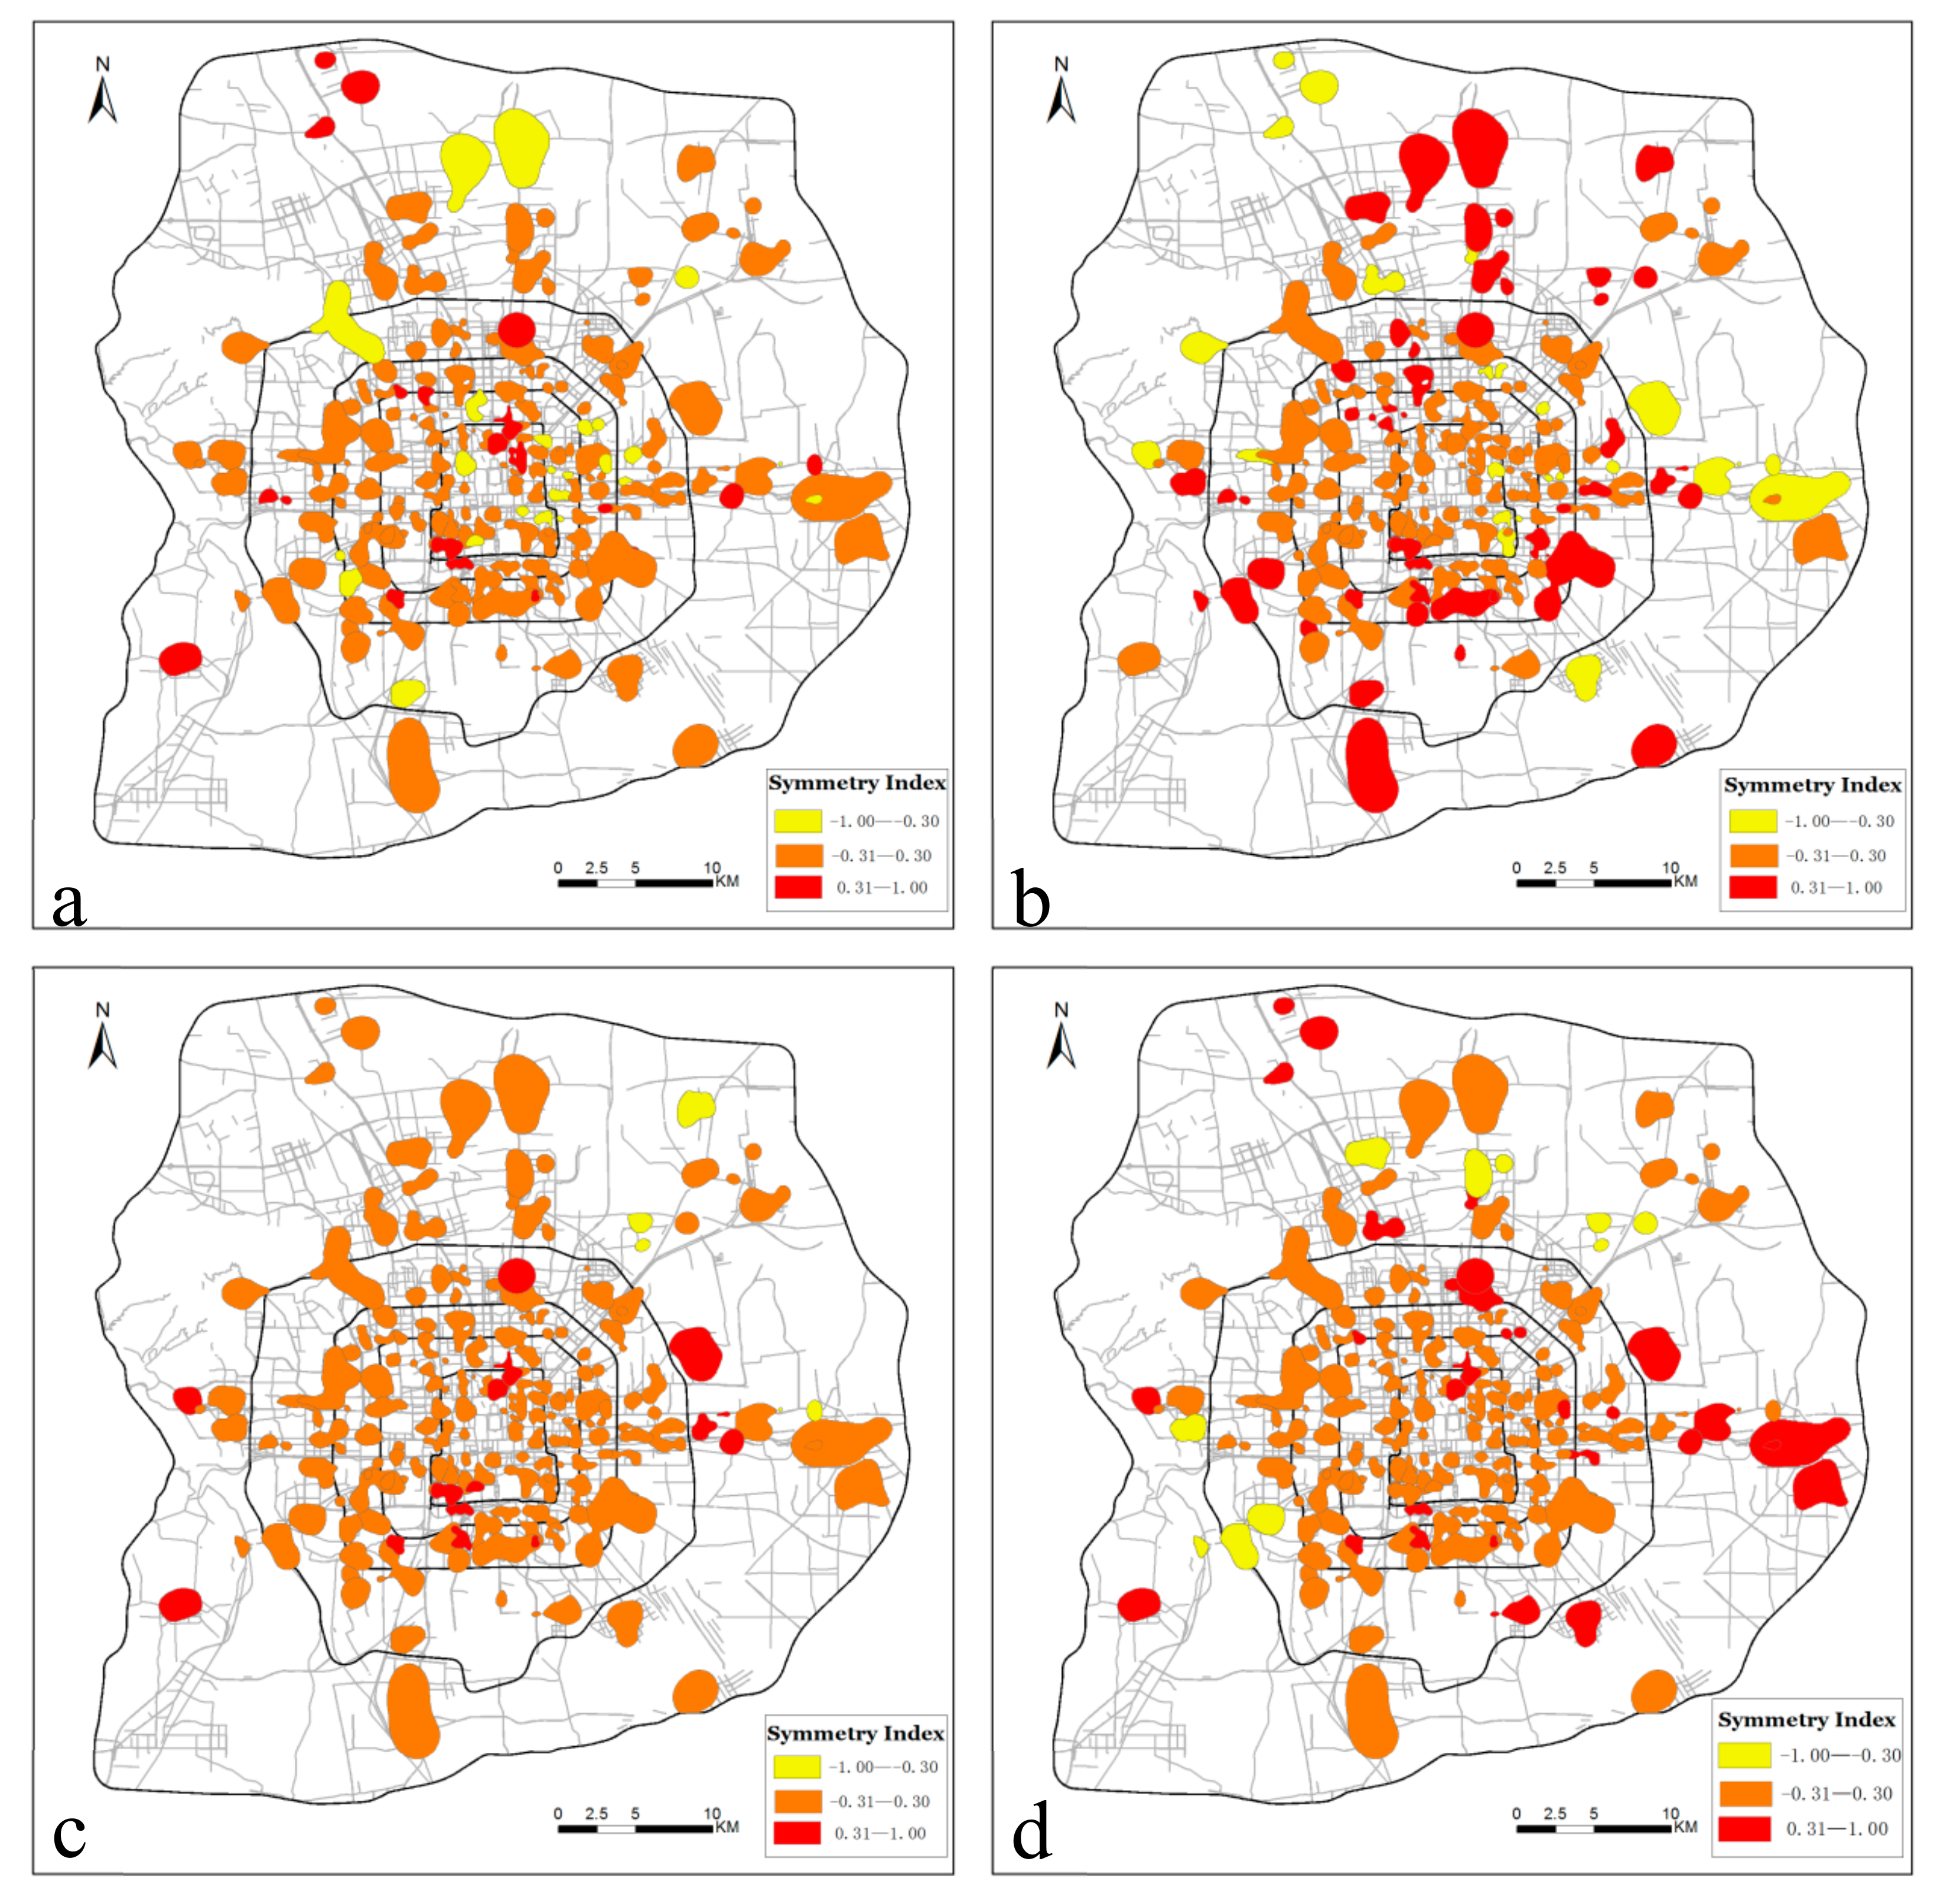
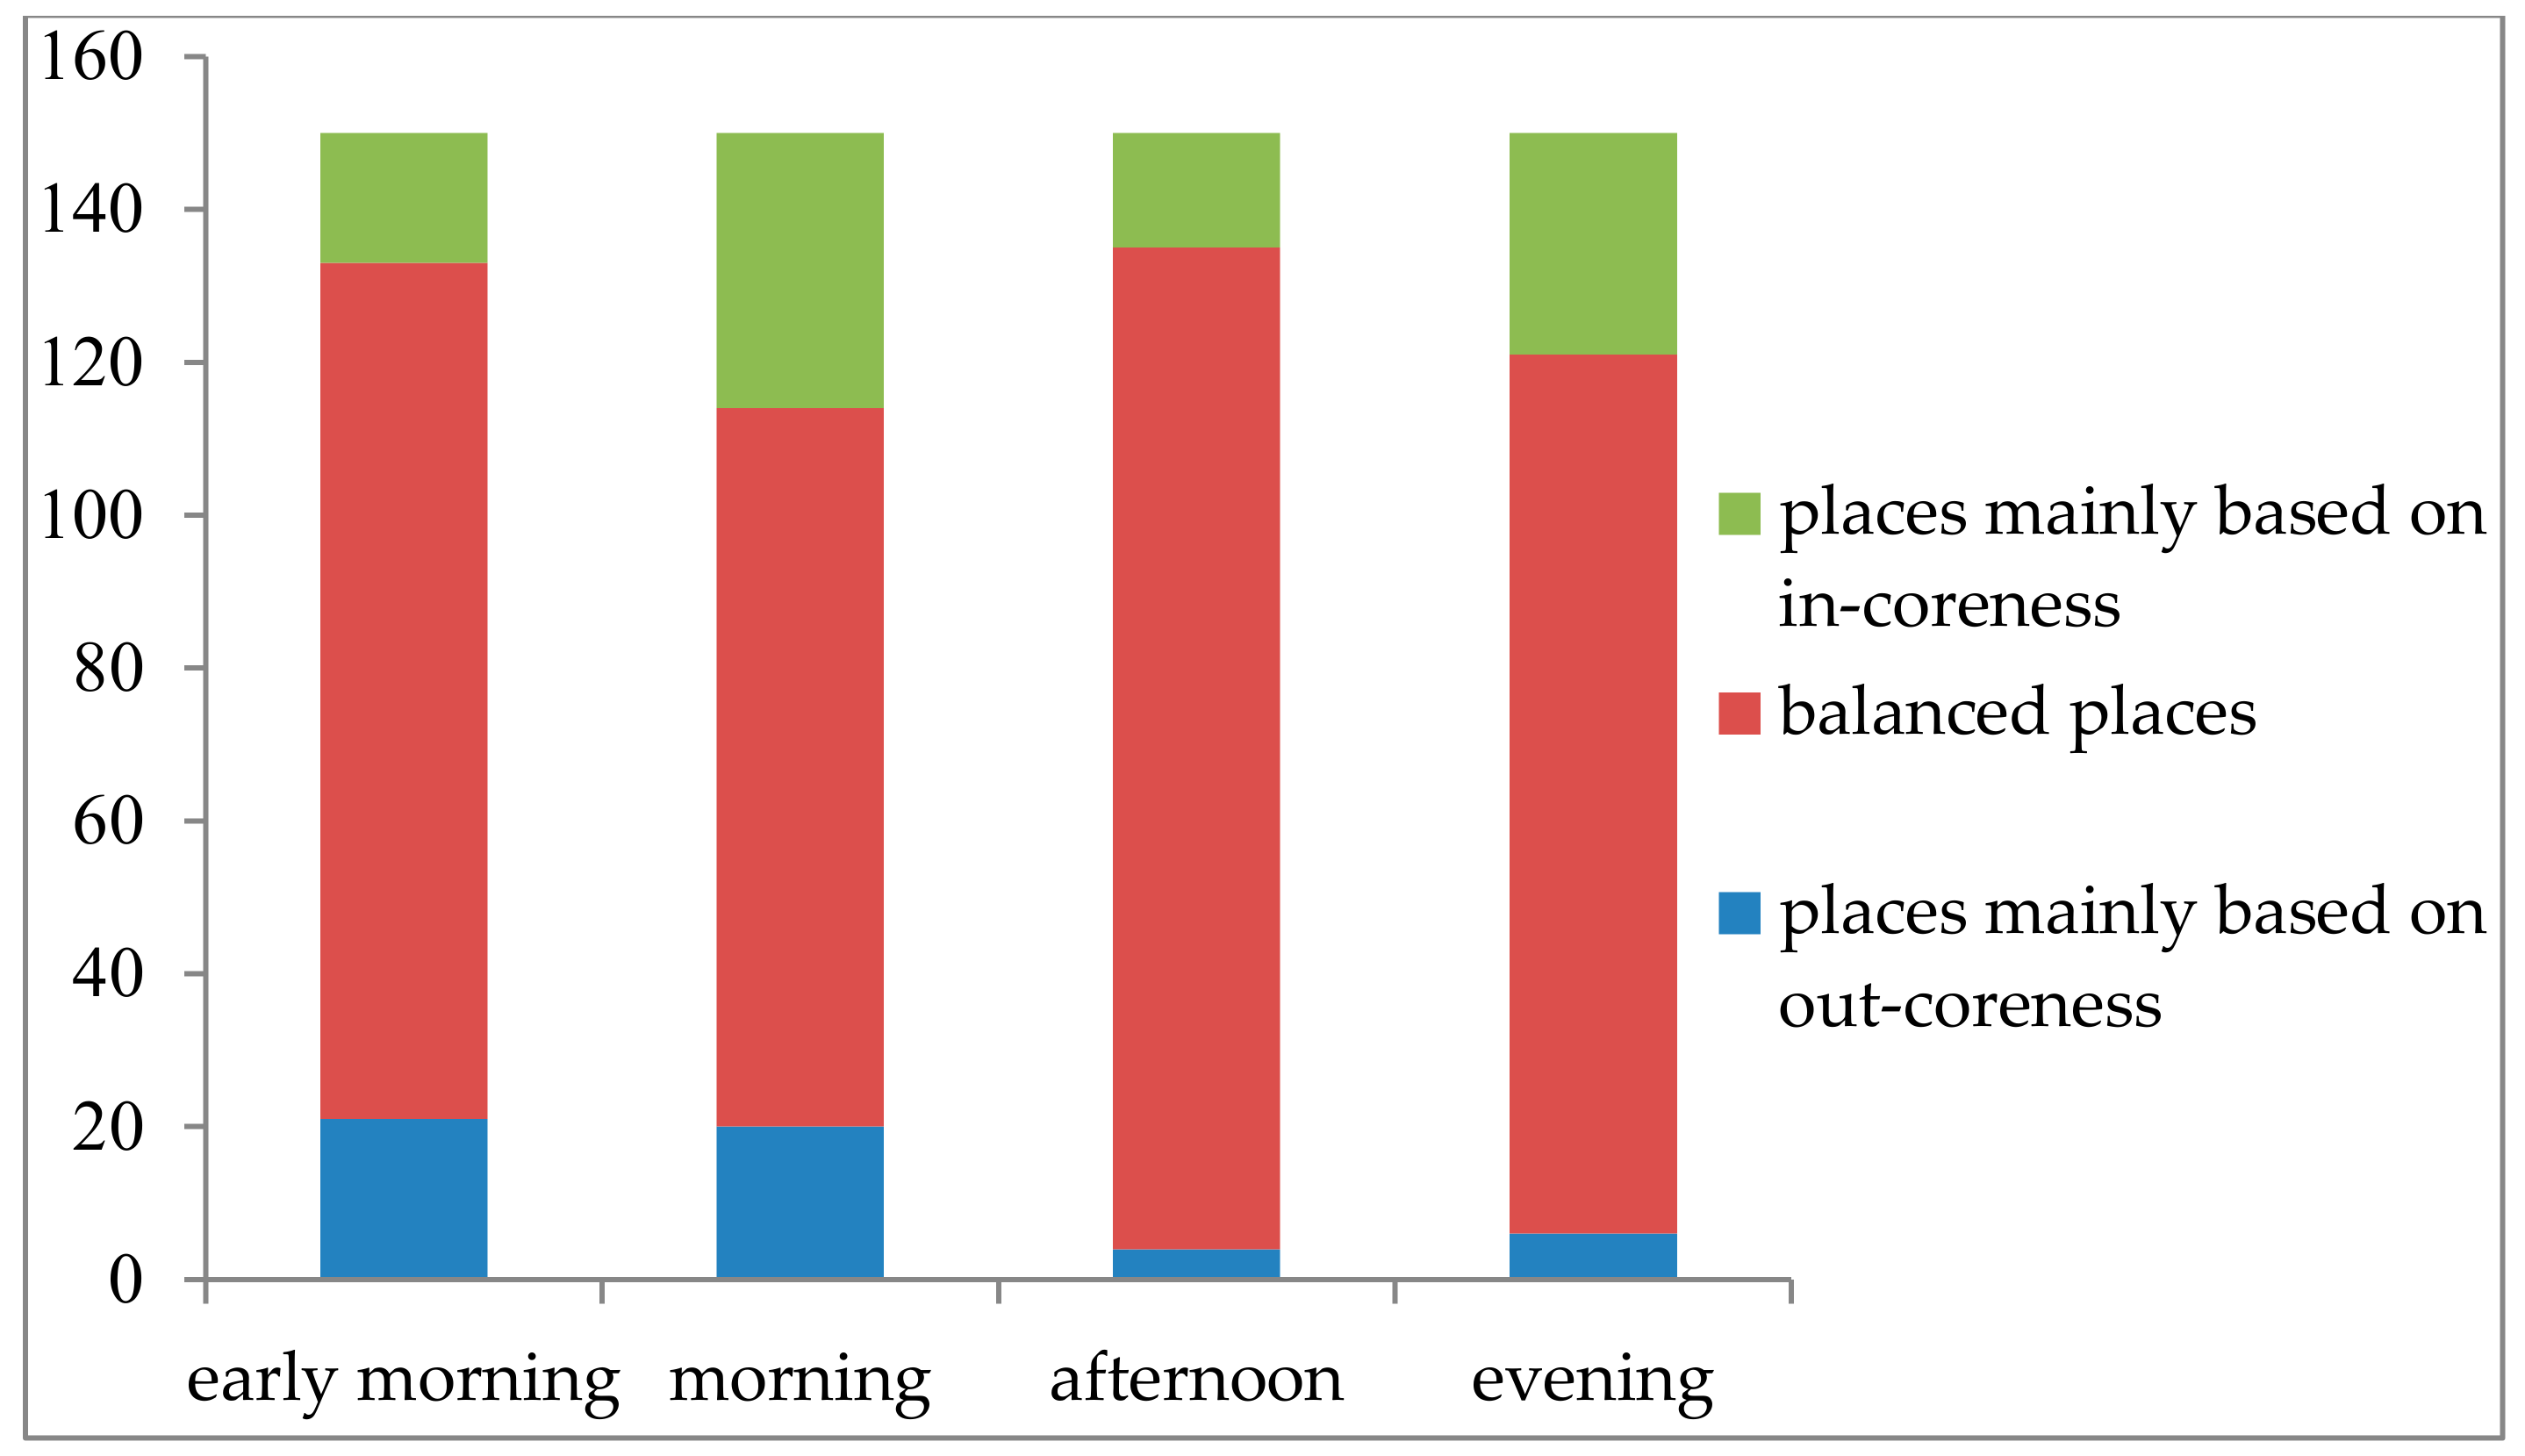
5.1.1. The Strength Characteristics of Nodes on Weekdays

From the result the EI, we were able to obtain the distribution and change of the entropy index of nodes. Figure 3 shows that the entropy index of weighted out-coreness and weighted in-coreness was comparatively high. This means that the weighted out-coreness and the weighted in-coreness were evenly distributed. It is worth noting that the weighted in-coreness increased while the weighted out-coreness decreased during a single day. It can be seen that the difference of weighted out-coreness gradually increased, and the weighted in-coreness tended to be more balanced in the four periods on weekdays.
We obtained the symmetry index of nodes in the DWN on the basis of the NSI to explore the difference of nodes’ strength. In this paper, if 1 N S I i < 0.3 , the places were considered to be departure places, mainly based on out-coreness. Conversely, the places were defined as balanced places when 0.3 N S I i 0.3 , while the places were considered to be arrival places, mainly based on in-coreness, when 0.3 < N S I i 1 . Figure 4a–d shows the spatial distribution of the nodes’ symmetry index in the early morning, morning, afternoon, and evening on weekdays, respectively, and Figure 5 shows the number characteristics of the symmetry index of nodes in four periods on weekdays. The balanced places contributed to a large proportion and were widely distributed in four periods. Specifically, 44% of total places, like Guangneidajie, Jiangguomen-Beijing station, and Xinjiekou, were always balanced places in the four periods.
The number of departure places decreased from the early morning to the evening. Twenty-one places were discovered, and these were mainly located within the Second Ring Road of Beijing in the early morning, e.g., Guangqumen, Taoranting, and Chongwenmen. This was probably due to there being some famous commercial centers nearby, such as Qianmen, Houhai, Dongzhimen, and Xidan. Active people with various daytime and nightlife activities were found to always show up at these places. In the morning, 20 places were identified, and a wide distribution occurred in two areas—one between the east of the Second Ring Road and the east of the Third Ring Road, including Guangqumen, Chaoyangmen, Xiaozhuang, and Qingyunlu, and the other from the Fifth Ring Road to the Sixth Ring Road, including places such as Dongba, Guanzhuang, Xinhuadajie, Qinghe. The functions of the places discovered in the morning are residential. The number of places dropped in the afternoon. Only four places (Caofang, Wuzixueyuan, Maquanying, and Houshayu) appeared in this period. It is worth noting that the function of these four places is residential. Similarly, six residential places were identified in the evening, including Maquanying, Sunhe, Lugouqiao, Gucheng-bajiao, Huilongguan, and Tiantongyuan, located north and west of the Fifth Ring Road.
The number of arrival places in the early morning and afternoon was low, while the number was high in the morning and evening. Some arrival places were repeated in the four periods, like Kaiyangli, Shuangqiao, Xiajiahutong-jijiamiao, Datun, and Songjiazhuang. Seventeen places, including Andingmen, Dianmen, and Dongsi, located near the Second Ring Road, reflected the characteristics of early morning travel. A wide distribution occurred in the north and south between the Second and the Sixth Ring Roads in the morning. Those places, such as Beiqijia, Beiyuanjiayuan, Huangcun, and Dahongmen, are mostly commercial districts, and a small number of them are residential districts. A decreasing trend occurred in the afternoon, with only 15 residential places appearing, such as Dongba, Moshikou, and Majiapu-jiaomen. In addition, there were 29 arrival places in the evening, including Dongba, Moshikou, Kaiyangli, and Shuangjing. Their locations were also various and distributed from the Fifth Ring Road to the Sixth Ring Road.

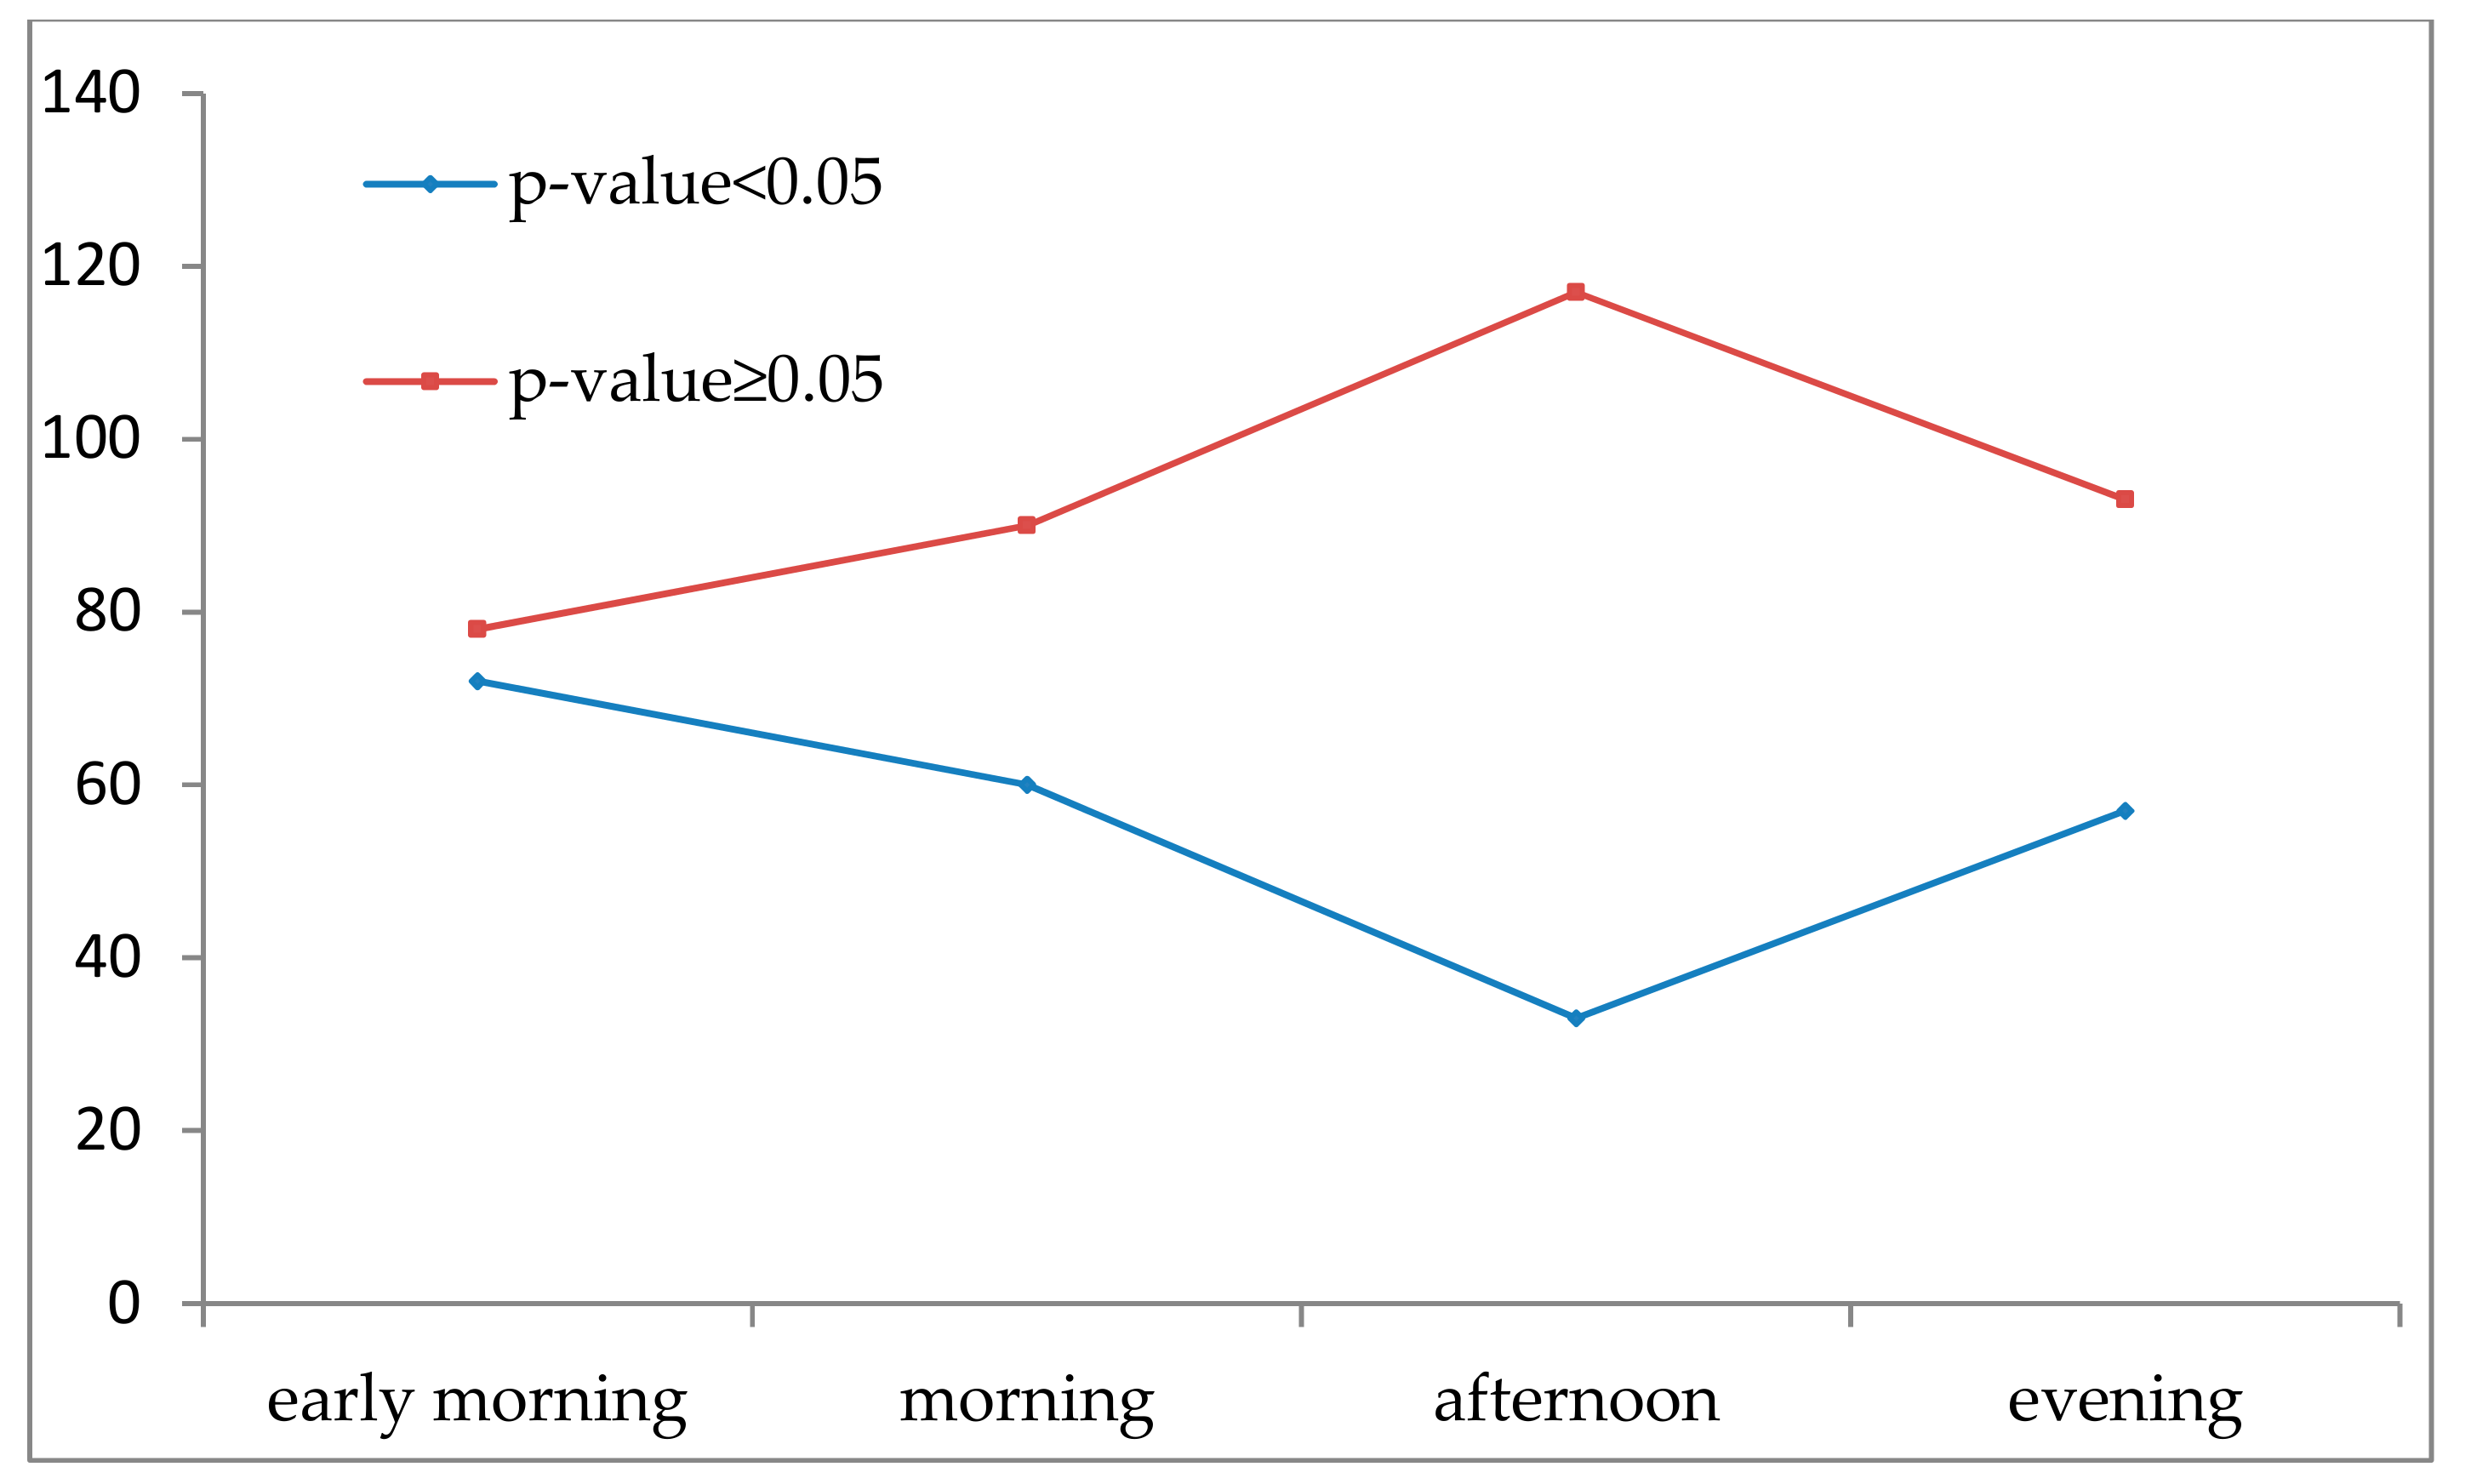
5.1.2. The Direction Characteristics of Nodes on Weekdays

As shown in Figure 6, the results of the paired t-test show that the places where the significant probability value was less than 0.05 include Jianguomen-Beijing Railway Station, Beijing Capital International Airport, and Sanlitun, accounting for 54% of the total places in the early morning. The in-flows and out-flows of those places had an obvious tendency. In the morning, there were 66 places, accounting for 44% of the total places, for which the significant probability value was less than 0.05, such as Beijing Capital International Airport, Fuxingmen, Xidan, and Chaowaidajie. Most places in the morning were not different in direction heterogeneity. In the afternoon, the number of places with a significance probability value less than 0.05 continuously decreased, accounting for only 26% of total places. However, there were 88 places identified that had significant difference in flow direction because of their value of significant probability, which was less than 0.05. The interesting thing is that there were constant places that were responsible for 11% of the total places which were heterogeneous from the direction dimension perspective in four periods on weekdays. In conclusion, lots of places were found to have significant direction heterogeneity in the early morning and evening, while there was no obvious difference in the morning and afternoon.

5.2. The Heterogeneity of Nodes in DWN on Weekends

5.2.1. The Strength Characteristics of Nodes on Weekends

As shown in Figure 7, the entropy index of weighted in-coreness and out-coreness on weekends was not similar to the performance on weekdays. The value of the entropy index fluctuated dramatically. That means the nodes in DWM on weekends had larger heterogeneity than on weekdays. It can be seen from Figure 8 and Figure 9 that the number of balanced nodes in the four periods on weekends greatly changed. The number of balance nodes in the morning was the minimum, accounting for 32% of the total places, while there was a large proportion of places in the afternoon, accounting for 76% of the total places. There were also 22 constant balanced places in the four periods, including Dongzhimen, Zuoanmen, Zhongguancun, and Fangzhaung.
Departure places in the early morning were widely distributed between the Second and Sixth Ring Roads despite the number being small, including Huilongguan, Tongtianyuan, Shangdi, and Shuangjing. There were 51 departure places in the morning that were widespread throughout the entire study area. However, a decreasing trend occurred in the afternoon, with only 13 places between the Fifth and Sixth Ring Roads, such as Xiangshan, Beiqijia, and Lugouqiao. Further, there were some residential places in the evening such as Beiqijia and Tiantongyuan, as well as tourism places, including Xiangshan and Lugouqiao, located between the Fifth and Sixth Ring Roads.
There were a large proportion of arrival places in early morning between the Fifth and Sixth Ring Roads. The places mainly covered commercial (Wangjing, Datun, Guomao, etc.) and residential districts (Zizhuqiao, Yizhuang, Huanxiang, and so on). In the morning, the arrival places that were mainly based on in-coreness gradually increased, and their spatial distribution was mostly within the Fifth Ring Road. In the afternoon, the number of arrival places dropped, mainly including 23 places, such as Maquanying and Tiantongyuan. The spatial distribution was mainly located between the Fifth and Sixth Ring Roads. The function of the places was residential. Lots of residential places (Hangtianqiao, Songjiazhaung, Yizhuang, and so on) that were mainly arrival places were found to be located between the Fifth and Sixth Ring Roads in the evening.

5.2.2. The Direction Characteristics of Nodes on Weekends

We measured the tendency of the node flow using the t-test method, as shown in Figure 10. It can be concluded that there are places, accounting for 48%, 40%, 22%, and 38% of the total places, for which the significant probability value was less than 0.05 in the early morning, morning, afternoon, and evening, respectively. It is interesting that there were eight places for which the significant probability value was less than 0.05, including Beijing Capital International Airport, Andingmen, and Dongba. This shows that the tendency of in-flow and out-flow was not obvious, that is there was no significant direction heterogeneity on weekends. It can be seen that the DWN on weekends presented flat characteristics.

6. Conclusions

The hot places of human activities are defined as nodes, and the taxi trips between places are defined as edges. We constructed a DWN within the Sixth Ring Road. Then, we decomposed the networks on the basis of the weighted D-core decomposition method. Finally, we analyzed the heterogeneity of the nodes in the DWN on weekdays and weekends. We analyzed the strength heterogeneity of nodes using the entropy index and the node symmetry index, and we explored the direction heterogeneity of nodes with the help of the t-test. We revealed the heterogeneity of nodes from both the strength dimension and the direction dimension so that we could understand the city’s spatial heterogeneity.
For the strength, there was significant heterogeneity in the spatiotemporal characteristics of nodes’ strength in the four periods on weekdays. The nodes with imbalanced in-coreness/out-coreness were widely distributed in the morning and afternoon, while they showed an opposite characteristic in the evening and early morning. Among them, the places with imbalanced strength in the early morning were mainly within the Second Ring Road, and the distribution in the evening was located between the Fifth and Sixth Ring Roads. However, a wide distribution of imbalanced strength nodes appeared in the early morning and morning on weekends, and a small proportion of places of imbalanced in-coreness/out-coreness in the afternoon and evening were mainly located between the Fifth and Sixth Ring Roads. For the direction dimensions, there was an obvious tendency of in-flow/out-flow that showed the asymmetry relationship among places in the early morning and evening on weekdays, while there were symmetry characteristics among places in the morning and afternoon on weekdays and on weekends.
In conclusion, the characteristics of nodes strength heterogeneity in geographical space changed during the four periods. There was significant strength heterogeneity in geographical space during the day. However, the strength heterogeneity was distributed in between the Fifth and Sixth Ring Roads or within the Second Ring Road at night. It is worth noting that the strength heterogeneity of the area between the Fifth and Sixth Ring Roads has been high during the day. In addition, the direction of interaction in geographical space was found to change little during a day, and the interactive flows in geographical space had no obvious agglomeration characteristics.
This research improves the D-core decomposition method based on a complex network method and spatial weight, to some extent expanding the spatial network analysis method. Characterizing urban spatial heterogeneity from two dimensions—strength and direction—plays an important role in sensing the distribution, interaction, and dynamic evolution of geographical phenomena. However, in our work, a limitation needs to be mentioned. We focused on the study of taxi transit users, and we did not observe humans traveling by other modes, e.g., private cars, metros, or buses. In future research, multisource big data should be used to capture the spatial behavior patterns of a large population and reveal the coupling relationship between people and land.

Author Contributions

J.Z. designed the experiments; J.Y. performed the experiments; J.Y. and D.Y. analyzed the data and wrote the paper; J.L. and Y.L. contributed on mapping and revising the manuscript.

Funding

This research was funded by the Open Project Program of the State Key Laboratory of Virtual Reality Technology and Systems, Beihang University (Grant No. 01119220010011).

Conflicts of Interest

The authors declare no conflict of interest.

References

  1. Liu, Y. Revisiting several basic geographical concepts: A social sensing perspective. Acta Geogr. Sin. 2016, 71, 564–575. [Google Scholar]
  2. Liu, Y.; Zhan, Z.; Zhu, D.; Chai, Y.; Ma, X.; Wu, L. Incorporating multi-source big geo-data to sense spatial heterogeneity patterns in an urban space. Geomat. Inf. Sci. Wnhan Univ. 2018, 43, 327–335. [Google Scholar]
  3. Liu, Y.; Liu, X.; Gao, S.; Gong, L.; Kang, C.; Zhi, Y.; Chi, G.; Shi, L. Social sensing: A new approach to understanding our socioeconomic environments. Ann. Assoc. Am. Geogr. 2015, 105, 512–530. [Google Scholar] [CrossRef]
  4. Liu, Y.; Sui, Z.; Kang, C.; Gong, L. Uncovering patterns of inter-urban trip and spatial interaction from social media check-in data. PLoS ONE 2014, 9, e86026. [Google Scholar] [CrossRef] [PubMed]
  5. Xu, J.; Li, A.; Li, D.; Liu, Y.; Du, Y.; Pei, T.; Ma, T.; Zhou, C. Difference of urban development in China from the perspective of passenger transport around Spring Festival. Appl. Geogr. 2017, 87, 85–96. [Google Scholar] [CrossRef]
  6. Kang, C.; Zhang, Y.; Ma, X.; Liu, Y. Inferring properties and revealing geographical impacts of intercity mobile communication network of China using a subnet data set. Int. J. Geogr. Inf. Sci. 2013, 27, 431–448. [Google Scholar] [CrossRef]
  7. Liu, X.; Gong, L.; Gong, Y.; Liu, Y. Revealing travel patterns and city structure with taxi trip data. J. Trans. Geogr. 2015, 43, 78–90. [Google Scholar] [CrossRef]
  8. Peng, C.; Jin, X.; Wong, K.; Shi, M.; Lió, P. Collective human mobility pattern from taxi trips in urban area. PLoS ONE 2012, 7, e34487. [Google Scholar]
  9. Tao, R.; Thill, J. flowAMOEBA: Identifying Regions of Anomalous Spatial Interactions. Geogr. Anal. 2019, 51, 111–130. [Google Scholar] [CrossRef]
  10. Tao, R.; Thill, J. Flow Cross K-function: A Bivariate Flow Analytical Method. Int. J. Geogr. Inf. Sci. 2019, 2055–2071. [Google Scholar] [CrossRef]
  11. Jung, P.; Kashiha, M.; Thill, J. Community structures in networks of disaggregated cargo flows to maritime ports. In Information Fusion and Intelligent Geographic Information Systems (IF&IGIS ′17); Springer: Cham, Switzerland, 2018; pp. 167–186. [Google Scholar]
  12. Tao, R.; Thill, J. Spatial cluster detection in spatial flow data. Geogr. Anal. 2016, 48, 355–372. [Google Scholar] [CrossRef]
  13. Townsend, A. Network cities and the global structure of the Internet. J. Am. Behav. Sci. 2001, 44, 1697–1716. [Google Scholar] [CrossRef]
  14. Zhang, W.; Thill, J. Mesoscale structures in world city networks. Ann. Am. Assoc. Geogr. 2019, 109, 887–908. [Google Scholar] [CrossRef]
  15. Bonacich, P. Factoring and weighting approaches to status scores and clique identification. J. Math Sociol. 1972, 2, 113–120. [Google Scholar] [CrossRef]
  16. Freeman, L. Centrality in social networks conceptual clarification. J. Soc. Netw. 1979, 1, 215–239. [Google Scholar] [CrossRef]
  17. Freeman, L. A set of measures of centrality based on betweenness. J. Sociom. 1977, 40, 35–41. [Google Scholar] [CrossRef]
  18. Seidman, S. Network structure and minimum degree. Soc. Netw. 1983, 5, 269–287. [Google Scholar] [CrossRef]
  19. Hu, Q.; Gao, Y.; Ma, P.; Yin, Y.; Zhang, Y.; Xing, C. A new approach to identify influential spreaders in complex networks. J. Acta Phys. Sin. 2013, 62, 99–104. [Google Scholar]
  20. Garas, A.; Schweitzer, F.; Havlin, S. A k-shell decomposition method for weighted networks. New J. Phys. 2012, 14, 083030. [Google Scholar] [CrossRef]
  21. Giatsidis, C.; Thilikos, D.M.; Vazirgiannis, M. D-cores: Measuring collaboration of directed graphs based on degeneracy. Knowl. Inf. Syst. 2013, 35, 311–343. [Google Scholar] [CrossRef]
  22. Agnew, J.A. Place and politics: The geographical mediation of state and society. Trans. Ins. Br. Geogr. 1987, 13, 251. [Google Scholar]
  23. Zadeh, L.A. Fuzzy sets. Inf. Control 1965, 8, 338–353. [Google Scholar] [CrossRef]
  24. Wang, S.; Liu, Y.; Chen, Z.; Shi, L.; Zhang, J. Representing multiple urban places’ footprints from Dianping.com data. Acta Geod. Cartogr. Sin. 2018, 47, 1105–1113. [Google Scholar]
  25. Gao, S.; Li, L.; Li, W.; Janowicz, K.; Zhang, Y. Constructing gazetteers from volunteered big geo-data based on Hadoop. J. Comput. Environ. Urban Syst. 2017, 61, 172–186. [Google Scholar] [CrossRef]
  26. Robinson, V. A perspective on the fundamentals of fuzzy sets and their use in geographic information systems. J. Trans. GIS 2003, 7, 3–30. [Google Scholar] [CrossRef]
  27. Liu, Y.; Kang, C.; Gao, S.; Xiao, Y.; Tian, Y. Understanding intra-urban trip patterns from taxi trajectory data. J. Geogr. Syst. 2012, 14, 463–483. [Google Scholar] [CrossRef]
  28. Liang, X.; Zheng, X.; Lv, W.; Zhu, T.; Xu, K. The scaling of human mobility by taxis is exponential. J. Phys. A 2012, 391, 2135–2144. [Google Scholar] [CrossRef]
  29. Li, J.; Li, J.; He, H. A simple and accurate approach to hierarchical clustering. J. Comput. Inf. Syst. 2011, 7, 2577–2584. [Google Scholar]
  30. Yang, J.; Yi, D.; Qiao, B.; Zhang, J. Spatio-Temporal Change Characteristics of Spatial-Interaction Networks: Case Study within the Sixth Ring Road of Beijing, China. ISPRS Int. J. Geo-Inf. 2019, 8, 273. [Google Scholar] [CrossRef]
  31. De Domenico, M.; Nicosia, V.; Arenas, A.; Latora, V. Structural reducibility of multilayer networks. Nat. Commun. 2015, 6, 6864. [Google Scholar] [CrossRef] [PubMed]
  32. Carmi, S.; Havlin, S.; Kirkpatrick, S.; Shavitt, Y.; Shir, E. A model of Internet topology using k-shell decomposition. Proc. Natl. Acad. Sci. USA 2007, 104, 11150–11154. [Google Scholar] [CrossRef] [PubMed]
  33. Limtanakool, N.; Schwanen, T.; Dijst, M. Developments in the Dutch urban system on the basis of flows. J. Reg. Stud. 2009, 43, 179–196. [Google Scholar] [CrossRef]
  34. Derudder, B.; Witlox, F. The impact of progressive liberalization on the spatiality of airline networks: A measurement framework based on the assessment of hierarchical differentiation. J. Trans. Geogr. 2009, 17, 276–284. [Google Scholar] [CrossRef]
  35. Yim, K.; Nahm, F.; Han, K.; Park, S. Analysis of statistical methods and errors in the articles published in the Korean journal of pain. Korean J. Pain 2010, 23, 35. [Google Scholar] [CrossRef] [PubMed]
  36. Kim, T. T test as a parametric statistic. Korean J. Anesthesiol. 2015, 68, 540. [Google Scholar] [CrossRef] [PubMed] [Green Version]
Figure 1. Study area in Beijing, denoted by blue.
Sustainability 11 06359 g001
Figure 2. Distribution of 150 places within the Sixth Ring Road of Beijing.
Sustainability 11 06359 g002
Figure 3. The entropy index of weighted out-coreness and weighted in-coreness on weekdays.
Sustainability 11 06359 g003
Figure 4. The spatial distribution of the symmetrical nodes on weekdays. (a) Early morning; (b) morning; (c) afternoon; and (d) evening.
Sustainability 11 06359 g004
Figure 5. The number of the symmetrical nodes on weekdays.
Sustainability 11 06359 g005
Figure 6. The significant probability values on weekdays.
Sustainability 11 06359 g006
Figure 7. The entropy index of weighted out-coreness and weighted in-coreness on weekends.
Sustainability 11 06359 g007
Figure 8. The spatial distribution of the symmetrical nodes on weekends. (a) Early morning; (b) morning; (c) afternoon; and (d) evening.
Sustainability 11 06359 g008
Figure 9. The number of the symmetry index of nodes on weekends.
Sustainability 11 06359 g009
Figure 10. The significant probability values on weekends.
Sustainability 11 06359 g010
Table 1. Sample trip with pick-up and drop-off labels.
Taxi IDPick-Up TimePick-Up CoordinatesDrop-Off TimeDrop-Off Coordinates
1586 June 2016116.45806° E6 June 2016116.40218° E
6:27:2139.98764° N6:44:539.94539° N
205610 June 2016116.58275° E10 June 2016116.28463° E
0:2:4440.07931° N0:31:4740.02774° N
3002429 June 2016116.45534° E29 June 2016116.58095° E
6:40:239.94887° N7:11:2640.07179° N
Table 2. Business data from Dianping.com.
Place NameBusiness NameLatitudeLongitude
WudaokouYuye39.9910° N116.3353° E
WangjingBafu39.9964° N116.4815° E
SanlitunHema39.9314° N116.4535° E

