Evaluation of the Effect of an Exhaust Reduction System in Fire Stations


Abstract
:1. Introduction
2. Materials and Methods
2.1. The Sampling Site Description
2.2. Sampling Strategy
2.3. Sampling and Analysis
- Before the installation of the ERS to determine the effect of EURO 3 vehicles: which entailed idling all vehicles with the EURO 3 (the ERS was not installed at the bay for the EURO 3 vehicle).
- Before the installation of the ERS (without EURO 3 vehicle operating): this included idling all the vehicles (without the EURO 3 vehicle operating) without operation of the ERS to simulate the before installation status.
- After the installation of ERS: this involved idling all vehicles (except for EURO 3 vehicles) with the operation of the ERS to mimic the installation effect.
2.4. Online Measurement
2.5. Offline Measurement
2.6. Statistical Analysis
3. Results
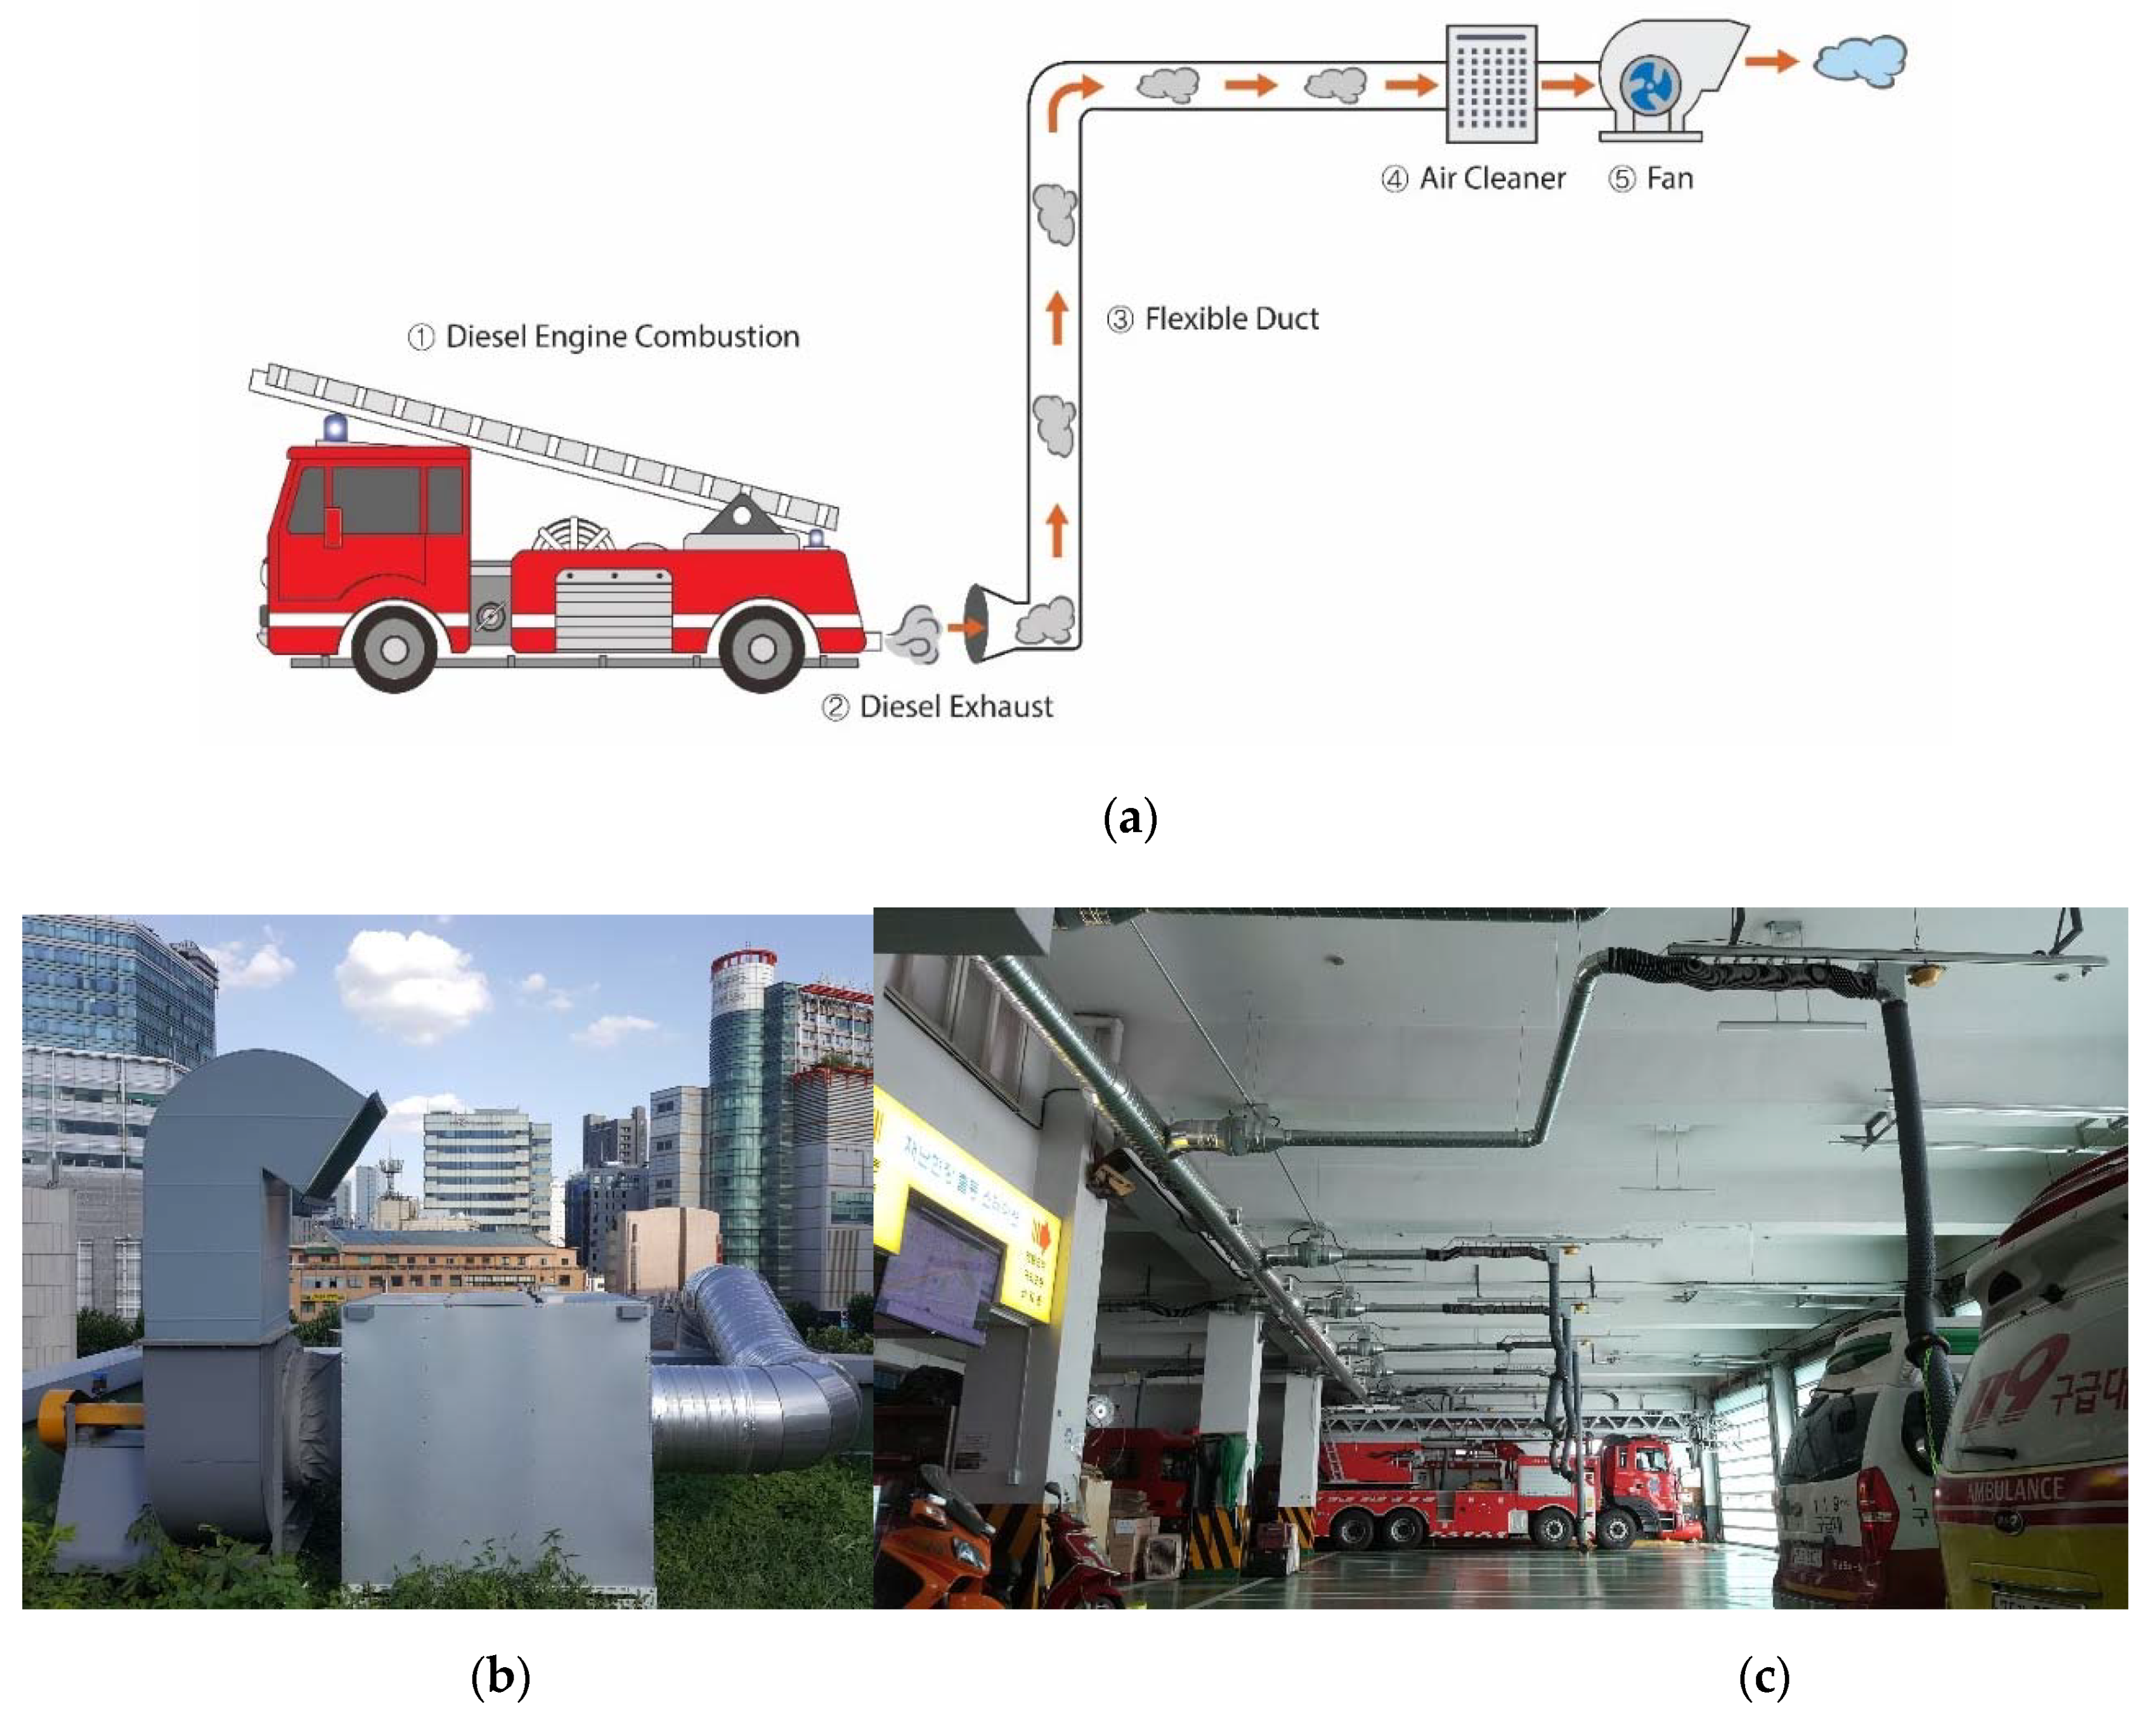
3.1. About ERS
3.2. Indoor Air Quality
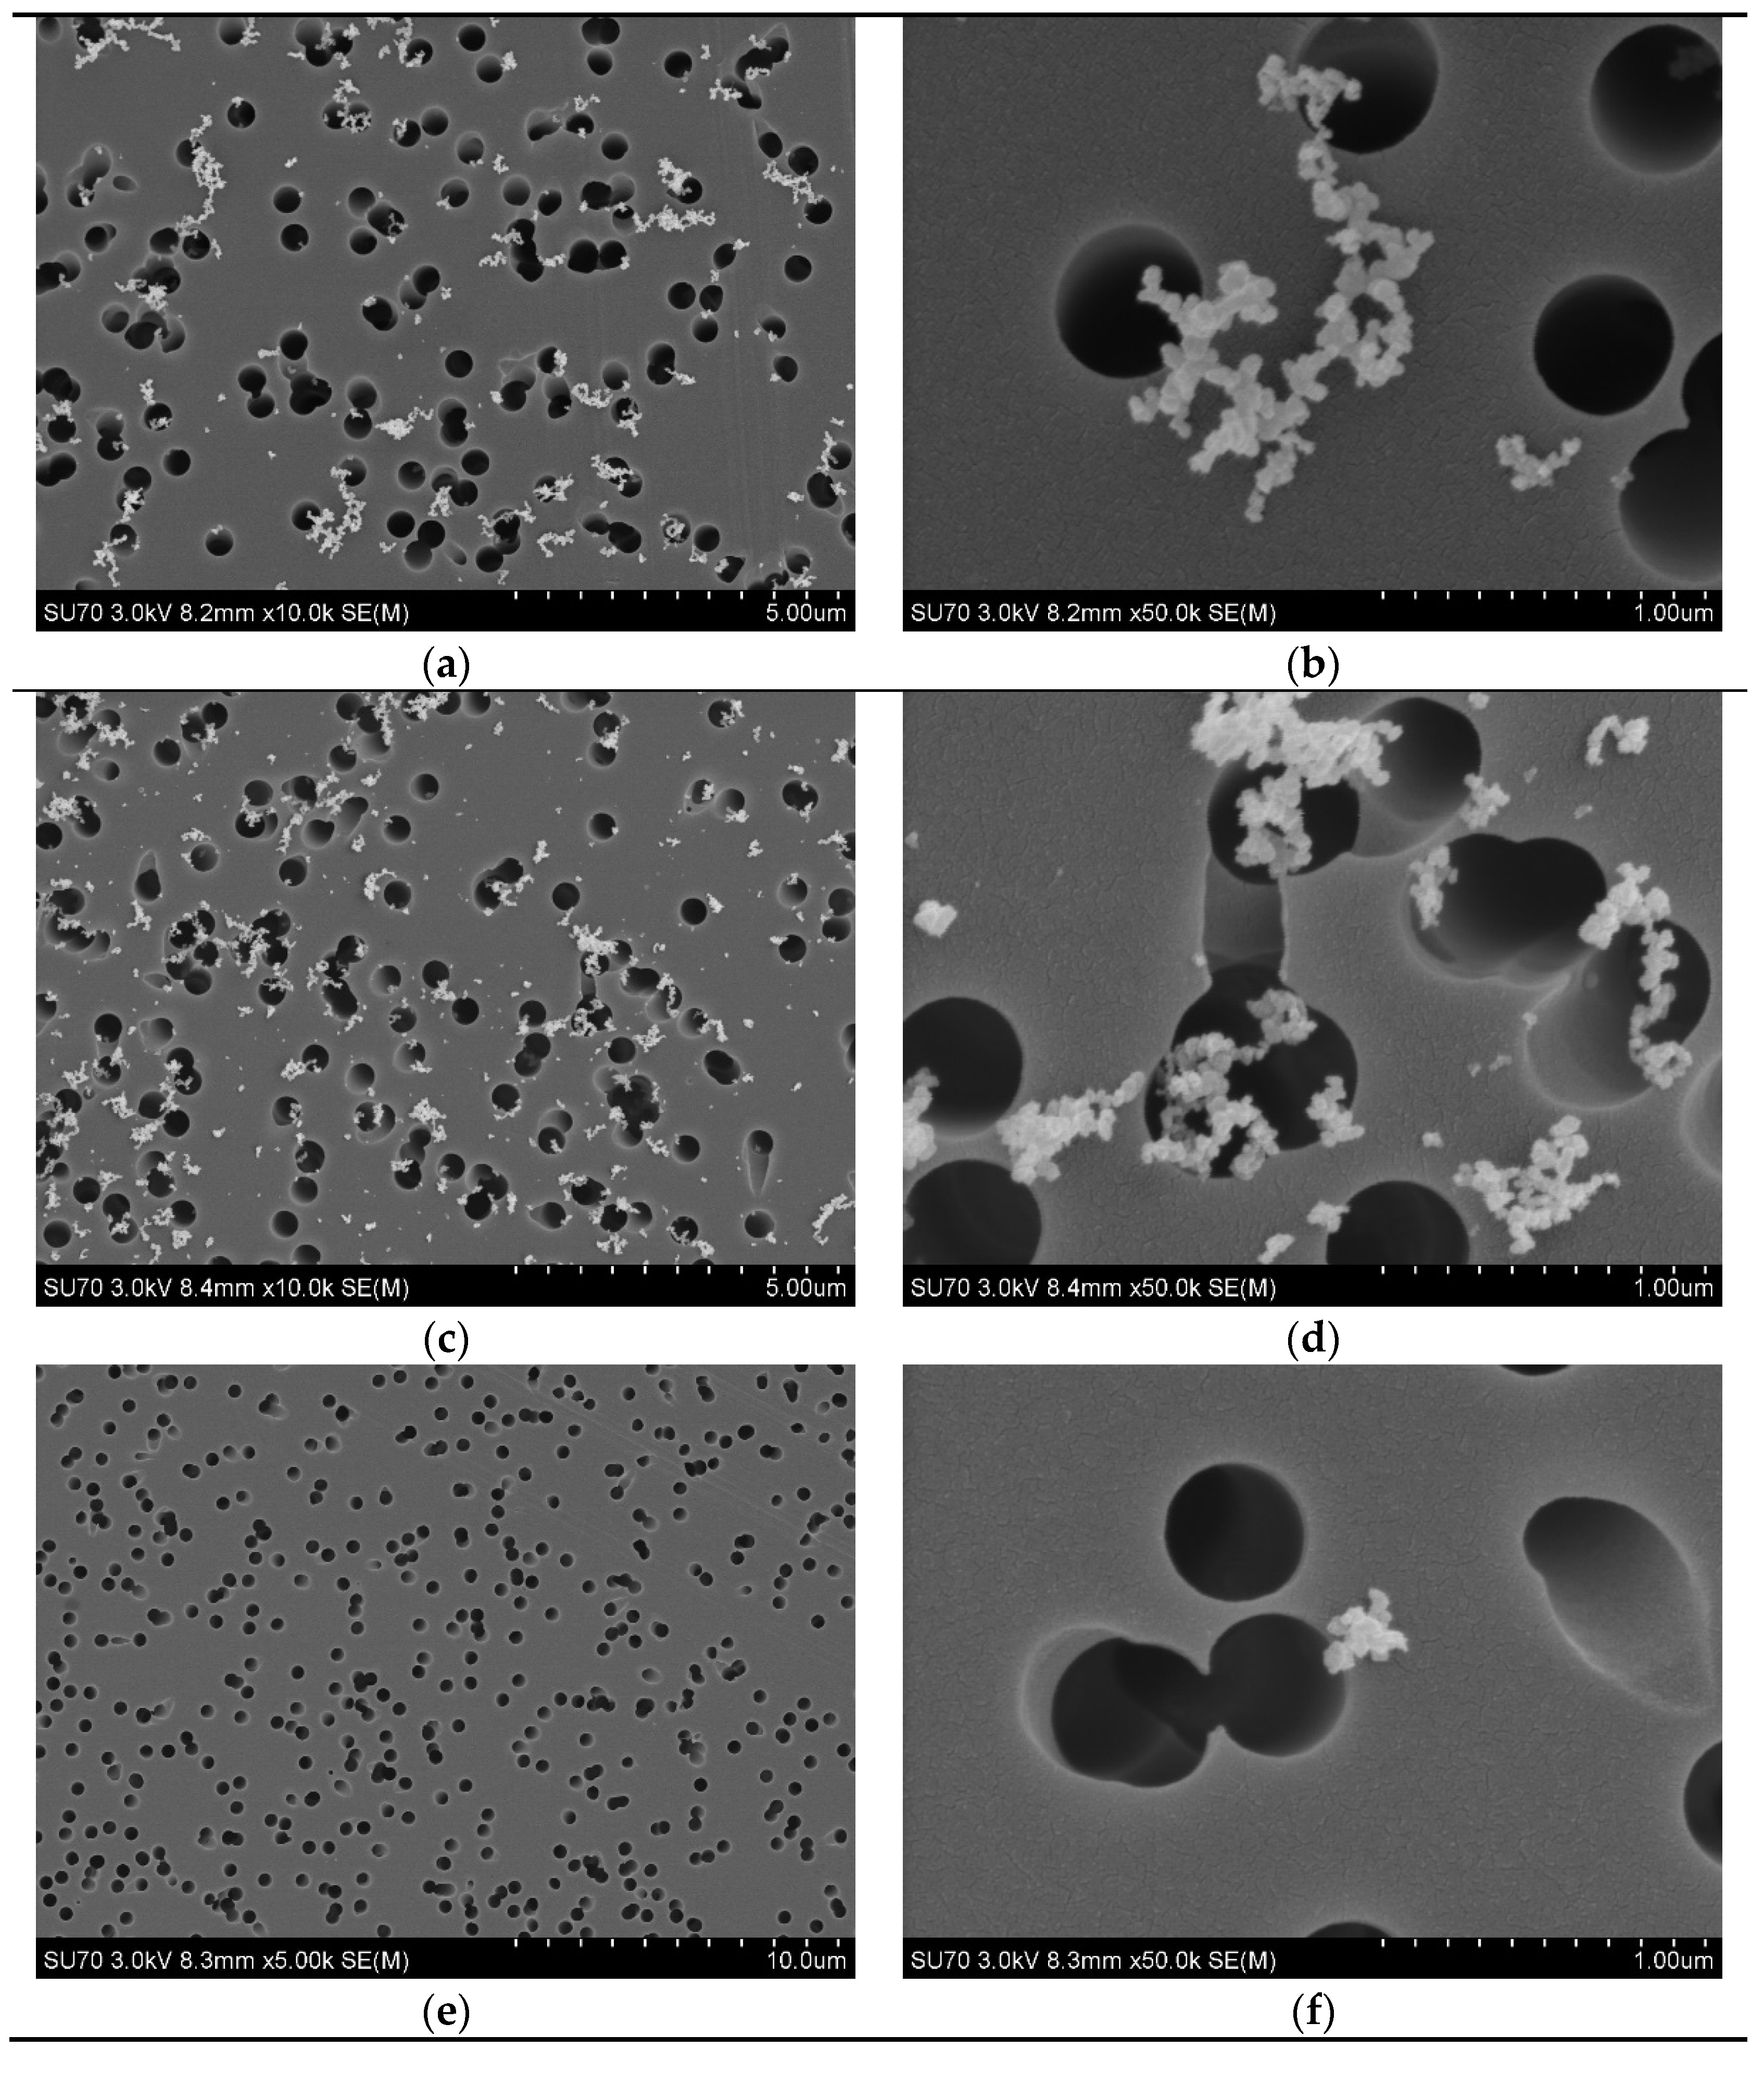
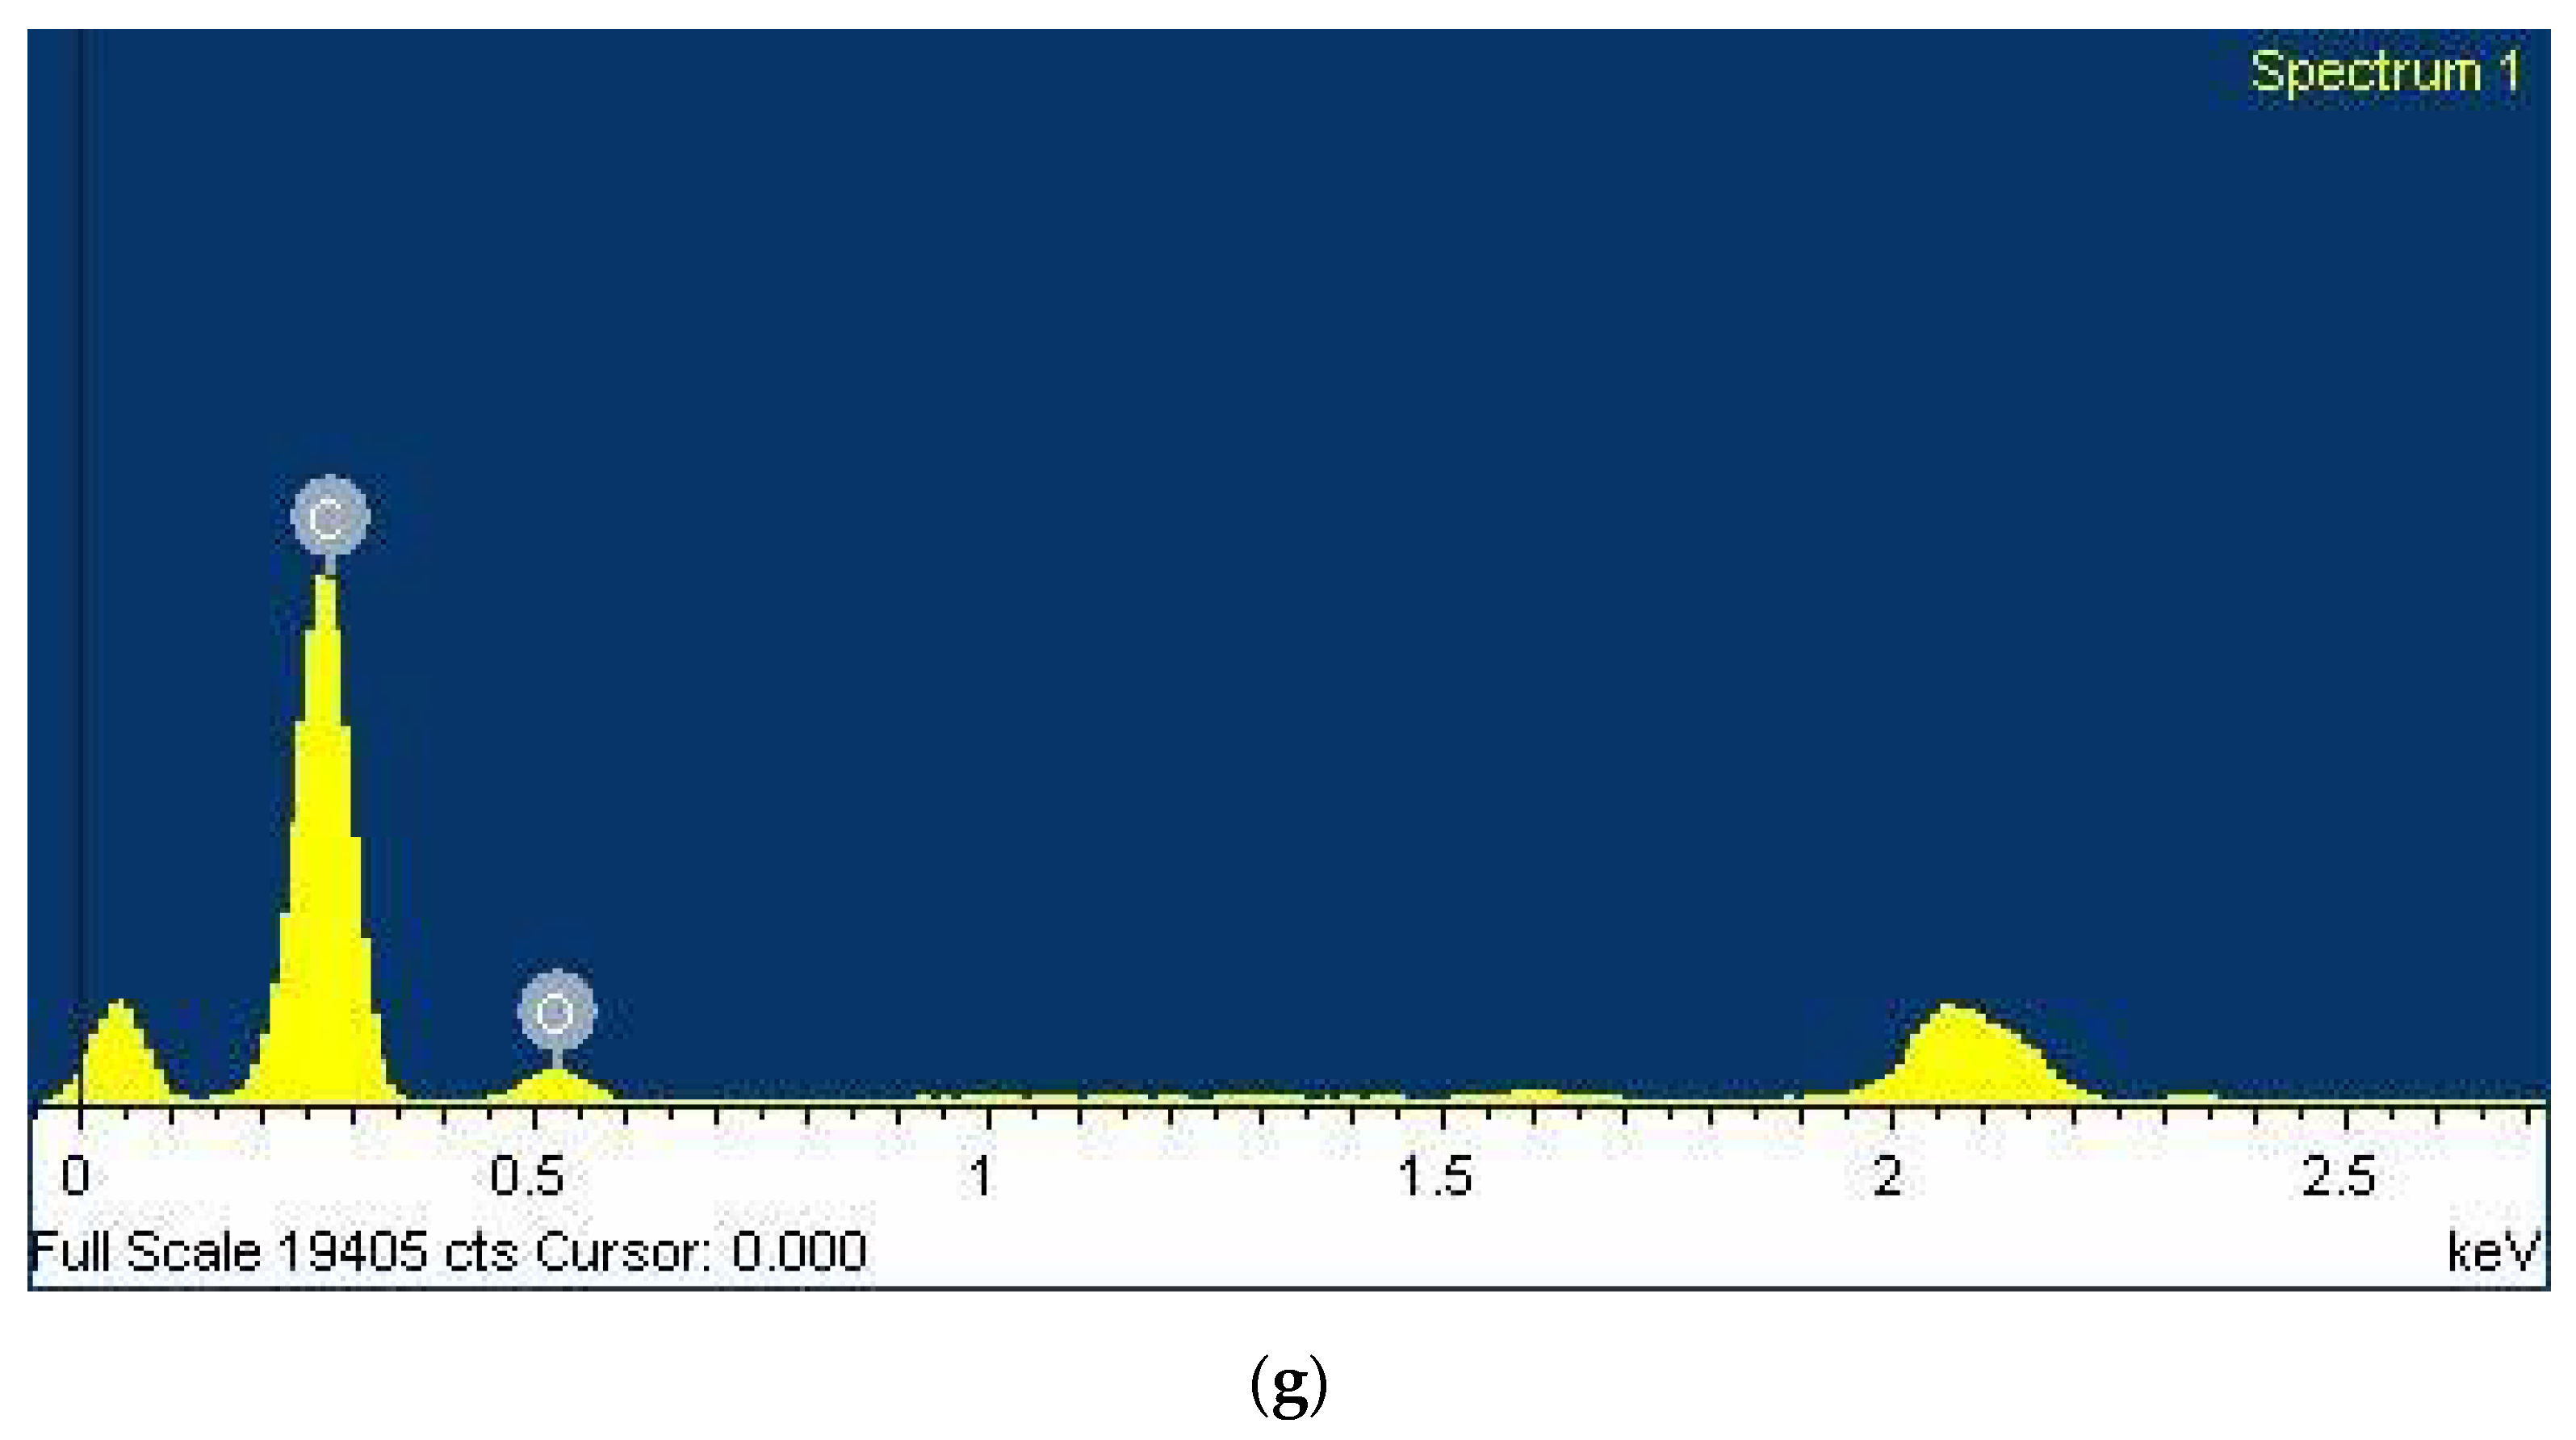
3.3. Electron Microscopy Image
3.4. Mitigation Effect Confirmed for EC
4. Discussion
4.1. Status of Indoor Air Quality in the Fire Station
4.2. Effect of the ERS
4.3. Exhaust to Outdoor Air
4.4. Strengths and Limitation
5. Conclusions
Supplementary Materials
Author Contributions
Funding
Acknowledgments
Conflicts of Interest
References
- Bott, R.C.; Kirk, K.M.; Logan, M.B.; Reid, D.A. Diesel particulate matter and polycyclic aromatic hydrocarbons in fire stations. Environ. Sci. Process. Impacts 2017, 19, 1320–1326. [Google Scholar] [CrossRef] [PubMed]
- Sparer, E.H.; Prendergast, D.P.; Apell, J.N.; Bartzak, M.R.; Wagner, G.R.; Adamkiewicz, G.; Hart, J.E.; Sorensen, G. Assessment of Ambient Exposures Firefighters Encounter While at the Fire Station. J. Occup. Environ. Med. 2017, 59, 1017–1023. [Google Scholar] [CrossRef] [PubMed]
- Taylor, N.A.; Dodd, M.J.; Taylor, E.A.; Donohoe, A.M. A retrospective evaluation of injuries to Australian urban firefighters (2003 to 2012). J. Occup. Environ. Med. 2015, 57, 757–764. [Google Scholar] [CrossRef] [PubMed]
- Soteriades, E.S.; Smith, D.L.; Tsismenakis, A.J.; Baur, D.M.; Kales, S.N. Cardiovascular disease in US firefighters: A systematic review. Cardiol. Rev. 2011, 19, 202–215. [Google Scholar] [CrossRef] [PubMed]
- IARC. Painting, Firefighting, and Shiftwork; International Agency for Research on Cancer: Lyon, France, 2010; Volume 98, p. 9. [Google Scholar]
- Tornling, G.R.; Gustavsson, P.; Hogstedt, C. Mortality and cancer incidence in Stockholm fire fighters. Am. J. Ind. Med. 1994, 25, 219–228. [Google Scholar] [CrossRef] [PubMed]
- Daniels, R.D.; Bertke, S.; Dahm, M.M.; Yiin, J.H.; Kubale, T.L.; Hales, T.R.; Baris, D.; Zahm, S.H.; Beaumont, J.J.; Waters, K.M. Exposure–response relationships for select cancer and non-cancer health outcomes in a cohort of US firefighters from San Francisco, Chicago and Philadelphia (1950–2009). Occup. Environ. Med. 2015, 72, 699–706. [Google Scholar] [CrossRef] [PubMed]
- Pukkala, E.; Martinsen, J.I.; Weiderpass, E.; Kjaerheim, K.; Lynge, E.; Tryggvadottir, L.; Sparén, P.; Demers, P.A. Cancer incidence among firefighters: 45 years of follow-up in five Nordic countries. Occup. Environ. Med. 2014, 71, 398–404. [Google Scholar] [CrossRef] [PubMed]
- Tsai, R.J.; Luckhaupt, S.E.; Schumacher, P.; Cress, R.D.; Deapen, D.M.; Calvert, G.M. Risk of cancer among firefighters in California, 1988–2007. Am. J. Ind. Med. 2015, 58, 715–729. [Google Scholar] [CrossRef] [PubMed]
- Fent, K.W.; Eisenberg, J.; Snawder, J.; Sammons, D.; Pleil, J.D.; Stiegel, M.A.; Mueller, C.; Horn, G.P.; Dalton, J. Systemic exposure to PAHs and benzene in firefighters suppressing controlled structure fires. Ann. Occup. Hyg. 2014, 58, 830–845. [Google Scholar] [PubMed]
- Fent, K.W.; Evans, D.E.; Booher, D.; Pleil, J.D.; Stiegel, M.A.; Horn, G.P.; Dalton, J. Volatile organic compounds off-gassing from firefighters’ personal protective equipment ensembles after use. J. Occup. Environ. Hyg. 2015, 12, 404–414. [Google Scholar] [CrossRef] [PubMed]
- Kales, S.N.; Soteriades, E.S.; Christophi, C.A.; Christiani, D.C. Emergency duties and deaths from heart disease among firefighters in the United States. N. Engl. J. Med. 2007, 356, 1207–1215. [Google Scholar] [CrossRef] [PubMed]
- Froines, J.R.; Hinds, W.C.; Duffy, R.M.; Lafuente, E.J.; Liu, W.-C.V. Exposure of Firefighters to Diesel Emissions in Fire Stations. Am. Ind. Hyg. Assoc. J. 1987, 48, 202–207. [Google Scholar] [CrossRef] [PubMed]
- Bolstad-Johnson, D.M.; Burgess, J.L.; Crutchfield, C.D.; Storment, S.; Gerkin, R.; Wilson, J.R. Characterization of firefighter exposures during fire overhaul. AIHAJ Am. Ind. Hyg. Assoc. 2000, 61, 636–641. [Google Scholar] [CrossRef]
- Samet, J.M.; Marbury, M.C.; Spengler, J.D. Health effects and sources of indoor air pollution. Part I. Am. Rev. Respir. Dis. 1987, 136, 1486–1508. [Google Scholar] [CrossRef] [PubMed]
- Roelofs, C.R.; Barbeau, E.M.; Ellenbecker, M.J.; Moure-Eraso, R. Prevention strategies in industrial hygiene: A critical literature review. AIHA J. 2003, 64, 62–67. [Google Scholar] [CrossRef] [PubMed]
- Nesbeit, M.; Fergusson, M.; Colsa, A.; Ohlendorf, J.; Hayes, C.; Paquel, K.; Schweitzer, J.-P. Comparative Study on the Differences between the EU and US Legislation on Emissions in the Automotive Sector: Study; European Parliament: Brussels, Belgium, 2016. [Google Scholar]
- MOE. Indoor Air Quality Control in Public Use Facilities; Ministry of Environment, Korea Legislation Research Institute: Seoul, Korea, 2003.
- Birch, M. NIOSH Manual of Analytical Methods (NMAM 5040); National Institute for Occupational Safety and Health (NIOSH): Washington, DC, USA, 2003.
- Xu, B.; Wu, Y.; Gong, Y.; Wu, S.; Wu, X.; Zhu, S.; Liu, T. Investigation of volatile organic compounds exposure inside vehicle cabins in China. Atmos. Pollut. Res. 2016, 7, 215–220. [Google Scholar] [CrossRef]
- Kim, K.-H.; Kim, Y.-H.; Kim, B.-W.; Ahn, J.-H.; Bae, M.-S.; Brown, R.J. The reproducibility of indoor air pollution (IAP) measurement: A test case for the measurement of key air pollutants from the pan frying of fish samples. Sci. World J. 2014, 2014, 236501. [Google Scholar] [CrossRef] [PubMed]
- Hori, H.; Ishimatsu, S.; Fueta, Y.; Ishidao, T. Evaluation of a real-time method for monitoring volatile organic compounds in indoor air in a Japanese university. Environ. Health Prev. Med. 2013, 18, 285–292. [Google Scholar] [CrossRef] [PubMed]
- Cao, J.J.; Huang, H.; Lee, S.C.; Chow, J.C.; Zou, C.W.; Ho, K.F.; Watson, J.G. Indoor/Outdoor Relationships for Organic and Elemental Carbon in PM2.5 at Residential Homes in Guangzhou, China. Aerosol Air Qual. Res. 2012, 12, 902–910. [Google Scholar] [CrossRef]
- Ham, S.; Yoon, C.; Kim, S.; Park, J.; Kwon, O.; Heo, J.; Park, D.; Choi, S.; Kim, S.; Ha, K. Arsenic exposure during preventive maintenance of an ion implanter in a semiconductor manufacturing factory. Aerosol Air Qual. Res. 2017, 17, 990–999. [Google Scholar] [CrossRef]
- Kim, Y.; Yoon, C.; Ham, S.; Park, J.; Kim, S.; Kwon, O.; Tsai, P.-J. Emissions of nanoparticles and gaseous material from 3D printer operation. Environ. Sci. Technol. 2015, 49, 12044–12053. [Google Scholar] [CrossRef] [PubMed]
- Ham, S.; Yoon, C.; Lee, E.; Lee, K.; Park, D.; Chung, E.; Kim, P.; Lee, B. Task-based exposure assessment of nanoparticles in the workplace. J. Nanopart. Res. 2012, 14, 1126. [Google Scholar] [CrossRef]
- Tang, X.; Bai, Y.; Duong, A.; Smith, M.T.; Li, L.; Zhang, L. Formaldehyde in China: Production, consumption, exposure levels, and health effects. Environ. Int. 2009, 35, 1210–1224. [Google Scholar] [CrossRef] [PubMed]
- Roy, M.M. HPLC analysis of aldehydes in automobile exhaust gas: Comparison of exhaust odor and irritation in different types of gasoline and diesel engines. Energy Convers. Manag. 2008, 49, 1111–1118. [Google Scholar] [CrossRef]
- Reisen, F.; Brown, S.K. Australian firefighters’ exposure to air toxics during bushfire burns of autumn 2005 and 2006. Environ. Int. 2009, 35, 342–352. [Google Scholar] [CrossRef] [PubMed]
- Birch, M.; Cary, R. Elemental carbon-based method for monitoring occupational exposures to particulate diesel exhaust. Aerosol Sci. Technol. 1996, 25, 221–241. [Google Scholar] [CrossRef]
- Groves, J.; Cain, J.R. A survey of exposure to diesel engine exhaust emissions in the workplace. Ann. Occup. Hyg. 2000, 44, 435–447. [Google Scholar] [CrossRef]
- Schauer, J.J. Evaluation of elemental carbon as a marker for diesel particulate matter. J. Expo. Sci. Environ. Epidemiol. 2003, 13, 443–453. [Google Scholar] [CrossRef] [PubMed]
- Sydbom, A.; Blomberg, A.; Parnia, S.; Stenfors, N.; Sandström, T.; Dahlen, S.E. Health effects of diesel exhaust emissions. Eur. Respir. J. 2001, 17, 733–746. [Google Scholar] [CrossRef] [PubMed]
- Talibov, M.; Sormunen, J.; Weiderpass, E.; Kjaerheim, K.; Martinsen, J.-I.; Sparen, P.; Tryggvadottir, L.; Hansen, J.; Pukkala, E.J.S.; Work, H.A. Workplace Diesel Exhausts and Gasoline Exposure and Risk of Colorectal Cancer in Four Nordic Countries. Saf. Health Work 2019, 10, 141–150. [Google Scholar] [CrossRef] [PubMed]
- Wilson, S.J.; Miller, M.R.; Newby, D.E. Effects of diesel exhaust on cardiovascular function and oxidative stress. Antioxid. Redox Signal. 2018, 28, 819–836. [Google Scholar] [CrossRef] [PubMed]
- ACGIH. Chemical Substances and Other Issues Under Study; American Conference of Governmental Industrial Hygienists: Cincinnati, OH, USA, 2019. [Google Scholar]
- Lewné, M.; Plato, N.; Gustavsson, P. Exposure to particles, elemental carbon and nitrogen dioxide in workers exposed to motor exhaust. Ann. Occup. Hyg. 2007, 51, 693–701. [Google Scholar] [PubMed]
- Zaebst, D.; Clapp, D.; Blade, L.; Marlow, D.; Steenland, K.; Hornung, R.; Scheutzle, D.; Butler, J. Quantitative determination of trucking industry workers’ exposures to diesel exhaust particles. Am. Ind. Hyg. Assoc. J. 1991, 52, 529–541. [Google Scholar] [CrossRef] [PubMed]
- Kim, S.; Ham, S.; Jeon, J.; Kim, W. Characterization of Secondary Exposure to Chemicals and Indoor Air Quality in Fire Station. Fire Sci. Eng. 2019, 33, 140–151. [Google Scholar] [CrossRef]
- Ellenbecker, M.J. Engineering controls for clean air in the office environment. Clin. Chest Med. 1992, 13, 193–199. [Google Scholar] [PubMed]
- Fernández, R.; Roger, F. Environmental control of indoor air pollution. Med. Clin. N. Am. 1992, 76, 935–952. [Google Scholar] [CrossRef]
- Park, J.; Lee, L.; Byun, H.; Ham, S.; Lee, I.; Park, J.; Rhie, K.; Lee, Y.; Yeom, J.; Tsai, P. A study of the volatile organic compound emissions at the stacks of laboratory fume hoods in a university campus. J. Clean. Prod. 2014, 66, 10–18. [Google Scholar] [CrossRef]
- Chang, D.-Q.; Liu, J.-X.; Chen, S.-C. Factors Affecting Particle Depositions on Electret Filters Used in Residential HVAC Systems and Indoor Air Cleaners. Aerosol Air Qual. Res. 2018, 18, 3211–3219. [Google Scholar] [CrossRef]
- Mendoza, D.L.; Buchert, M.P.; Lin, J.C. Modeling net effects of transit operations on vehicle miles traveled, fuel consumption, carbon dioxide, and criteria air pollutant emissions in a mid-size US metro area: Findings from Salt Lake City, UT. Environ. Res. Commun. 2019, 1, 091002. [Google Scholar] [CrossRef]


| Category | Station A | Station B |
|---|---|---|
| Construction (year) | 1996 | 2007 |
| Renovation (year) | 2004 | - |
| Area (m3) (W × L) | 704 (32 × 22) | 189 (18 × 10.5) |
| Volume (m3) (H) | 4224 (6) | 1039.5 (5.5) |
| Number of Vehicles (Motorbike) | 14 (2) | 4 (1) |
| Diesel Engine Level (No. of Vehicles) | EURO3 (1), EURO4 (2) EURO5 (7), EURO6 (4) | EURO3 (1), EURO4 (1) EURO5 (-), EURO6 (2) |
| Installation rate of Exhaust Reduction System (%) (Installed/Total No. of Vehicles) | 71.4% (10/14) | 75.0% (3/4) |
| Pollutant | Location | Fire Station A | Fire Station B | Unit | Indoor Air Quality Standard (MOE 2) | ||||||
|---|---|---|---|---|---|---|---|---|---|---|---|
| N | Before | N | After | N | Before | N | After | ||||
| PM10 | Inside of fire station, center of vehicle bay | 62 1 | 92.2 (43.2) | 63 | 67.2 (17.9) | 61 | 168.0 (30.9) | 62 | 56.6 (8.8) | µg/m3 | 100 µg/m3 (6-h average) |
| PM2.5 | 62 1 | 52.1 (34.1) | 63 | 25.2 (3.2) | 61 | 137.4 (25.4) | 62 | 37.2 (6.0) | µg/m3 | 50 µg/m3 (6-h average) | |
| CO2 | 9 4 | 1405.7 (575.9) 5 | 13 | 448.6 (33.2) | 12 | 522.5 (95.8) | 13 | 435.1 (21.6) | ppm | 1000 ppm | |
| CO | 9 4 | 7.3 (2.9) | 13 | 0.2 (0.2) | 12 | 0.8 (0.5) | 13 | 0.2 (0.1) | ppm | 10 ppm | |
| TVOC | 2 | 1443.5 5 | 2 | 297.2 | 2 | 928.8 5 | 2 | 894.6 5 | µg/m3 | 500 µg/m3 | |
| HCHO | 2 | 197.5 | 2 | 8.6 | 2 | 34.0 | 2 | 6.5 | µg/m3 | 100 µg/m3 150 µg/m3 (MOEL 3) | |
| Category | Fire Station A | Fire Station B | ||||||
|---|---|---|---|---|---|---|---|---|
| Location (unit: µg/m3) | N | Sampling Time (min.) | Conc. and Mean (SD) | I/O Ratio | N | Sampling Time (min.) | Conc. and Mean (SD) | I/O Ratio 3 |
| Scenario 1: Vehicle bay (before) incl. EURO 3 | 32.73 | 44.56 | ||||||
| 3 | 119 | 32.04 | 10.11 | 3 | 211 | 39.92 | 39.7 | |
| 30.79 | 40.60 | |||||||
| 31.85 (0.80) | 41.69 (2.05) | |||||||
| Scenario 2: Vehicle bay (before) without the EURO 3 vehicle operating | 8.87 | 6.64 | ||||||
| 3 | 120 | 9.12 | 2.84 | 3 | 133 | 7.35 | 7.49 | |
| 8.88 | 9.61 | |||||||
| 8.96 (0.12) | 7.87 (1.26) | |||||||
| Scenario 3: Vehicle bay (after) | 2.91 | 0.0004 | ||||||
| 3 | 123 | 2.90 | 0.92 | 3 | 85 | 0.0010 | <1.00 | |
| 2.95 | <LOD 1 | |||||||
| 2.92 (0.02) | 0.0006 2 | |||||||
| Office 1F | 2.06 | 3.09 | ||||||
| 3 | 403 | 2.22 | 0.69 | 3 | 424 | 2.76 | 2.74 | |
| 2.25 | 2.79 | |||||||
| 2.18 (0.08) | 2.88 (0.15) | |||||||
| (Fire station A) Shower room 2F | 1 | 416 | 3.13 | 0.99 | - 4 | - | - | - |
| (Fire station B) Waiting room 1F | - 4 | - | - | - | 1 | 430 | 2.58 | 2.45 |
| Outdoor | 3.10 | 1.10 | ||||||
| 3 | 419 | 3.17 | 3 | 430 | 1.07 | |||
| 3.17 | 0.98 | |||||||
| 3.15 (0.03) | 1.05 (0.05) | |||||||
© 2019 by the authors. Licensee MDPI, Basel, Switzerland. This article is an open access article distributed under the terms and conditions of the Creative Commons Attribution (CC BY) license (http://creativecommons.org/licenses/by/4.0/).
Share and Cite
Kim, S.J.; Kang, J.; Kang, S.-K.; Ham, S. Evaluation of the Effect of an Exhaust Reduction System in Fire Stations. Sustainability 2019, 11, 6358. https://doi.org/10.3390/su11226358
Kim SJ, Kang J, Kang S-K, Ham S. Evaluation of the Effect of an Exhaust Reduction System in Fire Stations. Sustainability. 2019; 11(22):6358. https://doi.org/10.3390/su11226358
Chicago/Turabian StyleKim, Soo Jin, Jihyun Kang, Seong-Kyu Kang, and Seunghon Ham. 2019. "Evaluation of the Effect of an Exhaust Reduction System in Fire Stations" Sustainability 11, no. 22: 6358. https://doi.org/10.3390/su11226358
APA StyleKim, S. J., Kang, J., Kang, S.-K., & Ham, S. (2019). Evaluation of the Effect of an Exhaust Reduction System in Fire Stations. Sustainability, 11(22), 6358. https://doi.org/10.3390/su11226358