Inter-Metropolitan Land-Price Characteristics and Patterns in the Beijing-Tianjin-Hebei Urban Agglomeration in China


Abstract
1. Introduction
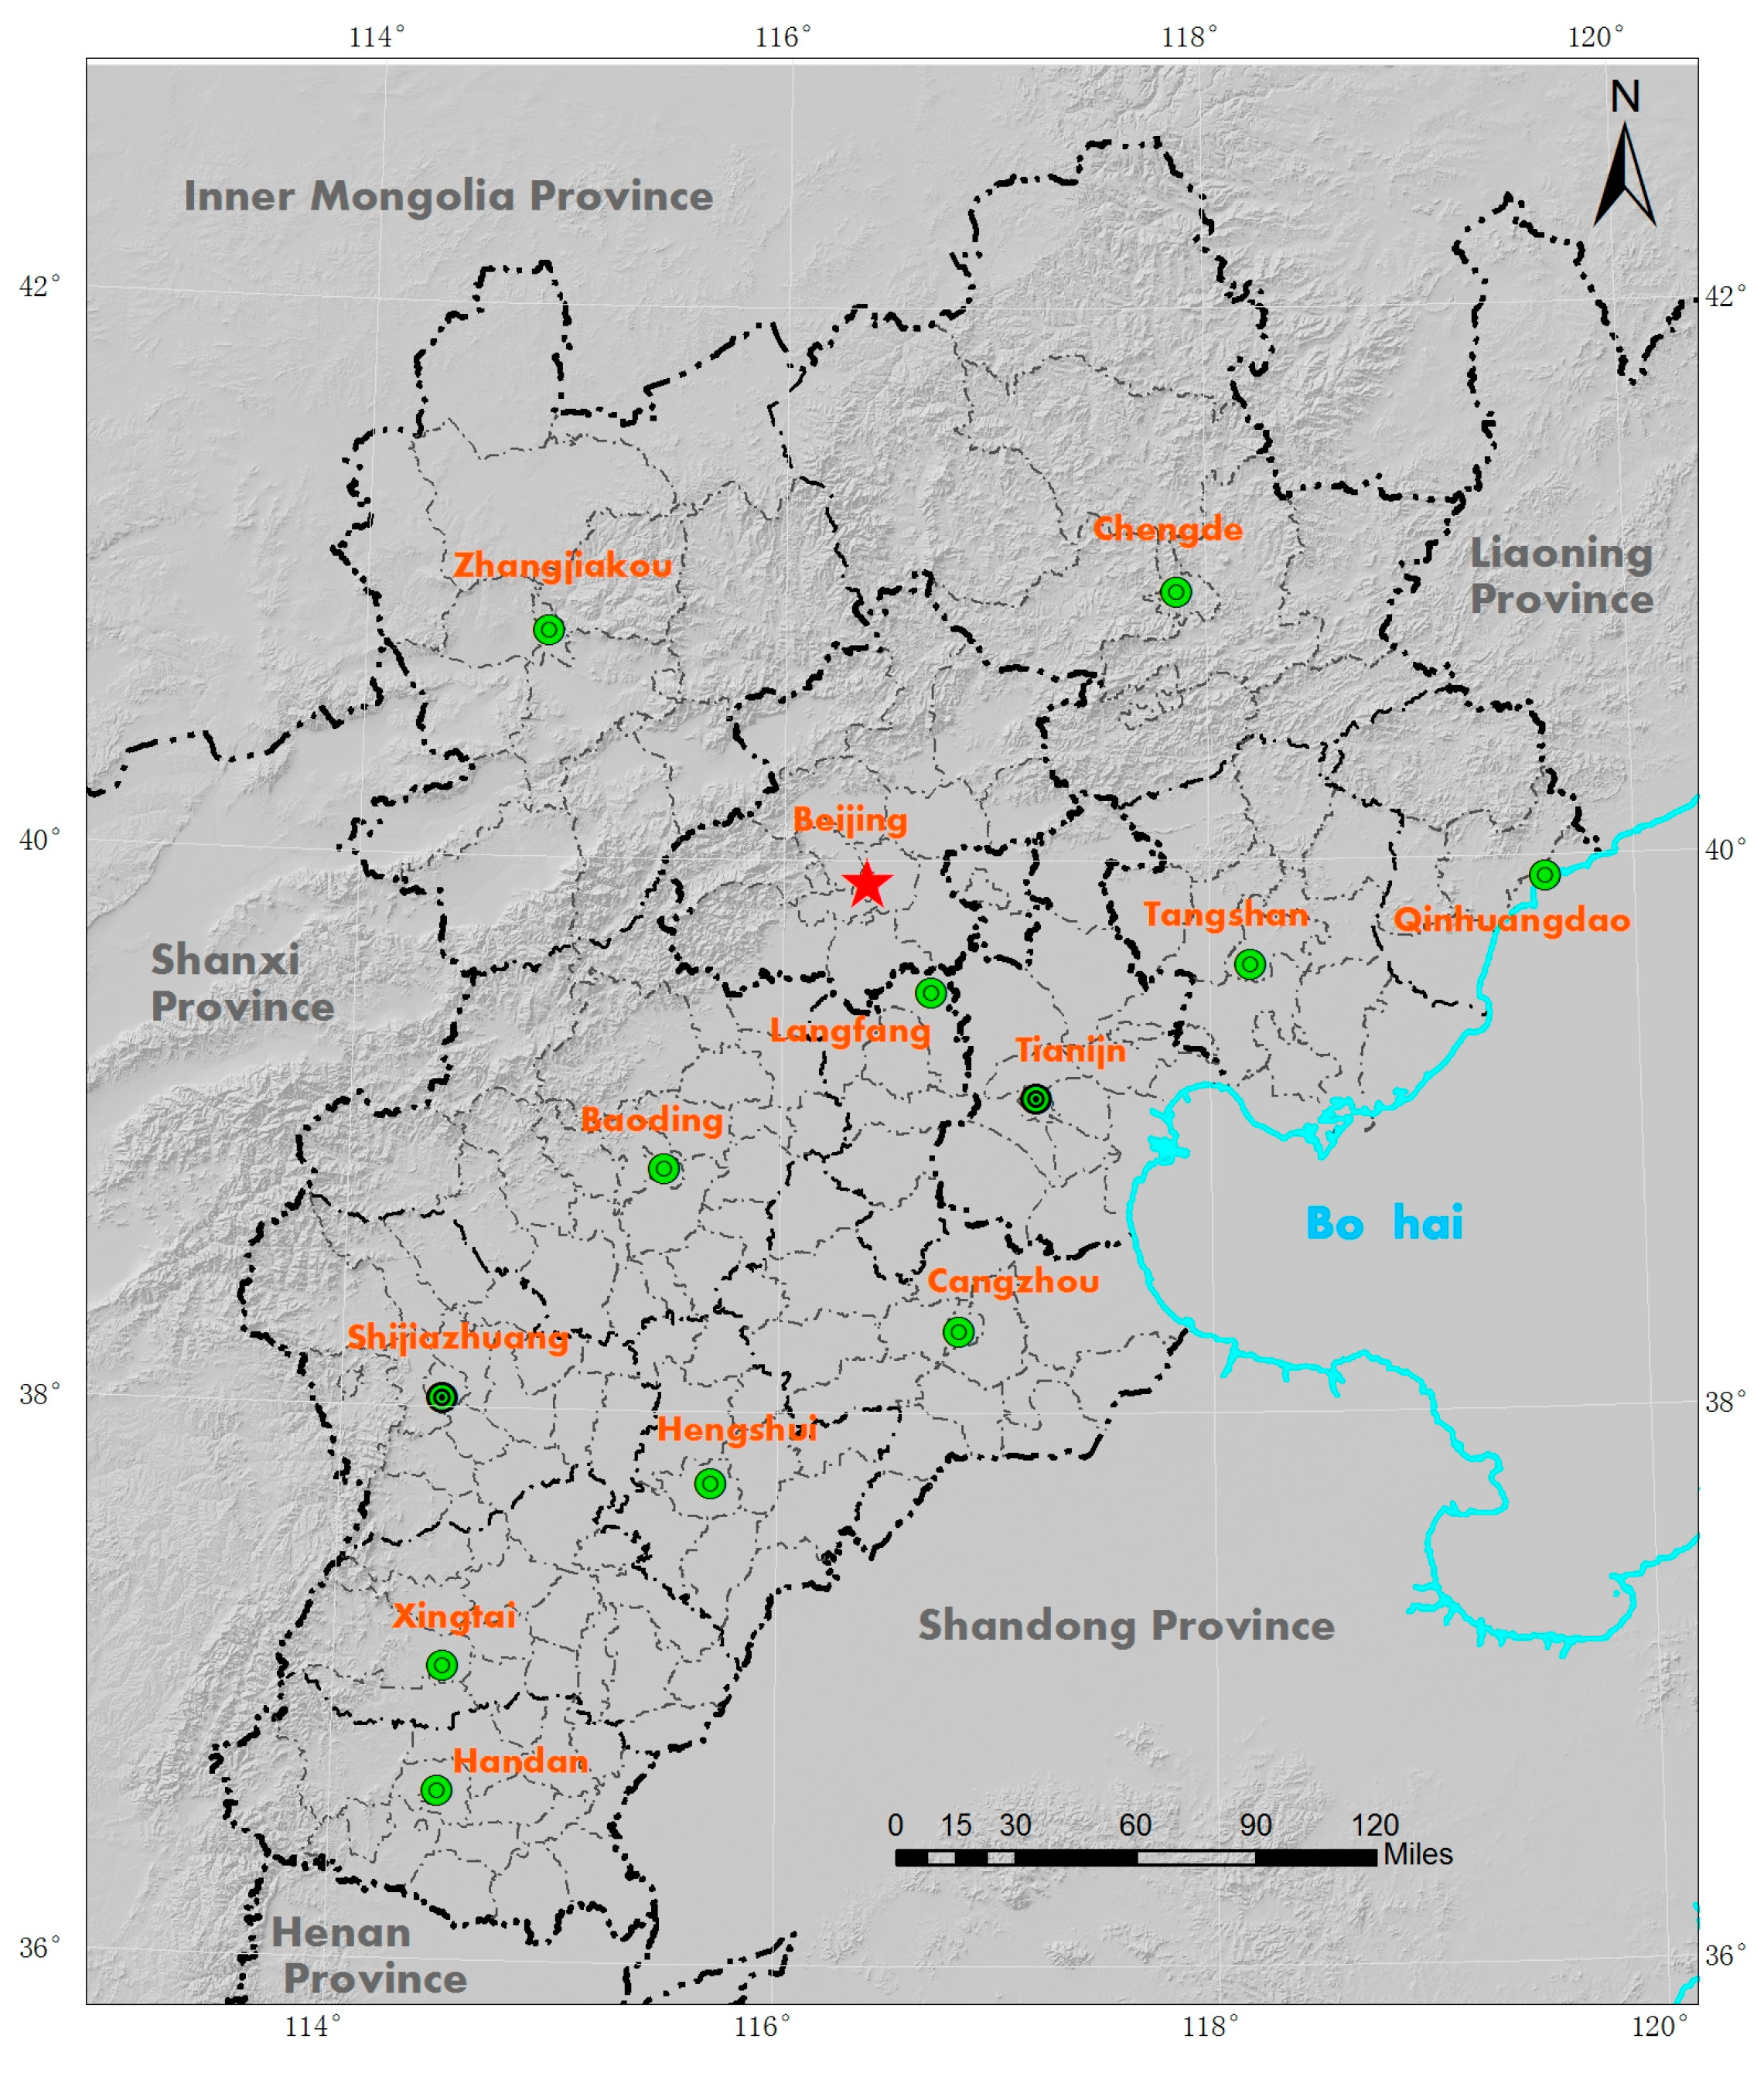
2. Research Area
3. Materials and Methods
3.1. Data and Pre-Processing
3.1.1. Social and Economic Data
3.1.2. Traffic Data
3.2. Methods
3.2.1. Gravity Model of Urban Land Prices
- ①
- Calculate the mean value of the indicators:
- ②
- Calculate the standard deviation of the indicators:
- ③
- Determine the coefficient of variation:
- ④
- Calculate the index weight:where Aj is the average value of index j, n is the number of cities in the study area, m is the number of indexes in the evaluation system, Yij is the standardized value of index j of city i, σj is the standard deviation, Vj is the coefficient of variation, and Wj is the weight of index j.
- ①
- The accessibility value of traffic mode P in city i:Rip = Dip/Sip
- ②
- The average value of Rip:
- ③
- The accessibility coefficient of traffic mode p in city i:
- ④
- The accessibility coefficient of city i:where Dip is the traffic distance of traffic mode P between city i and other cities and Sip is the average speed of transportation mode P from city i to other cities.
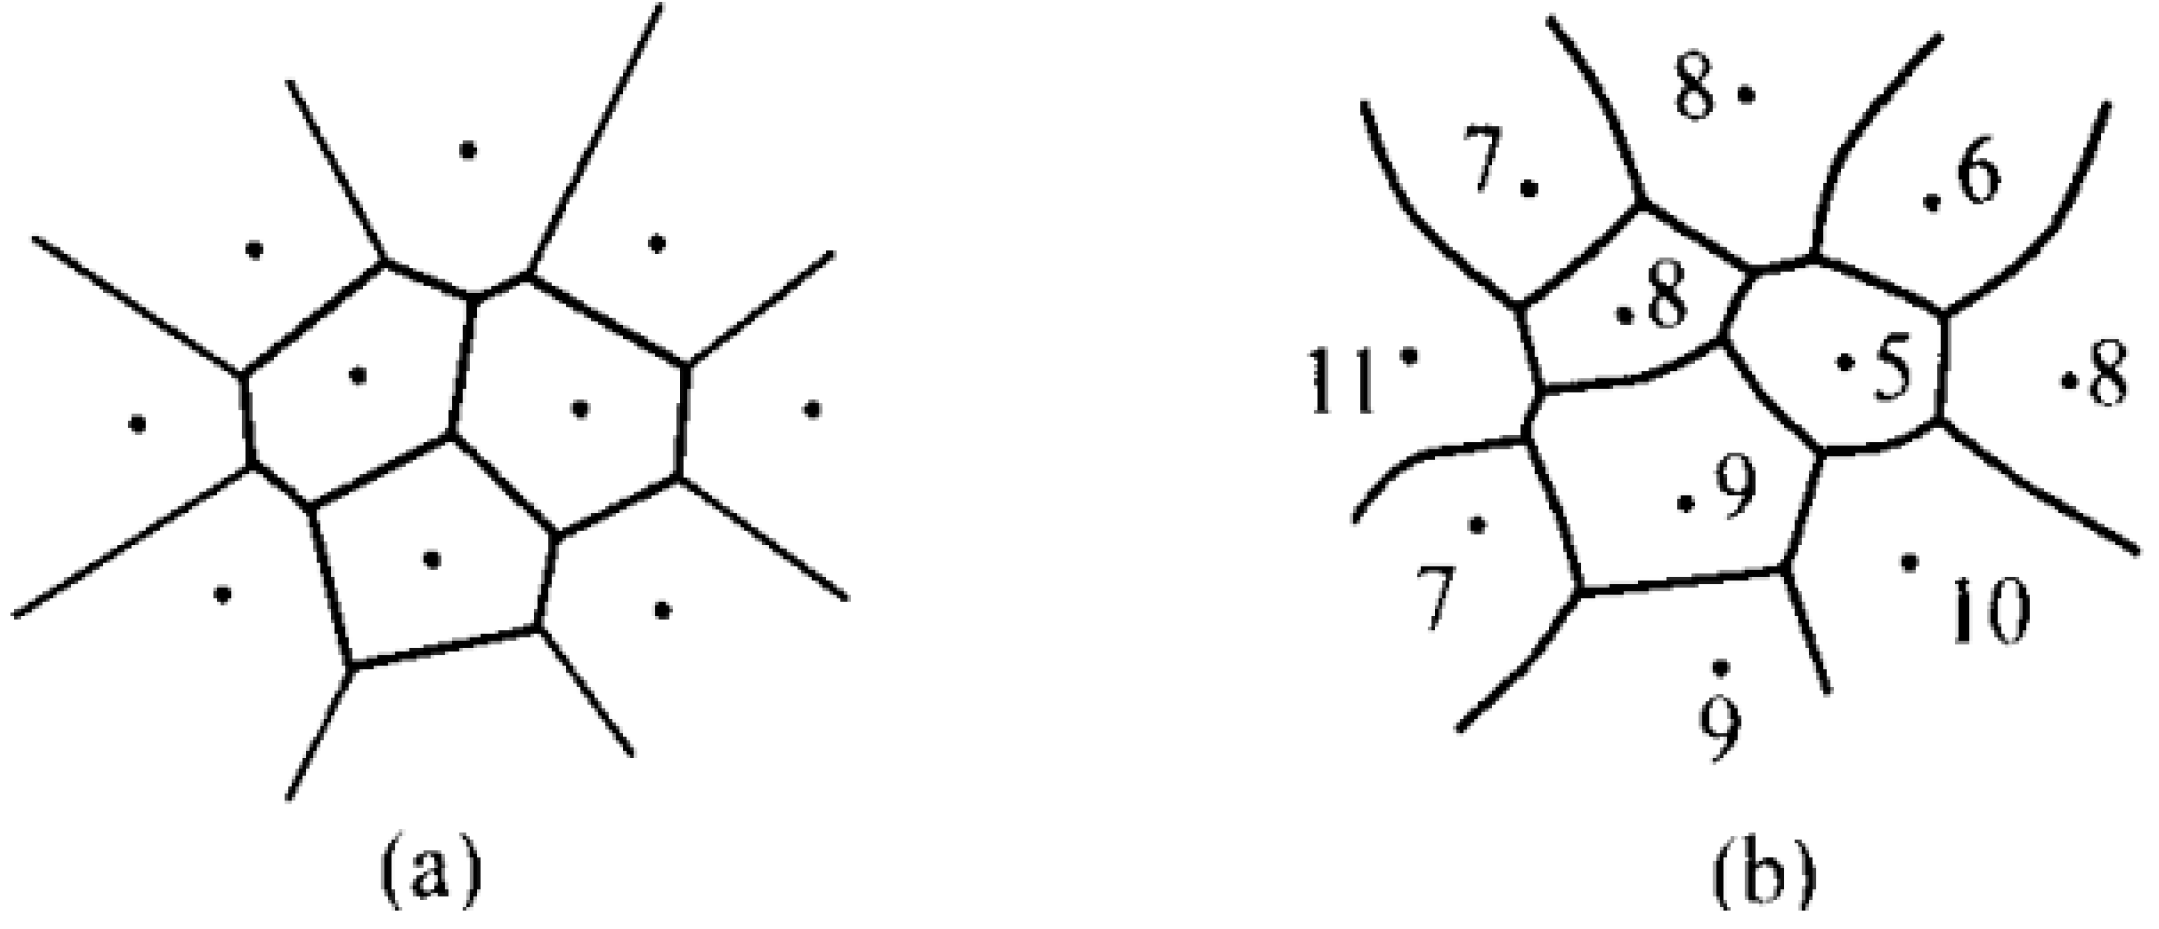
3.2.2. Voronoi Diagram Model Based on Fracture-Point Theory
4. Results
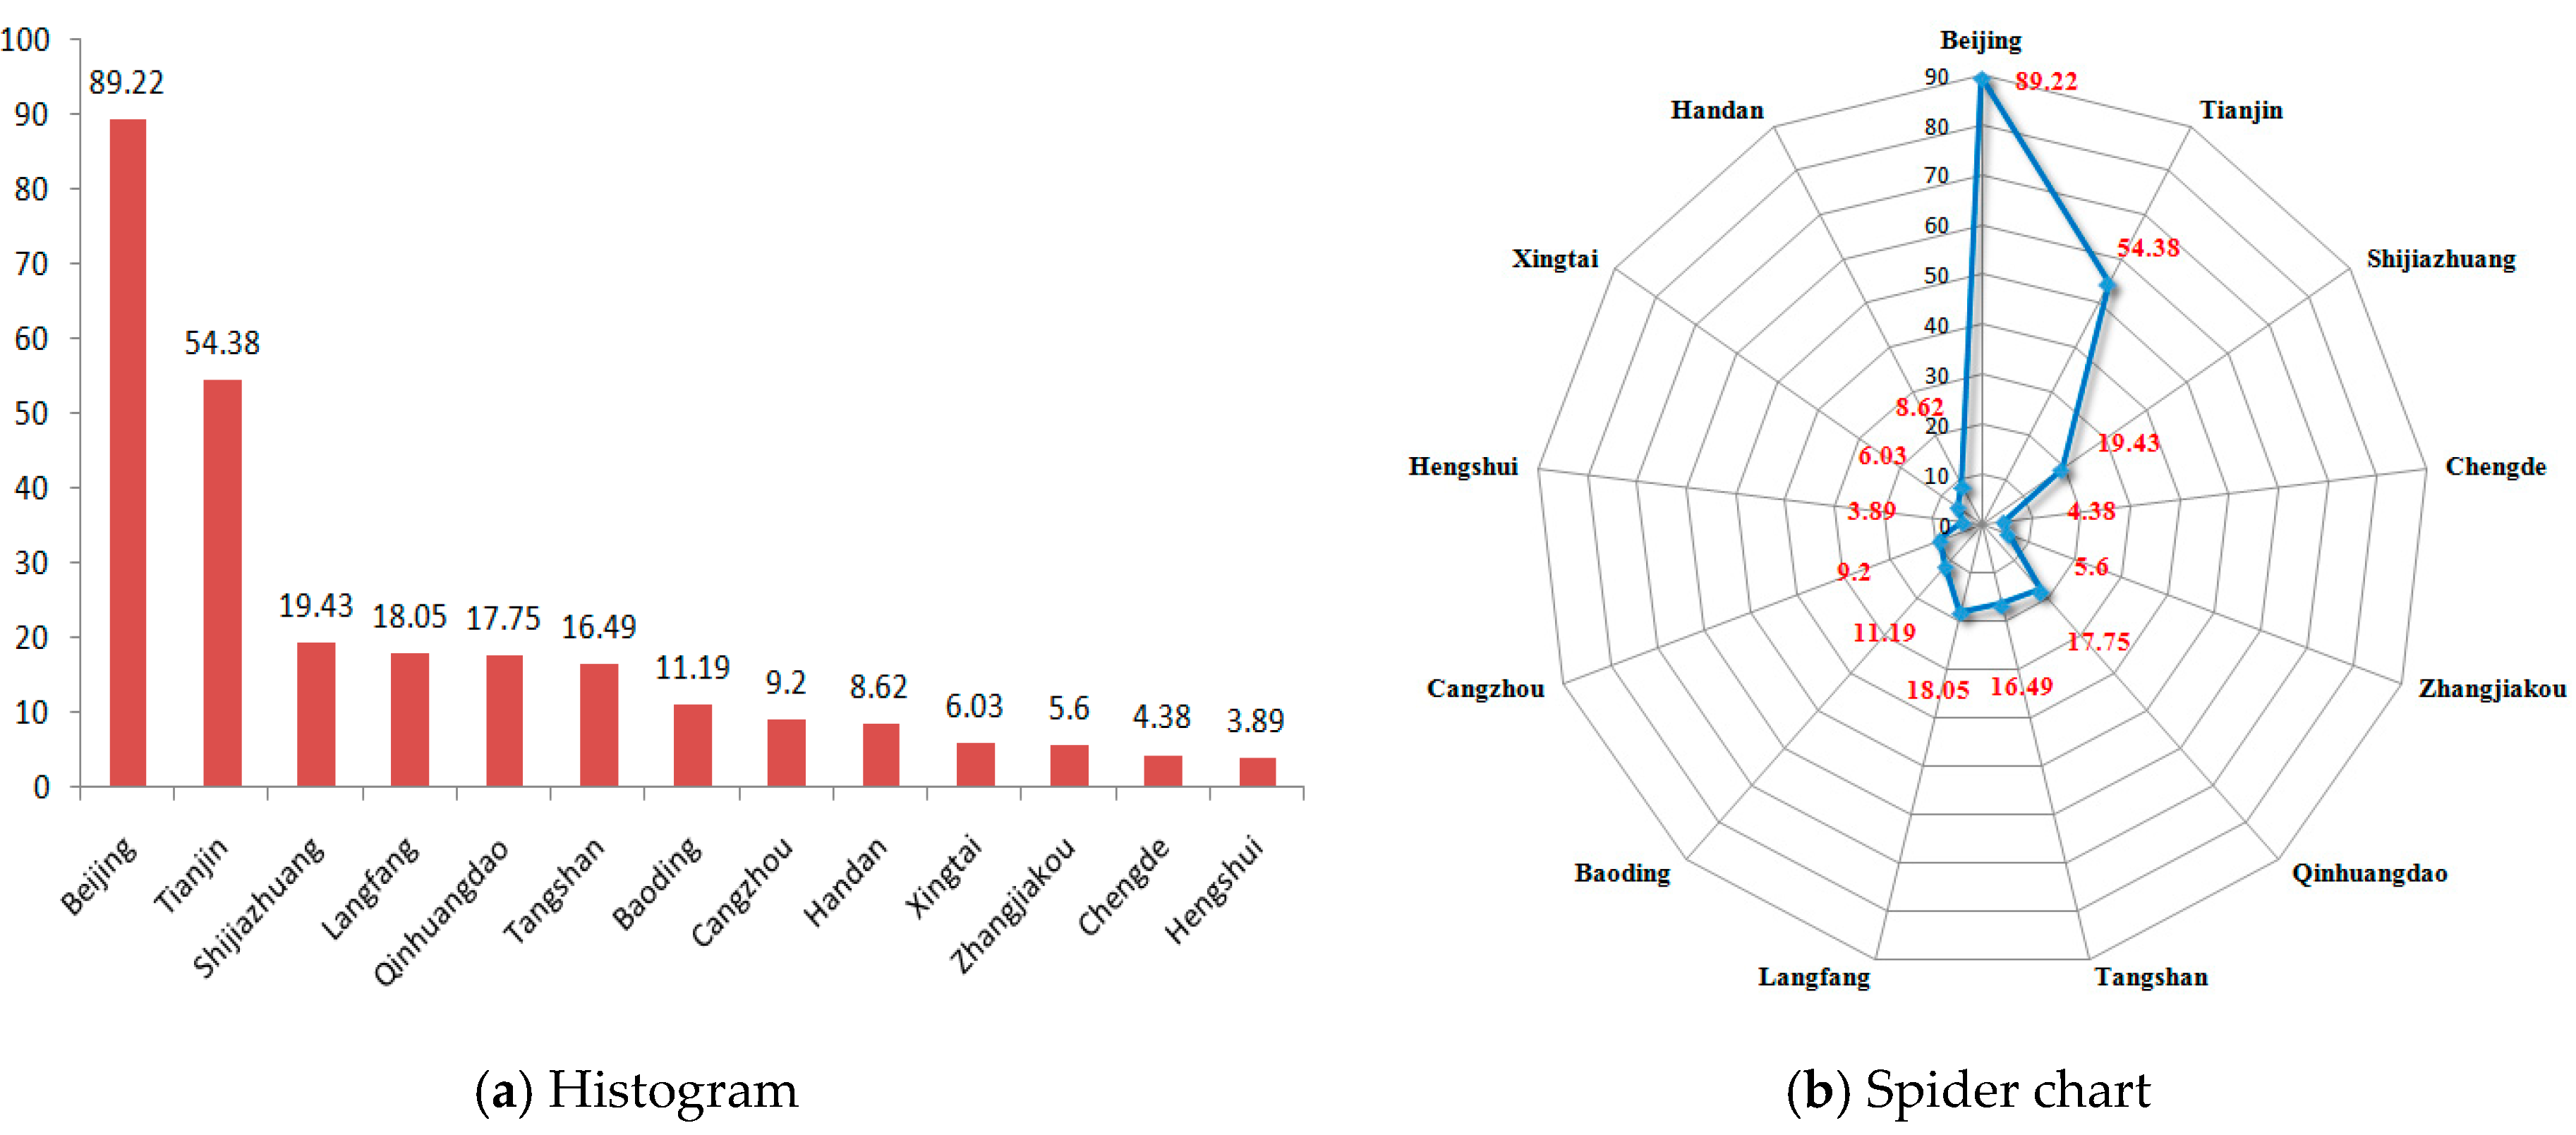
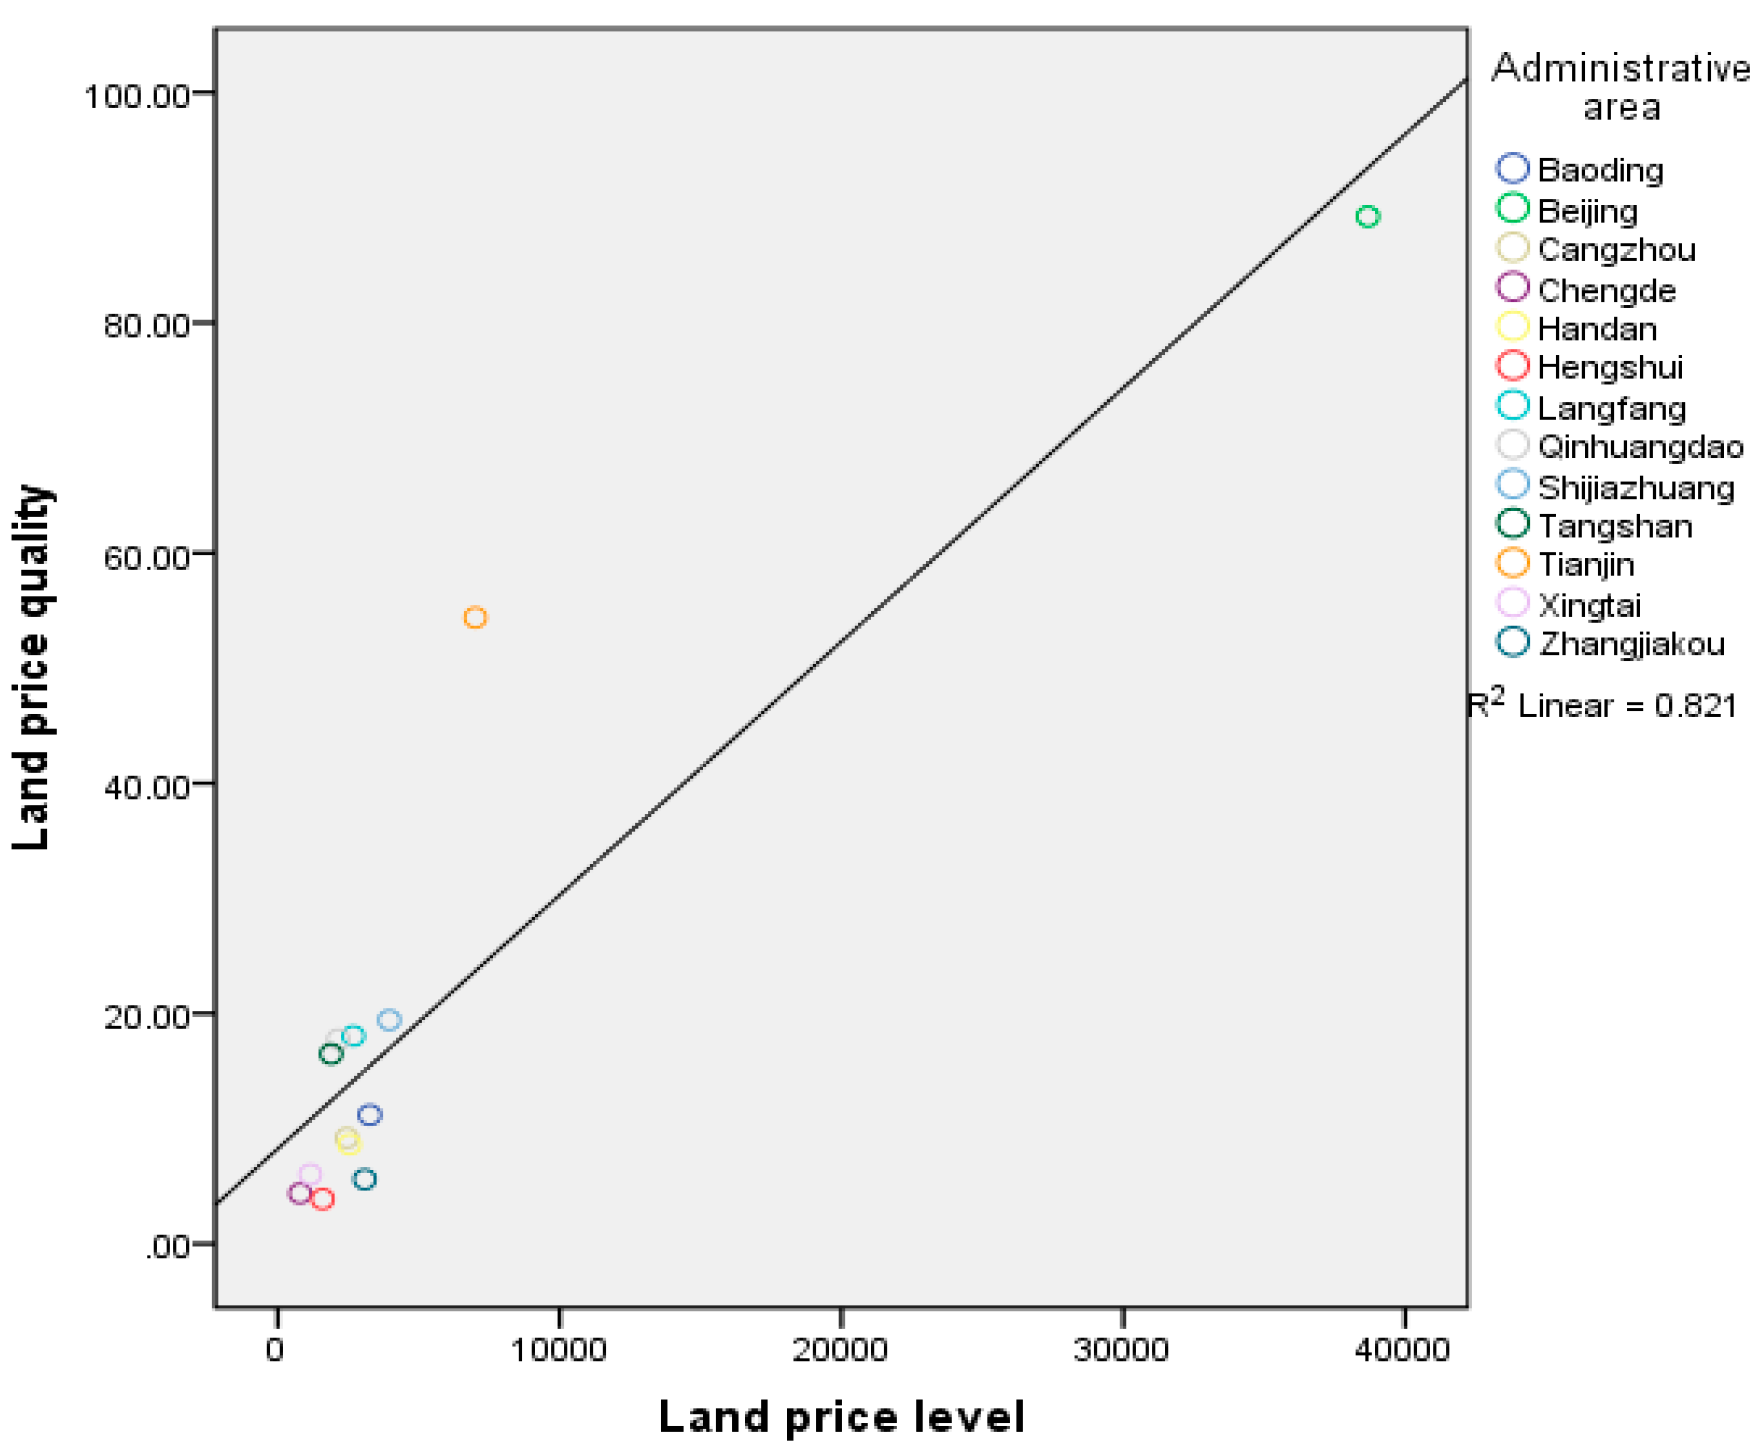
4.1. Urban Land-Price Quality
4.2. Urban Interaction Distance and Accessibility Coefficients
4.3. Urban Land-Price Gravity
4.4. Gravitational Pattern of Urban Land Prices
5. Discussion
5.1. Gravitational Characteristics of Land Prices
5.1.1. Characteristic of Gravitational Intensity
5.1.2. Spatial Characteristic of Gravitation
5.2. Gravitational Types of Urban Land Prices
5.2.1. Radiation Land Price
5.2.2. Conduction Land Price
5.2.3. Convection Land Price
5.3. Characteristics of Gravitational Patterns of Urban Land Prices
5.3.1. Polarization Effect around Beijing and Tianjin
5.3.2. Lock-In Effect in Southern Hebei
5.4. Suggestions Regarding Land-Price Control Measures in The Beijing-Tianjin-Hebei Region
6. Conclusions
Author Contributions
Funding
Acknowledgments
Conflicts of Interest
References
- Siciliano, G. Urbanization strategies, rural development and land use changes in China: A multiple-level integrated assessment. Land Use Policy 2012, 29, 165–178. [Google Scholar] [CrossRef]
- Yang, X.J. China’s rapid urbanization. Science 2013, 342, 310. [Google Scholar] [CrossRef] [PubMed]
- Long, H. Land use policy in China: Introduction. Land Use Policy 2014, 40, 1–5. [Google Scholar] [CrossRef]
- Chen, M.; Liu, W.; Lu, D. Challenges and the way forward in China’s new-type urbanization. Land Use Policy 2016, 55, 334–339. [Google Scholar] [CrossRef]
- Yang, K. The change of regional industrial structure and its effect on the regional growth and specialization in China. Acta Geogr. Sin. 1993, 48, 481–490. [Google Scholar]
- Burnett, P. Land use regulations and regional economic development. Land Econ. 2016, 92, 237–255. [Google Scholar] [CrossRef]
- Xu, S. The 13th Five-Year Plan for National Economic and Social Development of the People Republic of China (2016–2020); Compilation & Translation Press: Beijing, China, 2016. [Google Scholar]
- Chen, M.; Guo, S.; Lu, D. Characteristics and spatial patterns of floating population in the Beijing-Tianjin-Hebei urban agglomeration under the background of new urbanization. Prog. Geogr. 2018, 37, 363–372. [Google Scholar]
- Tan, M.; Li, X.; Xie, H.; Lu, C. Urban land expansion and arable land loss in China—A case study of Beijing-Tianjin-Hebei region. Land Use Policy 2005, 22, 187–196. [Google Scholar] [CrossRef]
- Wang, S.; Ma, H.; Zha, Y. Exploring the relationship between urbanization and the eco-environment—A case study of Beijing-Tianjin-Hebei region. Ecol. Indic. 2014, 45, 171–183. [Google Scholar] [CrossRef]
- Chen, X.; Liu, Y.; Lu, H.; Hu, X. Spatial identification of multifunctional landscapes and associated influencing factors in the Beijing-Tianjin-Hebei region, China. Appl. Geogr. 2016, 74, 170–181. [Google Scholar]
- el Araby, M.M. The role of the state in managing urban land supply and prices in Egypt. Habitat Int. 2003, 27, 429–458. [Google Scholar] [CrossRef]
- Yang, K.; Wang, Y.; Zhang, S. City land price factorial analysis and spatial distribution research in Jiangsu province. Hum. Geogr. 2013, 1, 69–74. [Google Scholar]
- Yang, S.; Hu, S.; Li, W.; Zhang, C.; Torres, A.J. Spatiotemporal Effects of Main Impact Factors on Residential Land Price in Major Cities of China. Sustainability 2017, 9, 2050. [Google Scholar] [CrossRef]
- Nasr, K.; Boris, A.P. Economic, demographic and environmental factors affecting urban land prices in the Arab sector in Israel. Land Use Policy 2016, 50, 518–527. [Google Scholar]
- Hu, S.; Yang, S.; Li, W.; Zhang, C.; Xu, F. Spatially non-stationary relationships between urban residential land price and impact factors in Wuhan city, China. Appl. Geogr. 2016, 68, 48–56. [Google Scholar] [CrossRef]
- Liu, Y.; Zheng, B.; Turkstrae, J.; Huan, L. A hedonic model comparison for residential land value analysis. Int. J. Appl. Earth Obs. Geoinf. 2010, 12, S181–S193. [Google Scholar] [CrossRef]
- Huang, D.; Yang, X.; Liu, Z.; Zhao, X.; Kong, F. The Dynamic Impacts of Employment Subcenters on Residential Land Price in Transitional China: An Examination of the Beijing Metropolitan Area. Sustainability 2018, 10, 1016. [Google Scholar] [CrossRef]
- Glaesener, M.-L.; Caruso, G. Neighborhood green and services diversity effects on land prices: Evidence from a multilevel hedonic analysis in Luxembourg. Landsc. Urban Plan. 2015, 143, 100–111. [Google Scholar] [CrossRef]
- Zhu, J.; Chen, B.; Lu, P.; Liu, J.; Tang, G. Impact of urban water system treatment on the surrounding residential land price. Arab. J. Geosci. 2018, 11, 6. [Google Scholar] [CrossRef]
- Cervero, R.; Kang, C.D. Bus rapid transit impacts on land uses and land values in Seoul, Korea. Transp. Policy 2011, 18, 102–116. [Google Scholar] [CrossRef]
- Shen, Y.; Karimi, K. The economic value of streets: Mix-scale spatio-functional interaction and housing price patterns. Appl. Geogr. 2017, 79, 187–202. [Google Scholar] [CrossRef]
- Lee, J.; Sohn, K. Identifying the Impact on Land Prices of Replacing At-grade or Elevated Railways with Underground Subways in the Seoul Metropolitan Area. Urban Stud. 2014, 51, 44–62. [Google Scholar] [CrossRef]
- Du, J.; Richard, B.P. Land supply, pricing and local governments’ land hoarding in China. Reg. Sci. Urban Econ. 2014, 48, 180–189. [Google Scholar] [CrossRef]
- Kok, N.; Monkkonen, P.; Quigley, M. Land use regulations and the value of land and housing: An intra-metropolitan analysis. J. Urban Econ. 2014, 81, 136–148. [Google Scholar] [CrossRef]
- Davis-Regional, M.A. The price and quantity of land by legal form of organization in the United States. Sci. Urban Econ. 2009, 39, 350–359. [Google Scholar] [CrossRef]
- Du, H.; Yong, K.; An, M.Y. The impact of land policy on the relation between housing and land prices: Evidence from China. Q. Rev. Econ. Financ. 2011, 51, 19–27. [Google Scholar] [CrossRef]
- Ridker, R.G.; Henning, J.A. The determinants of residential property values with special reference to air pollution. Rev. Econ. Stat. 1967, 49, 246–257. [Google Scholar] [CrossRef]
- Freeman, A.M. The Measurement of Environmental and Resource Values: Theory and Methods; University of Wisconsin Press: Madison, WI, USA, 1996; pp. 274–275. [Google Scholar]
- Brasington, D.M.; Diane, H. Demand for environmental quality: A spatial hedonic analysis. Reg. Sci. Urban Econ. 2005, 35, 57–82. [Google Scholar] [CrossRef]
- Bastian, C.T.; McLeod, M.D.; Germino, M.J.; Reiners, M.A.; Benedict, J.B. Environmental amenities and agricultural land values: A hedonic model using geographic information systems data. Ecol. Econ. 2002, 40, 337–346. [Google Scholar] [CrossRef]
- Kim, S.; Kim, T.; Suh, K. Analysis of the Implication of Accessibility to Community Facilities for Land Price in Rural Areas using a Hedonic Land Price Model. J. Korean Soc. Rural Plan. 2016, 22, 93–100. [Google Scholar] [CrossRef]
- Jim, C.Y.; Chen, Y. Impacts of urban environmental elements on residential housing prices in Guangzhou (China). Landsc. Urban Plan. 2006, 78, 422–434. [Google Scholar] [CrossRef]
- Sander, H.A.; Stephen, P. The value of views and open space: Estimates from a hedonic pricing model for Ramsey County, Minnesota, USA. Land Use Policy 2009, 26, 837–845. [Google Scholar] [CrossRef]
- Sander, H.A.; Haight, R.G. Estimating the economic value of cultural ecosystem services in an urbanizing area using hedonic pricing. J. Environ. Manag. 2012, 113, 194–205. [Google Scholar] [CrossRef] [PubMed]
- Huang, H.; Yin, L. Creating sustainable urban built environments: An application of hedonic house price models in Wuhan, China. J. Hous. Built Environ. 2015, 30, 219–235. [Google Scholar] [CrossRef]
- Glumac, B.; Herrera-Gomez, M.; Lichero, J. A hedonic urban land price index. Land Use Policy 2019, 81, 802–812. [Google Scholar] [CrossRef]
- Song, J.; Jin, X.; Tang, J.; Zhang, Z.; Ding, N.; Zhao, J.; Zhou, Y. Analysis of Influencing Factors for Urban Land Price and Its Changing Trend in China in Recent Years. Acta Geogr. Sin. 2011, 66, 1045–1054. [Google Scholar]
- Han, J.; Jin, X.; Zhang, Z.; Sun, W.; Xu, X.; Zhou, Y. Development Characteristics and Factors Analysis of Residential Land Price in China. Sci. Geogr. Sin. 2017, 37, 573–584. [Google Scholar]
- Coomeas, O.T.; MacDonald, K.G.; le Polain de Waroux, Y. Geospatial Land Price Data: A Public Good for Global Change Science and Policy. BioScience 2018, 68, 481–484. [Google Scholar] [CrossRef]
- Qin, Y.; Zhu, H.; Zhu, R. Changes in the distribution of land prices in urban China during 2007–2012. Reg. Sci. Urban Econ. 2016, 57, 77–90. [Google Scholar] [CrossRef]
- Hu, S.; Cheng, Q.; Wang, L.; Xie, S. Multifractal characterization of urban residential land price in space and time. Appl. Geogr. 2012, 34, 161–170. [Google Scholar] [CrossRef]
- Goffette-Nagot, F.; Reginster, I.; Thomas, I. Spatial analysis of residential land prices in Belgium: Accessibility, linguistic border, and environmental amenities. Reg. Stud. 2011, 45, 1253–1268. [Google Scholar] [CrossRef]
- Davis, M.A.; Oliner, S.D.; Pinto, E.J.; Bokka, S. Residential land values in the Washington, DC metro area: New insights from big data. Reg. Sci. Urban Econ. 2017, 66, 224–246. [Google Scholar] [CrossRef]
- Hu, S.; Cheng, Q.; Wang, L.; Xu, D. Modeling land price distribution using multifractal IDW interpolation and fractal filtering method. Landsc. Urban Plan. 2013, 110, 25–35. [Google Scholar] [CrossRef]
- Wen, H.; Chu, L. The Analysis on Spatial-Temporal Evolution and Impacting Factors of Residential Land Price in Hangzhou: Evidence Based on Spatial Econometric Model. In Proceedings of the 7th International Conference on Education, Management, Computer and Medicine (EMCM 2016), Shenyang, China, 29–31 December 2017. [Google Scholar]
- Wen, H.; Goodman, A.C. Relationship between urban land price and housing price: Evidence from 21 provincial capitals in China. Habitat Int. 2013, 40, 9–17. [Google Scholar] [CrossRef]
- Zou, G.; Chau, K. Determinants and sustainability of house prices: The case of Shanghai, China. Sustainability 2015, 7, 4524–4548. [Google Scholar] [CrossRef]
- Huang, H.; Tang, Y. Residential land use regulation and the US housing price cycle between 2000 and 2009. J. Urban Econ. 2012, 71, 93–99. [Google Scholar] [CrossRef]
- Chen, W.; Shen, Y.; Wang, Y. Does industrial land price lead to industrial diffusion in China? An empirical study from a spatial perspective. Sustain. Cities Soc. 2018, 40, 307–316. [Google Scholar] [CrossRef]
- Ding, C.; Zhao, X. Land market, land development and urban spatial structure in Beijing. Land Use Policy 2014, 40, 83–90. [Google Scholar] [CrossRef]
- Du, J.; Thill, J.C.; Peiser, R.B. Land pricing and its impact on land use efficiency in post-land-reform China: A case study of Beijing. Cities 2016, 50, 68–74. [Google Scholar] [CrossRef]
- Liu, Z.; Wang, P.; Zha, T. Land-price dynamics and macroeconomic fluctuations. Econometrica 2013, 81, 1147–1184. [Google Scholar]
- Liu, T.; Huang, M. Land supply and money growth in China. Int. Rev. Econ. Financ. 2016, 42, 327–338. [Google Scholar] [CrossRef]
- Du, J.; Thill, J.C.; Peiser, R.B.; Feng, C. Urban land market and land-use changes in post-reform China: A case study of Beijing. Landsc. Urban Plan. 2014, 124, 118–128. [Google Scholar] [CrossRef]
- Wu, Y.; Zhang, X.; Skitmore, M.; Song, Y.; Hui, E.C.M. Industrial land price and its impact on urban growth: A Chinese case study. Land Use Policy 2014, 36, 199–209. [Google Scholar] [CrossRef]
- Zhang, X.; Lin, Y.; Wu, Y.; Skitmore, M. Industrial land price between China’s Pearl River Delta and Southeast Asian regions: Competition or Coopetition? Land Use Policy 2017, 61, 575–586. [Google Scholar] [CrossRef]
- Anderson, J.E. The Gravity Model. Annu. Rev. Econ. 2011, 3, 133–160. [Google Scholar] [CrossRef]
- Reilly, W.J. Methods for the Study of retail relationships. Univ. Tex. Bull. 1929, 44, 1–9. [Google Scholar]
- Zipf, G.K. Hypothesis: On the Intercity Movement of Persons. Am. Sociol. Rev. 1946, 11, 677–686. [Google Scholar] [CrossRef]
- Çaǧdaş, G.; Berk, L. Dynamic Behavior of the City Center in Istanbul. Comput. Environ. Urban Syst. 1996, 20, 153–164. [Google Scholar] [CrossRef]
- Matsumoto, H. International Urban Systems and Air Passenger and Cargo Flows: Some Calculations. J. Air Transp. 2004, 10, 239–247. [Google Scholar] [CrossRef]
- Fotheringham, A.S. A new set of spatial interaction models. Environ. Plan. A 1983, 15, 15–36. [Google Scholar] [CrossRef]
- Celik, H.M.; Guldmann, J.M. Spatial interaction modeling of interregional commodity flows. Socio-Econ. Plan. Sci. 2007, 41, 147–162. [Google Scholar] [CrossRef]
- Djankov, S.; Freund, C. Trade Flows in the Former Soviet Union, 1987 to 1996. J. Comp. Econ. 2002, 30, 76–90. [Google Scholar] [CrossRef]
- Russon, M.G.; Vakil, F. Population, convenience and distance decay in a short-haul model of United States air transportation. J. Transp. Geogr. 1995, 3, 179–185. [Google Scholar] [CrossRef]
- Vaz, E.; Nijkamp, P. Gravitational forces in the spatial impacts of urban sprawl: An investigation of the region of Veneto, Italy. Habitat Int. 2015, 45, 99–105. [Google Scholar] [CrossRef]
- Lin, J.; Li, X. Simulating urban growth in a metropolitan area based on weighted urban flows by using web search engine. Int. J. Geogr. Inf. Sci. 2015, 29, 1721–1736. [Google Scholar] [CrossRef]
- Escamilla, J.B.G.; Pérez, S.L.; Martínez, Y.R.; Mendoza, S. Gravitational Model to Predict the Megalopolis Mobility of the Center of Mexico. Int. J. Adv. Eng. Manag. Sci. 2018, 4, 10. [Google Scholar] [CrossRef][Green Version]
- He, C.; Zhao, Y.; Tian, J.; Shi, P. Modeling the urban landscape dynamics in a megalopolitan cluster area by incorporating a gravitational field model with cellular automata. Landsc. Urban Plan. 2013, 113, 78–89. [Google Scholar] [CrossRef]
- Scherngell, T.; Hu, Y. Collaborative knowledge production in China: Regional evidence from a gravity model approach. Reg. Stud. 2008, 45, 755–772. [Google Scholar] [CrossRef]
- Qian, C.; Ye, J.; Lu, C. Gravity zoning in Wuhan Metropolitan Area based on an improved urban gravity model. Prog. Geogr. 2015, 34, 237–245. [Google Scholar]
- Zhu, D.; Lu, L.; Jin, X. Spatial Patterns of City in Anhui Province Based on Gravity Model. Geogr. Sci. 2011, 31, 551–556. [Google Scholar]
- Lao, X.; Shen, T.; Yang, Y. A Study on the Economic Network of the Urban Agglomeration in the Middle Reaches of the Yangtze River: Based on Social Network Analysis Method with Gravity Model. Urban Dev. Stud. 2016, 23, 91–98. [Google Scholar]
- Zhao, Z.; Wang, J.; Feng, J. Research on the Spatial Correlation of Central Cities in Beijing-Tianjin-Hebei. Urban Agglom. Econ. 2017, 37, 60–66. [Google Scholar]
- Xu, Y.; Zhou, Y.; Xu, F. Regional Effection Model Attributed to Revise Standard Price of Urban Land Spatially. Econ. Geogr. 2003, 3, 355–358. [Google Scholar]
- Liu, Y.; Liu, Y.; Lan, Z.; Xia, Y.; Liu, W. Balance of Datum Land Prices Among Cities Based on the City Gravitation Model and Stochastic Diffusion Equation. Geo-Spat. Inf. Sci. 2008, 11, 71–78. [Google Scholar] [CrossRef]
- Zhao, L.; Ge, J. Urban Land Price Based on the Gravity Model: A Case Study of Jing-Jin-Ji Metropolitan Region. China Land Sci. 2013, 27, 53–58. [Google Scholar]
- Liang, Y.; Cai, X.; Zhang, L. The study about influence differences and extremum attenuation degree of regional urban land price. J. Arid Land Resour. Environ. 2018, 32, 49–57. [Google Scholar]
- Liu, M.; Wang, W.; Liu, J. The Delimitation and Evolution Pattern of Cities Space Attractive Scopes in the Zhongyuan Urban Agglomeration. Reg. Res. Dev. 2017, 36, 49–54. [Google Scholar]
- Liu, A.; Xie, Z. Division of Town Economic Zones Based on Weighted Voronoi Diagram: A Case Study of Shiyan. Geogr. Geogr. Inf. Sci. 2011, 27, 79–82. [Google Scholar]
- Wei, X.; Liang, J.; Hou, H. Delimitating town’s field based on analysis of road network voronoi diagram: A case study of Daye city. Geogr. Geogr. Inf. Sci. 2014, 30, 66–70. [Google Scholar]
- Guo, X.; Li, Y.; Ma, L. Research on Structure of Urban System Based on the Model of Improved Converse Breaking Point and Weighted Voronoi Diagram: A Case Study of Tianshui. Reg. Res. Dev. 2017, 36, 70–75. [Google Scholar]
- Song, Z.; Xiao, J. Analysis on the Land Price Factors in the Context of Macro-level Framework. China Land Sci. 2012, 26, 4–11. [Google Scholar]
- Li, C.; Liu, C.; Ge, J.; Liang, S.; Liu, J. The rationality of the land price in different grades of towns: Taking Hebei province as an example. J. Arid Land Resour. Environ. 2017, 31, 51–58. [Google Scholar]
- Ministry of Natural Resources of the Peple’s Republic of China; Chinese Land Surveying and Planning Institute. Regulations for Valuations on Urban Land (GB/T 18508-2014); Standards Press of China: Beijing, China, 2014.
- Guo, P.; Xu, R. The Relationship between Urban Rail Transit and Urban Development Based on Gravitation Field Model. Syst. Eng. 2006, 24, 36–40. [Google Scholar]
- Liu, Y. Assessment Model and Spatial Distribution Features of Urban Land Value in China. China Popul. Resour. Environ. 1998, 1, 20–25. [Google Scholar]
- Zheng, G.; Zhao, Q. Research on the Main Direction of Economic Contact of Shandong Peninsula City Agglomeration. Areal Res. Dev. 2004, 23, 51–54. [Google Scholar]
- Yang, S.; Zhang, L.; Yang, C.; Liu, T.-T. Highway route scheme optimization model based on identical degree of set pair analysis. J. Transp. Syst. Eng. Inf. Technol. 2008, 8, 115–119. [Google Scholar]
- He, M.; Liu, L.; Wang, H.; Liu, J. Unknown weight multiple attribute decision for engineering appraisal bidding based on set pair analysis. J. Cent. South Univ. 2012, 43, 4057–4062. [Google Scholar]
- Liu, C.; Yu, R.; Xiong, J.; Zhu, J.-L.; Zhang, H. The spatial structure of economic linkage of Wuhan metropolitan area. Geogr. Res. 2007, 26, 197–208. [Google Scholar]
- Zhang, X.; Guo, H.; Zhang, H. Fractal Characteristic of Regional Economic Relation Intensity and It’s Application in Western China. Acta Sci. Nat. Univ. Pekin. 2007, 43, 245–249. [Google Scholar]
- Okabe, A.; Boots, B.; Sugihara, K. Spatial Tessellations: Concepts and Applications of Voronoi Diagrams; John Wiley & Sons: Hoboken, NJ, USA, 2000; pp. 15–20. [Google Scholar]
- Gu, J.; Zhou, T.; Guo, L. Urban Influence Regions and Spatial Relation of Beijing-Tianjin-Hebei Region Based on Weighted Voronoi Diagram and Breakpoint Theory. Geogr. Geo-Inf. Sci. 2014, 30, 65–69. [Google Scholar]


| First-Grade Index | Weight | Second-Grade Index | Weight | Variable | Weight |
|---|---|---|---|---|---|
| Urban location | 0.1590 | External contact Ability | 0.1590 | Freight volume | 0.0548 |
| Passenger volume | 0.1041 | ||||
| Urban agglomeration degree | 0.2936 | Population | 0.0817 | Nonagricultural population | 0.0817 |
| Built-up area | 0.0848 | Built-up area | 0.0848 | ||
| Non-agricultural industries scale | 0.0843 | Secondary and tertiary industries income | 0.0843 | ||
| Tertiary industry scale | 0.0428 | The proportion of tertiary industrial output-value | 0.0428 | ||
| Urban input-output level | 0.3682 | Investment level | 0.1702 | Investment in fixed assets of unit land | 0.0725 |
| Number of employees in unit land use | 0.0977 | ||||
| Output level | 0.1979 | Retail sales of social consumer goods per unit land | 0.0927 | ||
| Financial revenue of unit land | 0.1052 | ||||
| Urban comprehensive service capability | 0.1391 | Financial situation | 0.0436 | Per capita bank savings deposits | 0.0436 |
| Postal and telecommunications service ability | 0.0427 | Per capita postal and telecommunications business volume | 0.0427 | ||
| Scientific and technological level | 0.0529 | The proportion of expenditure on science and education | 0.0529 | ||
| Urban land potential | 0.0401 | Population density | 0.0401 | Population density | 0.0401 |
| Land Price Quality | Land Price Level | ||
|---|---|---|---|
| Land price quality | Pearson Correlation | 1 | 0.906 ** |
| Sig. (2-tailed) | 0.000 | ||
| N | 13 | 13 | |
| Land price level | Pearson Correlation | 0.906 ** | 1 |
| Sig. (2-tailed) | 0.000 | ||
| N | 13 | 13 |
| City | Beijing | Tianjin | Shijiazhuang | Chengdu | Zhangjiakou | Qinhuangdao | Tangshan | Langfang | Baoding | Cangzhou | Hengshui | Xingtai | Handan |
|---|---|---|---|---|---|---|---|---|---|---|---|---|---|
| Beijing | —— | 136/1.48 | 284/0.72 | 238/0.82 | 218/1.05 | 288/0.7 | 184/1.06 | 63/3.18 | 147/1.35 | 2310.82 | 270/0.69 | 399/0.66 | 473/0.62 |
| Tianjin | 136/1.48 | —— | 354/0.6 | 315/0.65 | 343/0.67 | 259/0.83 | 124/1.78 | 78/3.14 | 197/1 | 121/1.78 | 252/0.7 | 407/0.58 | 435/0.55 |
| Shijiazhuang | 284/0.72 | 354/0.6 | —— | 523/0.71 | 476/0.8 | 587/0.65 | 455/0.79 | 284/1.24 | 137/2.82 | 232/1.48 | 145/2.71 | 124/2.75 | 1721.86 |
| Chengde | 238/0.82 | 315/0.65 | 523/0.71 | —— | 398/0.92 | 376/1.03 | 256/0.84 | 299/1.21 | 385/0.68 | 409/0.82 | 501/0.6 | 630/0.54 | 686/0.5 |
| Zhangjiakou | 218/1.05 | 343/0.67 | 476/0.8 | 398/0.92 | —— | 506/0.73 | 405/0.69 | 285/1.43 | 374/0.75 | 512/0.8 | 460/0.72 | 534/0.65 | 608/0.58 |
| Qinhuangdao | 288/0.7 | 259/0.83 | 587/0.65 | 376/1.03 | 506/0.73 | —— | 141/1.79 | 327/1.13 | 436/0.83 | 367/0.98 | 513/0.7 | 676/0.62 | 713/0.52 |
| Tangshan | 184/1.06 | 124/1.78 | 455/0.79 | 256/0.84 | 405/0.69 | 141/1.79 | —— | 193/1.38 | 296/0.88 | 225/1.11 | 361/0.73 | 512/0.65 | 561/0.6 |
| Langfang | 63/3.18 | 78/3.14 | 284/1.24 | 299/1.21 | 285/1.43 | 327/1.13 | 193/1.38 | —— | 144/1.59 | 170/1.66 | 249/1.11 | 391/0.99 | 453/0.88 |
| Baoding | 147/1.35 | 197/1 | 137/2.82 | 385/0.68 | 374/0.75 | 436/0.83 | 296/0.88 | 144/1.59 | —— | 166/0.95 | 156/1.14 | 249/1.05 | 297/0.92 |
| Cangzhou | 231/0.82 | 121/1.78 | 232/1.48 | 409/0.82 | 512/0.8 | 367/0.98 | 225/1.11 | 170/1.66 | 166/0.95 | —— | 147/1.21 | 310/0.86 | 351/0.81 |
| Hengshui | 270/0.69 | 252/0.7 | 145/2.71 | 501/0.6 | 460/0.72 | 513/0.7 | 361/0.73 | 249/1.11 | 156/1.14 | 147/1.21 | —— | 178/1.24 | 261/1.22 |
| Xingtai | 399/0.66 | 407/0.58 | 124/2.75 | 630/0.54 | 534/0.65 | 676/0.62 | 512/0.65 | 391/0.99 | 249/1.05 | 310/0.86 | 178/1.24 | —— | 62/2.1 |
| Handan | 473/0.62 | 435/0.55 | 1721.86 | 686/0.5 | 608/0.58 | 713/0.52 | 561/0.6 | 453/0.88 | 297/0.92 | 351/0.81 | 261/1.22 | 62/2.1 | —— |
| City | Beijing | Tianjin | Shijiazhuang | Chengdu | Zhangjiakou | Qinhuangdao | Tangshan | Langfang | Baoding | Cangzhou | Hengshui | Xingtai | Handan |
|---|---|---|---|---|---|---|---|---|---|---|---|---|---|
| Beijing | —— | 38.82 | 2.44 | 0.61 | 1.32 | 1.04 | 4.99 | 63.35 | 5.95 | 1.26 | 0.33 | 0.22 | 0.31 |
| Tianjin | 38.82 | —— | 0.47 | 0.17 | 0.23 | 0.89 | 11.24 | 24.87 | 1.50 | 6.09 | 0.23 | 0.11 | 0.20 |
| Shijiazhuang | 2.44 | 0.47 | —— | 0.02 | 0.05 | 0.02 | 0.12 | 0.25 | 2.89 | 0.46 | 1.43 | 1.95 | 1.82 |
| Chengde | 0.61 | 0.17 | 0.02 | —— | 0.02 | 0.02 | 0.11 | 0.06 | 0.02 | 0.02 | 0.00 | 0.00 | 0.01 |
| Zhangjiakou | 1.32 | 0.23 | 0.05 | 0.02 | —— | 0.02 | 0.06 | 0.12 | 0.04 | 0.02 | 0.01 | 0.01 | 0.01 |
| Qinhuangdao | 1.04 | 0.89 | 0.02 | 0.02 | 0.02 | —— | 1.16 | 0.07 | 0.03 | 0.05 | 0.01 | 0.01 | 0.01 |
| Tangshan | 4.99 | 11.24 | 0.12 | 0.11 | 0.06 | 1.16 | —— | 0.59 | 0.19 | 0.36 | 0.04 | 0.03 | 0.04 |
| Langfang | 63.35 | 24.87 | 0.25 | 0.06 | 0.12 | 0.07 | 0.59 | —— | 0.73 | 0.47 | 0.06 | 0.04 | 0.05 |
| Baoding | 5.95 | 1.50 | 2.89 | 0.02 | 0.04 | 0.03 | 0.19 | 0.73 | —— | 0.41 | 0.19 | 0.11 | 0.14 |
| Cangzhou | 1.26 | 6.09 | 0.46 | 0.02 | 0.02 | 0.05 | 0.36 | 0.47 | 0.41 | —— | 0.20 | 0.06 | 0.10 |
| Hengshui | 0.33 | 0.23 | 1.43 | 0.00 | 0.01 | 0.01 | 0.04 | 0.06 | 0.19 | 0.20 | —— | 0.09 | 0.13 |
| Xingtai | 0.22 | 0.11 | 1.95 | 0.00 | 0.01 | 0.01 | 0.03 | 0.04 | 0.11 | 0.06 | 0.09 | —— | 4.16 |
| Handan | 0.31 | 0.20 | 1.82 | 0.01 | 0.01 | 0.01 | 0.04 | 0.05 | 0.14 | 0.10 | 0.13 | 4.16 | —— |
| Name of Group | Central City | Scope of Influence (County) |
|---|---|---|
| City cluster around Beijing | Beijing | Beijing district and all the counties under its jurisdiction |
| Chengde district and all the counties under its jurisdiction | ||
| Zhangjiakou district and all the counties under its jurisdiction | ||
| Counties under Tianjin’s jurisdiction: Jing | ||
| Counties under Cangzhou’s jurisdiction: Suning | ||
| Counties under Hengshui’s jurisdiction: Anping, Raoyang | ||
| Langfang district and counties under its jurisdiction: Sanhe, Guan, Yongqing, Xianghe, Hui Autonomous County of Dachang | ||
| Baoding district and counties under its jurisdiction: Anguo, Boye, Li, Wangdu, Qingyuan, Anxin, Shunping, Gaoyang, Tang, Mancheng, Xushui, Rongcheng, Xiong, Dingxing, Gaobeidian, Yi, Zhuozhou, Laiyuan, Laishui | ||
| Northern coastal city cluster | Tangshan | Tangshan district and all the counties under its jurisdiction |
| Qinhuangdao district and all the counties under its jurisdiction | ||
| Central coastal city cluster | Tianjin | Counties under Hengshui’s jurisdiction: Fucheng |
| Counties under Langfang’s jurisdiction: Bahou, Dacheng, Wenan | ||
| Counties under Tianjin’s jurisdiction: Wuqing District, Dagang District, Baodi District, Jinnan District, Jinghai County, Xiqing District, Tianjin Urban District, Tanggu District, Dongli District, Beichen District, Hangu District and Ninghe County | ||
| Cangzhou district and counties under Cangzhou’s jurisdiction: Dongguang, Wuqiao, Yanshan, Nanpi, Botou, Huanghua, Xian, Haixing, Cangxian, Hejian, Qingxian, Renqiu, Mengcun Hui Autonomous County | ||
| Central city cluster | Shijiazhuang | Shijiazhuang and all the counties under its jurisdiction |
| Counties under Xingtai’s jurisdiction: Nangon, Lincheng, Xinhe, Baixiang, Ningjin | ||
| Counties under Hengshui’s jurisdiction: Wuyi, Shenzhou, Wuqiang, Taocheng, Jingxian, Gucheng, Zaoqiang, Jizhou | ||
| Counties under Baoding’s jurisdiction: Dingzhou, Quyang, Fuping | ||
| Southern city cluster | Handan | Handan and all the counties under its jurisdiction |
| Counties under Xingtai’s jurisdiction: Shahe, Linxi, Xingtai, Nanhe, Pingxiang, Qinghe, Ren, Xingtai, Guangzong, Weixian, Neiqiu, Julu |
© 2019 by the authors. Licensee MDPI, Basel, Switzerland. This article is an open access article distributed under the terms and conditions of the Creative Commons Attribution (CC BY) license (http://creativecommons.org/licenses/by/4.0/).
Share and Cite
Li, C.; Meng, Y.; Li, Y.; Ge, J.; Zhao, C. Inter-Metropolitan Land-Price Characteristics and Patterns in the Beijing-Tianjin-Hebei Urban Agglomeration in China. Sustainability 2019, 11, 4726. https://doi.org/10.3390/su11174726
Li C, Meng Y, Li Y, Ge J, Zhao C. Inter-Metropolitan Land-Price Characteristics and Patterns in the Beijing-Tianjin-Hebei Urban Agglomeration in China. Sustainability. 2019; 11(17):4726. https://doi.org/10.3390/su11174726
Chicago/Turabian StyleLi, Can, Yu Meng, Yingkui Li, Jingfeng Ge, and Chaoran Zhao. 2019. "Inter-Metropolitan Land-Price Characteristics and Patterns in the Beijing-Tianjin-Hebei Urban Agglomeration in China" Sustainability 11, no. 17: 4726. https://doi.org/10.3390/su11174726
APA StyleLi, C., Meng, Y., Li, Y., Ge, J., & Zhao, C. (2019). Inter-Metropolitan Land-Price Characteristics and Patterns in the Beijing-Tianjin-Hebei Urban Agglomeration in China. Sustainability, 11(17), 4726. https://doi.org/10.3390/su11174726