1. Introduction
The past few decades have witnessed a considerable growth in the emissions of noxious gases and greenhouse gases (GHGs) in maritime transport, causing various negative impacts on human health and the environment [
1]. Coastal emissions occupy a large proportion in global shipping emissions, almost 70% of which occur within 400 km (216 nautical miles) of the coast [
2]. Therefore, sustainable coastal shipping is an effective and inevitable way to address the issues derived from shipping emissions [
3]. Generally, sustainable coastal shipping measures can be divided into two aspects corresponding to controlling noxious emissions and reducing GHGs.
1.1. Control of Noxious Emissions
To mitigate the growing noxious gases emissions, the International Maritime Organization (IMO) has designated several emission control areas (ECAs) to limit the sulfur content of vessel fuel, including the Baltic Sea, the North Sea, the North American coasts, and the US Caribbean coasts. Similarly, the Ministry of Transport of China defined the Chinese coast as a domestic ECA, which came into force in 2019. Currently, the limit on sulfur content within in the Chinese ECA is 0.5%, while the global sulfur limit outside the ECA is 3.5%. An even more stringent sulfur limit of 0.1% is under consideration by the Chinese authorities and may take effect in 2025. In addition, the global sulfur limit will be reduced to 0.5% in 2020.
To comply with the limit on sulfur content, vessel operators must either use pricier liquified natural gas (LNG) and low-sulfur fuels like marine gas oil (MGO), or invest in abatement technologies like scrubber systems, which require relatively high capital costs [
4]. Currently, the most widely adopted method is switching to low-sulfur fuels [
5,
6]. The limit on sulfur content directly pushes up the cost for shipping operations inside the ECAs, especially along the coasts. Many vessel operators are forced to sail longer distances rather than pass through the ECAs [
7]. Besides, the coastal shipping sector may be outcompeted by land-based transport modes that are not directly affected by the strict sulfur regulations, leading to the decline of vessel loads [
8]. This poses a serious threat to maritime transport in China, where 59.7% of the shipping throughput is realized by bulk carriers and containerships in the coastal shipping sector. Against this backdrop, it is imperative to enhance the competitiveness of the coastal shipping sector through proper decision-making, such as optimizing speed and route [
9,
10]. It should be noted that controlling noxious emissions are requirements from the ECA regulations, and thus, are actually considered a policy constraint, rather than an objective for operators when making decisions of speed and route.
1.2. Reducion of GHG Emissions
In contrast with the control of noxious emissions, although GHGs (mostly carbon emissions) are not controlled by the ECA regulations as of yet, the operators have positively started taking into account the objective of reducing carbon emissions in the phase of decision-making. For example, the Maersk Line promised to slash their carbon emissions from shipping to zero [
11]. The survey recorded in [
12] also shows that some operators volunteer to reduce carbon emissions.
This trend of reducing carbon emissions was mainly encouraged by the preferences of governments, shippers, and other stakeholders [
13]. Maritime transport contributes greatly to carbon emissions [
14,
15]. If no action is taken, maritime carbon emissions will grow by 50%–250% in 2050, pushing up the temperature globally [
16]. Therefore, increasingly concerned about global warming, governments and the public expect the shipping sector to reduce carbon emissions. For instance, China, in order to reflect the commitment of a responsible power, has proposed that the carbon emissions per unit of gross domestic product in 2030 will be reduced by 60% to 65% compared to 2005. Under the pressure of the government, various industries, including the shipping sector, have set more sustainable objectives. Besides, existing studies have demonstrated that continuous efforts targeted at protecting the environment are favorable to increasing long-term business performance [
17,
18]. Many shippers and forwarders look forward to sustainable shipping, which may further stimulate the operators to set low carbon objectives [
19]. Furthermore, optimizing operational measures of speed and route is a much cheaper way compared with retrofitting vessels to combust low-carbon fuels, such as biofuel.
Summing up, for the operator pursuing sustainable development, the decision-making on speed and route is essentially a tradeoff between the maximal profit and the minimal carbon emissions, while switching to low-sulfur fuels within the ECA to comply to the regulations [
20,
21].
This paper mainly tackles two questions: Do the level of attention paid to carbon emissions affects the decisions on optimal speed and route change for vessels that switch to low-sulfur fuels under ECA regulations, and if so how? What are the impacts of these decisions on the coastal shipping sector? The authors also explored how fuel price, vessel load, and vessel size affect the sustainable operations of coastal shipping.
There are three main contributions of this research: the existing methods were integrated to compute profit and fuel consumption; several important principles of sustainable shipping operations were given under different objectives, such as the Pareto speed interval, as well as the impacts of rerouting outside the ECAs; the sustainable shipping operations of vessels with different sizes sailing along coastal China under different scenarios of fuel price and vessel load were examined empirically.
The remainder of this paper is organized as follows:
Section 2 reviews the existing studies on the ECA regulations and sustainable operation objectives;
Section 3 introduces the method to compute profit and carbon emissions;
Section 4 verifies the proposed method through a case study;
Section 5 puts forward the research conclusions.
2. Literature Review
2.1. The ECA Regulations and Their Impacts
The ECA regulations require the operator to switch to expensive low-sulfur fuels, and thus have great side effects on many aspects of shipping operations; namely, speed and route [
22,
23,
24].
Concerning speed, vessel operators may sail at a lower speed inside the ECAs to compensate for the extra cost needed to comply with ECA regulations. Fagerholt and Psaraftis [
25] optimized the vessel speed in and out of ECAs based on the Ronen’s model [
26], and solved the ECA reroute problem by optimizing the point that a vessel crosses the ECA boundary. Similarly, Doudnikoff and Lacoste [
27] analyzed the difference between vessel speeds inside and outside of the ECAs. Zis, et al. [
28] also demonstrated that the differentiated sailing speeds inside and outside the ECAs, which may further lead to additional carbon emissions per journey. However, some recent studies argue that the strict limit on sulfur content in fuel does not necessarily affect the vessel speed [
29]. The studies above ignored how operation objectives affect the impacts on the speed within ECAs. In fact, Lindstad, et al. [
14] found that vessel operators make different speed decisions under different objectives. This finding was introduced to study the ECA case in our research.
It is generally agreed that the ECA regulations affect the vessel route. Fagerholt, et al. [
9] discovered that vessel operators tend to choose the routes outside the ECAs, despite their longer distances. On this basis, Zhen, et al. [
30] analyzed the impacts of the ECAs on the routes of cruise ships. Chen, et al. [
31] also suggested that vessels may reroute to avoid sailing in the ECAs. Drawing on the literature, this paper considers that route decisions are influenced by fuel price, vessel load, and sustainable operation objectives.
Besides speed and route, the literature also explored other impacts of ECA regulations. Patricksson and Erikstad [
32] analyzed the choices of abatement technology for the shipping companies considering the uncertainty of fuel price; the results found the dual fuel engine and gas engine that can combust liquid natural gas (LNG) has a cost advantage with a time horizon of about 20 years. However, the LNG-fueled vessels make up a very small market share currently. This paper only focused on the operational optimization for the most widely-adopted compliance; i.e., fuel switching. Bergqvist, et al. [
33] and Zis and Psaraftis [
34] show that the ECA regulations in Europe may increase the freight rate, and thus stimulate the redistribution of cargo flow with land-based alternatives; i.e., modal shift. The possible impact of modal shift was considered and used to set different scenarios in this paper. Our case study analyzed the operational measures under scenarios of different vessel loads and fuel prices.
2.2. Sustainable Operation Objectives
In recent years, shipping operation problems considering environmental impacts have occupied an increasing proportion in the literature [
35]. The related literature is often based on single-objective optimization. Corbett, et al. [
36] calculated the carbon emissions based on the results of a single-objective, profit maximization model. Kim, et al. [
37] set carbon taxation as a constraint of the fuel-cost minimization model. Wen, et al. [
38] proposed a cost minimizing model and an alternative, single-objective optimization model, including minimizing trip duration and minimizing emissions.
Besides single-objective optimization, many scholars also investigated the different objectives in sustainable shipping operations with the aim to strike a balance between profit and environment. For instance, Psaraftis and Kontovas [
39] explored the effects of various maritime policies on carbon emissions, and attempted to eliminate the environmental impacts by reducing the steaming speed, changing the number of vessels in the fleet, and using in-transit inventory holdings. Lindstad, et al. [
14] analyzed the impacts of speed reduction on cost and carbon emissions, and demonstrated that speed reduction alone can lower carbon emissions with zero abatement costs. Wong, et al. [
40] proposed a utility function to strike the balance between fuel cost, carbon emissions, and trip duration. Under the constraints of sensitive demand and ECA regulations, Cheaitou and Cariou [
41] developed a multi-objective optimization (MOO) framework to optimize the vessel speed of liner shipping, including different objective functions like profit, carbon emissions, and sulfur oxide emissions. Mansouri, et al. [
42] summed up the studies on environmental sustainability, decision support systems, and multi-objective optimization in maritime shipping.
The studies above demonstrate the importance of taking different objectives into account. In this paper, the bi-objective optimization method of Cheaitou and Cariou [
41] is extended under multiple scenarios, and adopted to optimize the decisions on speed and route.
3. Methods
This section aims to determine the profit and carbon emissions for vessels sailing partially inside an ECA. The following hypotheses were put forward before modelling: (1) Both the main engine and auxiliary engine use the MGO when a vessel sails inside the ECA; the main engine uses heavy fuel oil (HFO) when the vessel sails outside the ECA, while the auxiliary engine continues to use the MGO [
25,
27]; (2) extreme weather and unexpected accidents are not worth considering; (3) The vessel speed remains above a lower limit (
) constrained by the charter contract to avoid delivery delay and below an upper limit (
) related to the maximum continuous rating of the engine. The input parameters and decision variables are defined in
Table 1.
3.1. Formulations of Fuel Consumption
In the previous research that deals with vessel speed [
26], the daily fuel consumption of the main engine was often assumed to be a cubic function of vessel speed:
where
v is the vessel speed. Considering both vessel speed and load, the modified admiralty coefficient formula can approximate fuel consumption more realistically [
43,
44,
45]:
where
G and
n are two constants dependent on vessel features (e.g.,
G > 0 and
n ≥ 3). As mentioned in Psaraftis and Kontovas [
44],
n = 3 is a good approximation for bulk carriers. Wang and Meng [
46] shows that
n = 3 can also be a good approximation for containerships if not enough data are available for more accurate calibration.
The result of the cubic function (Equation (1)) may seriously under or overestimate reality. After all, a vessel sailing at a given speed needs to overcome different levels of resistance when it is empty, half-loaded, or fully-loaded. The resistance level determines the fuel consumption of the main engine. If vessel load is neglected (
W = 0), however, Equation (1) can approximate fuel consumption realistically. Thus, the fuel consumption of the main engine in an empty vessel can be computed by either Equation (1) or (2). The value of
G in function Equation (2) can be approximated by:
Inspired by Cariou and Cheaitou [
47] and Doudnikoff and Lacoste [
27], the daily fuel consumption of the main engine at the design speed can be expressed as:
Combining Equations (2), (3), and (4), the daily fuel consumption of the main engine can be finalized as:
Equation (5) gives a more precise result than cubic Equation (1). The vessel parameters in Equation (5) can be directly obtained from vessel specifications.
The auxiliary engine supplies the auxiliary power needed to generate electricity on board. Its fuel consumption is independent of vessel speed. Therefore, the daily fuel consumption of the auxiliary engine can be expressed as:
3.2. Formulations of Time
The sailing time inside ECA, the sailing time outside ECA. and the time spent in ports can be computed, respectively, by:
3.3. Formulations of Costs, Profit, and Carbon Emissions
The fuel costs are the product of time, daily fuel consumption. and fuel price. The fuel costs inside and outside the ECA can be computed, respectively, by:
The fuel cost in ports was considered to make the cost calculation more realistic. This cost can be calculated by:
The cost per ton-nautical-mile,
C, consisting of fuel costs, cargo handling charges, and the daily cost in TCE (i.e., the financial items, depreciation, and operating cost), can be described as:
where the first term 1/
WL converts the total cost per voyage to the cost per ton-nautical-mile; the second term is the cost of bunker fuel; the third term is the cargo handling charge; the last term is the daily cost in TCE.
The profit per ton-nautical-mile can be obtained by subtracting the cost per ton-nautical-mile from the revenue per ton-nautical-mile:
The MGO consumption and HFO consumption can be computed, respectively, by:
As reported by the IMO [
16], the carbon emission per ton-nautical-mile can be determined by:
4. Case Study
The formulations in the previous section were applied to determine the vessel speed and route in an actual case. A bi-objective optimization model was set up to optimize the speed and route for different objectives and scenarios. The optimal results were obtained for different vessel types sailing along coastal China. The coastal shipping sector in China was selected as the target, due to its importance and the great challenges it is faced with.
4.1. Data Sources
In this section, the profit and carbon emissions of an actual vessel are computed based on the abovementioned formulations. The vessel, operated by Trawind Shipping Logistics, transports coal from Dalian to Guangzhou [
48].
The main parameters of the vessel (
Table 2) were obtained directly from Trawind. However, the operator kept the total revenue per voyage,
R, as confidential information. The HFO price and MGO price were set to 440 USD/ton and 720 USD/ton, respectively, according to the 2018 fuel prices on Bunkerworld.com [
49]. The carbon emission factors of the HFO and the MGO were, respectively, 3.206 and 3.114 [
16]. The cargo handling charges in Dalian and Guangzhou were both 4.35 USD/ton, as mentioned on dlport.cn [
50] and gzpgroup.com [
51]. The loading efficiencies in Dalian and Guangzhou were, respectively, 3600 and 3000 ton/h [
50,
51].
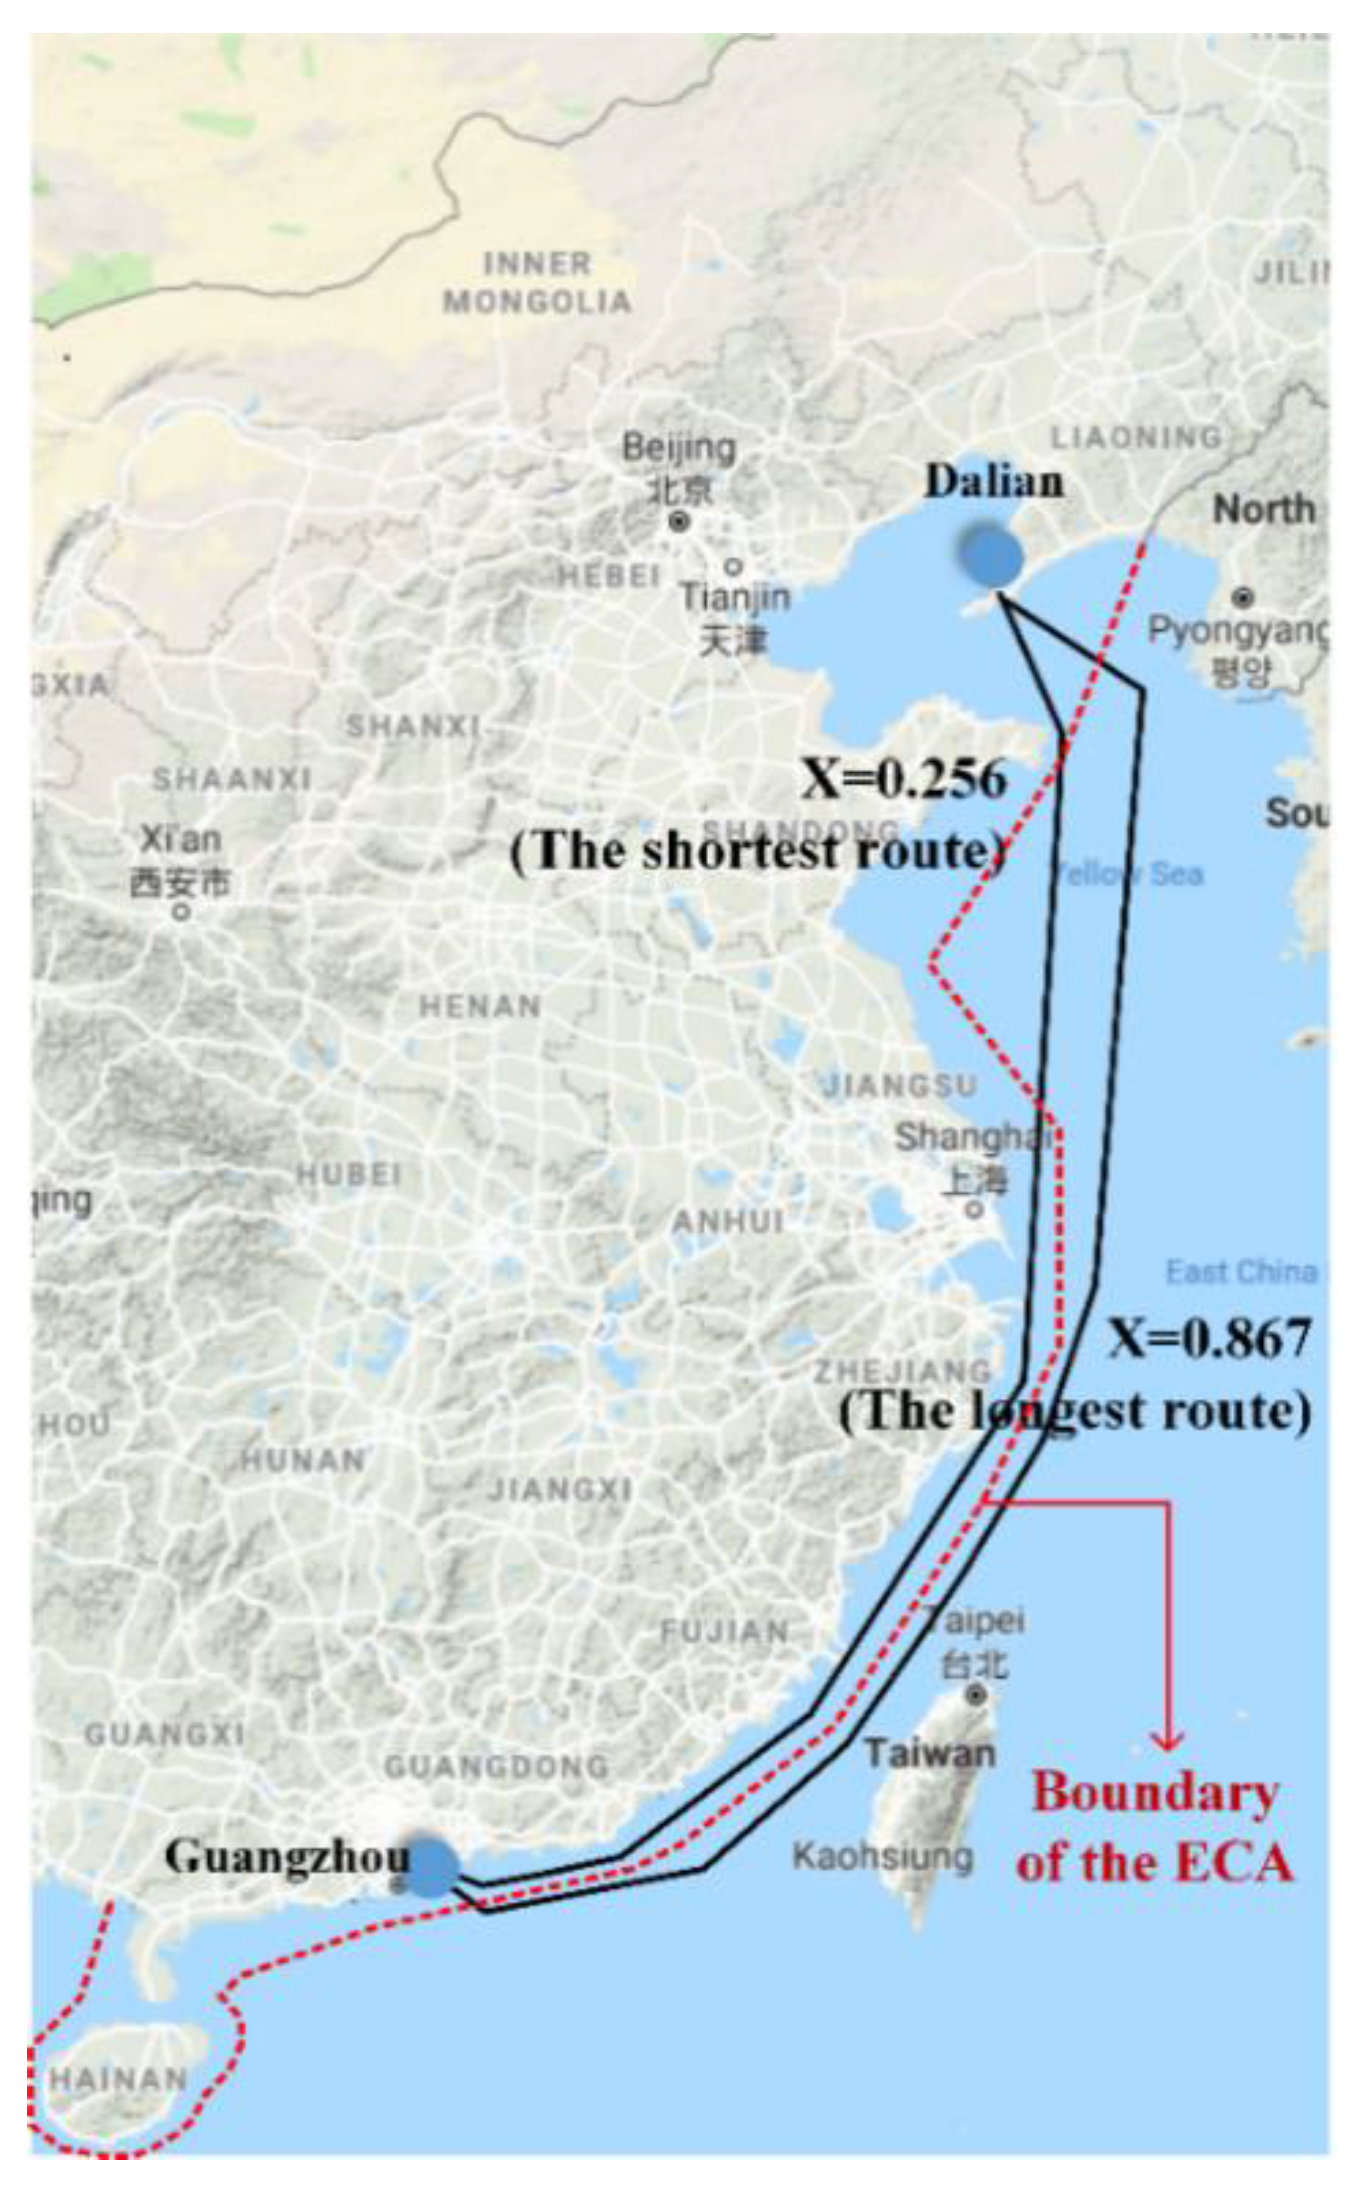
As of 1 January 2019, a coastal ECA extending 12 nautical miles from the baseline of Chinese territorial sea officially took effect. Any vessel sailing inside the ECA is required to use fuels with a sulfur content no greater than 0.5%. The new sulfur limit forced shipping companies to save costs by rerouting. As shown in
Figure 1, Trawind can select from 16 alternative routes, whose distance ratios (
X) vary from 0.256 to 0.867. The regression relationship between the total distance and the value of
X can be expressed as
L = 194.5
X + 1248.9 (
R2 = 0.9909).
4.2. Decisions Analysis
4.2.1. Speed Decisions
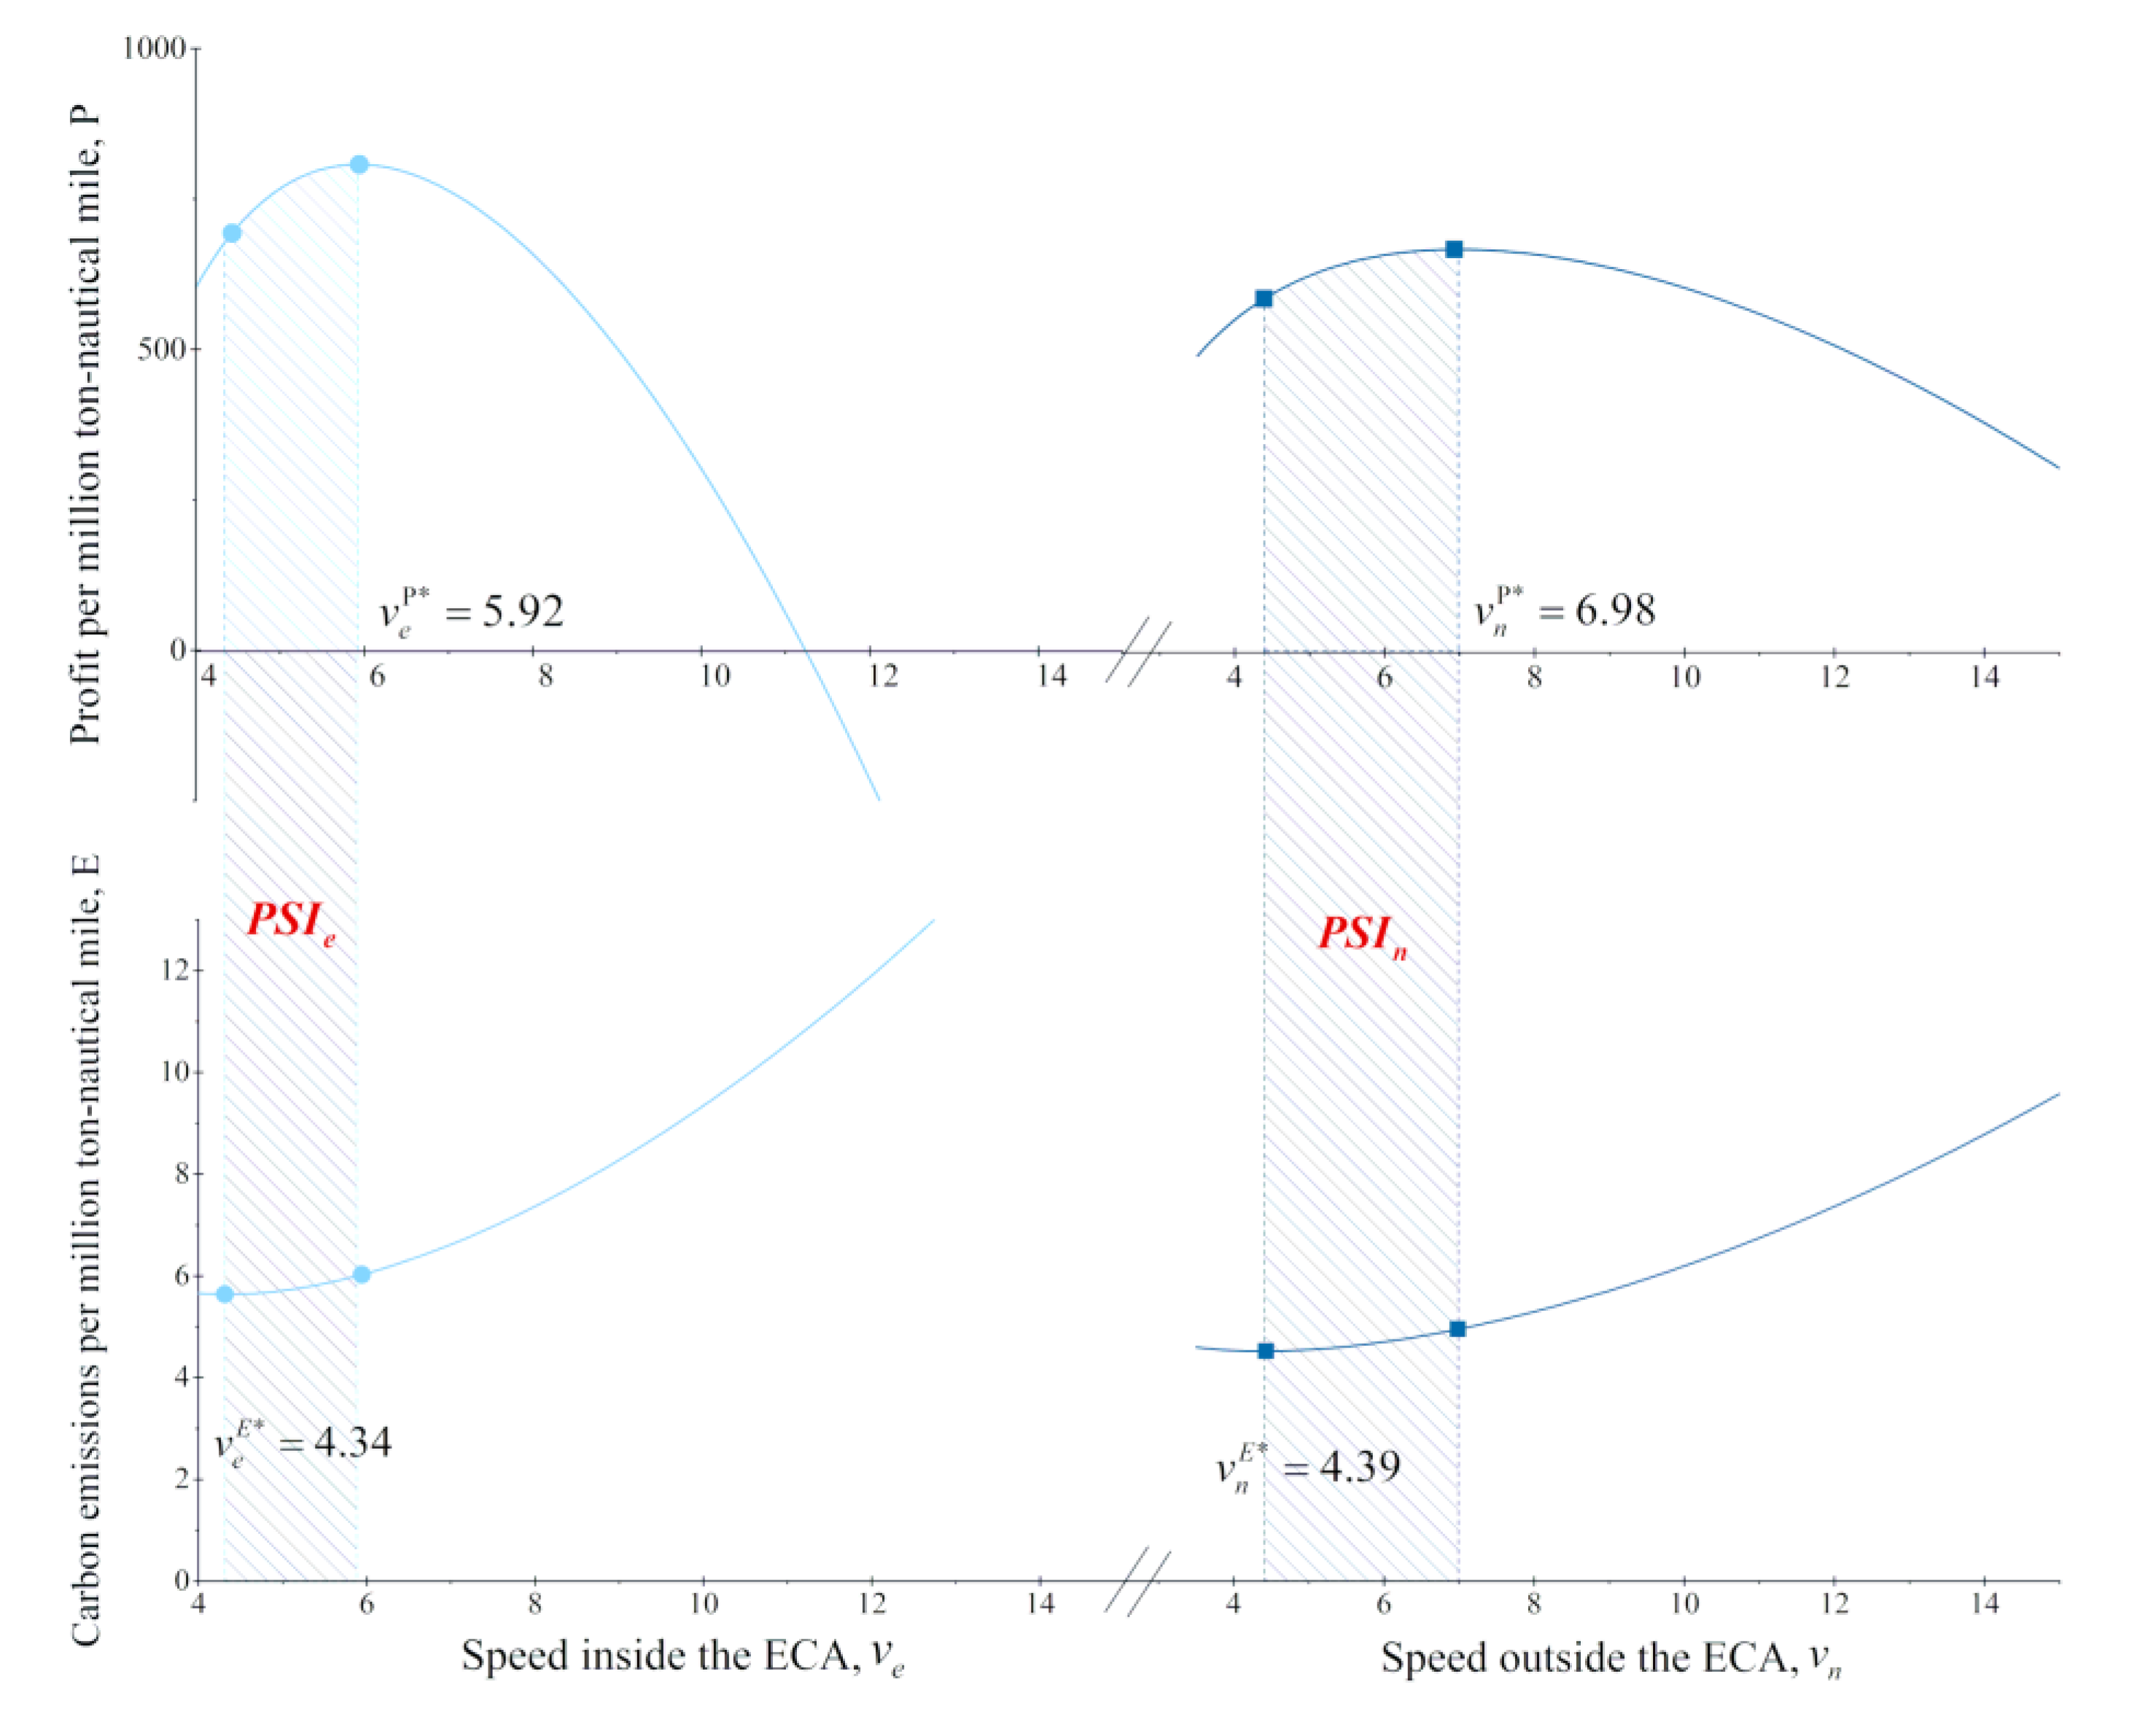
Figure 2 presents the effects of speed decisions on profit and carbon emissions per million ton-nautical-mile. The left part of the figure shows the variations in profit and carbon emissions with vessel speeds inside the ECA (
), when the speed outside the ECA (
) was fixed at 8 knots. The right part shows the variations in profit and carbon emissions with
, when
was fixed at 8 knots.
It can be seen that the profit and carbon emissions improved as the speed was reduced from the design speed (
V). Here, the maximal profit is regarded as the optimal profit, and the minimal carbon emissions as the optimal carbon emissions. Similarly, the speeds leading to the maximal profit and minimal carbon emissions are considered as the optimal speeds for profit and carbon emissions. Drawing on Ronen’s model [
26], the two optimal speeds can be determined as follows: setting
,
,
and
, and checking if the optimal speeds fall within allowed interval [
,
]. The formulations of the optimal speeds can be simplified as:
where
and
are the speeds inside and outside the ECA for the optimal profit (profit-optimum speeds), respectively; and
and
are the speeds inside and outside the ECA for the optimal carbon emissions, respectively (emissions-optimum speeds). According to Equations (18)–(21),
,
,
, and
are independent from
X. Thus, the interval for decision-making on speed has nothing to do with the choice of
X.
As indicated by
Figure 2, the profit decreased and the carbon emissions increased, after the vessel speed surpassed the profit-optimum speed, and before the vessel speed reached the emissions-optimum speed. Therefore, a Pareto distribution was obtained from the shaded interval between the two optimum speeds. This interval was called the Pareto speed interval (PSI). Thus, the PSIs inside and outside the ECA can be, respectively, defined as:
The values of and can be calculated by Equations (18)–(21). No matter which route is selected, the speed decisions must fall within the Pareto speed intervals; that is, and .
4.2.2. Route Decisions
This subsection aims to examine the effects of
X on the two objectives; namely, the optimal profit and the optimal carbon emissions. As mentioned in the preceding subsection, the speed decisions should be made before route decisions, and the optimal speeds should fall within the Pareto intervals. To clarify the relationship between
X and the two objectives, it is necessary to verify whether the relationship varies with the speed decisions. Therefore, six alternatives of speed decisions were designed and tested, including
= 5.92 and
= 6.98;
= 5.90 and
= 6.60;
= 5.50 and
= 6.60;
= 4.50 and
= 4.55;
= 4.40 and
= 4.45; and
= 4.34 and
= 4.39.
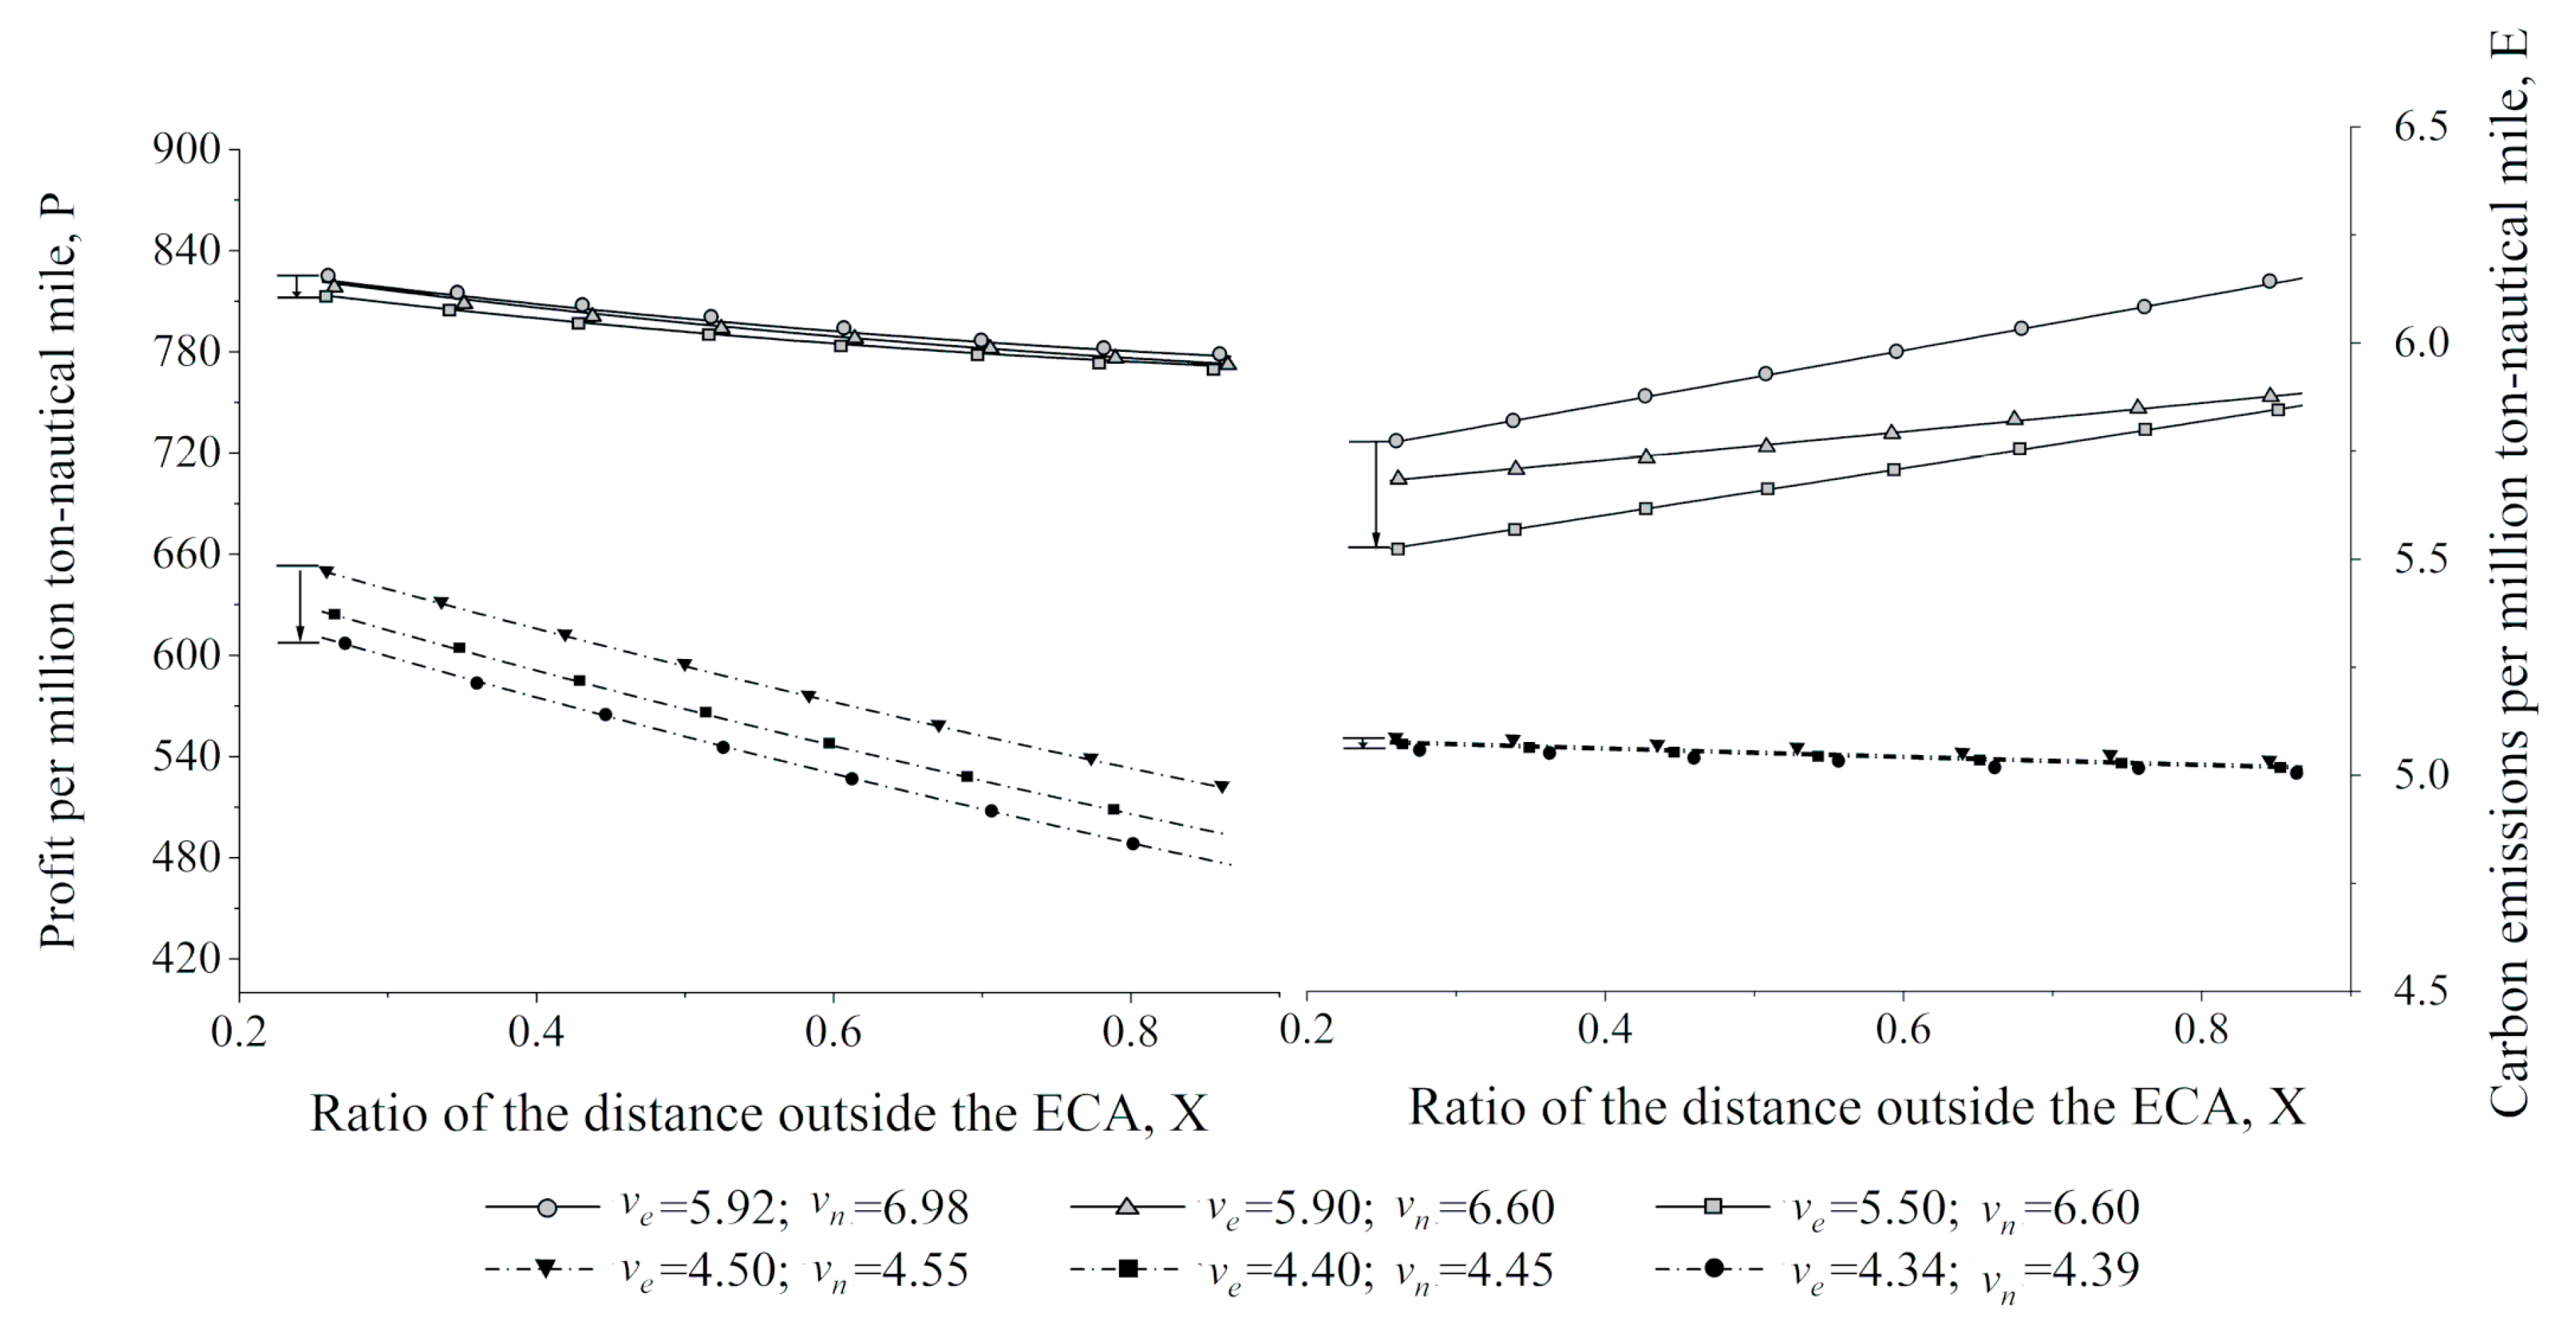
Figure 3 displays how profit and carbon emissions per million ton-nautical-mile vary with route decisions (i.e., the distance ratio
X) under the six alternatives of speed decisions.
It turns out that the value of
X should be determined based on the speed decisions and the specific objective. According to the lines in the upper part of
Figure 3, when the vessel speed was the profit-optimum speed (
= 5.92 and
= 6.98) or close to that speed (
= 5.90 and
= 6.60;
= 5.50 and
= 6.60), the profit declined as
X increased from 0.256 to 0.867, while the carbon emissions increased linearly with the growth in
X. Obviously, the operator should choose
X = 0.256 if the speed was or close to the profit-optimum speed. The lines in the lower part shows that, when the vessel speed was the emissions-optimum speed (
= 4.34 and
= 4.39) or close to that speed (
= 4.50 and
= 4.55;
= 4.40 and
= 4.45), both profit and carbon emissions decreased with the growth in
X. In this case, it is hard to make the decision about
X. But, under these speed decisions, the operator can minimize the carbon emissions by setting
X as 0.867.
As shown in
Figure 3, both profit and carbon emissions will decrease if the operator slows down the vessel, revealing that speed reduction, also known as slow steaming, suppresses carbon emissions. It can also be observed that, if the vessel runs close to the profit-optimum speed, the speed reduction will have a greater suppression on carbon emissions and the profit decrease will not be obvious. However, if the operator blindly pursues carbon emissions through slow steaming, a fraction of carbon emissions will be reduced at the cost of a huge amount of profit.
4.2.3. Tradeoff between Profit and Carbon Emissions
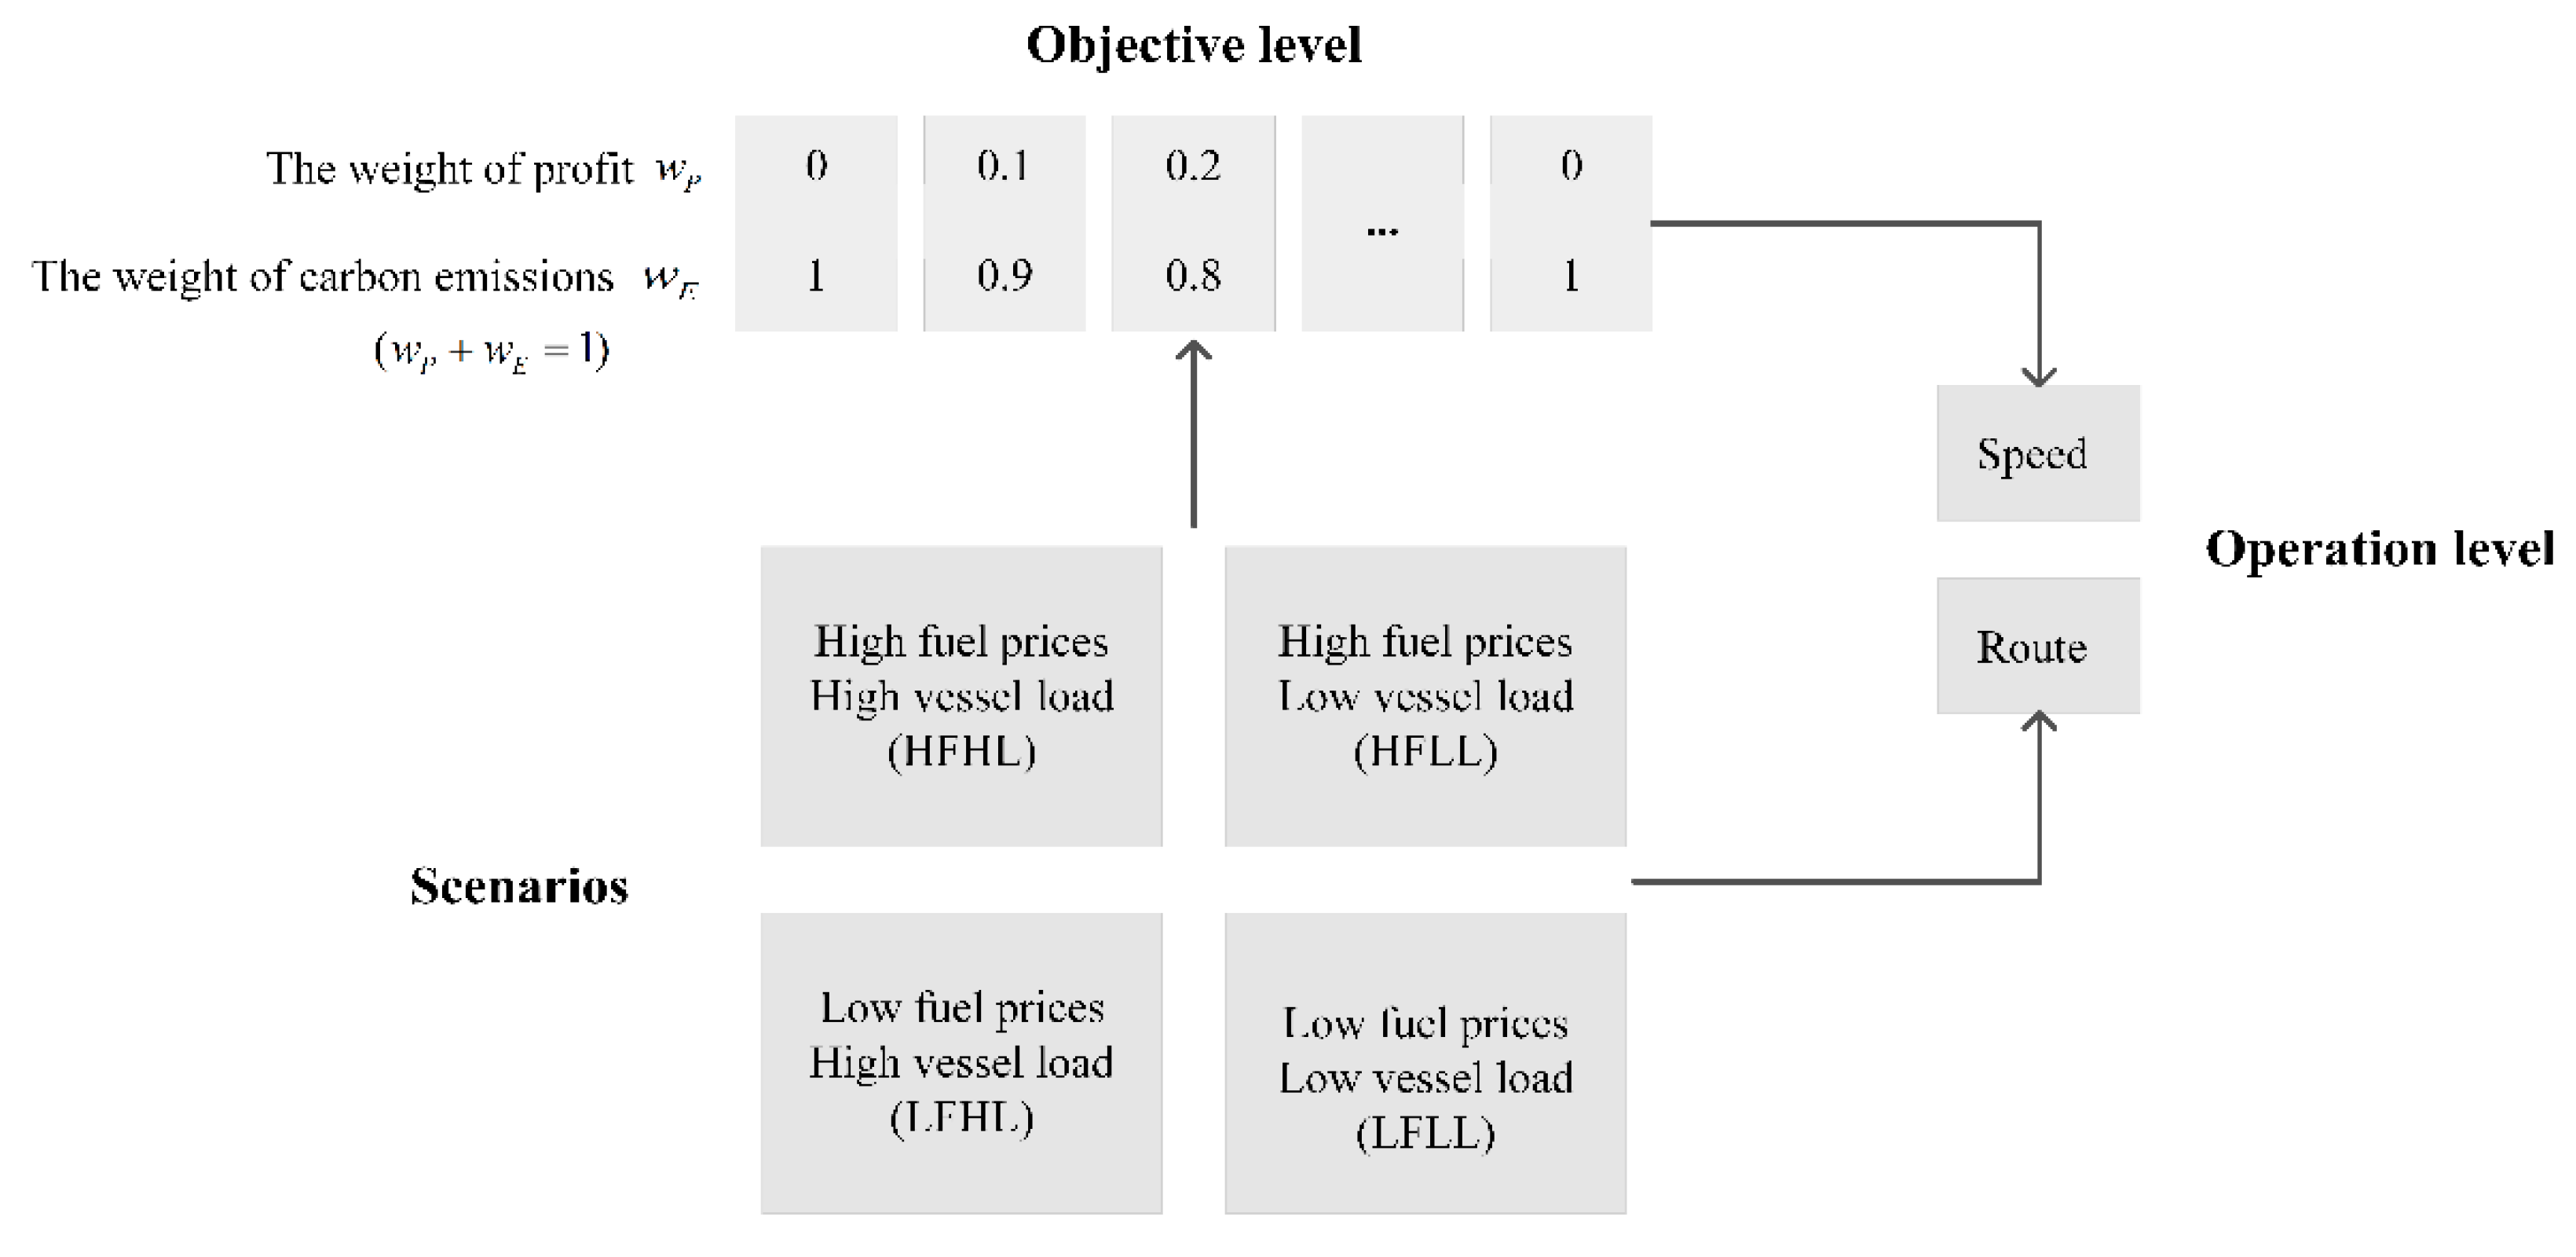
The optimal profits and carbon emissions were examined under different objectives and scenarios (
Figure 4). Since China designated its ECA in 2015, the HFO price and MGO price soared from 181 and 476 USD/ton to 542 and 886 USD/ton, respectively [
52]. Concerns have arisen about whether the fuel prices will continue to inflate with the issuance of even stricter environmental regulations and the incoming 0.5% global sulfur cap, which may stimulate the demand for low-sulfur fuels. However, some experts argued that the fuel prices will gradually decrease, thanks to the improvement of oil refining technology.
The related studies have shown that fuel price and load-capacity ratio of the vessel (vessel load) directly relate to profit and bunker consumption [
53,
54]. Following this train of thought, four scenarios were designed based on actual fuel prices and vessel loads, with the vessel load ranging between 48% and 100% [
55]. The literature has shown that operators pay different levels of attention to carbon emissions, contingent on the firm size, the economic environment, and regulations [
19]. As shown in
Figure 4, different weights were selected from [0, 1] and assigned to the profit and carbon emissions, resulting in 10 different tradeoffs between profit and carbon emissions.
The optimal profit and carbon emissions were determined by the weighted comprehensive criterion method (WCCM) [
56]. This method can normalize profit and emissions on different scales. The normalized profit and carbon emissions can be respectively expressed as:
where
is the original profit;
is the maximal profit;
is the original carbon emission value;
is the minimal carbon emission value;
is the decrement from the maximal profit;
is the increment from the minimal carbon emissions. Obviously, the profit is negatively correlated with
, and carbon emissions are positively correlated with
.
Thus, the bi-objective optimization was transformed into a single-objective problem:
where
and
are the weighting coefficients of the two objectives; namely, profit and carbon emissions (
and
).
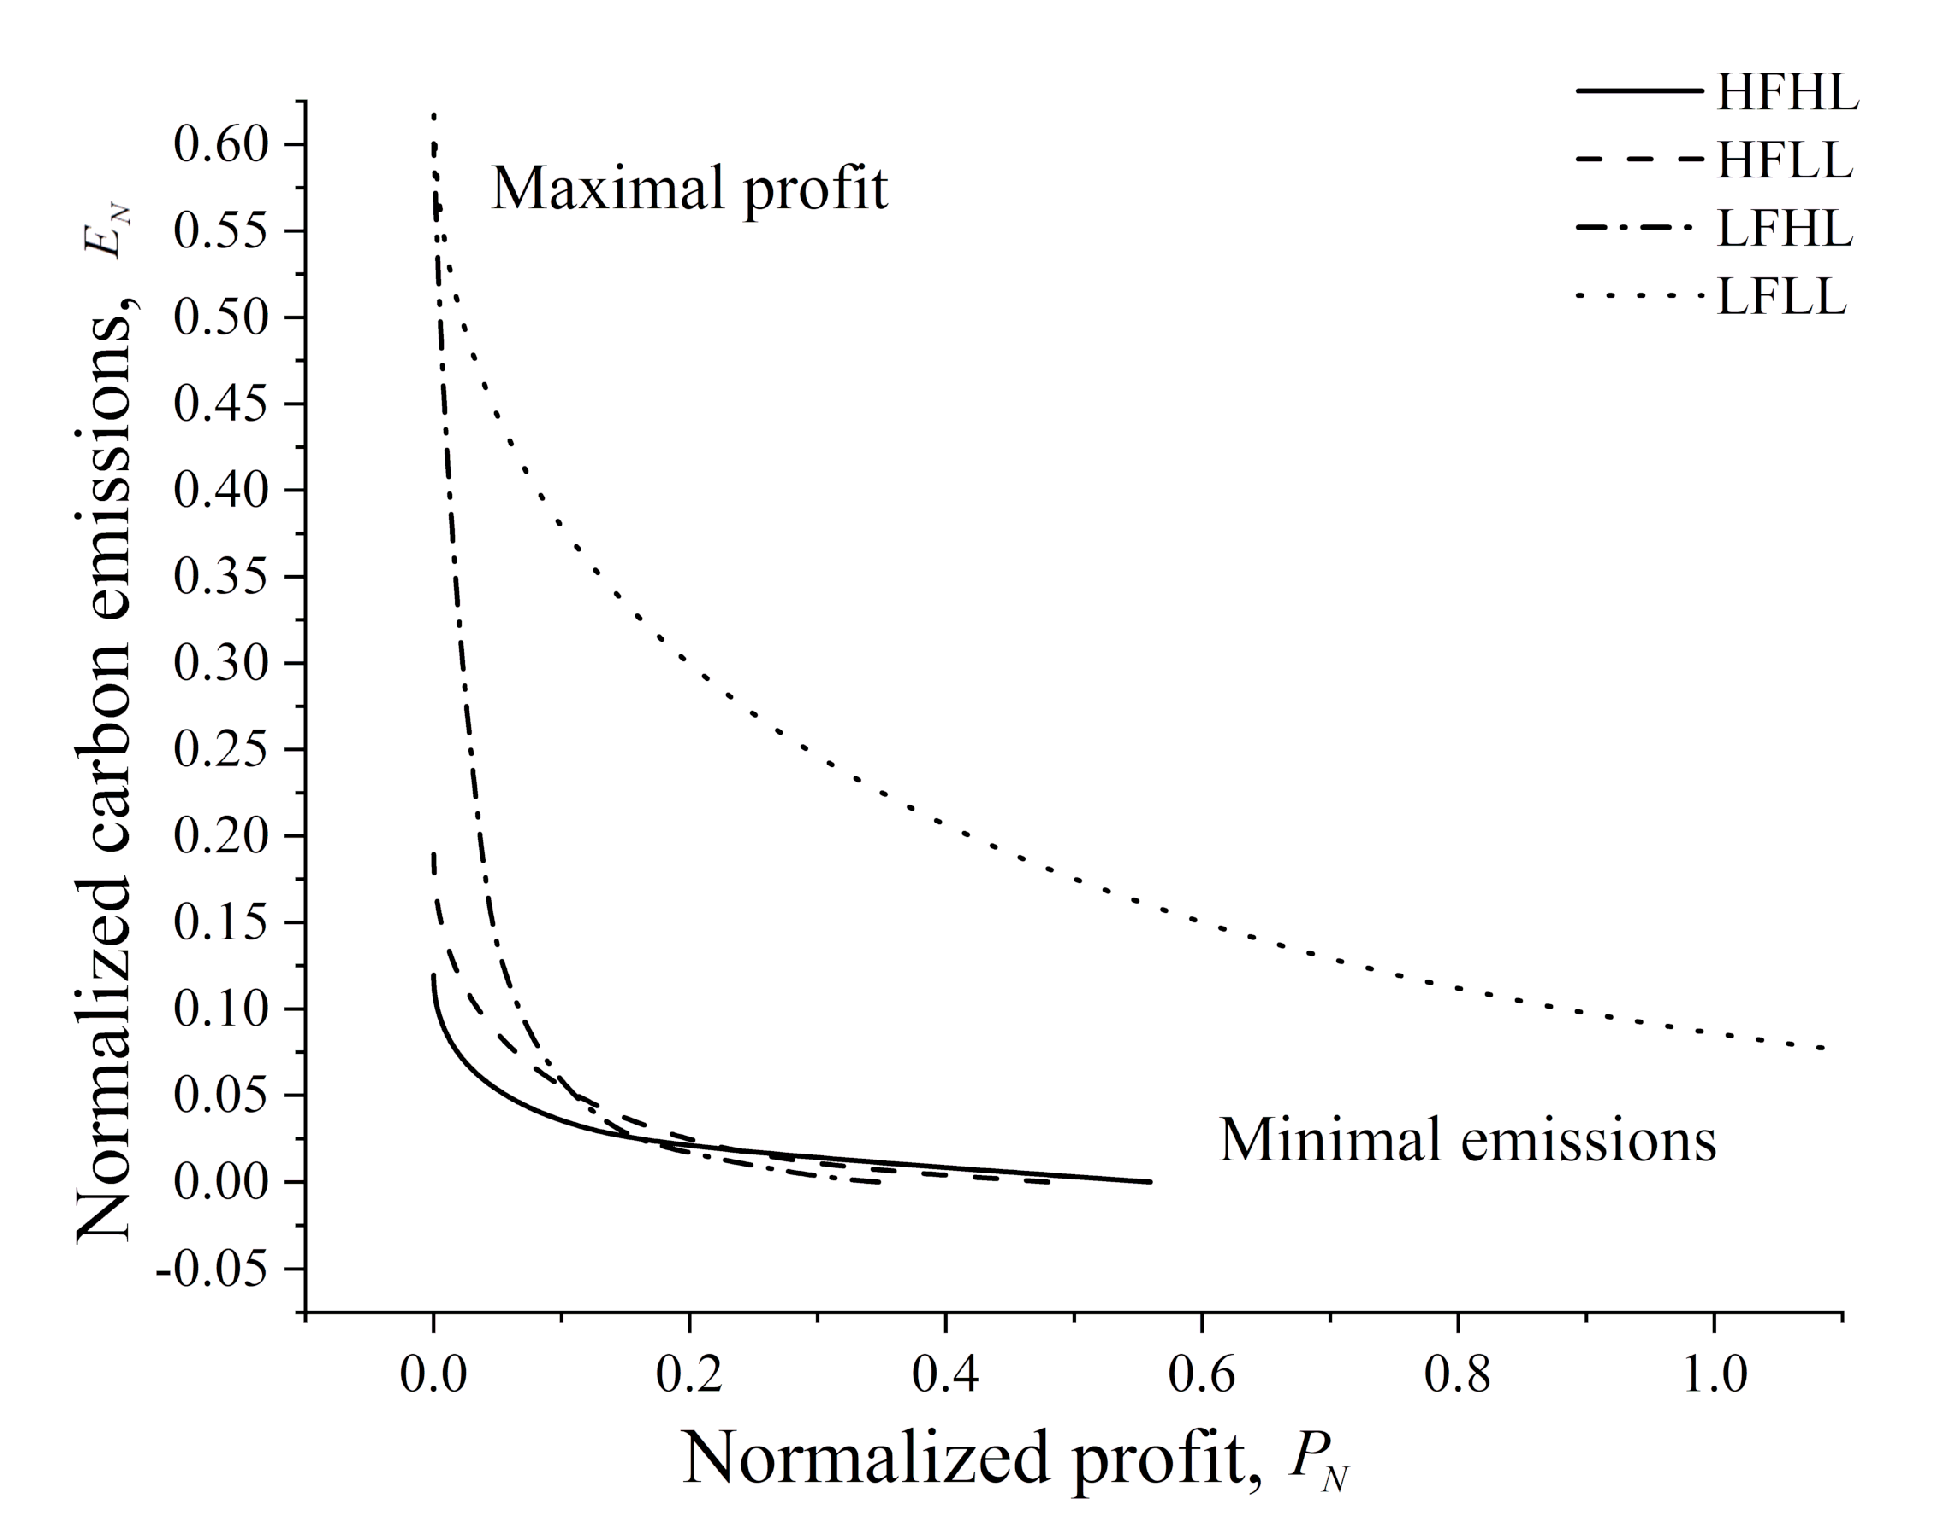
The Pareto frontiers in
Figure 5 visualize the tradeoffs between
and
in different scenarios. The area above each frontier line represents the possible values of
and
. Of course, the operator decisions only correspond to the points on the frontier lines. It can be seen that carbon emissions surged up at the maximal profit, while the profit dropped rapidly at the minimal carbon emissions. The operator needs to strike a balance between the two conflicting objectives.
4.3. Results and Analysis
4.3.1. Results on Normalized Profit and Carbon Emissions
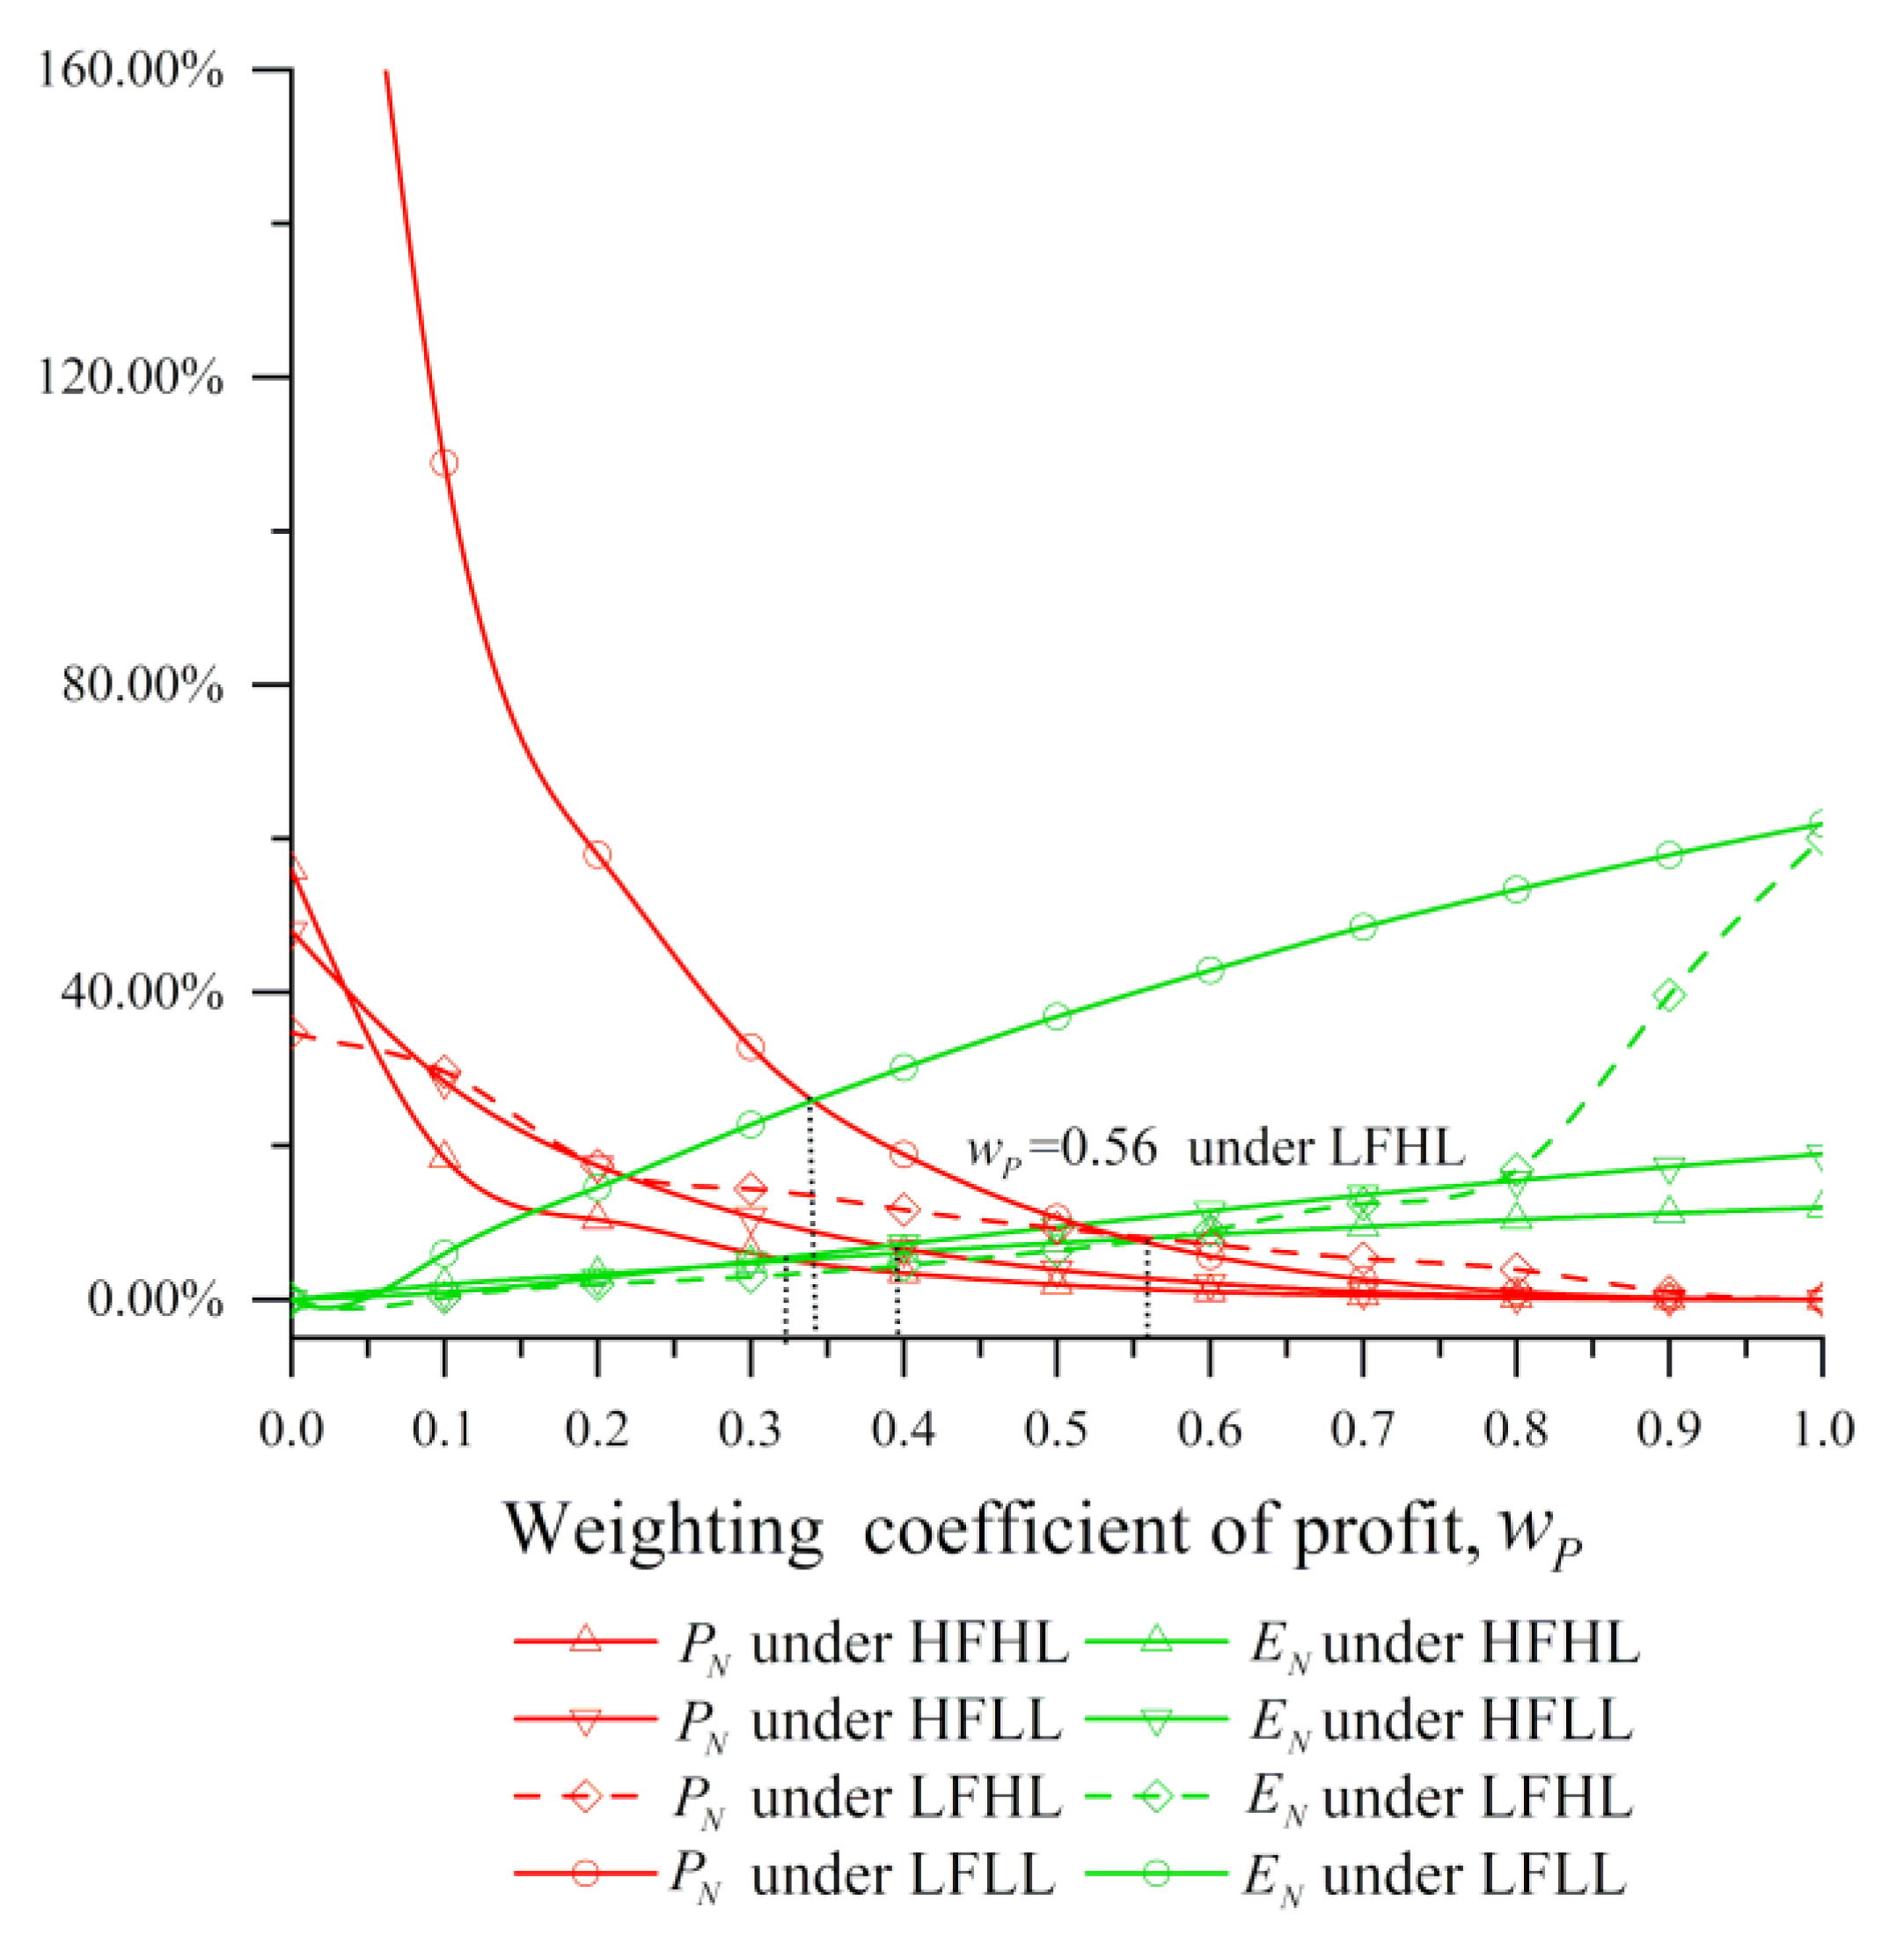
Figure 6 displays the variations in
and
with the weighting coefficients of profit
under different scenarios. As shown in the figure, the value of
decreased with the growth in
, while the value of
exhibited an increasing trend. Both
and
were at a good level at the intersection of the two curves (
=
), which represents the most balanced tradeoff. The following results can be derived from the observations:
Results 1. The operator should select the corresponding to = , which can be identified easily at the intersection of the two curves. Note that the value is suggested rather than optimal, because the operator can still weigh between the two objectives at their discretion.
Results 2. The
corresponding to the most balanced tradeoff was smaller than 0.5 in all scenarios except the LFHL (
Figure 6). To strike a balance between profit and carbon emissions, the operator may need to increase the value of
, i.e., focus more on profit, under the LFHL scenario.
Facing a high fuel price or low vessel load (e.g., under HFHL, HFLL, and LFLL), the operator may find it hard to make much profit (i.e., these scenarios are profit inefficient), and would rather devote more effort to reducing carbon emissions. If the operator still pursues profit under these profit inefficient scenarios, the carbon emissions will increase, which goes against the philosophy of sustainable operation. By contrast, if it is easy to make profit (e.g., under the profit efficient scenario of LFHL), the operator will pay more attention to profit-making, which verifies Result 2.
4.3.2. Results on Profit and Carbon Emissions
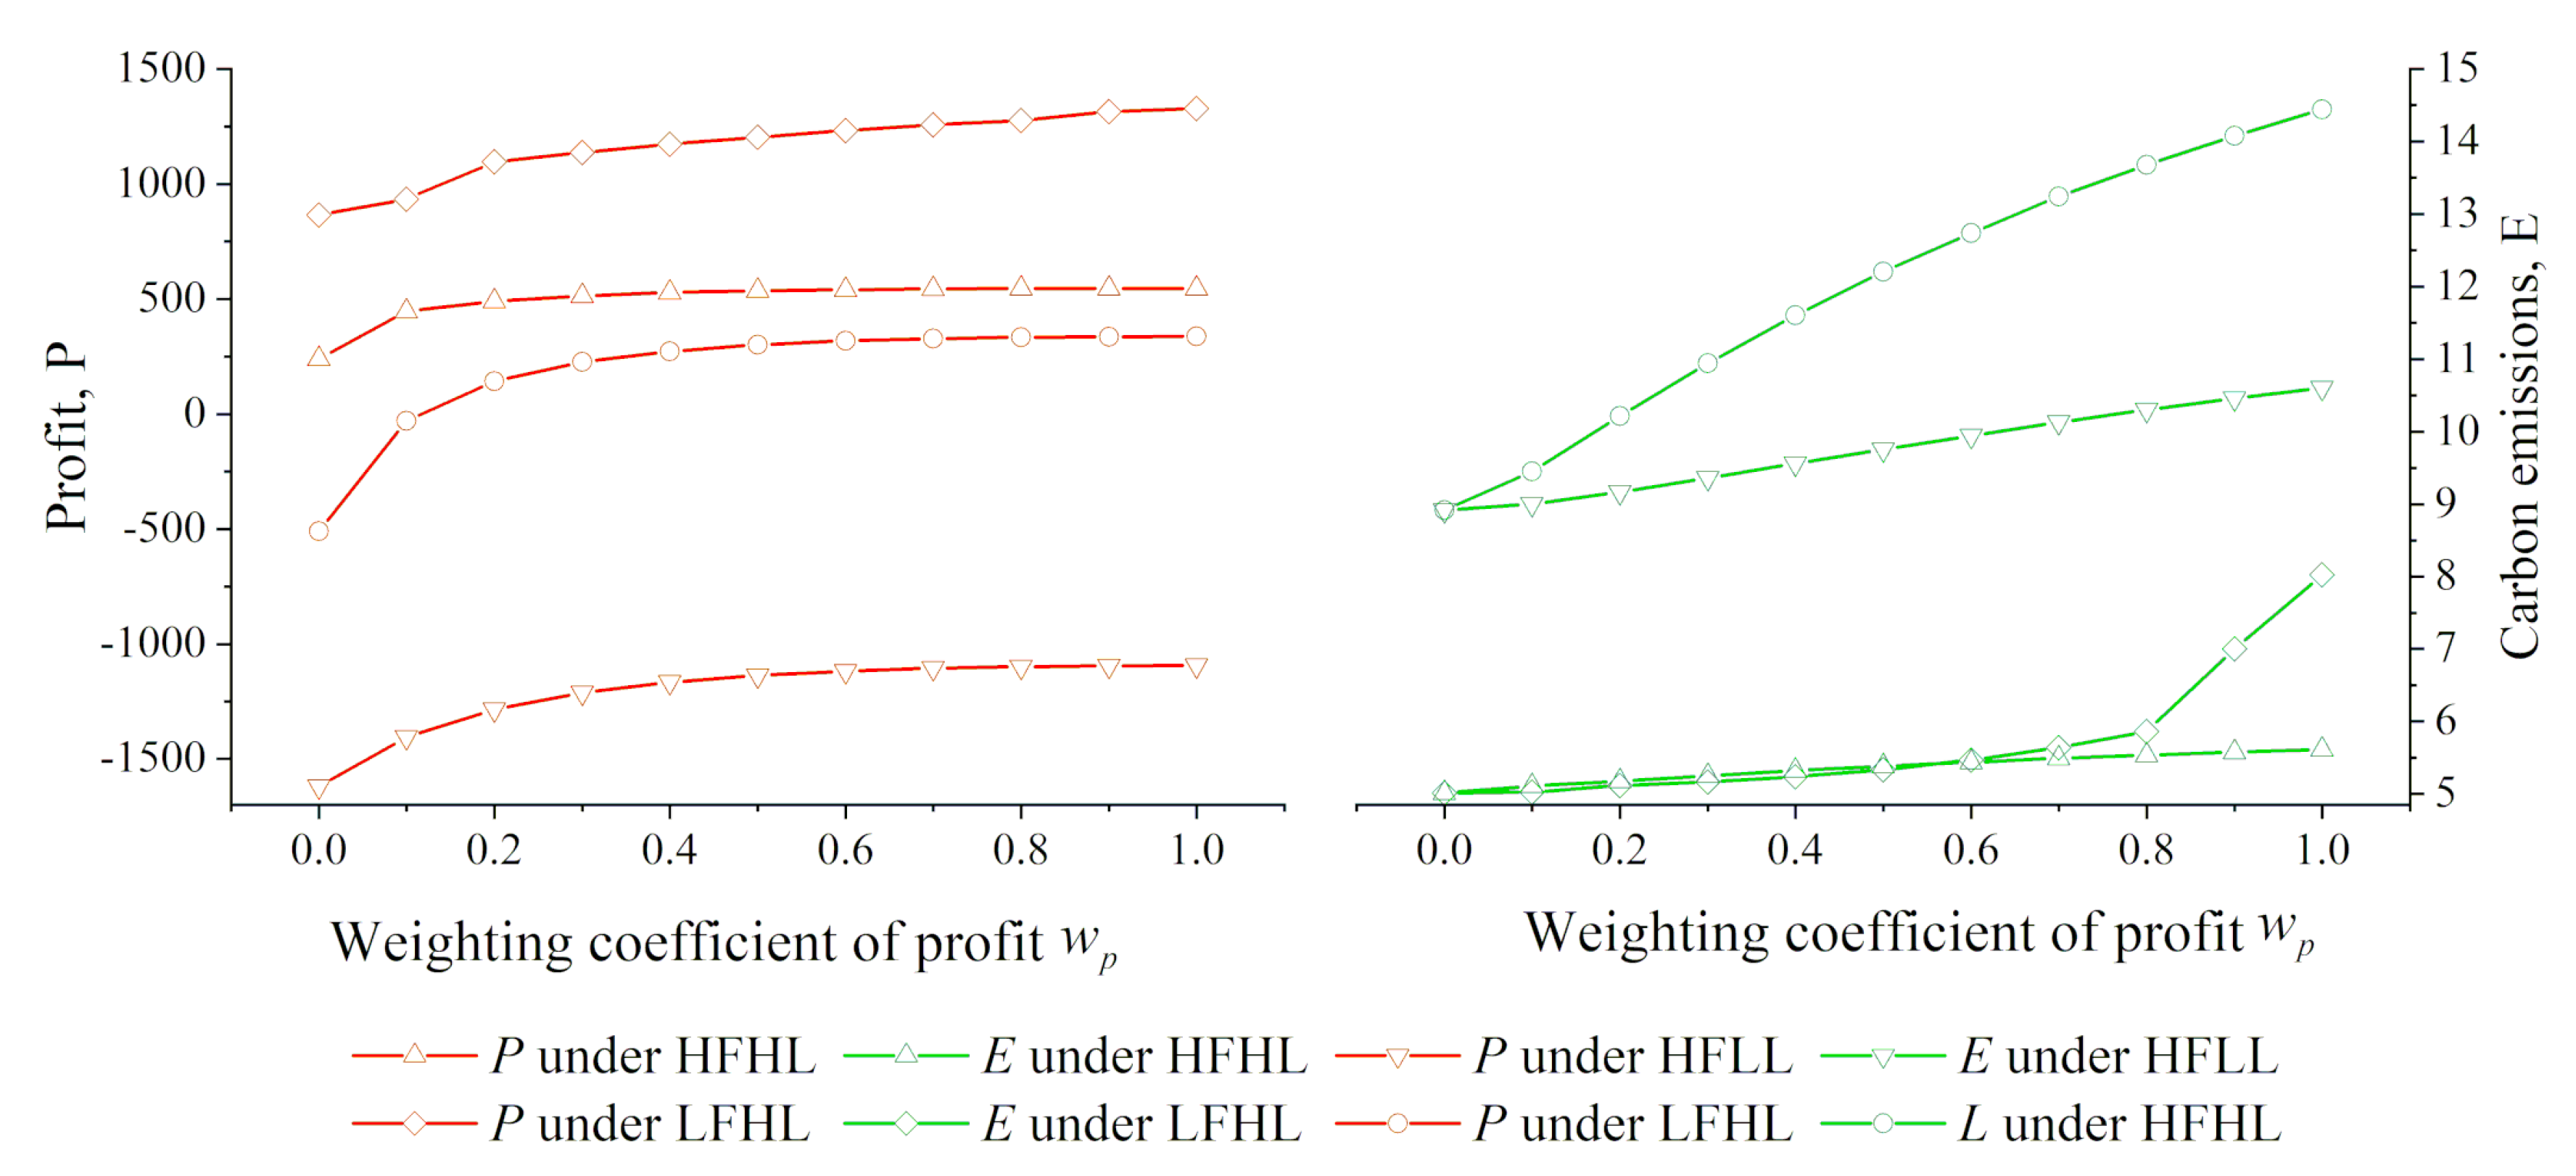
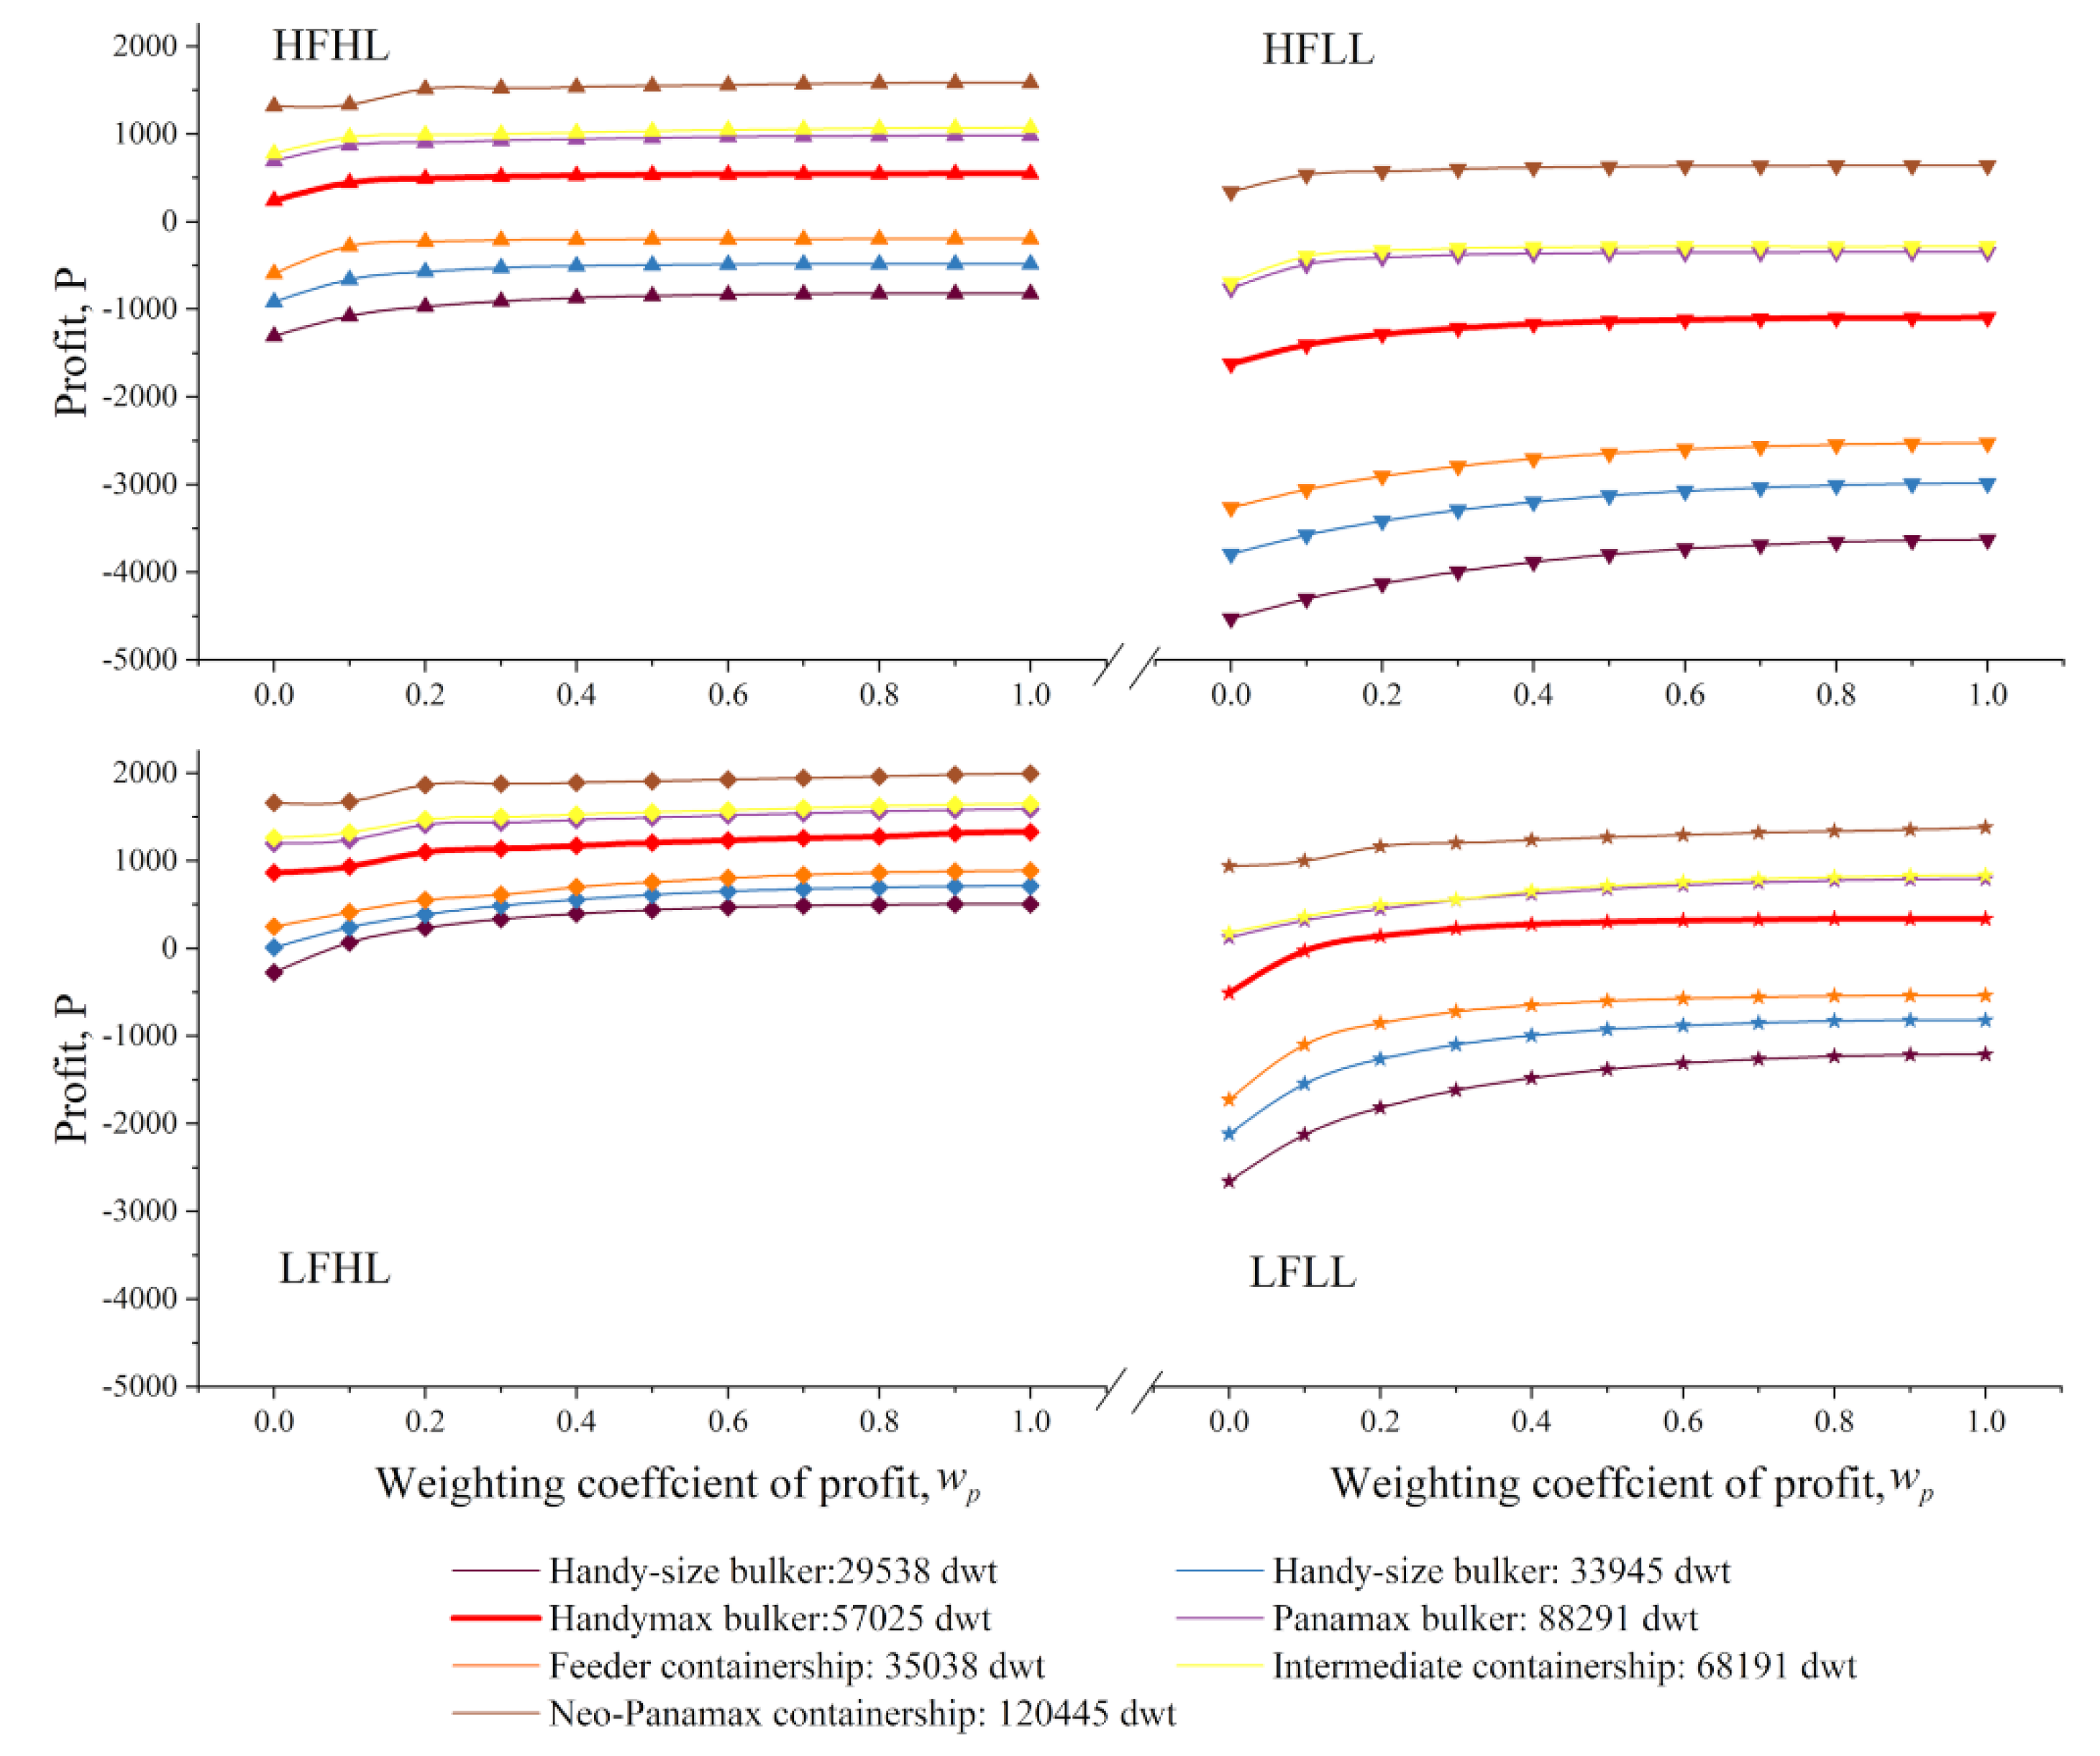
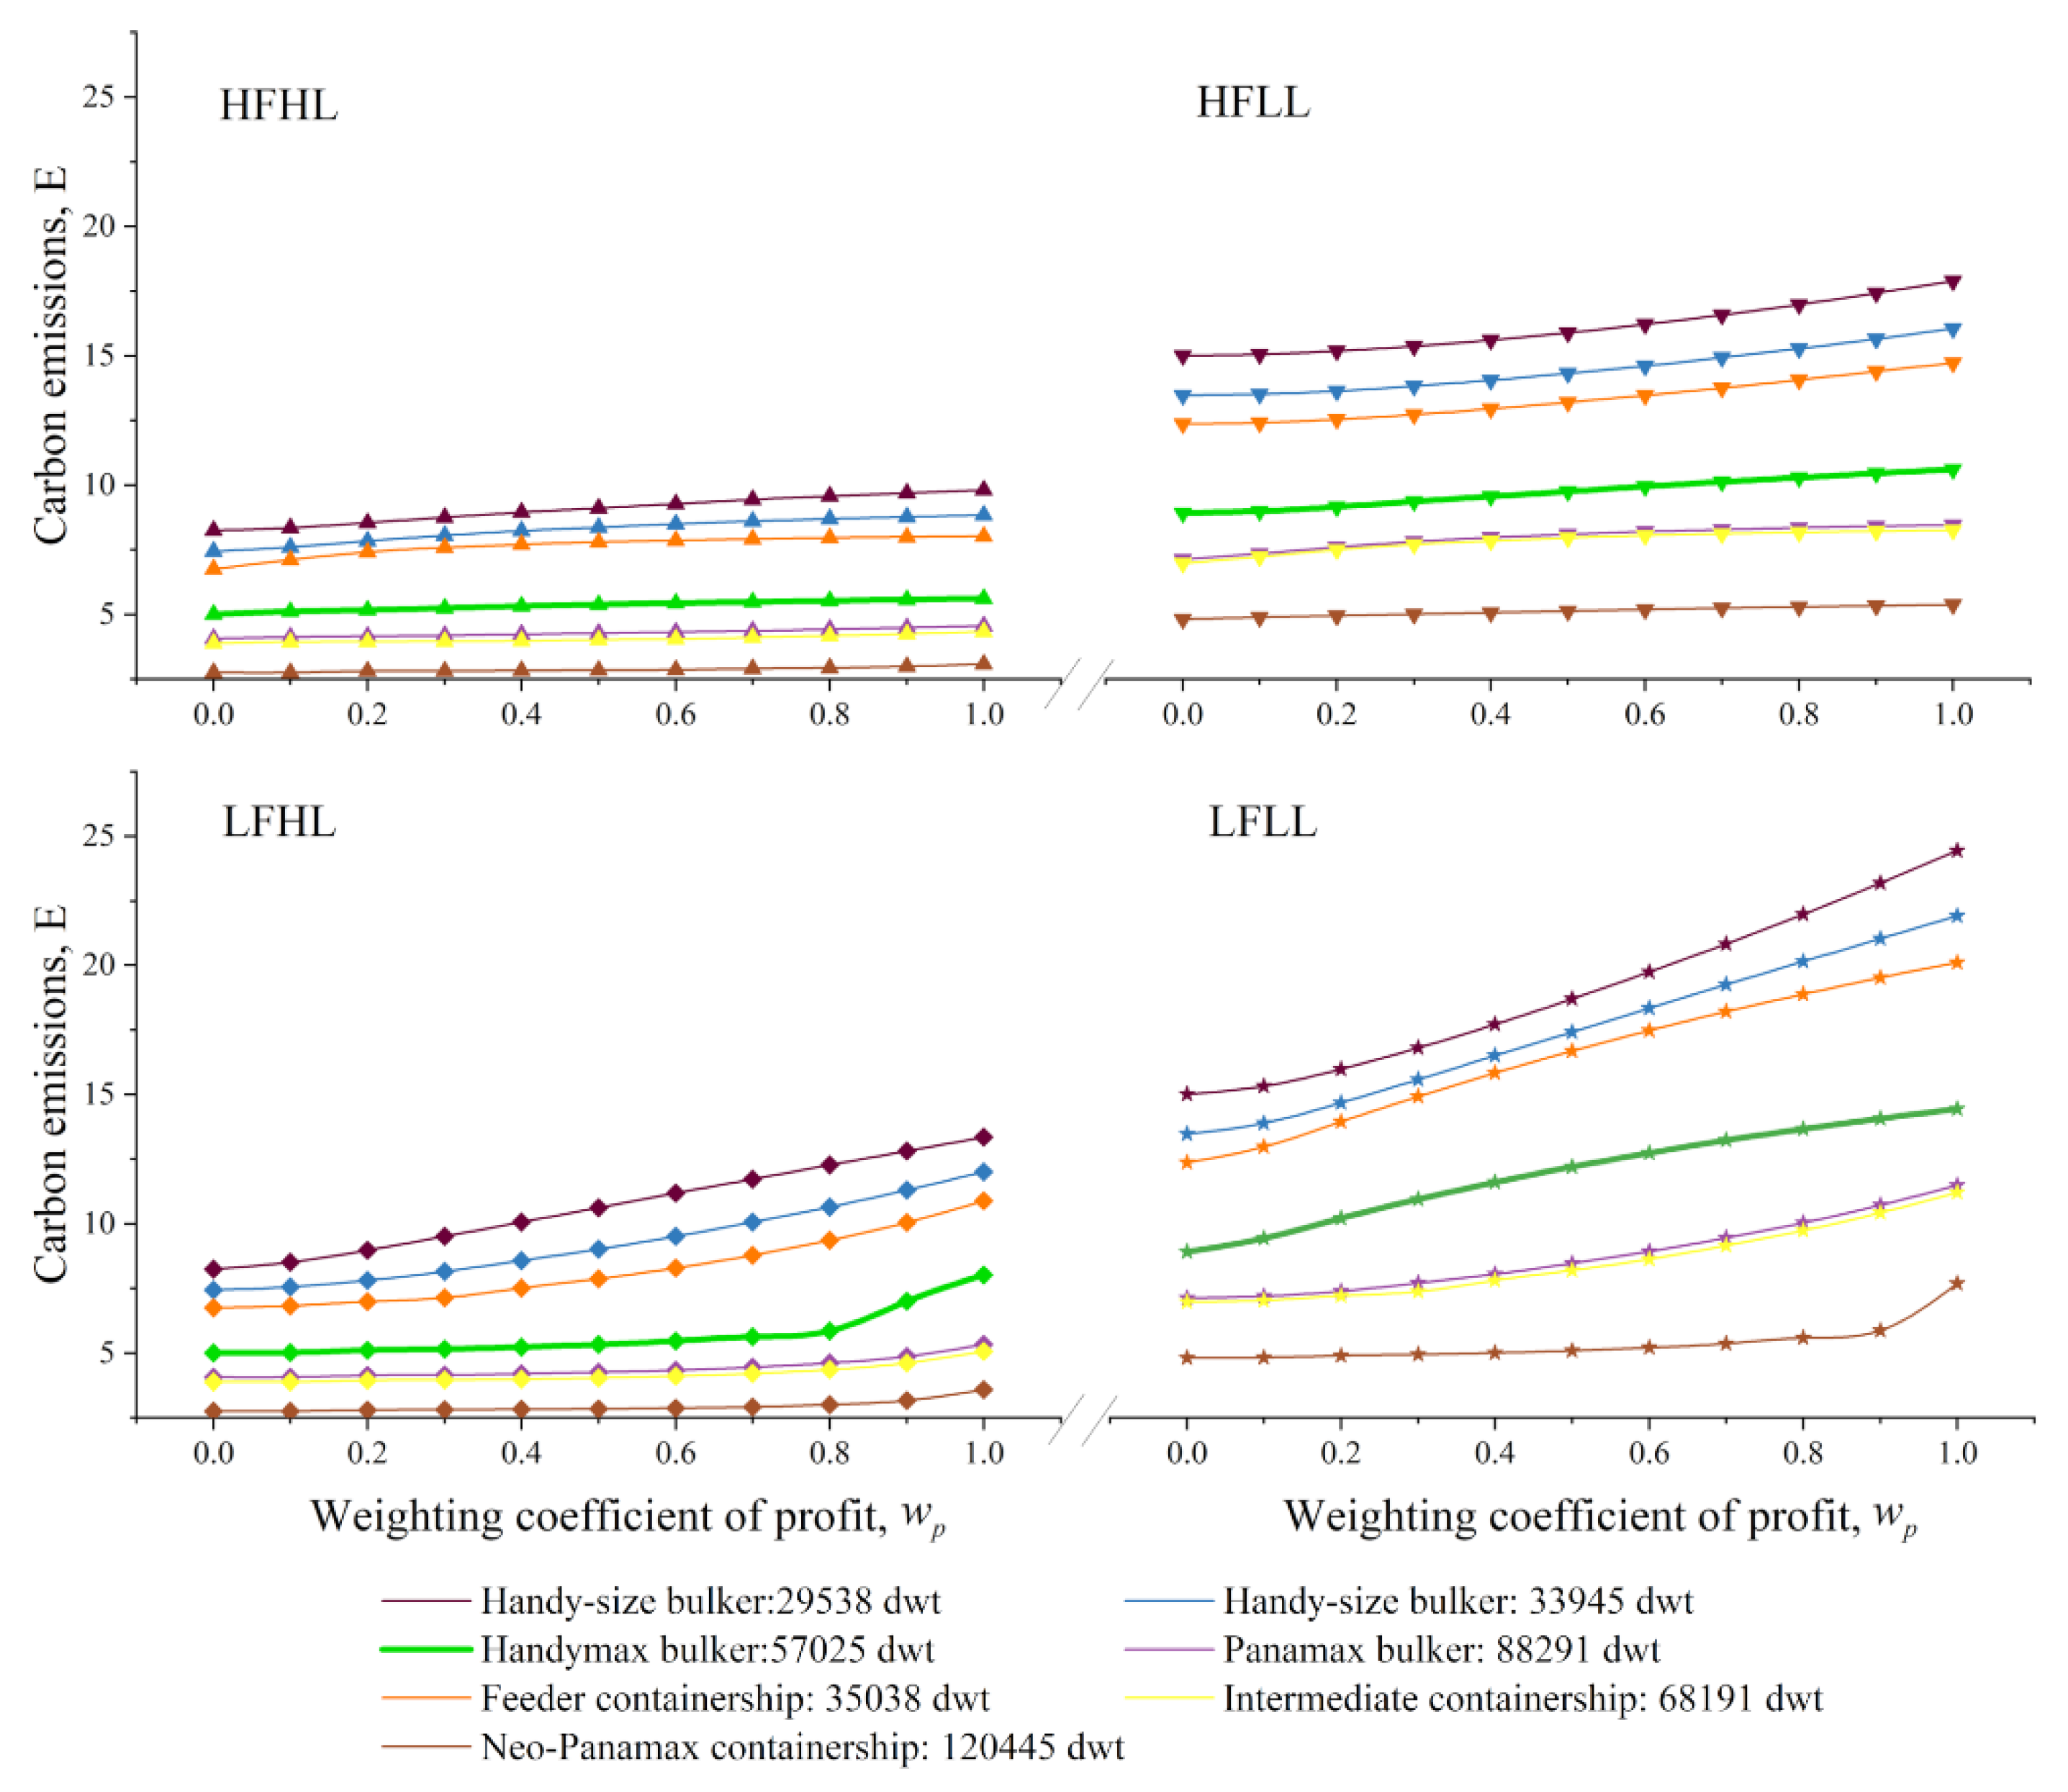
Figure 7 illustrates how profit (
P) and carbon emissions (
E) vary with different scenarios, respectively. It can be seen that both
P and
E increased with
. The effects of vessel load (Result 3) were derived by comparing HLs and LLs, while the effects of fuel price (Result 4) were determined by comparing HFs and LFs.
Result 3. With the growth in vessel load (i.e., from HFLL to HFHL, or from LFLL to LFHL), P increased and E declined, indicating that a high vessel load benefits the economy and the environment.
Result 4. The decrease of fuel price (i.e., from HFHL to LFHL, or from HFLL to LFLL) led to significant growth of P and a slight increase in E with high values, but had no impact on E with low values.
4.3.3. Decisions under Different Scenarios
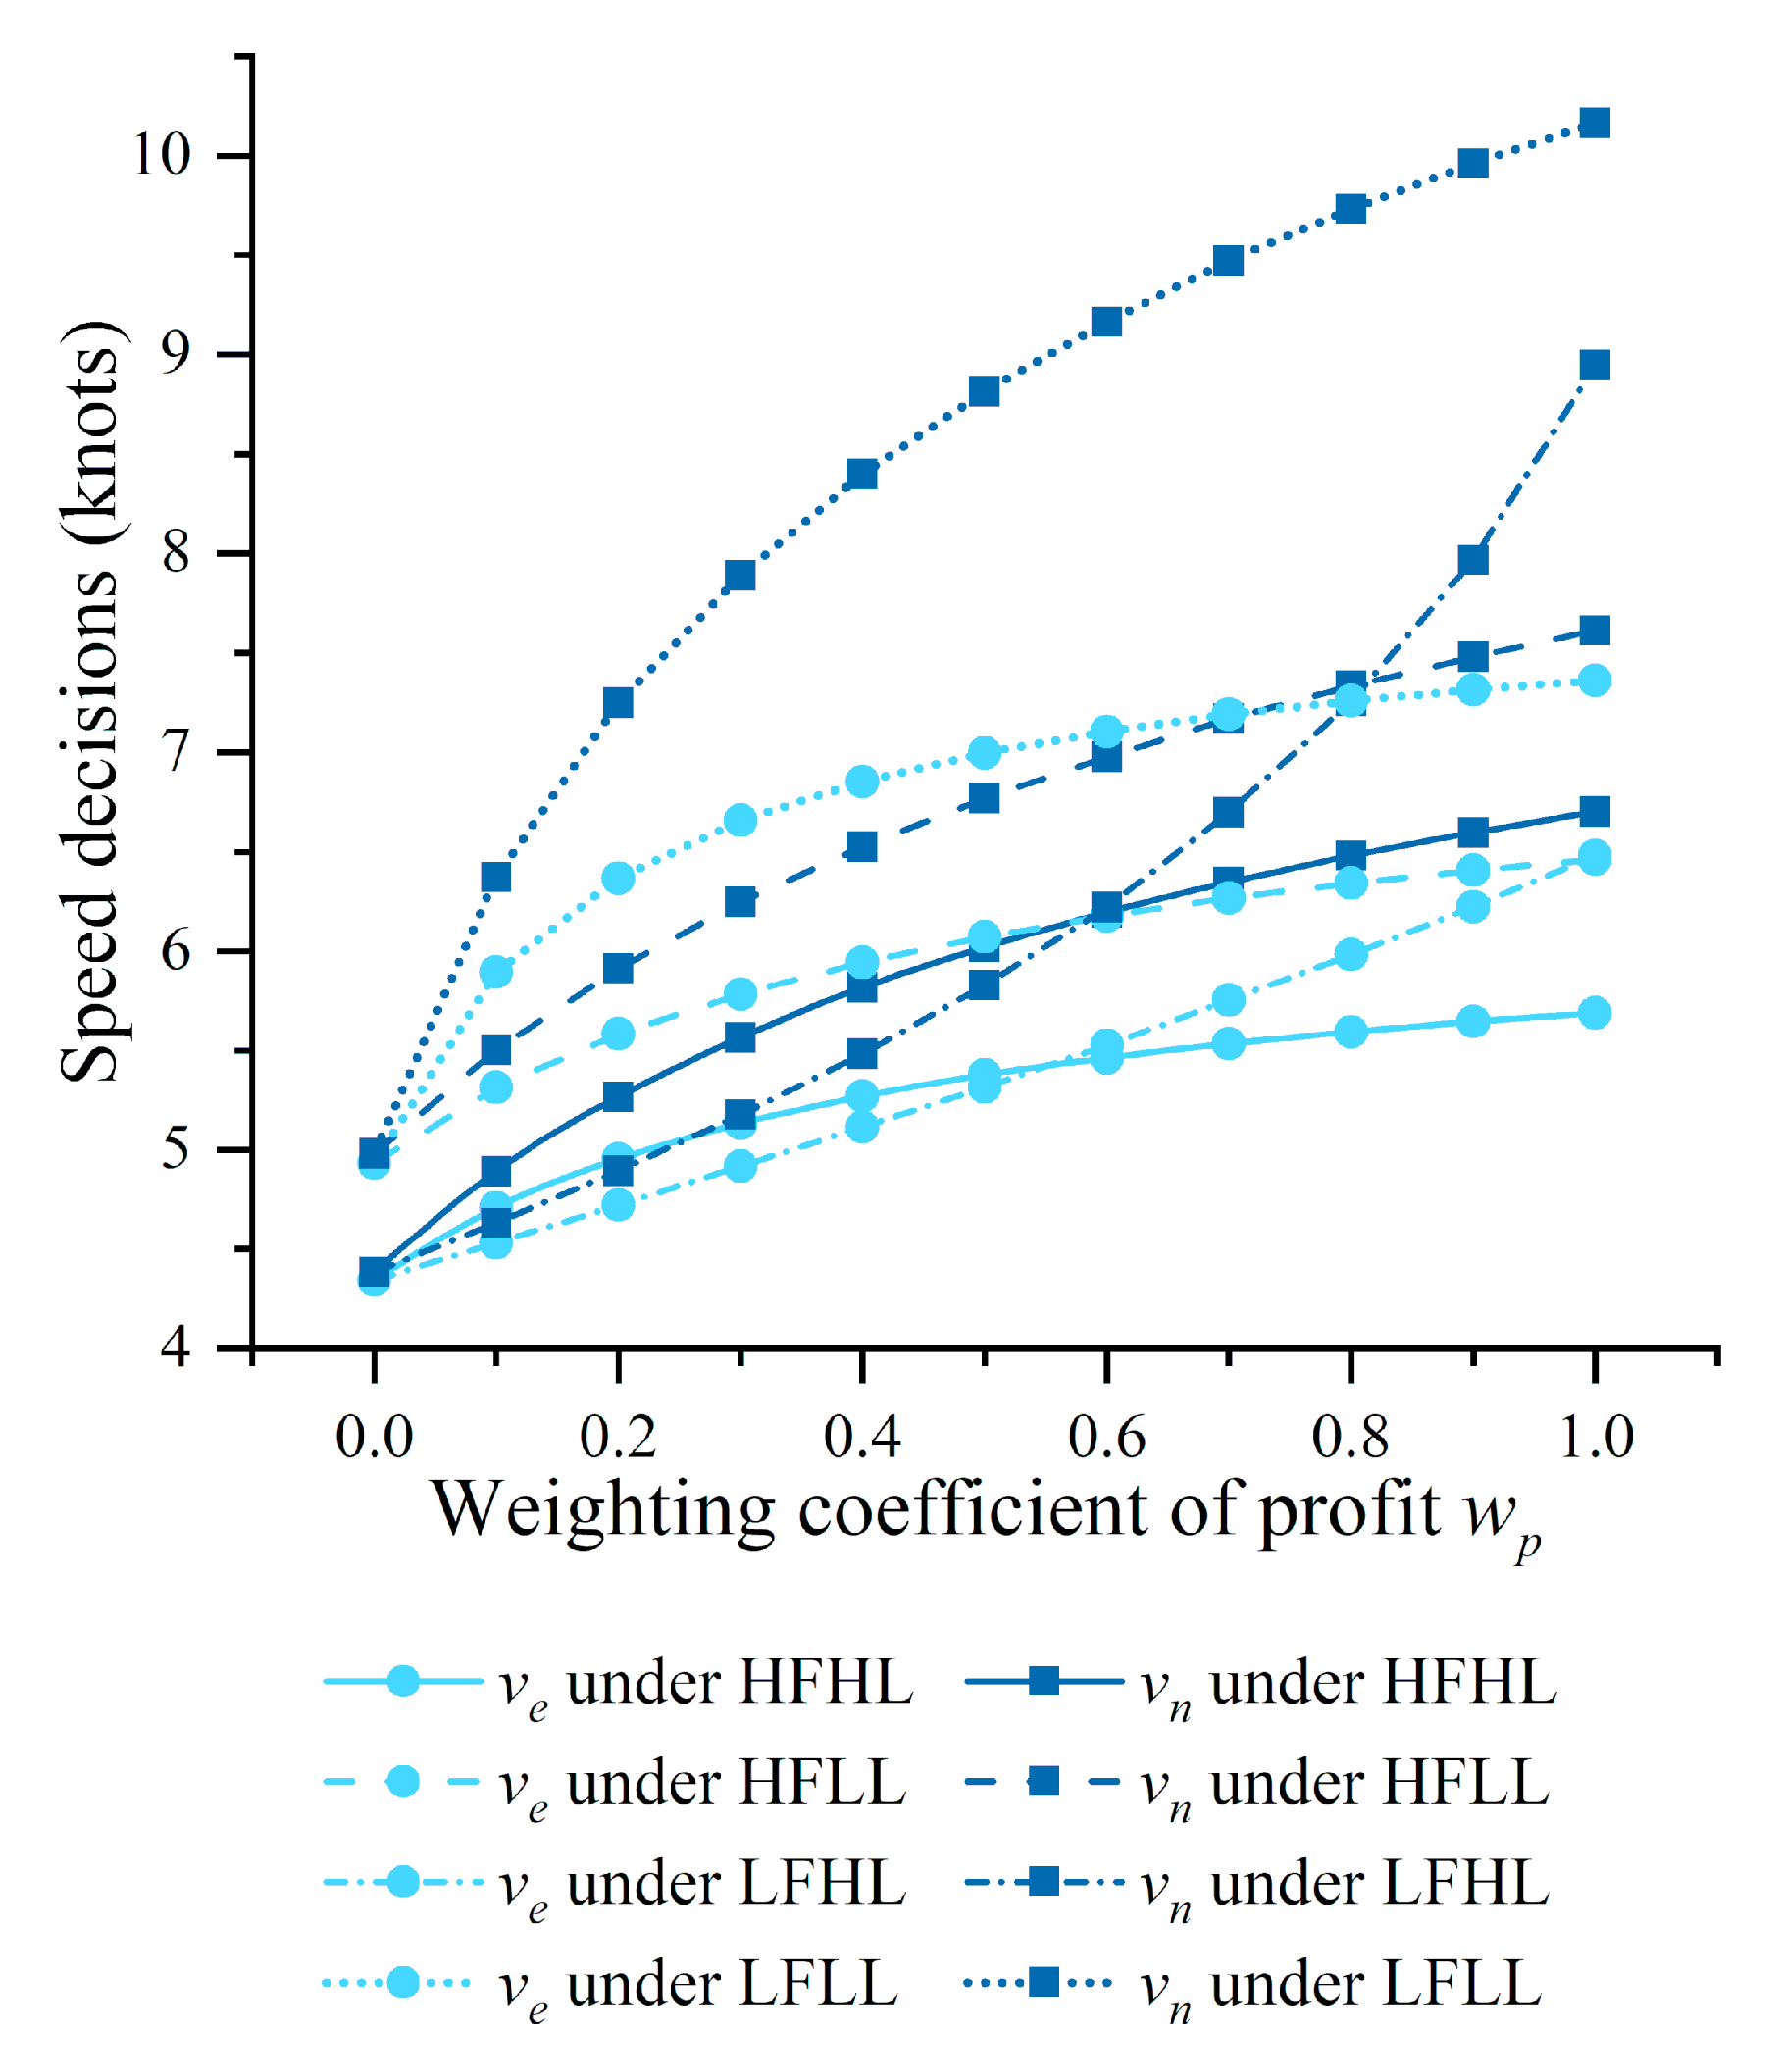
Figure 8 illustrates how the decision of
and the decision of
vary with the weighting coefficients of profit
under different scenarios, respectively. The following results were obtained.
Result 5. Both and increased with the growth in . In addition, was always below , but the speed difference between and (at = 0) is negligible.
Result 6. Both and moved upwards at the decrease of vessel load or the fuel price. However, the fuel price exerted little impact on the speeds and at = 0.
The above two Results indicate that the operator should increase the vessel speed under LFLL and slow down the vessel under HFHL.
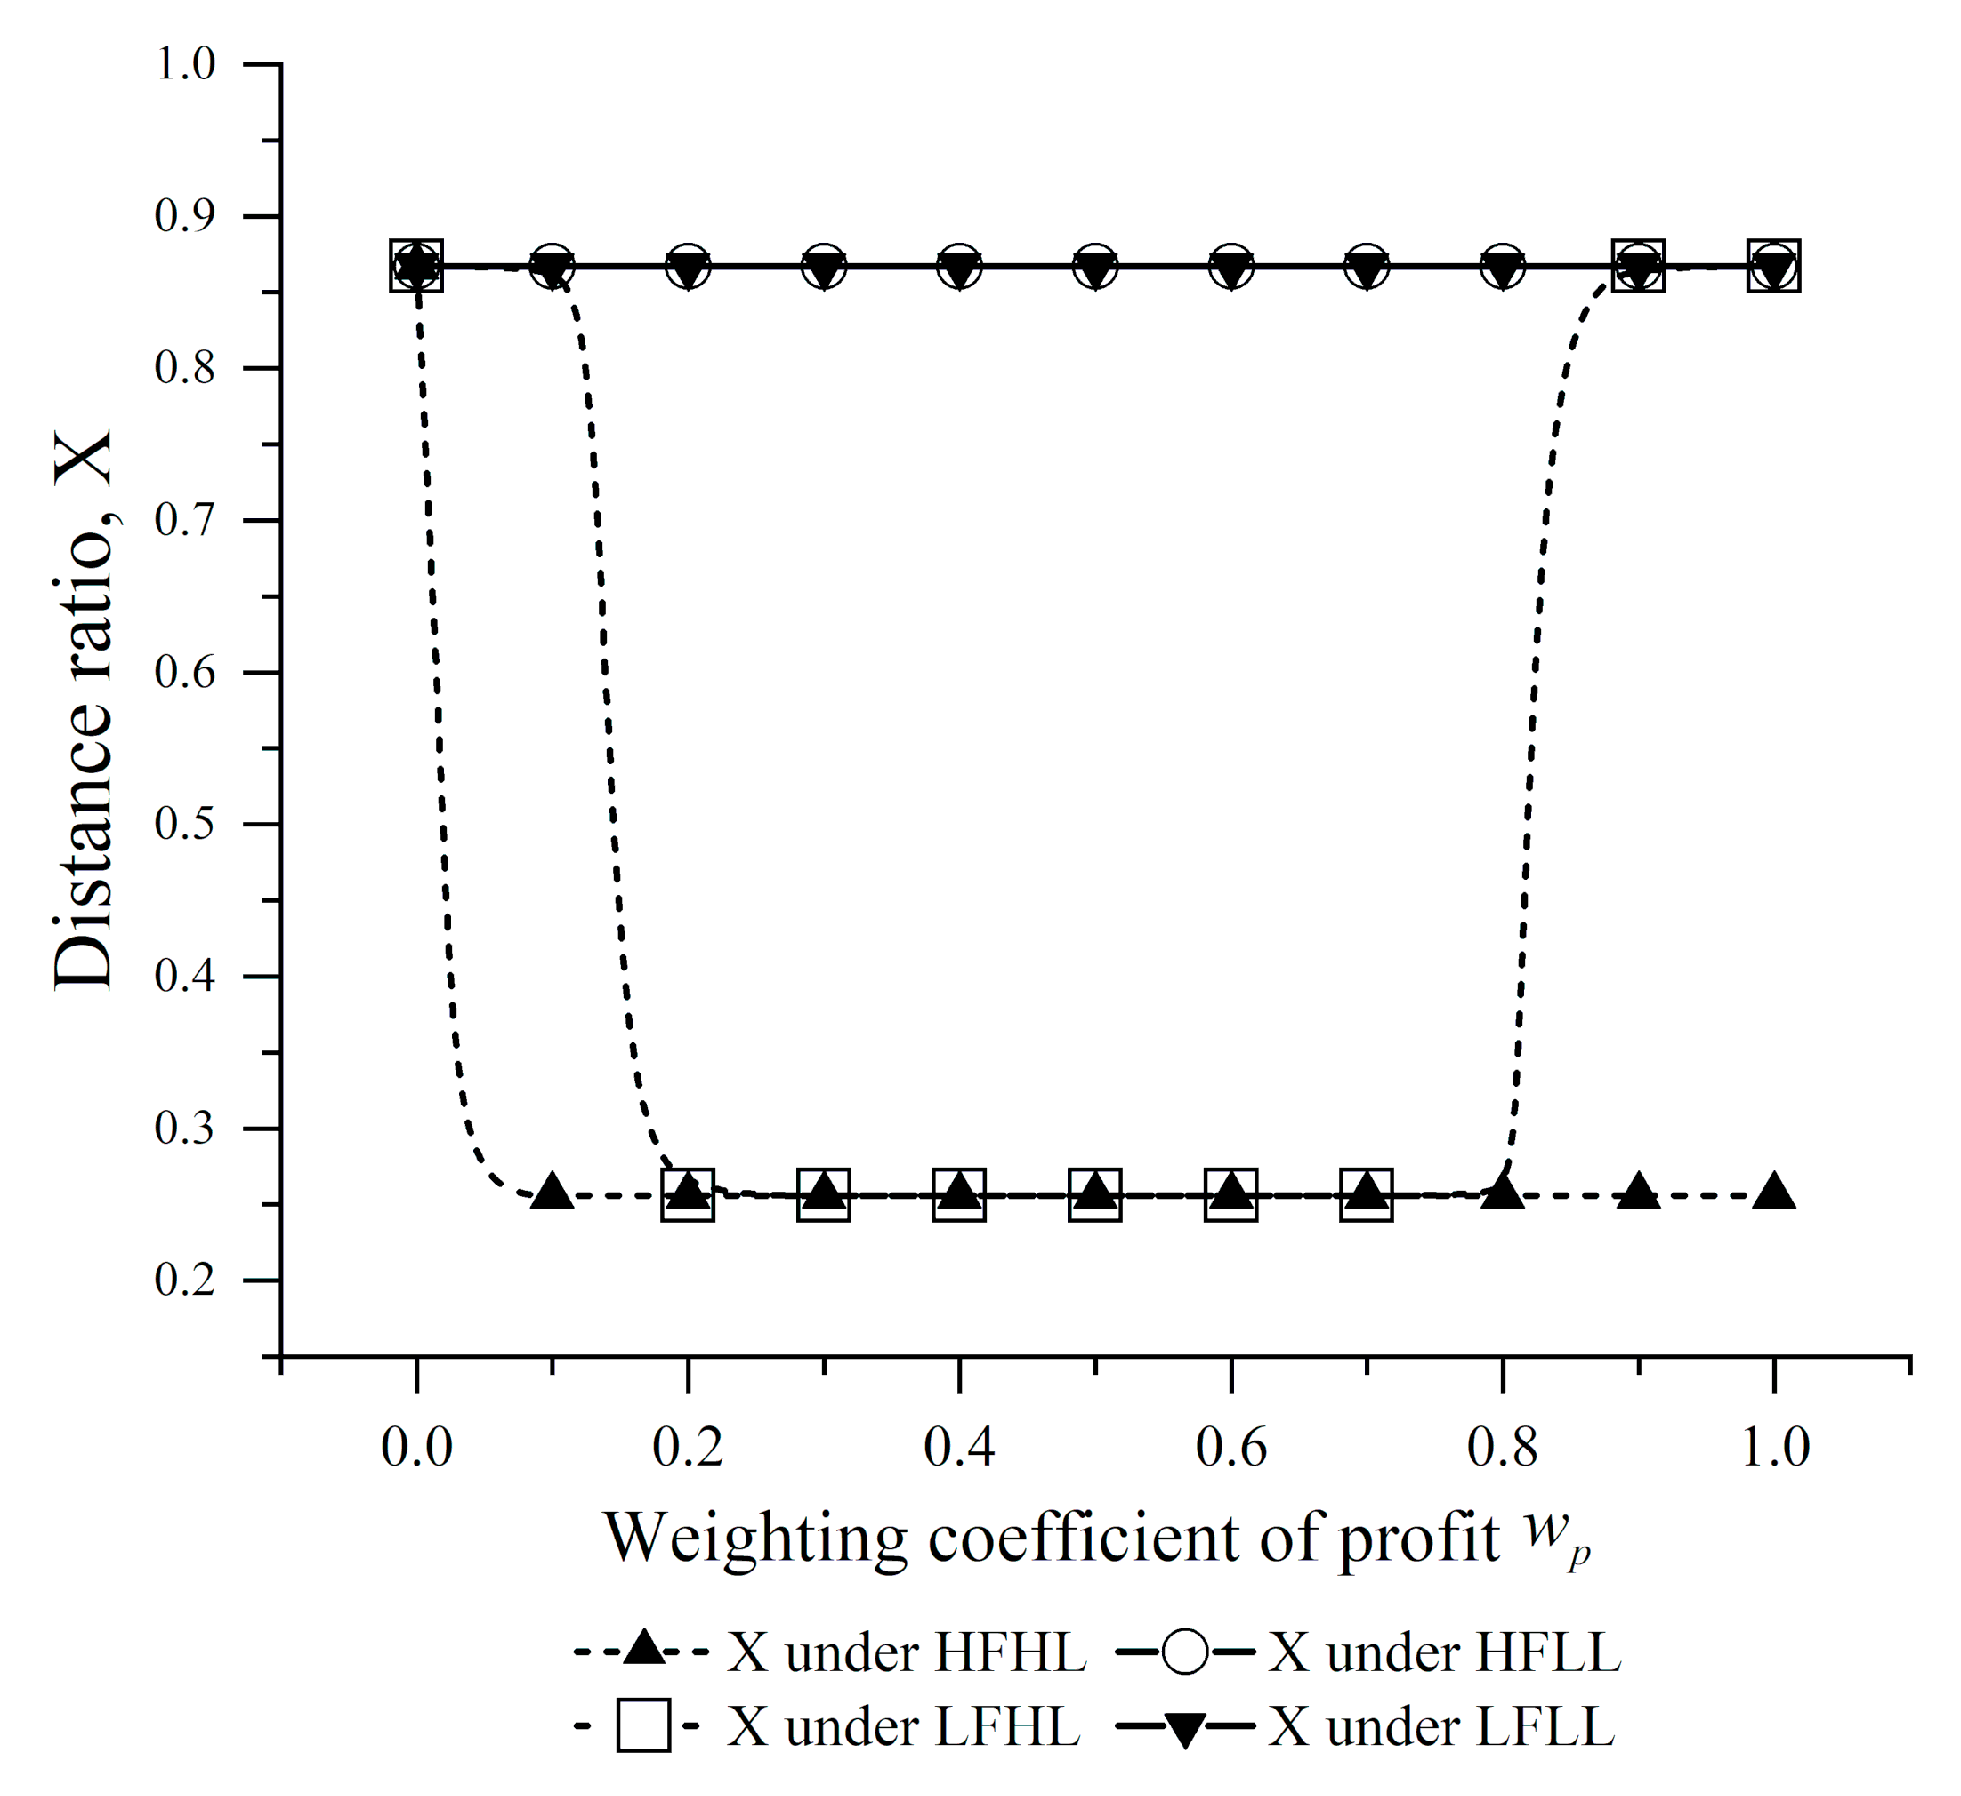
Figure 9 describes the relationship between optimal distance ratio
X and the weighting coefficient of profit under different scenarios. The choices of the ratio at different fuel prices and vessel loads are summed up below.
Result 7. The distance ratio was optimal at 0.256 if = {0.1, 0.2,…, 1.0} under the HFHL or = {0.2, 0.3,…, 0.8} under the LFHL.
Result 8. The distance ratio was optimal at 0.867 if = 0 under the HFHL, = {0, 0.1} or = {0.9, 1} under the LFHL, or of any value under HFLF and LFLL. If the vessel load is at a low level, the operator should sail outside the ECA as much as possible.
Note that, if the operator wants to minimize the carbon emissions (
= 0), he/she must reroute and sail further outside the ECA (
X = 0.867), regardless of the fuel price and vessel load. According to IMO [
16], the MGO, which is mainly consumed inside the ECA, has a greater carbon emission factor than the HFO. In other words, compliant fuel containing less sulfur may emit more carbon. Considering the high price and high carbon emission factor of the MGO, the operator ought to sail outside the ECA as much as possible, if the vessel load is very low.
4.4. Sensitivity Analysis
4.4.1. Analysis of Vessel Size
This subsection employs our bi-objective optimization method to calculate the suggested
, the optimal distance ratio, and the optimal speed for vessels of different sizes. Here, the vessel size is measured by cargo capacity. The target vessels include four bulk carriers and three containerships.
Table 3 lists the parameters of these vessels.
Table 4 and
Figure 10,
Figure 11,
Figure 12,
Figure 13,
Figure 14,
Figure 15 and
Figure 16 provide the computed results. The computed results were examined to verify if Results 1–8 apply to bulk carriers and containerships of different sizes and with varied engine parameters.
Table 4 presents the suggested value of
for different vessels. The calculation results show that Result 1 can be extended to all target vessels: the operators can optimize and balance profit and carbon emissions using the
that makes
=
. The following can also be derived from
Table 4.
Result 9. For Panamax bulker, Handymax bulker, Neo-Panamax containership, and Intermediate containership, the suggested is greater than 0.5 under LFHL, and smaller than 0.5 under HFHL, HFLL, and LHLL. For Handy-size bulker and Feeder containership, the suggested is smaller than 0.5 under all the scenarios.
Result 9 shows that Result 2 only applies to large vessels like Panamax bulker, Handymax bulker, Neo-Panamax containership, and Intermediate containership.
Figure 10 and
Figure 11 illustrate how
P and
E vary with
of different vessels, respectively. The two figures demonstrate the applicability of Results 3–4 to all the target vessels.
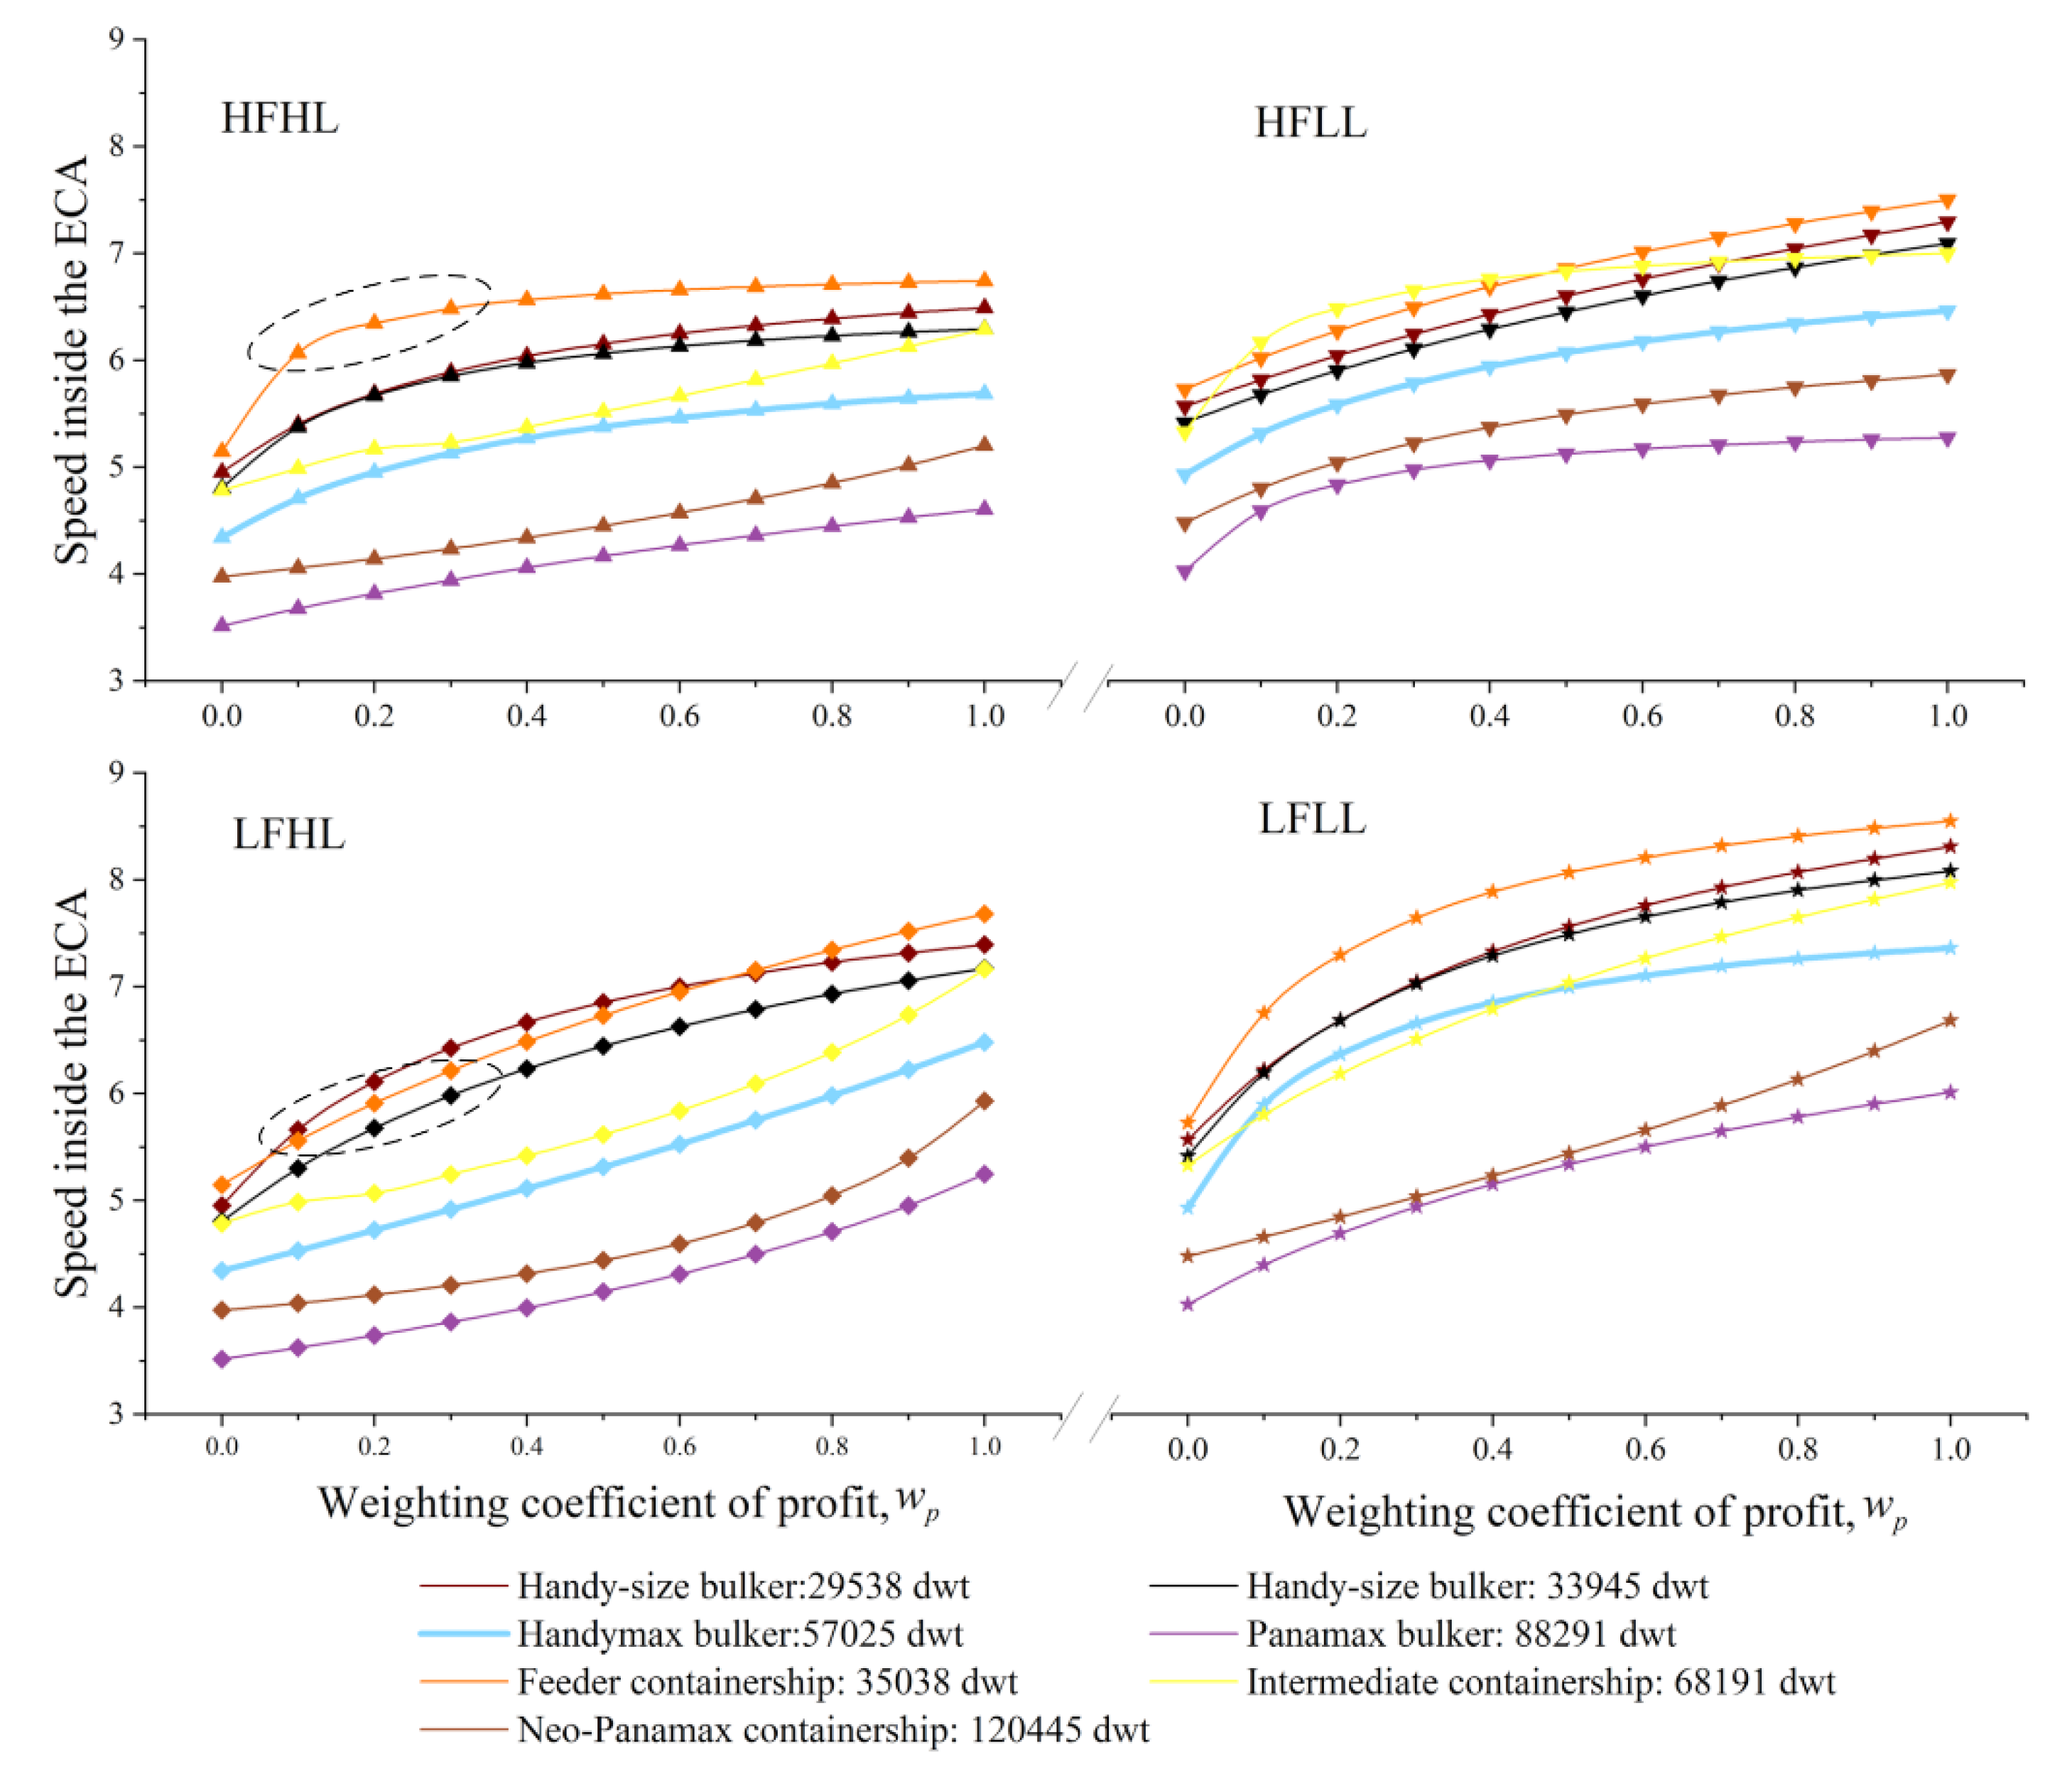
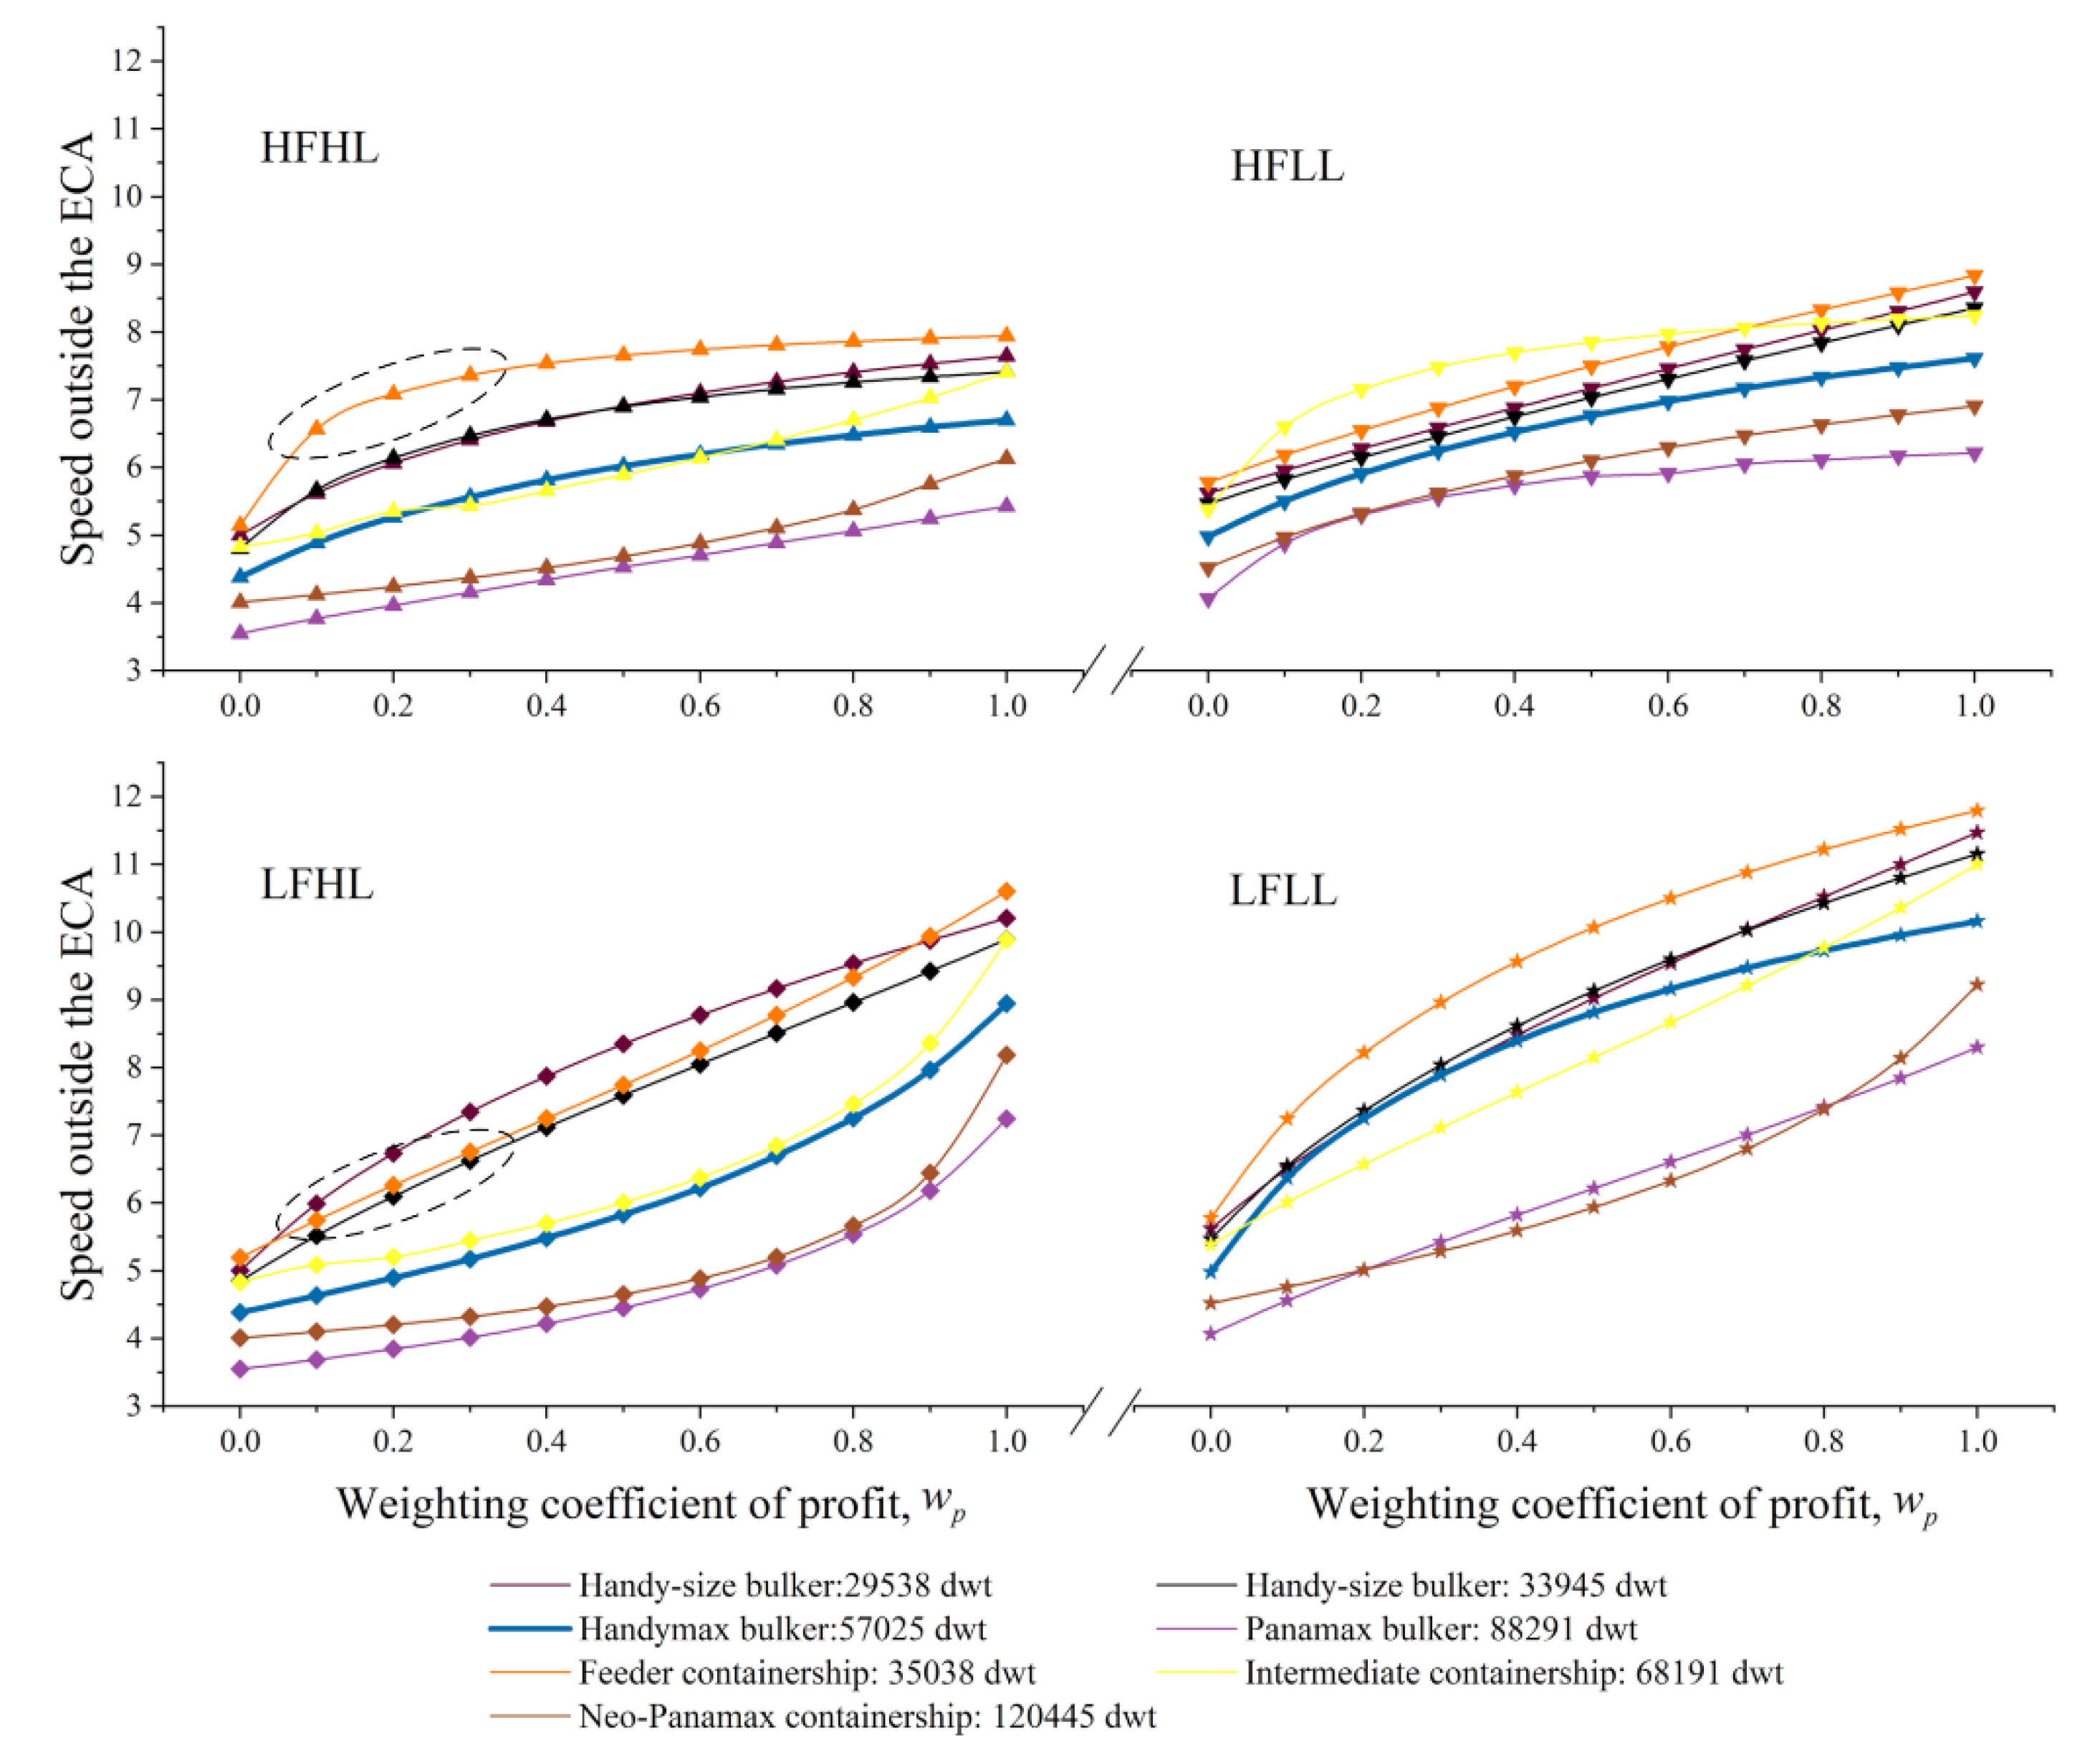
Figure 12 and
Figure 13 illustrate how
and
vary with
of different vessels, respectively. It can be seen that Result 5 applies to all the target vessels, while Result 6 is only inapplicable to the Feeder containership.
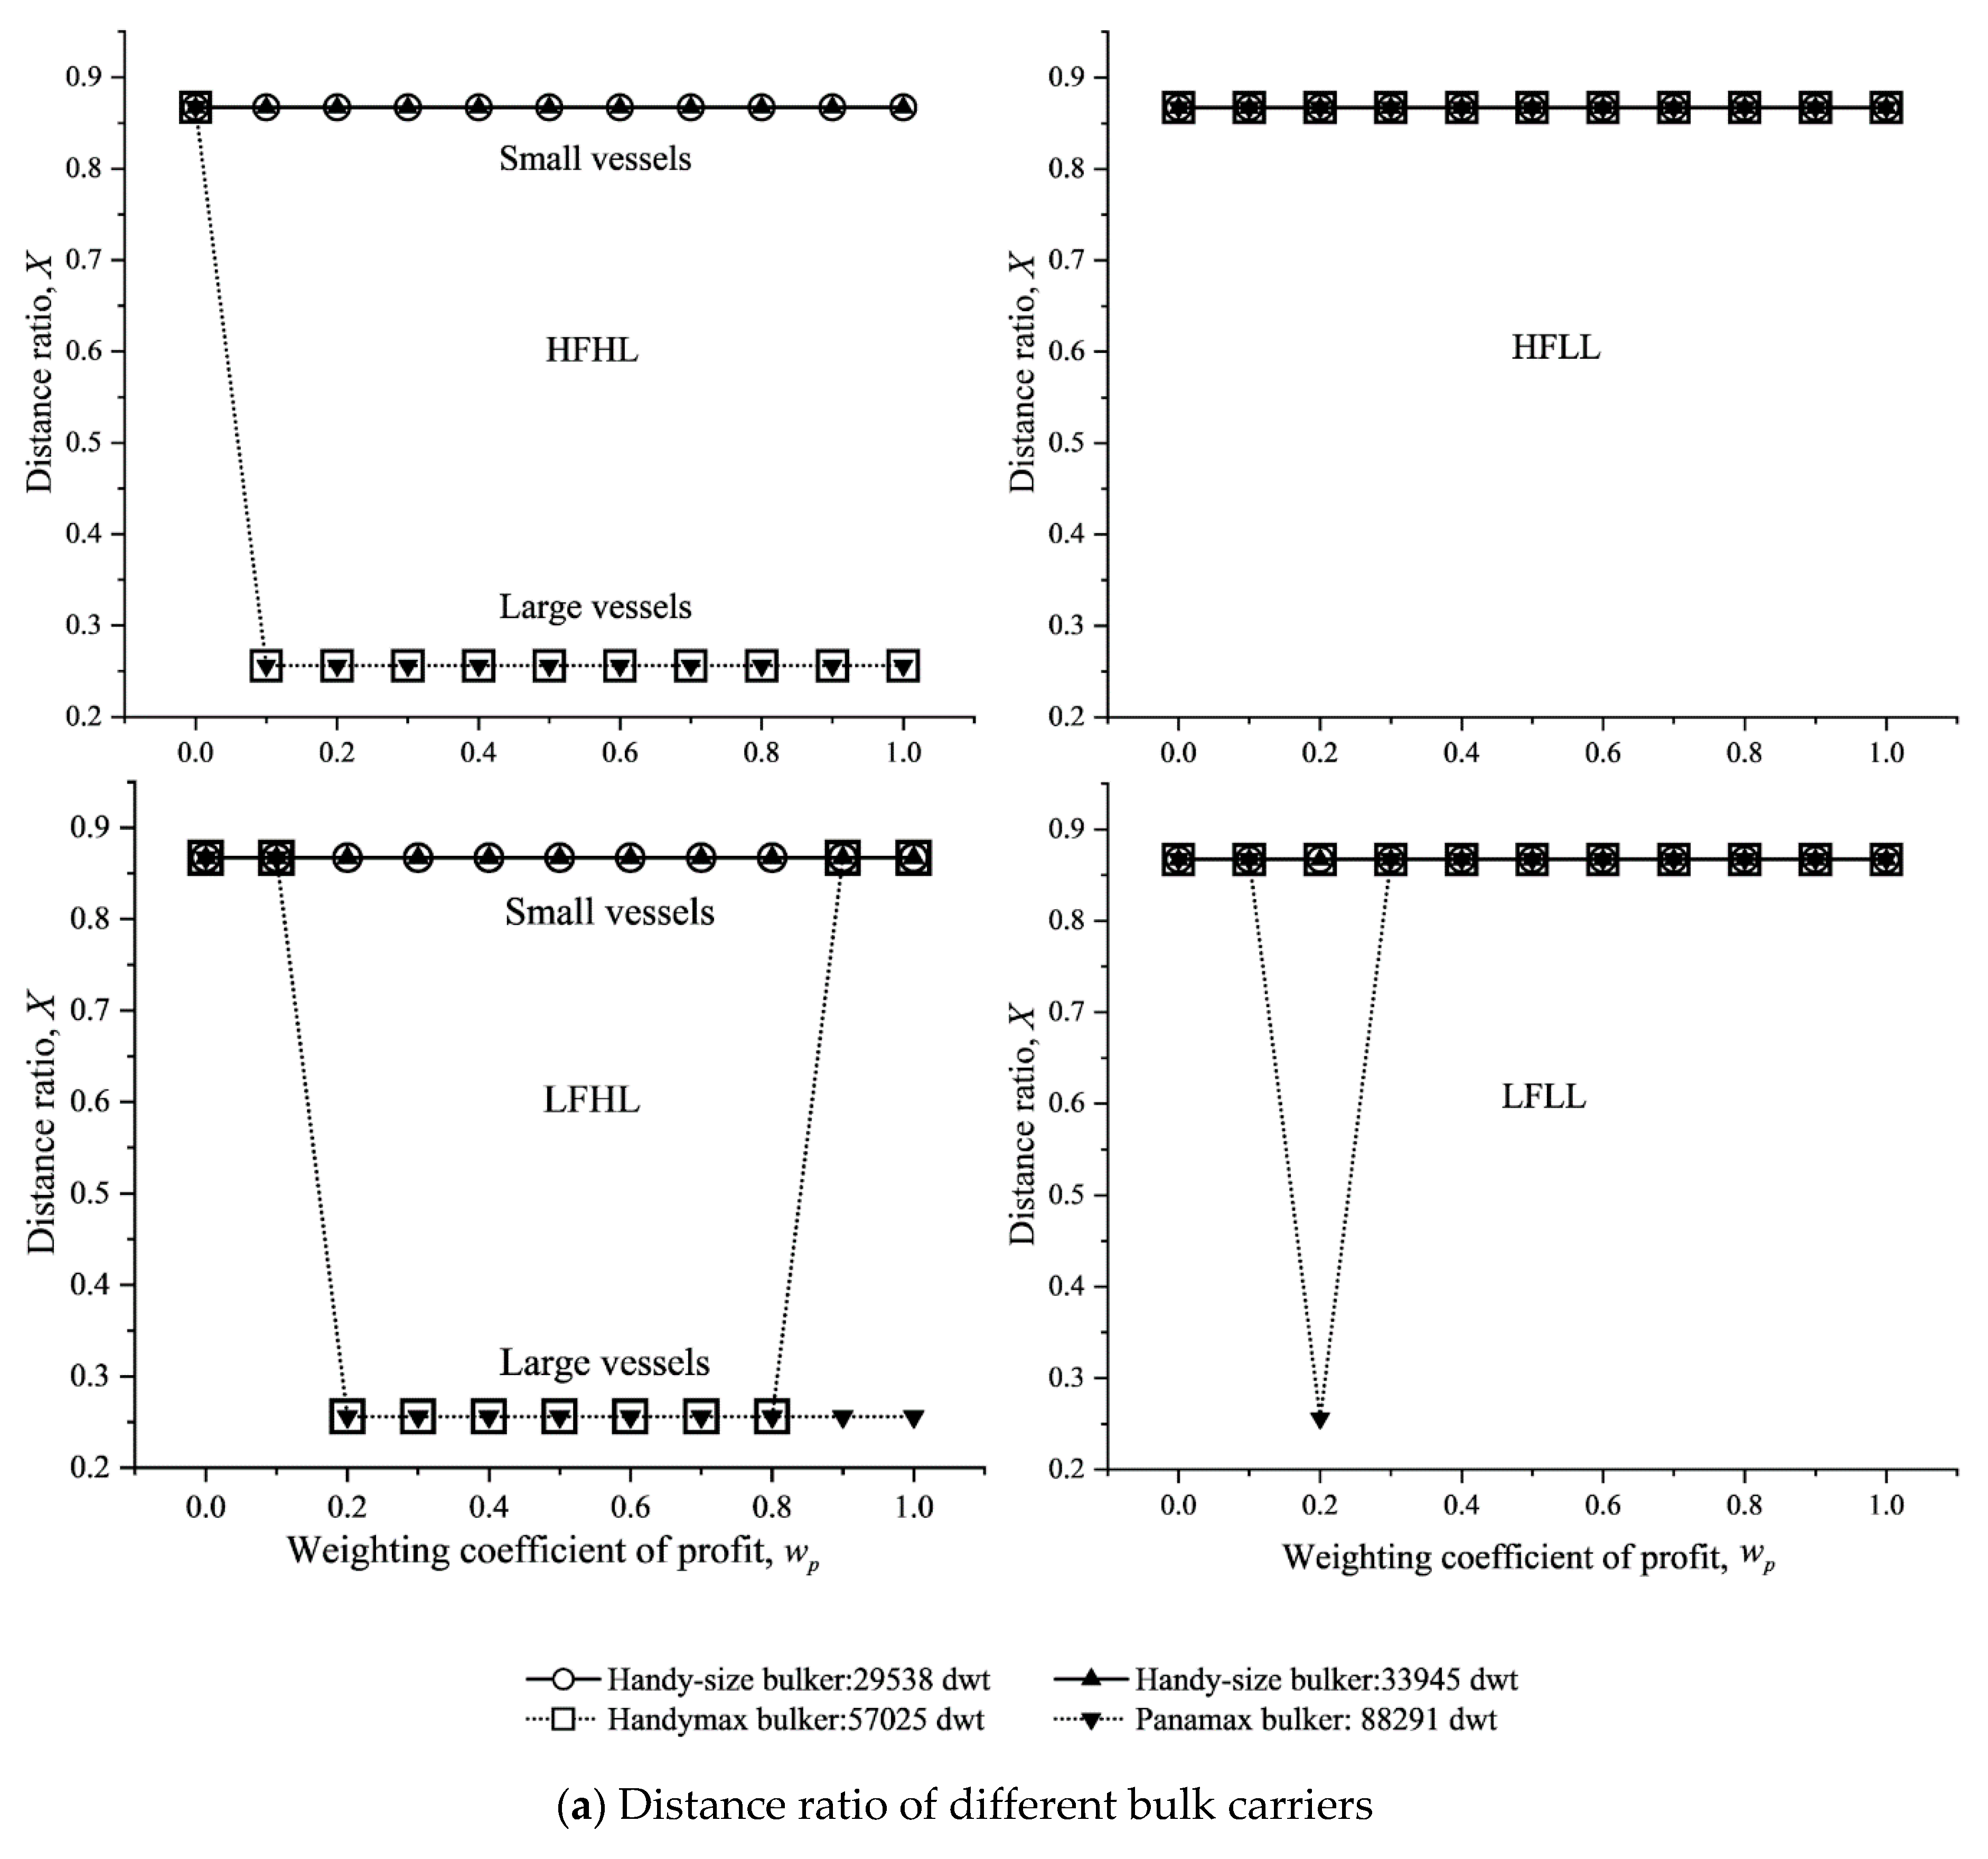
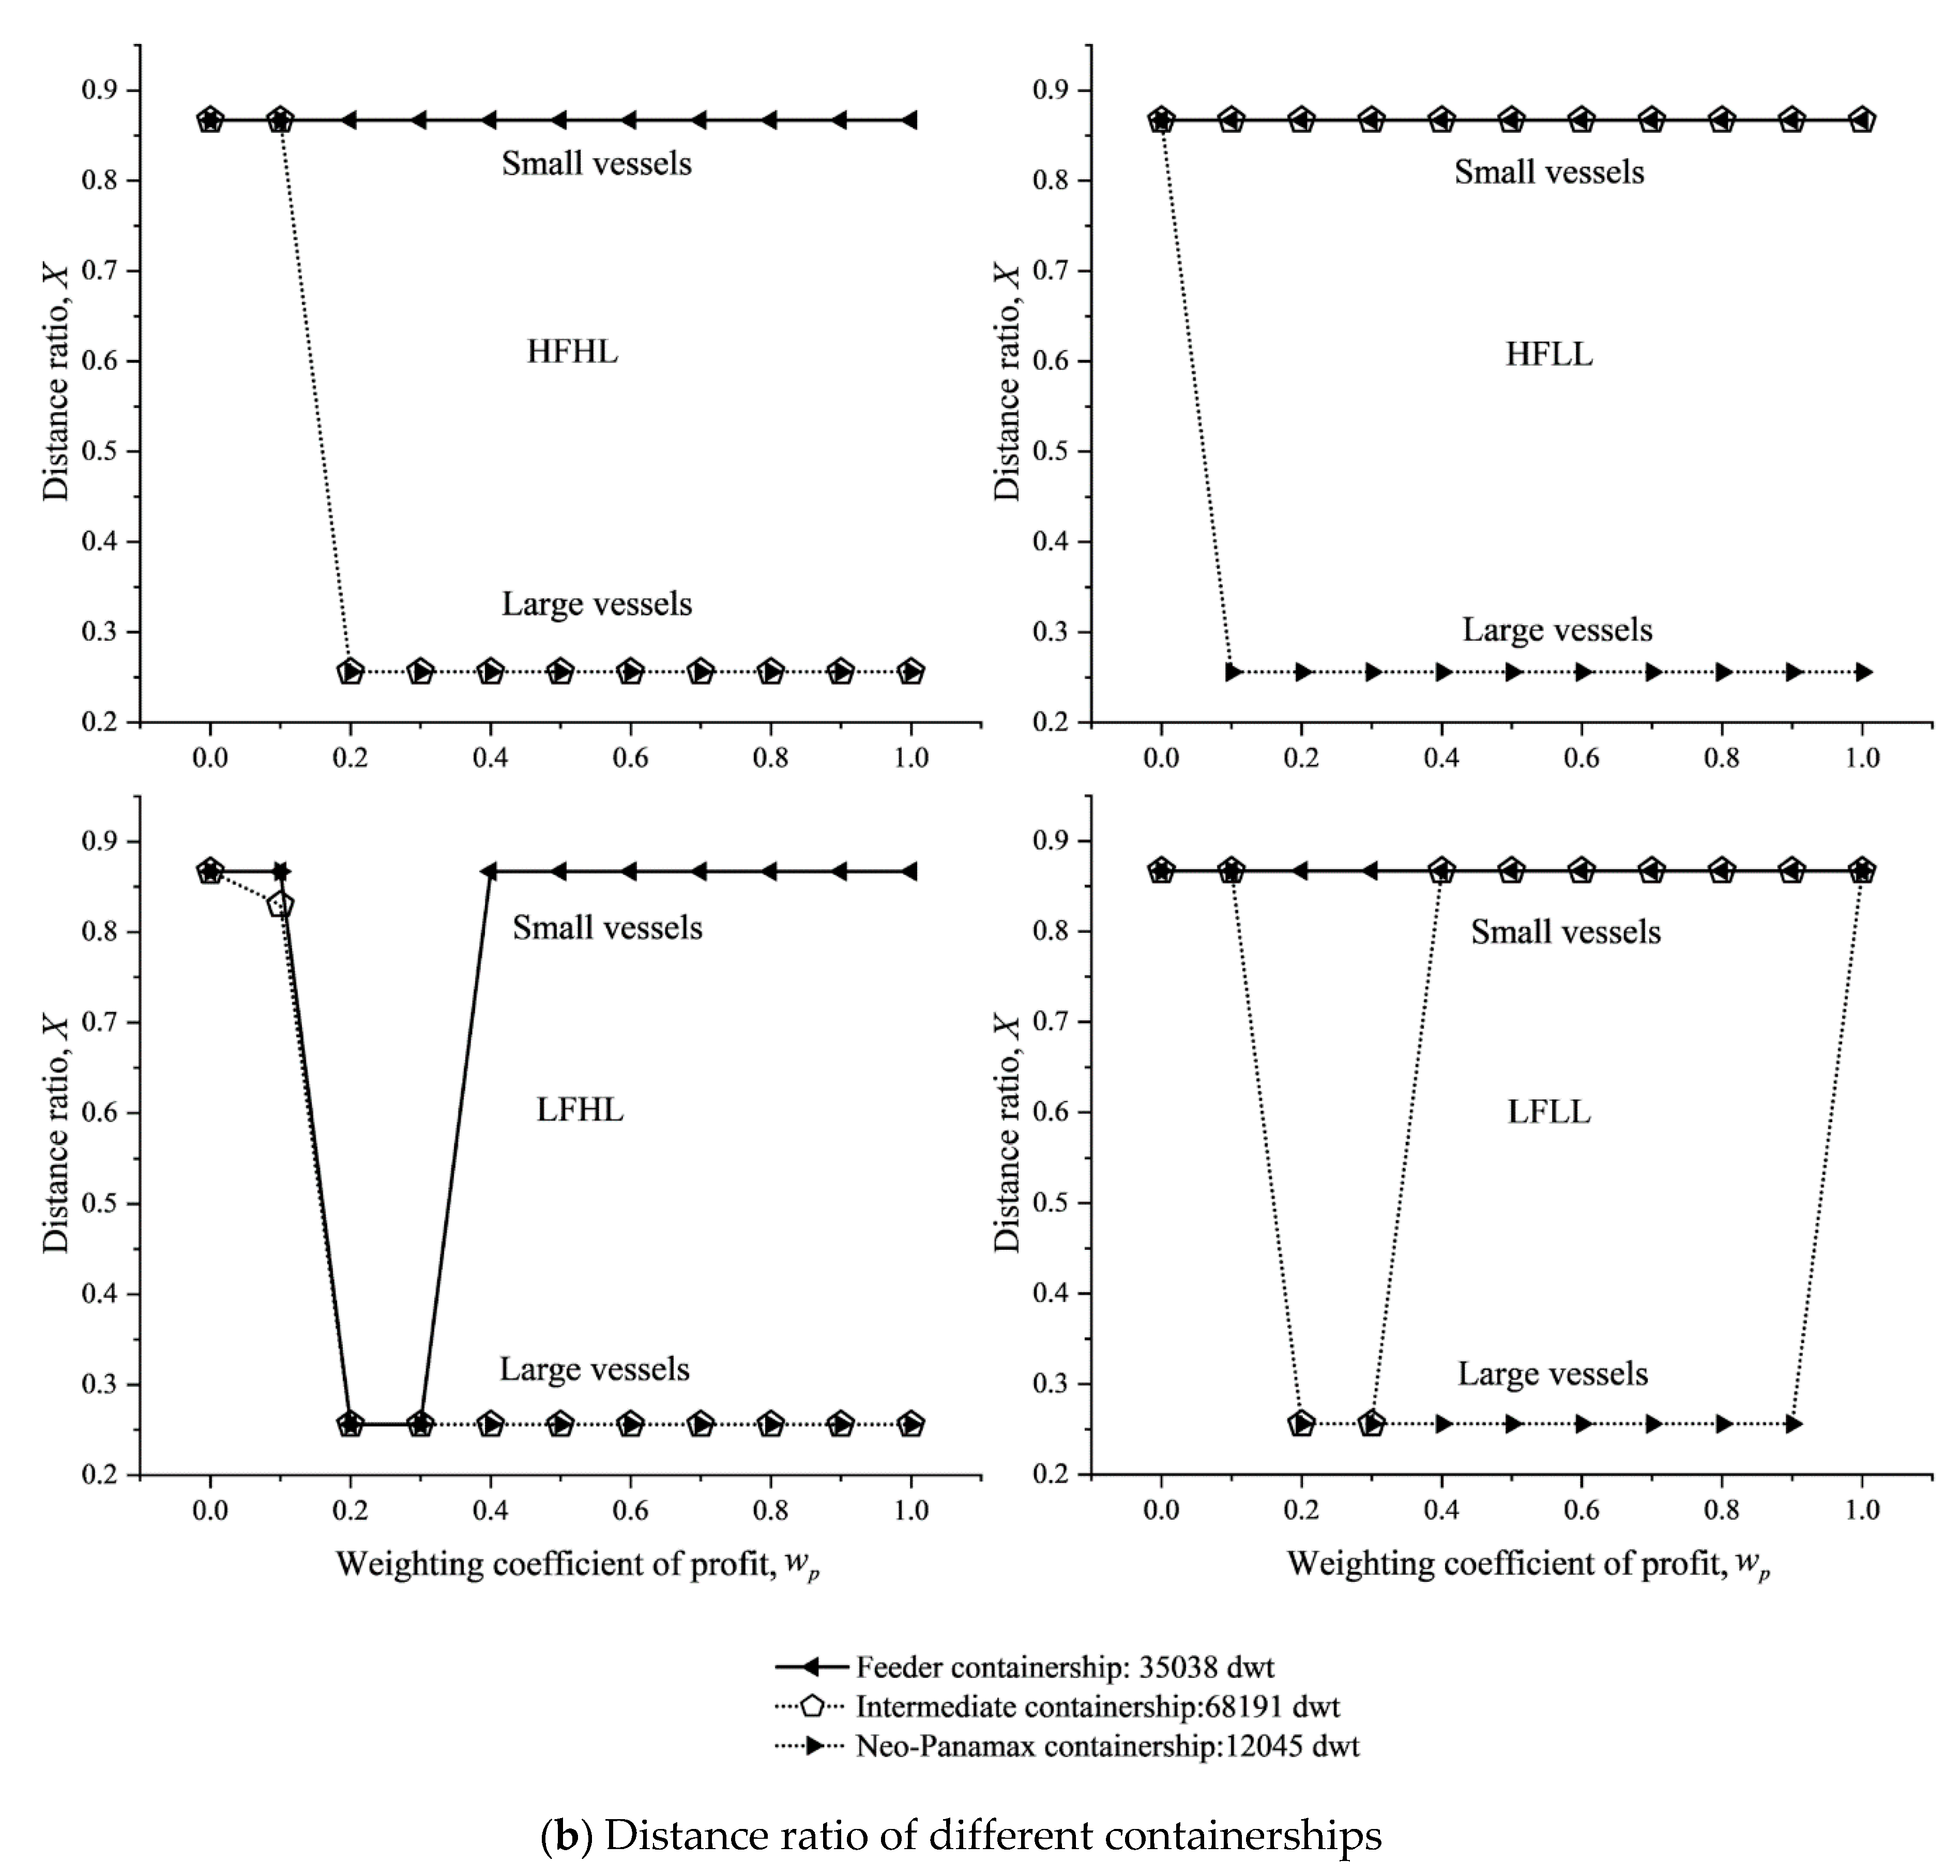
Figure 14 shows that Results 7 and 8 are valid only for Handymax bulker. Further, Result 10 was obtained regarding the relationship between
X and vessel size.
Result 10. For small bulk carriers like Handy-size bulker, the route X = 0.867 should be selected under any scenario. For large bulk carriers like Panamax bulker, the route X = 0.256 should be selected if the vessel load is high. Similar rules apply to containerships: Feeder containership needs to choose X = 0.867 for most of the values and under all the scenarios, while Neo-Panamax containership should choose X = 0.256. Thus, small bulk carriers and containerships should both sail further outside of the ECA.
4.4.2. Analysis on MGO–HFO Price Spread
This subsection examines the effects of MGO–HFO price spread on speed and route. Since China designated its ECA in 2015, the MGO–HFO price spread has fluctuated between 250 USD/ton and 400 USD/ton, while the HFO price has gradually increased from 181 USD/ton to 476 USD/ton. Here, the interval of MGO–HFO price spread was set as [150, 450] USD/ton to cover the actual range in the past several years, and the HFO prices were set to 181 USD/ton, 300 USD/ton, and 476 USD/ton.
The target vessels in
Section 4.1 were retained for the sensitivity analysis of MGO–HFO price spread.
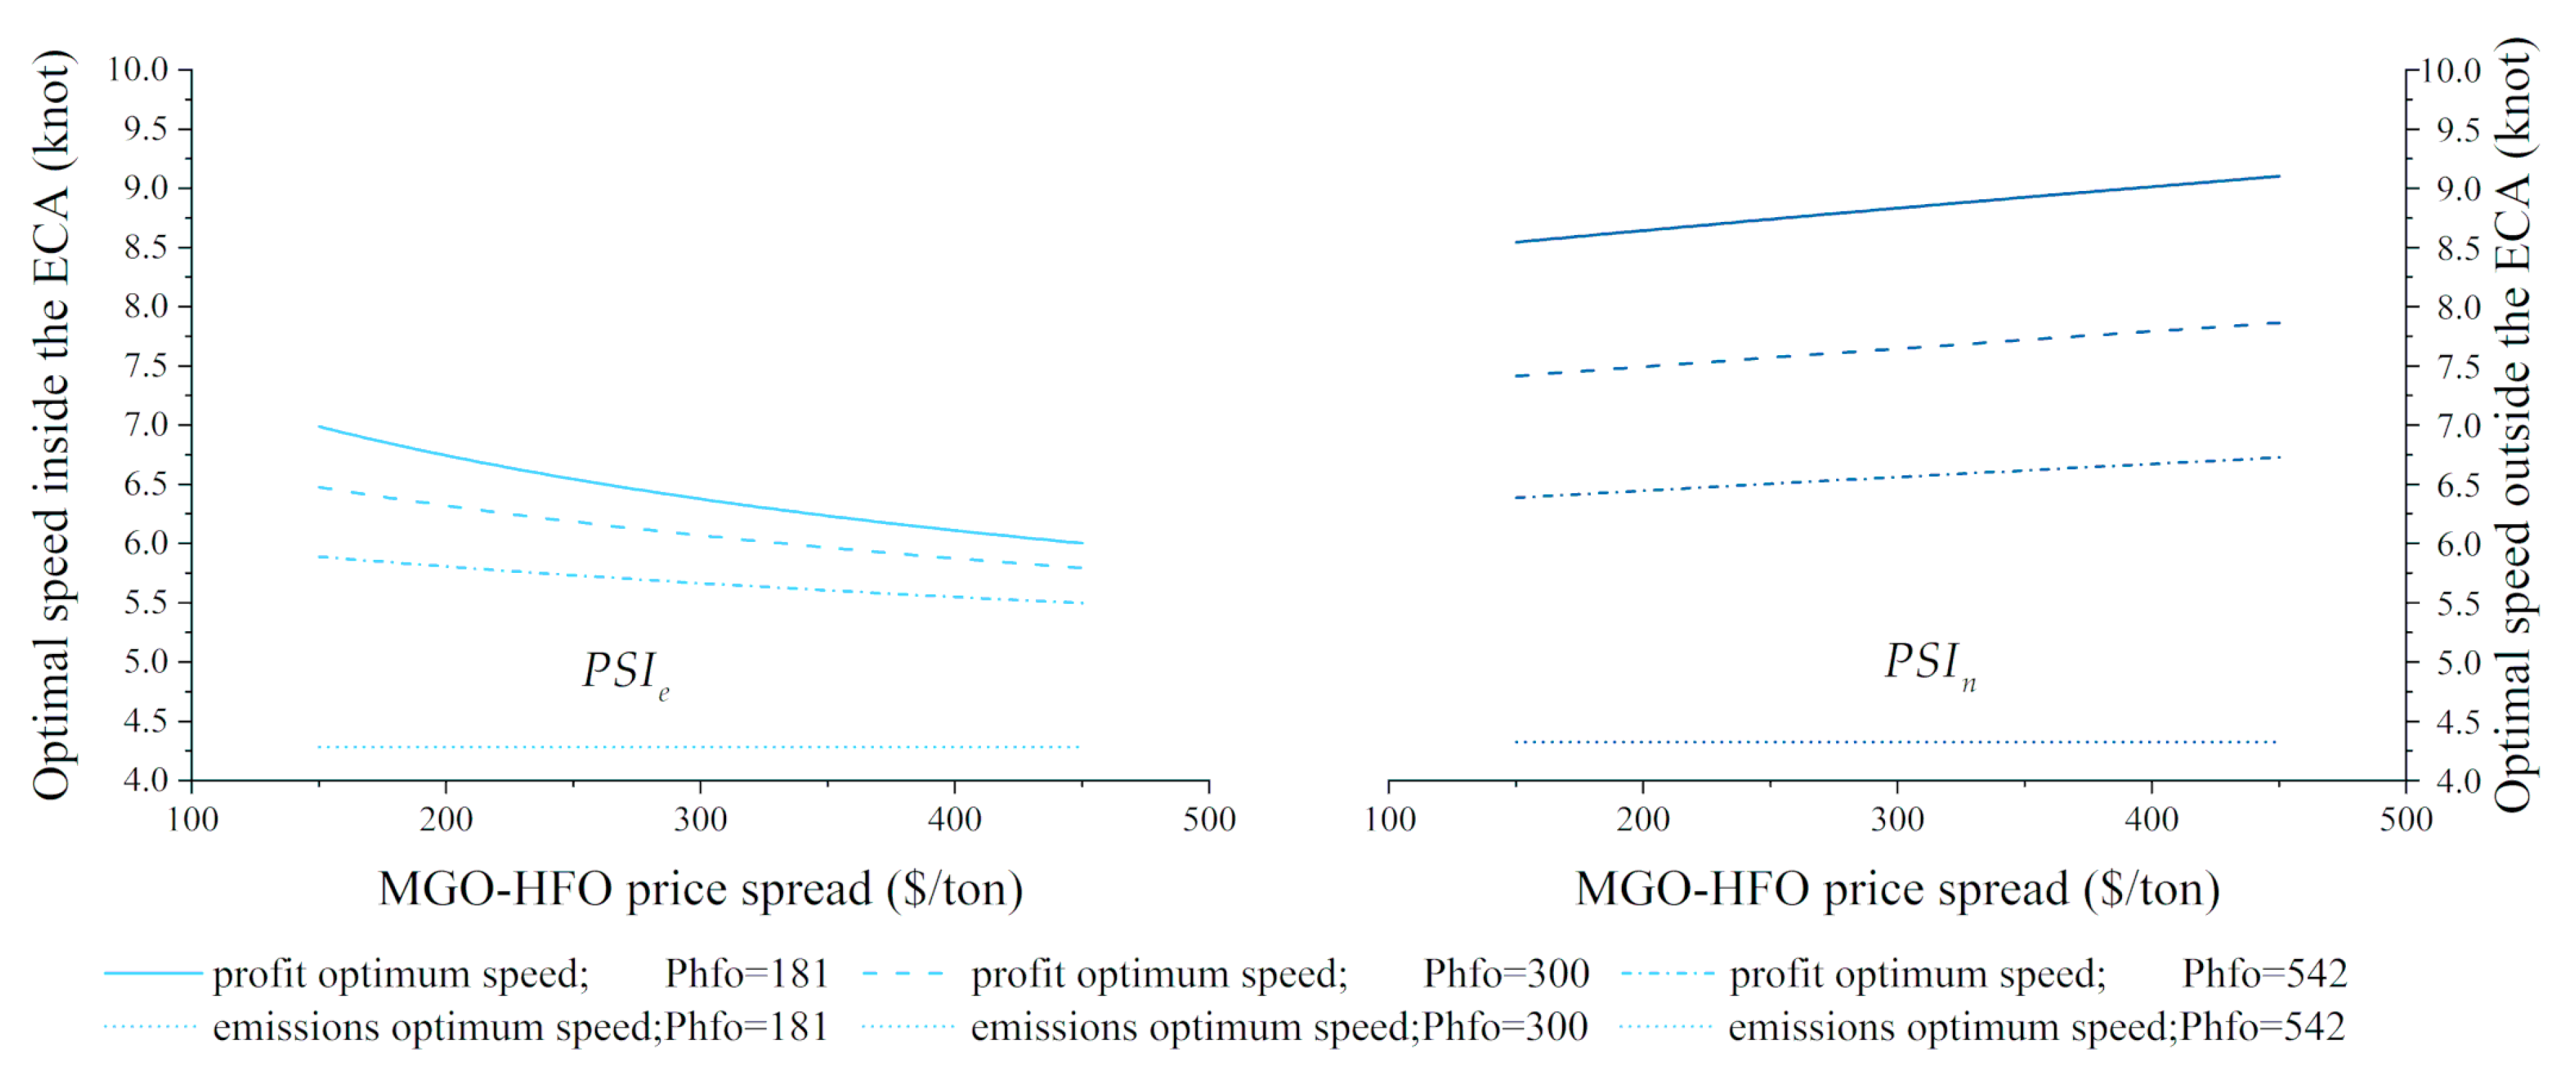
Figure 15 shows the optimal speeds for maximal profit (
and
) and minimal carbon emissions (
and
) under different MGO–HFO price spreads and HFO prices.
In
Figure 15, the curves on the left show that the
decreased with the growth in MGO–HFO price spread, while the curves on the right show that the
increased with the price spread. The lines at the bottom remained horizontal, indicating that the
and
are independent of fuel price. These observations can be proven by Equations (18)–(21). On this basis, the following result can be derived.
Result 11. With the growth in MGO–HFO price spread, the Pareto speed interval inside the ECA () shrank, while that outside the ECA () widened.
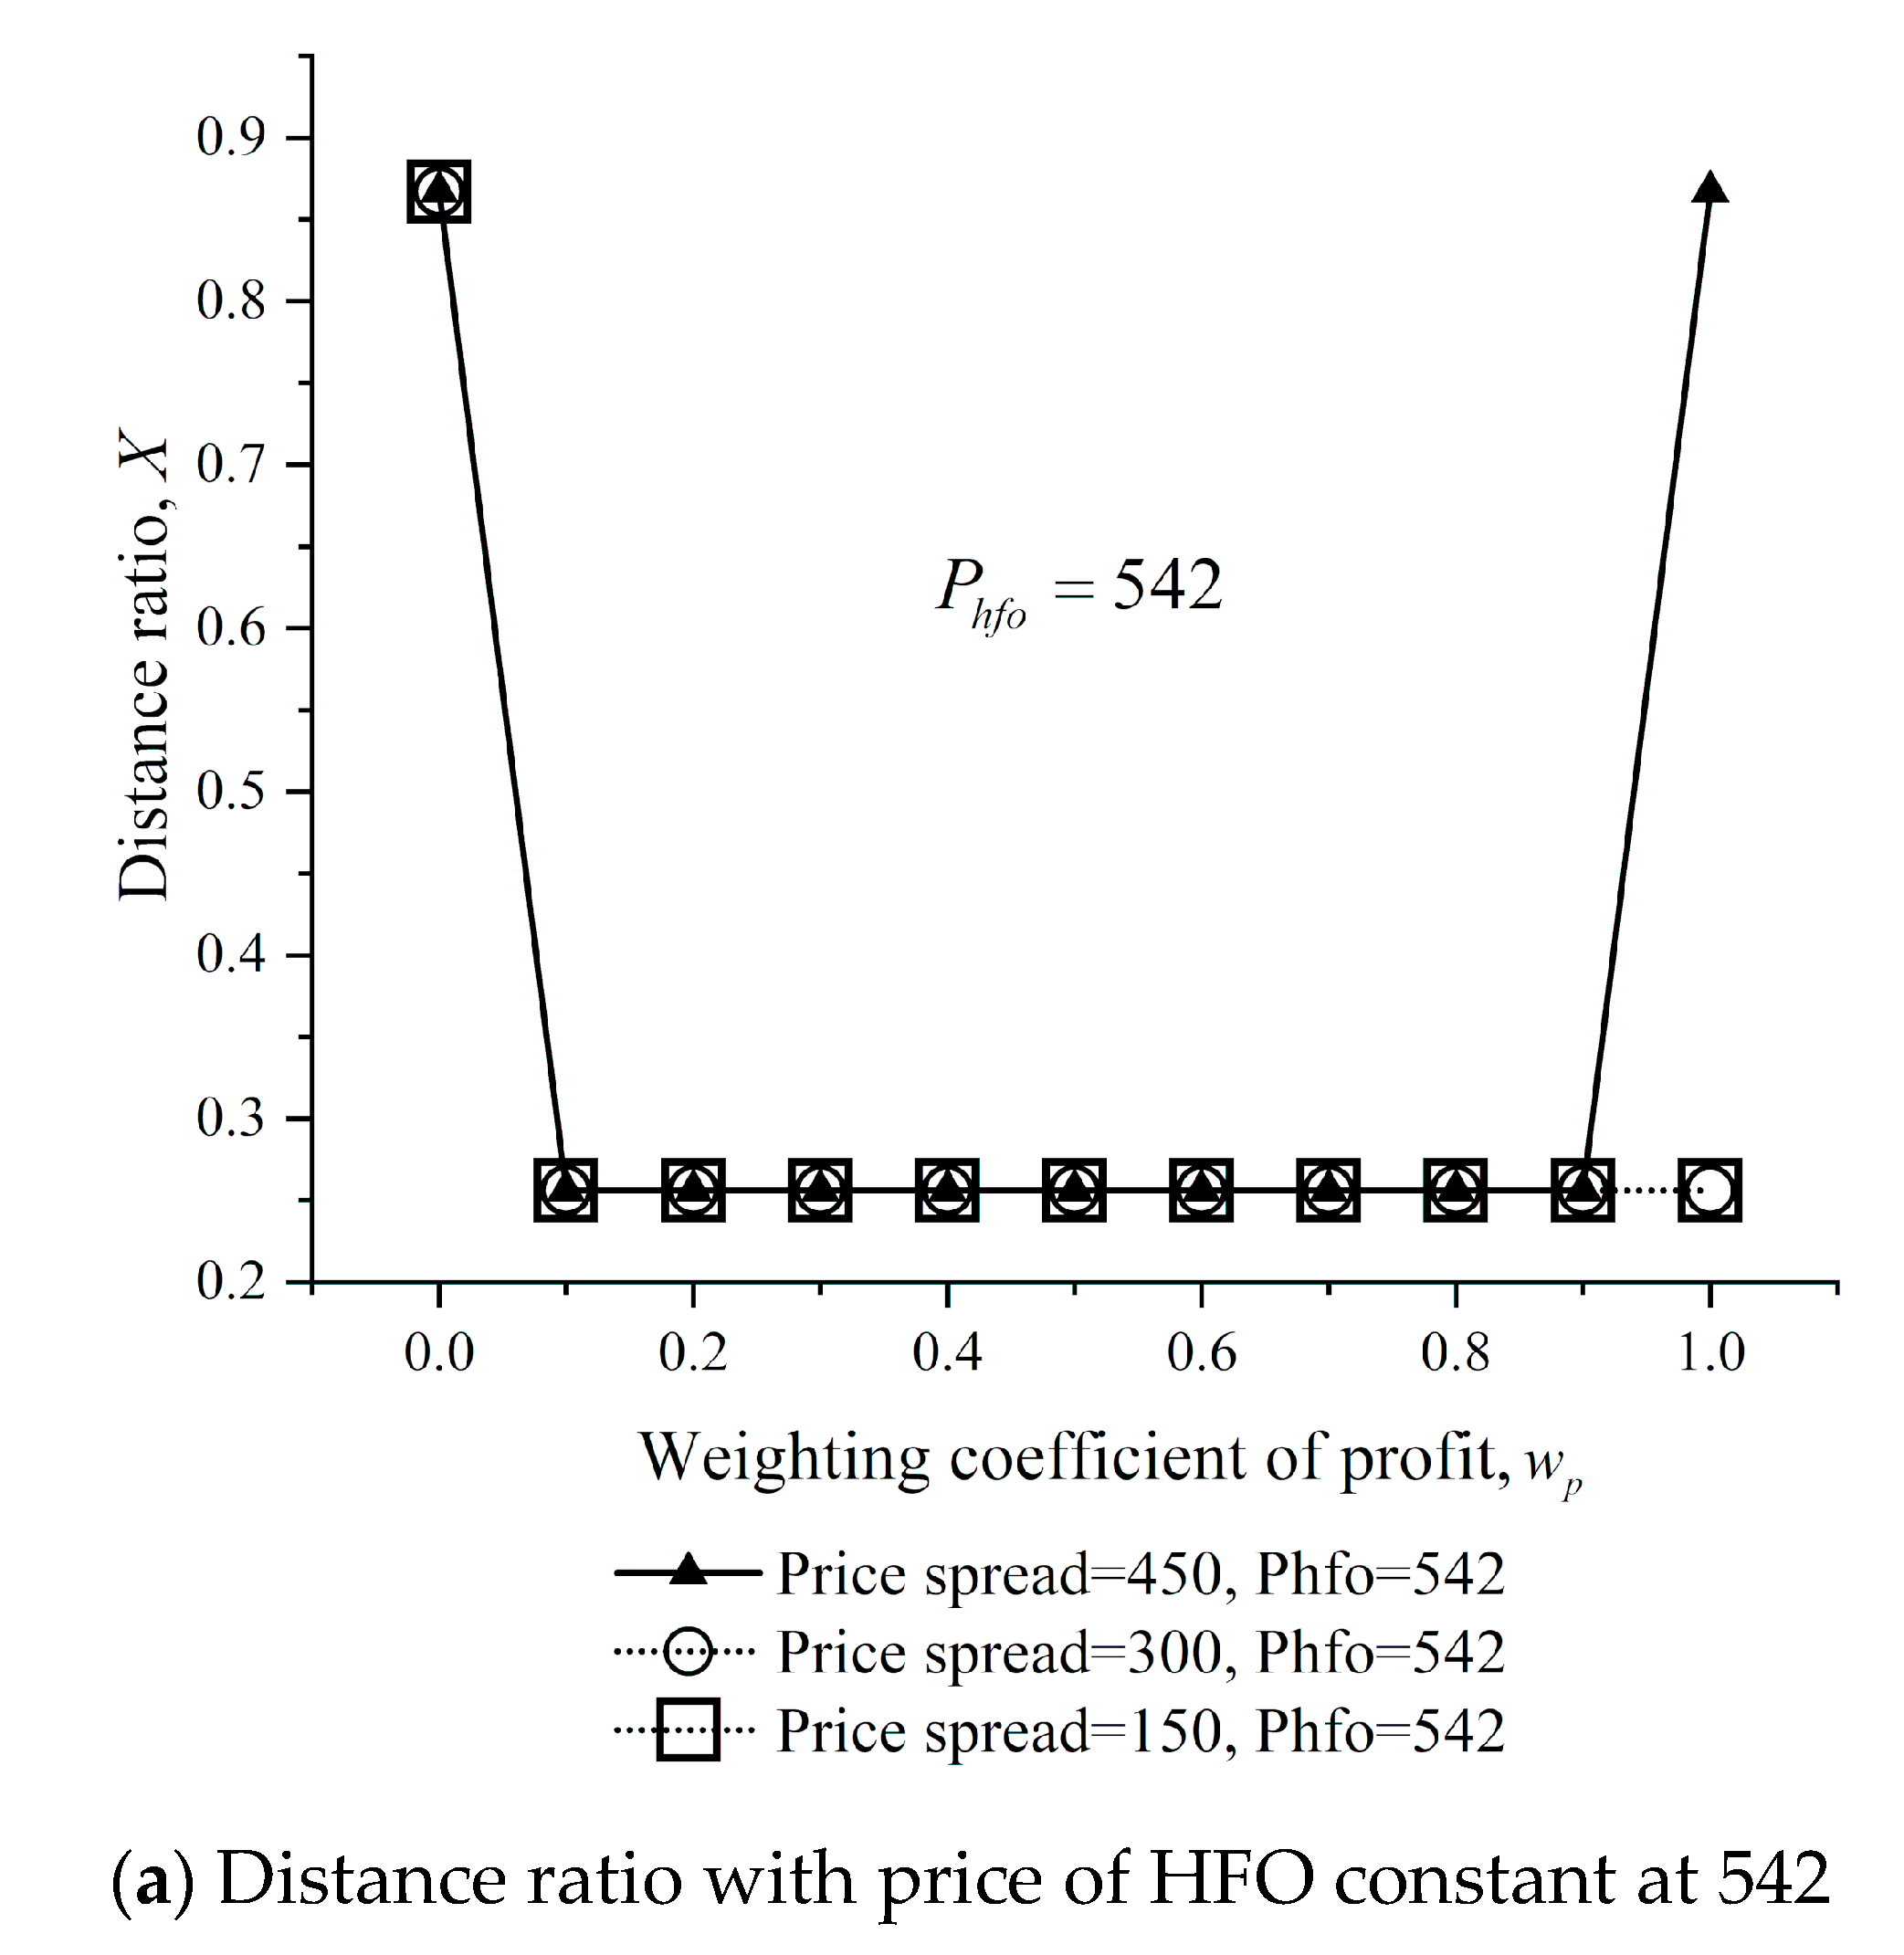
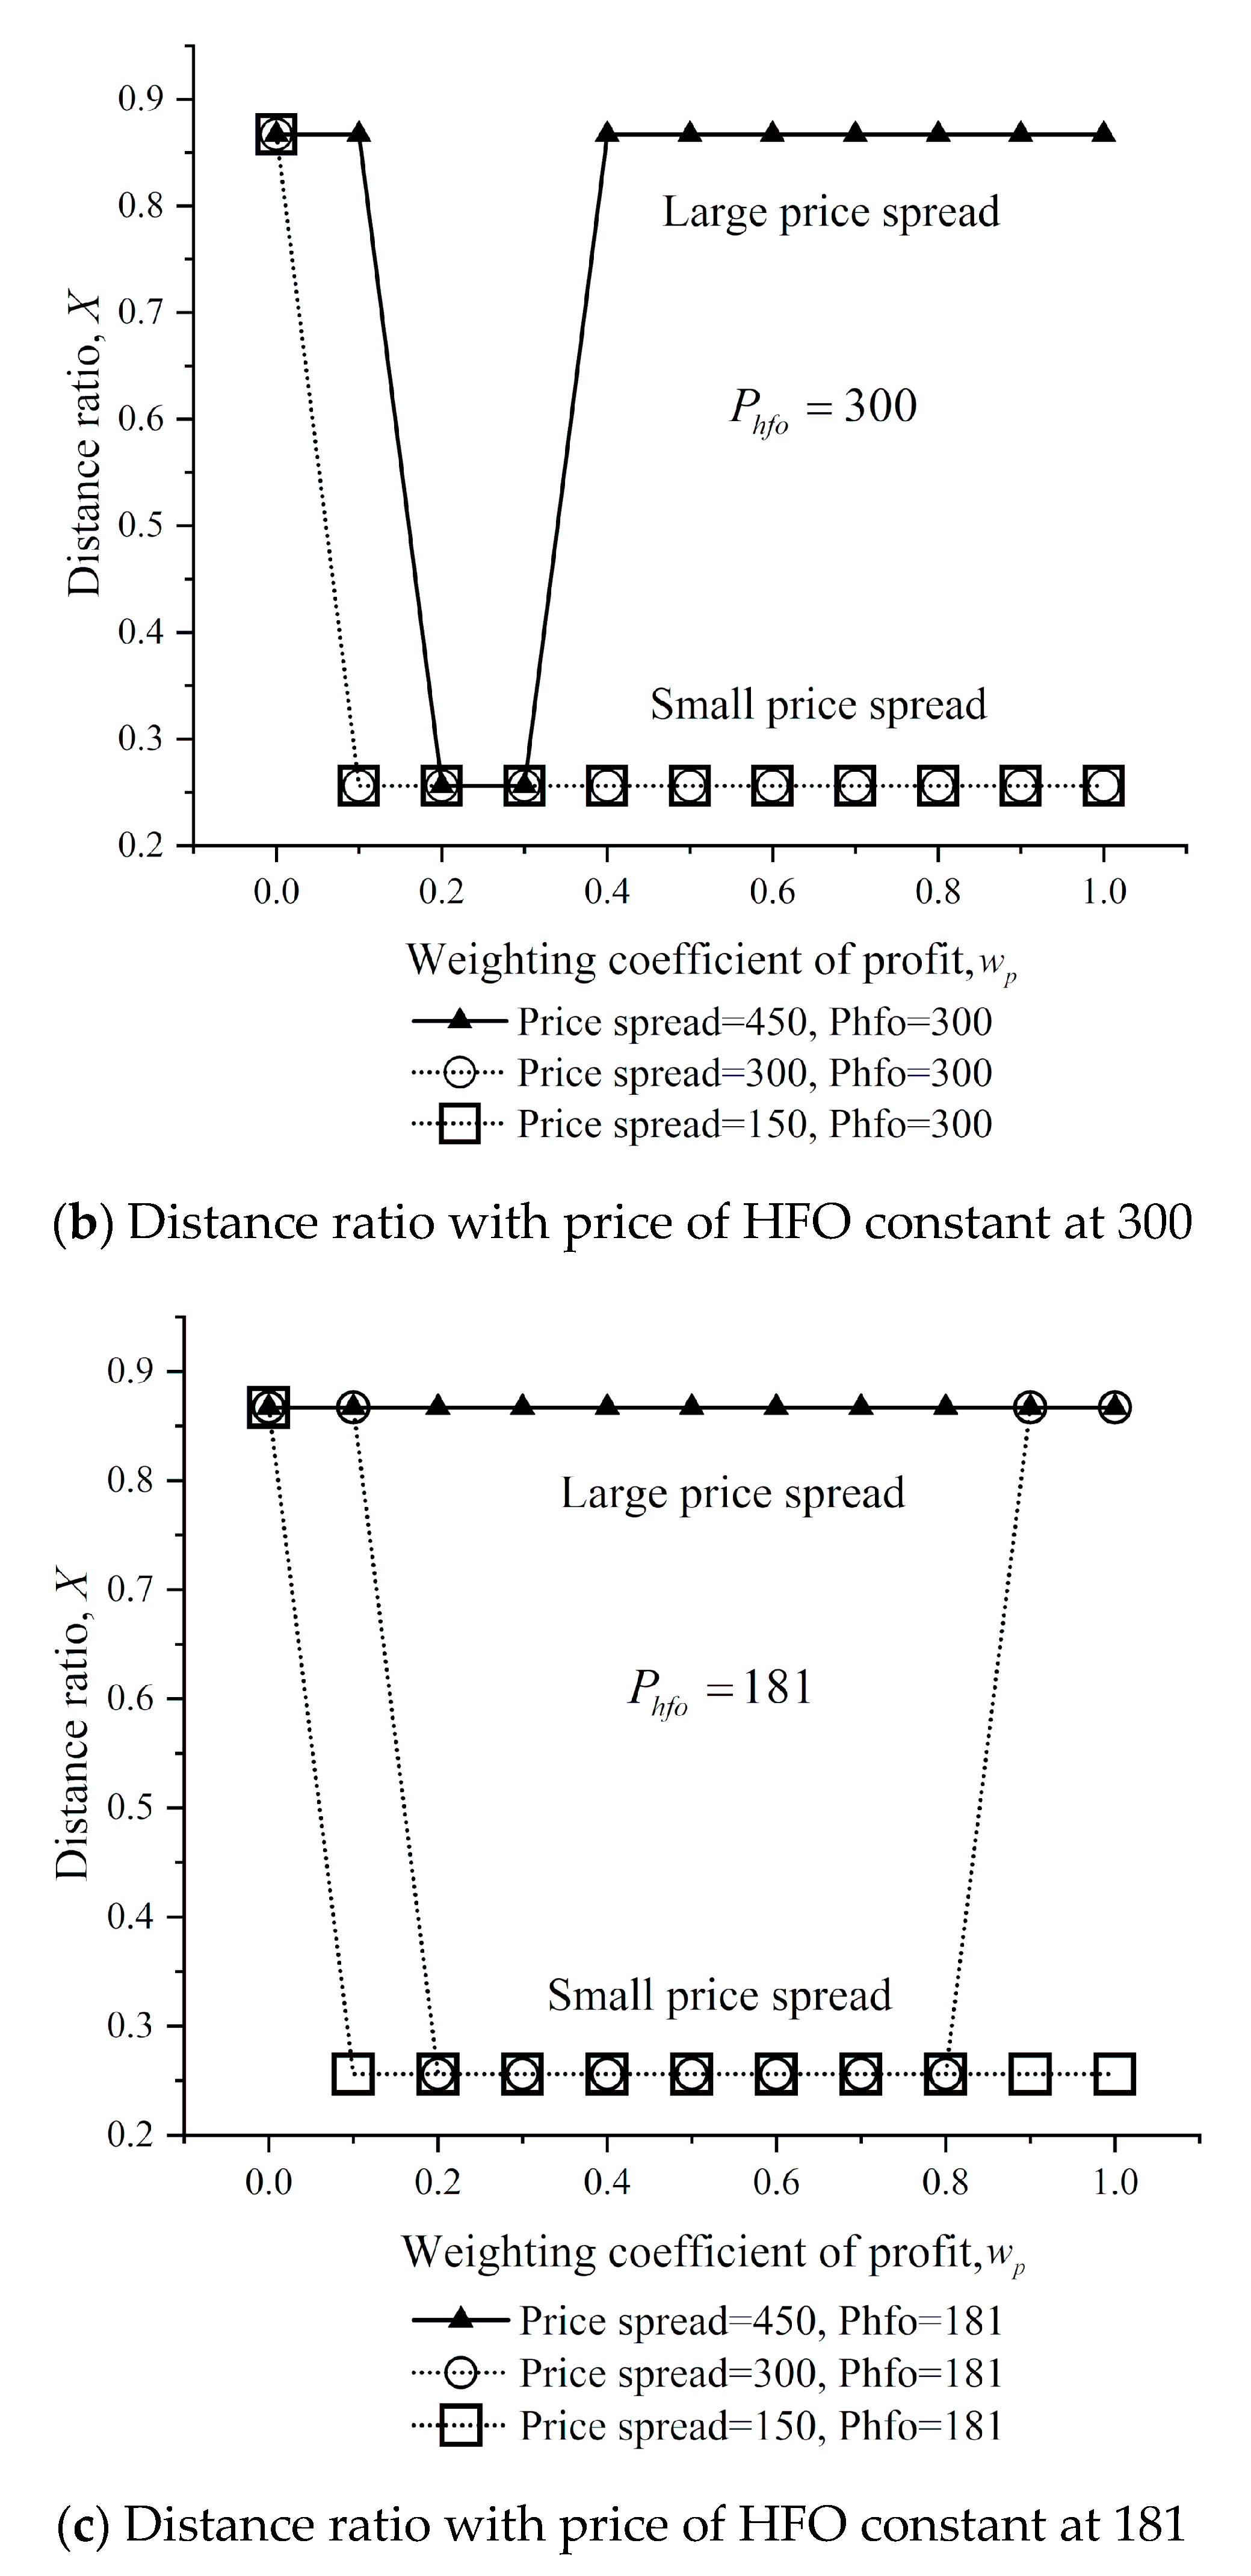
Figure 16 shows the distance ratios at different fuel prices and
values. The following result can be inferred from the figure.
Result 12. When the HFO prices are 181 and 300, the operator should select the route X = 0.867 with the increase of the MGO–HFO price spread. When the HFO price is 542, the operator should choose X = 0.256 for most of the .
5. Conclusions
Sustainable coastal shipping is crucial for dealing with the environmental issues derived from shipping emissions. Currently, the sustainable transformation for the coastal shipping sector is mainly reflected in two aspects; i.e., the fuel switch required by the mandatory ECA regulations, and the active adjustment of operation objectives between minimizing carbon emissions and maximizing profits. Drawing on existing models, the study formulates profit and carbon emissions for sustainable coastal shipping operations. The tradeoffs between profit and carbon emissions were investigated in detail, considering that the vessel that switches to low-sulfur fuels to sail partially inside an ECA. Firstly, the profit, carbon emissions, speed, and route were examined, revealing that all speed decisions must fall within the PSI; the speed and route decisions depend heavily on the two objectives (profit and carbon emissions); and the operator needs to strike a balance between the two conflicting objectives. Next, the optimal decisions on speed and route were investigated under different objectives, scenarios, vessel sizes, and MGO–HFO price spreads.
The results show that the operation measures and objectives depend greatly on fuel price, vessel load, and vessel parameters. The operator should speed up the vessel if he/she wants to make more profit or if the scenario is favorable for profit making; e.g., LFHL. Large vessels (e.g., Panamax bulker, Handymax bulker, Neo-Panamax containership, and Intermediate containership) should pursue more profit under the LFHL, without having to sail further outside the ECA. But this rule does not apply to small vessels like the Handy-size bulker and the Feeder containership. In addition, the increase of MGO–HFO price spread will reduce the Pareto speed interval inside the ECA, forcing the operator to slow down the vessel inside the ECA and sail further outside the ECA, especially at a low HFO price.
The research findings help operators refine their operation measures and objectives, and can be applied in the ECAs across the globe. Our method to optimize operation measures and objectives can also be extended from coastal shipping to deep-ocean shipping. In the foreseeable future, the difference of sulfur content cap between ECAs and non-ECAs will not be changed. Therefore, the research results regarding the speed difference and distance ratio between ECAs and non-ECAs will remain valid for both coastal shipping and deep-ocean shipping, as long as the vessels have to sail across the ECA. Of course, the effects of ECA regulations on coastal shipping are greater than those on deep-ocean shipping.
The main limitation of this study is that we used the fuel prices of MGO and HFO in our case study. In fact, there will be a global sulfur cap of 0.5% in 2020. In addition, the Chinese government is considering whether to carry out stricter sulfur limit of 0.1% in 2025. After 2025, the sulfur limit inside the ECA is likely to be 0.1% and the global limit outside the ECA is 0.5%. In the future, operators may use very low sulfur fuel oil (VLSFO) with 0.5% sulfur content outside the ECA and MGO inside the ECA. It would be better if we used the fuel price of MGO and VLSFO. However, as far as we know, some refiners have just started to sell VLSFO recently, and the price of VLSFO in China is still uncertain. In our opinion, the methodology in this study perhaps will still work if the operators need to switch between fuel types with different sulfur contents and different fuel prices.
Further research will explore more on how to adjust the operator’s operation measures and objectives flexibly depending on regulation strictness and market situation, and probe into other abatement options like retrofitting scrubbers and investing on abatement technologies.
Author Contributions
Y.Z. and H.K. conceived the study, and were responsible for the design and development of the case study. Y.F. and J.Z. were responsible for data collection and analysis. Y.F. was also responsible for data interpretation. In addition, Y.Z. wrote the first draft of this paper.
Funding
This work was supported by the National Natural Science Foundation of China (grant number 71403035, 71902016, 71831002), the Foundation for Humanities and Social Sciences of the Ministry of Education of China (grant number 18YJC630261), the Key R&D Program for Soft Science Projects of Liaoning Province, China (grant number 2018401030), the Program for Innovative Research Team in Universities of the Ministry of Education of China (grant number IRT_17R13), and the Fundamental Research Funds for the Central Universities of China (grant numbers 3132018301 and 3132018304).
Acknowledgments
Our special thanks go to the anonymous reviewers for their constructive comments.
Conflicts of Interest
The authors declare no conflict of interest.
References
- Yang, H.; Ma, X. Uncovering CO2 emissions patterns from China-oriented international maritime transport: Decomposition and decoupling Analysis. Sustainability 2019, 11, 2826. [Google Scholar] [CrossRef]
- Svindland, M. The environmental effects of emission control area regulations on short sea shipping in Northern Europe: The case of container feeder vessels. Transp. Res. Part D Transp. Environ. 2018, 61, 423–430. [Google Scholar] [CrossRef]
- Perakis, A.N.; Denisis, A. A survey of short sea shipping and its prospects in the USA. Marit. Policy Manag. 2008, 35, 591–614. [Google Scholar] [CrossRef]
- Cullinane, K.; Bergqvist, R. Emission control areas and their impact on maritime transport. Transp. Res. Part D Transp. Environ. 2014, 28, 1–5. [Google Scholar] [CrossRef]
- Hilmola, O.-P. Shipping sulphur regulation, freight transportation prices and diesel markets in the Baltic Sea region. Int. J. Energy Sect. Manag. 2015, 9, 120–132. [Google Scholar] [CrossRef]
- Gu, Y.; Wallace, S.W. Scrubber: A potentially overestimated compliance method for the emission control areas. Transp. Res. Part D Transp. Environ. 2017, 55, 51–66. [Google Scholar] [CrossRef]
- Psaraftis, H.N.; Kontovas, C.A. Ship emissions: Logistics and other tradeoffs. In Proceedings of the 10th International Marine Design Conference (IMDC), Trondheim, Norway, 26–29 May 2009. [Google Scholar]
- Suárez-Alemán, A.; Trujillo, L.; Medda, F. Short sea shipping as intermodal competitor: A theoretical analysis of European transport policies. Marit. Policy Manag. 2015, 42, 317–334. [Google Scholar] [CrossRef]
- Fagerholt, K.; Gausel, N.T.; Rakke, J.G.; Psaraftis, H.N. Maritime routing and speed optimization with emission control areas. Transp. Res. Part C Emerg. Technol. 2015, 52, 57–73. [Google Scholar] [CrossRef]
- Christodoulou, A.; Woxenius, J. Sustainable short sea shipping. Sustainability 2019, 11, 2847. [Google Scholar] [CrossRef]
- Maersk. 2018 Sustainability Report. Available online: https://www.maersk.com/-/media/ml/about/sustainability/sustainability-new/files/apmm_sustainability_report_2018_a4_190228.pdf (accessed on 21 February 2019).
- Stalmokaitė, I.; Yliskylä-Peuralahti, J. Sustainability transitions in Baltic Sea shipping: Exploring the responses of firms to regulatory changes. Sustainability 2019, 11, 1916. [Google Scholar] [CrossRef]
- Jemai, J.; Zekri, M.; Mellouli, K. An NSGA-II algorithm for the green vehicle routing problem. In Proceedings of the European Conference on Evolutionary Computation in Combinatorial Optimization, Málaga, Spain, 11–13 April 2012; pp. 37–48. [Google Scholar] [CrossRef]
- Lindstad, H.; Asbjørnslett, B.E.; Strømman, A.H. Reductions in greenhouse gas emissions and cost by shipping at lower speed. Energy Policy 2011, 39, 3456–3464. [Google Scholar] [CrossRef]
- Lindstad, H.; Asbjørnslett, B.E.; Strømman, A.H. The importance of economies of scale for reductions in greenhouse gas emissions from shipping. Energy Policy 2012, 46, 386–398. [Google Scholar] [CrossRef]
- International Maritime Organization (IMO). Third IMO GHG Study 2014; Smith, T.W.P., Jalkanen, J.P., Anderson, B.A., Corbett, J.J., Faber, J., Hanayama, S., O’Keeffe, E., Parker, S., Johansson, L., Aldous, L., et al., Eds.; International Maritime Organization (IMO): London, UK, 2014.
- Sarkis, J. Greening the Supply Chain; Springer: London, UK, 2006. [Google Scholar] [CrossRef]
- Yuen, K.F.; Thai, V.V.; Wong, Y.D. The effect of continuous improvement capacity on the relationship between of corporate social performance and business performance in maritime transport in Singapore. Transp. Res. Part E Logist. Transp. Rev. 2016, 95, 62–75. [Google Scholar] [CrossRef]
- Berg, R.V.D.; Langen, P.W.D. Environmental sustainability in container transport: The attitudes of shippers and forwarders. Int. J. Logist. Res. Appl. 2017, 20, 146–162. [Google Scholar] [CrossRef]
- Kontovas, C.A.; Psaraftis, H.N. Reduction of emissions along the maritime intermodal container chain: Operational models and policies. Marit. Policy Manag. 2011, 38, 451–469. [Google Scholar] [CrossRef]
- Dulebenets, M.A. The green vessel scheduling problem with transit time requirements in a liner shipping route with emission control areas. Alex. Eng. J. 2018, 57, 331–342. [Google Scholar] [CrossRef]
- Perera, L.P.; Mo, B. Emission control based energy efficiency measures in ship operations. Appl. Ocean Res. 2016, 60, 29–46. [Google Scholar] [CrossRef]
- Fan, L.; Huang, L. Analysis of the incentive for slow steaming in Chinese sulfur emission control areas. Transp. Res. Rec. 2019, 2673, 165–175. [Google Scholar] [CrossRef]
- Zis, T.; Psaraftis, H.N. Operational measures to mitigate and reverse the potential modal shifts due to environmental legislation. Marit. Policy Manag. 2018, 46, 117–132. [Google Scholar] [CrossRef]
- Fagerholt, K.; Psaraftis, H.N. On two speed optimization problems for ships that sail in and out of emission control areas. Transp. Res. D Transp. Environ. 2015, 39, 56–64. [Google Scholar] [CrossRef]
- Ronen, D. The effect of oil price on the optimal speed of ships. J. Oper. Res. Soc. 1982, 33, 1035–1040. [Google Scholar] [CrossRef]
- Doudnikoff, M.; Lascoste, R. Effect of a speed reduction of containerships in response to high energy costs in sulphur emission control areas. Transp. Res. D Transp. Environ. 2014, 28, 51–61. [Google Scholar] [CrossRef]
- Zis, T.; North, R.J.; Angeloudis, P.; Ochieng, W.Y. Environmental balance of shipping emissions reduction strategies. Transp. Res. Rec. 2015, 2479, 25–33. [Google Scholar] [CrossRef]
- Adland, R.; Fonnes, G.; Jia, H.; Lampe, O.D.; Strandenes, S.P. The impact of regional environmental regulations on empirical vessel speeds. Transp. Res. D Transp. Environ. 2017, 53, 37–49. [Google Scholar] [CrossRef]
- Zhen, L.; Li, M.; Hu, Z.; Lv, W.; Zhao, X. The effects of emission control area regulations on cruise shipping. Transp. Res. D Transp. Environ. 2018, 62, 47–63. [Google Scholar] [CrossRef]
- Chen, L.; Yip, T.L.; Mou, J. Provision of Emission Control Area and the impact on shipping route choice and ship emissions. Transp. Res. Part D Transp. Environ. 2018, 58, 280–291. [Google Scholar] [CrossRef]
- Patricksson, Ø.; Erikstad, S.O. A two-stage optimization approach for sulphur emission regulation compliance. Marit. Policy Manag. 2017, 44, 94–111. [Google Scholar] [CrossRef]
- Bergqvist, R.; Turesson, M.; Weddmark, A. Sulphur emission control areas and transport strategies-the case of Sweden and the forest industry. Eur. Transp. Res. Rev. 2015, 7, 10. [Google Scholar] [CrossRef]
- Zis, T.; Psaraftis, H.N. The implications of the new sulphur limits on the European Ro-Ro sector. Transp. Res. D Transp. Environ. 2017, 52, 185–201. [Google Scholar] [CrossRef]
- Guo, Z.; Zhang, D.; Liu, H.; He, Z.; Shi, L. Green transportation scheduling with pickup time and transport mode selections using a novel multi-objective memetic optimization approach. Transp. Res. D Transp. Environ. 2018, 60, 137–152. [Google Scholar] [CrossRef]
- Corbett, J.; Wang, H.; Winebrake, J. The effectiveness and costs of speed reductions on emissions from international shipping. Transp. Res. D Transp. Environ. 2009, 14, 593–598. [Google Scholar] [CrossRef]
- Kim, J.-G.; Kim, H.-J.; Lee, P.T.-W. Optimising containership speed and fleet size under a carbon tax and an emission trading scheme. Int. J. Shipp. Trans. Logist. 2013, 5, 571–590. [Google Scholar] [CrossRef]
- Wen, M.; Pacino, D.; Kontovas, C.A.; Psaraftis, H.N. A multiple ship routing and speed optimization problem under time, cost and environmental objectives. Transp. Res. D Transp. Environ. 2017, 52, 303–321. [Google Scholar] [CrossRef]
- Psaraftis, H.N.; Kontovas, C.A. Balancing the economic and environmental performance of maritime transportation. Transp. Res. D Transp. Environ. 2010, 15, 458–462. [Google Scholar] [CrossRef]
- Wong, E.; Tai, A.; Lau, H.; Raman, M. An utility-based decision support sustainability model in slow steaming maritime operations. Transp. Res. Part E Logist. Transp. Rev. 2015, 78, 57–69. [Google Scholar] [CrossRef]
- Cheaitou, A.; Cariou, P. Greening of maritime transportation: A multi-objective optimization approach. Ann. Oper. Res. 2019, 273, 501–525. [Google Scholar] [CrossRef]
- Mansouri, S.A.; Lee, H.; Aluko, O. Multi-objective decision support to enhance environmental sustainability in maritime shipping: A review and future directions. Transp. Res. Part E Logist. Transp. Rev. 2015, 78, 3–18. [Google Scholar] [CrossRef]
- Barrass, C.B. Ship Design and Performance for Masters and Mates; Butterworth-Heinemann: Oxford, UK, 2004; pp. 228–234. [Google Scholar] [CrossRef]
- Psaraftis, H.N.; Kontovas, C.A. Speed models for energy-efficient maritime transportation: A taxonomy and survey. Transp. Res. C Emerg. Technol. 2013, 26, 331–351. [Google Scholar] [CrossRef]
- Koza, D.F. Liner shipping service scheduling and cargo allocation. Eur. J. Oper. Res. 2019, 275, 897–915. [Google Scholar] [CrossRef]
- Wang, S.; Meng, Q. Sailing speed optimization for container ships in a liner shipping network. Transp. Res. Part E Logist. Transp. Rev. 2012, 48, 701–714. [Google Scholar] [CrossRef]
- Cariou, P.; Cheaitou, A. The effectiveness of a European speed limit versus an international bunker-levy to reduce CO2 emissions from container shipping. Transp. Res. D Transp. Environ. 2012, 17, 116–123. [Google Scholar] [CrossRef]
- Trawind Shipping Logistics. Available online: http://www.trawind.com/en/index.php?p=global_shipping&lanmu=13&f_id=26&c_id=68 (accessed on 24 January 2019).
- Bunkerworld, Bunker Prices in Shanghai. Available online: www.bunkerworld.com/prices/ (accessed on 20 December 2018).
- Portdalian. Available online: http://www.dlport.cn/ (accessed on 20 December 2018).
- Portguangzhou. Available online: http://www.gzpgroup.com/ (accessed on 20 December 2018).
- Clarksons. Available online: https://sin.clarksons.net/Timeseries/Advanced (accessed on 12 January 2019).
- Sheng, D.; Meng, Q.; Li, Z. Optimal vessel speed and fleet size for industrial shipping services under the emission control area regulation. Transp. Res. C Emerg. Technol. 2019, 105, 37–53. [Google Scholar] [CrossRef]
- Psaraftis, H.N.; Kontovas, C.A. Ship speed optimization-concepts, models and combined speed-routing scenarios. Transp. Res. C Emerg. Technol. 2014, 44, 52–69. [Google Scholar] [CrossRef]
- Shipxy. Available online: http://report.shipxy.com/rtv/home.html?flag=3 (accessed on 24 January 2019).
- Caramia, M.; Dell’Olmo, P. Multi-Objective Management in Freight Logistics: Increasing Capacity, Service Level and Safety with Optimization Algorithms; Springer: New York, NY, USA, 2008. [Google Scholar] [CrossRef]
Figure 1.
Map of the emission control area (ECA) and possible routes.
Figure 1.
Map of the emission control area (ECA) and possible routes.
Figure 2.
Profit and carbon emissions as functions of vessel speed.
Figure 2.
Profit and carbon emissions as functions of vessel speed.
Figure 3.
Profit and carbon emissions as functions of X and vessel speed.
Figure 3.
Profit and carbon emissions as functions of X and vessel speed.
Figure 4.
Different objectives and scenarios.
Figure 4.
Different objectives and scenarios.
Figure 5.
The Pareto frontiers of and .
Figure 5.
The Pareto frontiers of and .
Figure 6.
The values of and under different scenarios.
Figure 6.
The values of and under different scenarios.
Figure 7.
The profit and carbon emissions under different scenarios.
Figure 7.
The profit and carbon emissions under different scenarios.
Figure 8.
Speed decisions under different scenarios.
Figure 8.
Speed decisions under different scenarios.
Figure 9.
Route decisions under different scenarios.
Figure 9.
Route decisions under different scenarios.
Figure 10.
Profit of different vessels under different scenarios.
Figure 10.
Profit of different vessels under different scenarios.
Figure 11.
Carbon emissions of different vessels under different scenarios.
Figure 11.
Carbon emissions of different vessels under different scenarios.
Figure 12.
Speed inside the ECA of different vessels under different scenarios.
Figure 12.
Speed inside the ECA of different vessels under different scenarios.
Figure 13.
Speed outside the ECA of different vessels under different scenarios.
Figure 13.
Speed outside the ECA of different vessels under different scenarios.
Figure 14.
Distance ratio of different vessels under different scenarios.
Figure 14.
Distance ratio of different vessels under different scenarios.
Figure 15.
Optimal speed as functions of marine gas oil–heavy fuel oil (MGO–HFO) price spread.
Figure 15.
Optimal speed as functions of marine gas oil–heavy fuel oil (MGO–HFO) price spread.
Figure 16.
Distance ratio with different MGO–HFO price spreads and weighting coefficients.
Figure 16.
Distance ratio with different MGO–HFO price spreads and weighting coefficients.
Table 1.
A list of the notations.
Table 1.
A list of the notations.
| Input Parameters: |
| A | Lightship weight, ton |
| C | Cost per ton-nautical-mile, USD |
| Fuel cost inside the ECA, USD |
| Fuel cost outside the ECA, USD |
| Fuel cost in ports |
| Daily cost, time charter equivalent (TCE) |
| E | Carbon emissions per ton-nautical-mile, ton |
| Load factor of the auxiliary engine, % |
| Load factor of the main engine, % |
| Carbon emissions factor of the MGO |
| Carbon emissions factor of the HFO |
| Daily fuel consumption of the auxiliary engine, ton/day |
| Daily fuel consumption of the main engine, ton/day |
| Daily fuel consumption of the main engine at the design speed, ton/day |
| Daily fuel consumption of the main engine inside the ECA, ton/day |
| Daily fuel consumption of the main engine outside the ECA, ton/day |
| MGO consumption, ton |
| HFO consumption, ton |
| L | Distance of the voyage, nautical mile |
| P | Profit per ton-nautical-mile, USD |
| MGO bunker price |
| HFO bunker price |
| Auxiliary engine power, kW |
| Main engine power, kW |
| R | The total revenue per voyage, USD |
| The amount of fuel used per kWh of the auxiliary engine, g/kWh |
| The amount of fuel used per kWh of the main engine, g/kWh |
| The sailing time inside ECA, day |
| The sailing time outside ECA, day |
| The time spent in ports, day |
| V | Design speed, knot |
| W | Vessel load, ton |
| The loading efficiency in the origin port, ton/h |
| The loading efficiency in the destination port, ton/h |
| The cargo handling charge in the origin port, USD/ton |
| The cargo handling charge in the destination port, USD/ton |
| Decision Variables: |
| The speed inside the ECA, knot |
| The speed outside the ECA, knot |
| X | The ratio of the distance outside the ECA to the distance of the voyage (the distance ratio) |
Table 2.
The main parameters of the vessel.
Table 2.
The main parameters of the vessel.
| Parameters | Value |
| Cargo capacity | 57,025 dwt |
| Lightship weight (A) | 10,900 tons |
| Main engine power () | 9480 kW |
| Auxiliary engine power () | 2160 kW |
| Load factor of the main engine () | 80% |
| Load factor of the auxiliary engine () | 50% |
| The amount of fuel used per kWh of the main engine () | 165 g/kWh |
| The amount of fuel used per kWh of the auxiliary engine () | 225 g/kWh |
| Design speed (V) | 14.2 knots |
Table 3.
The parameters of different vessels.
Table 3.
The parameters of different vessels.
| Vessel Type | Cargo Capacity (dwt) | Lightship Weight (tons) | Design Speed (knots) | Main Engine Power (kW) | SFOCM (g/kWh) |
|---|
| Panamax bulker | 88,291 | 12,000 | 14 | 12,268 | 172 |
| Handymax bulker | 57,025 | 10,900 | 14.2 | 9480 | 165 |
| Handy-size bulker | 33,945 | 8480 | 14.5 | 7135 | 173 |
| 29,540 | 8005 | 14 | 7135 | 173 |
| Neo-Panamax containership | 120,445 (8530 TEU) | 30,036 | 25 | 49,000 | 168 |
| Intermediate containership | 68,191 (5446 TEU) | 24,621 | 24.5 | 43,097 | 166 |
| Feeder containership | 35,038 (2742 TEU) | 12,725 | 21.5 | 21,770 | 172 |
Table 4.
Suggested tradeoffs for different vessels.
Table 4.
Suggested tradeoffs for different vessels.
| Vessel Type | Cargo Capacity (dwt) | Scenario | Choice of “Suggested wp” |
|---|
| Panamax bulker | 88,291 | HFHL | 0.39 |
| HFLL | 0.29 |
| LFHL | 0.55 |
| LFLL | 0.46 |
| Handymax bulker | 57,025 | HFHL | 0.33 |
| HFLL | 0.39 |
| LFHL | 0.56 |
| LFLL | 0.35 |
| Handy-size bulker | 33,945 | HFHL | 0.30 |
| HFLL | 0.46 |
| LFHL | 0.45 |
| LFLL | 0.40 |
| 29,540 | HFHL | 0.38 |
| HFLL | 0.47 |
| LFHL | 0.40 |
| LFLL | 0.41 |
| Neo-Panamax containership | 120,445 (8530 TEU) | HFHL | 0.43 |
| HFLL | 0.34 |
| LFHL | 0.58 |
| LFLL | 0.54 |
| Intermediate containership | 68,191 (5446 TEU) | HFHL | 0.41 |
| HFLL | 0.26 |
| LFHL | 0.56 |
| LFLL | 0.47 |
| Feeder containership | 35,038 (2742 TEU) | HFHL | 0.23 |
| HFLL | 0.41 |
| LFHL | 0.48 |
| LFLL | 0.35 |
© 2019 by the authors. Licensee MDPI, Basel, Switzerland. This article is an open access article distributed under the terms and conditions of the Creative Commons Attribution (CC BY) license (http://creativecommons.org/licenses/by/4.0/).
