1. Introduction
Around the world, one hundred and sixty-three countries and territories with a total forest area of 3.7 billion ha. recently reported that about 2.2 billion ha. are intended to be maintained under permanent forest land use. Of these, close to 1 billion ha. are found in the tropics [
1]. The rich biodiversity of these areas and the many roles they play in the functioning of the Earth system at local, regional and global scales, are the reason behind the effort of maintaining these areas for permanent forest use [
2]. Of the world’s major tropical forest regions, most research and policy attention has focused upon the Amazon Region; whereas, the tropical forests of Central and West Africa, which constitute world’s second largest tropical forest region, have been relatively neglected [
3].
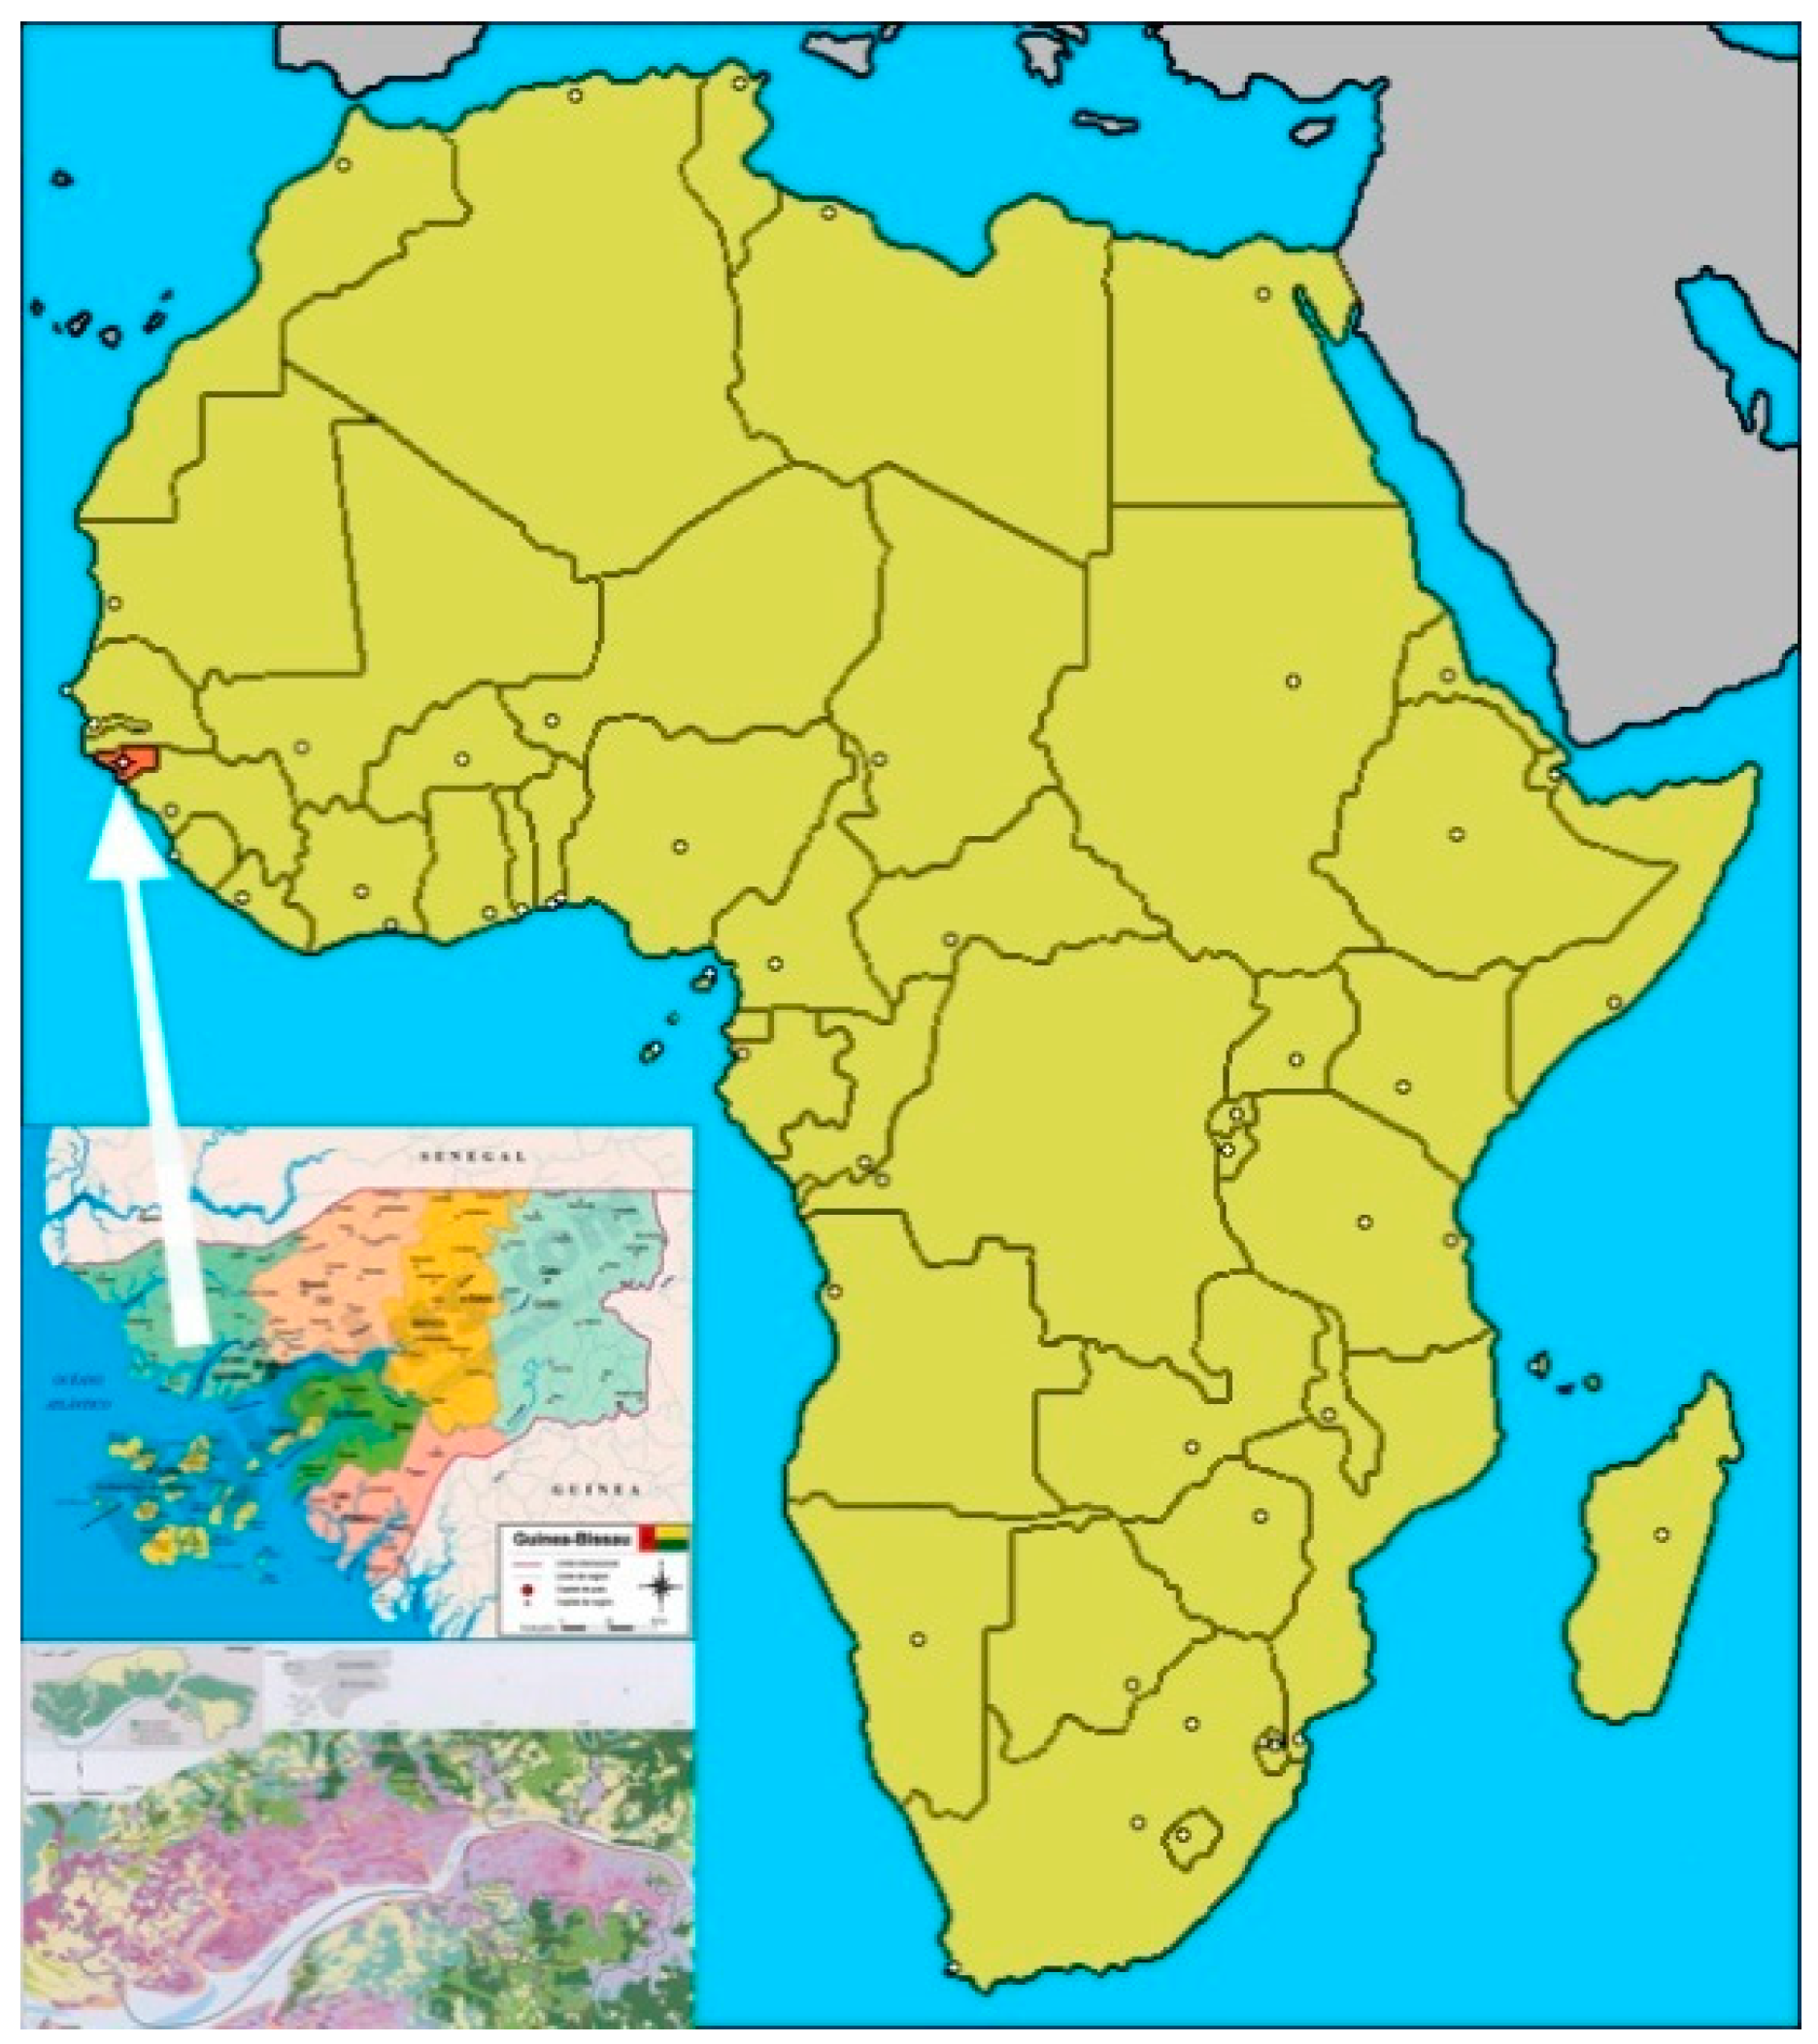
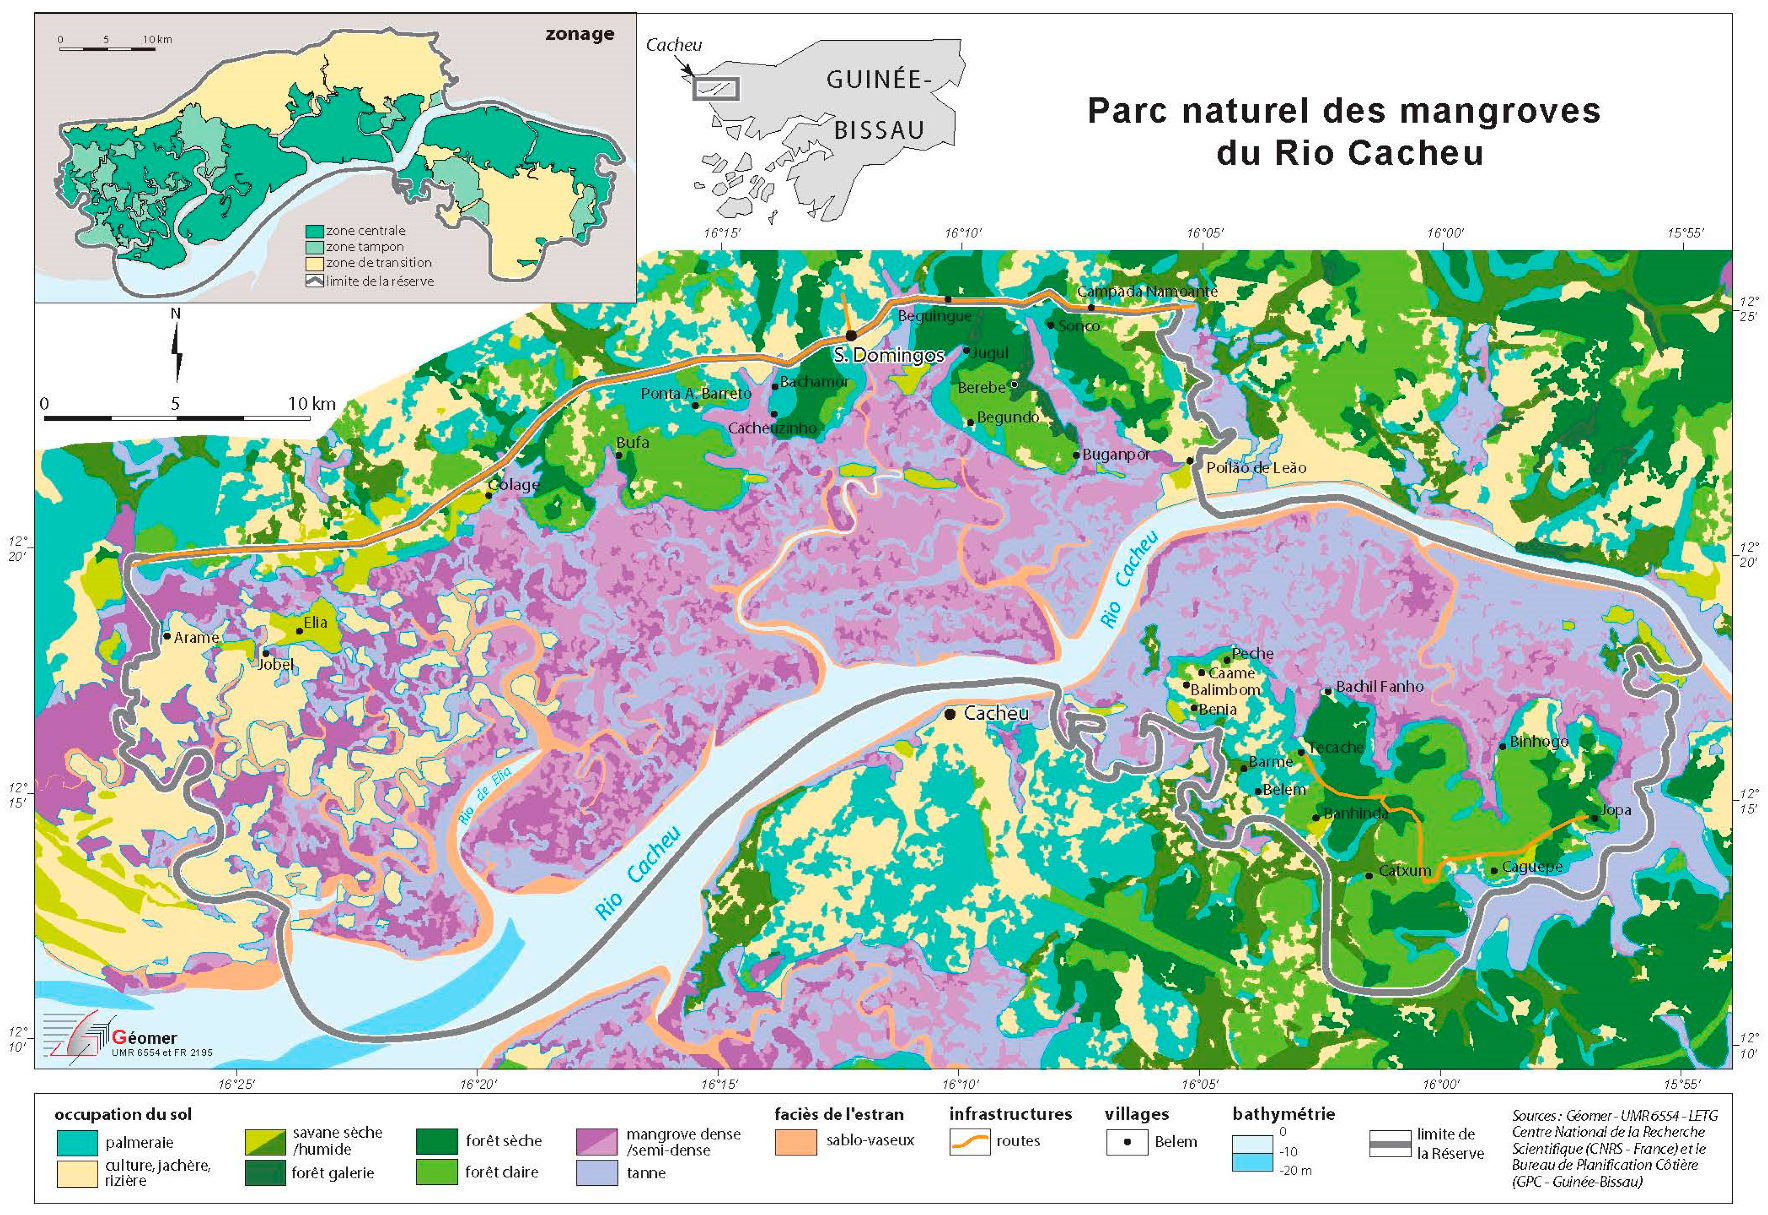
The Natural Park of the Mangroves of the Cacheu River in Guinea-Bissau is one of the most extensive mangrove areas of West Africa, and its importance for nature conservation was stablished during the 1980s by the Guinean authorities and the World Conservation Union [
4,
5]. Furthermore, this area was included in the RAMSAR list in 2015 (after Ramsar a city in Iran, wherein the 1971 Ramsar Convention was signed) [
6]. The great environmental relevance, in addition to the particular socio-economic conditions of the area, make it especially vulnerable and in need of conservation. For these reasons, the Cacheu River Natural Park was chosen as the area of study. This area was stablished as a Natural Park in 2000 [
5]. The park is located in northwest Guinea-Bissau, between 12°10’–12°25’ N and 15°55’–16°27’ W. Its location is shown in
Figure 1 and
Figure 2.
The park’s total vegetation extends across an area of 88,615 ha., 68% of which is covered by mangals. Mangroves are a group of trees and shrubs, mostly evergreen, which have convergently theoretically evolved physiological and morphologically to adapt to shallow, intertidal environments [
7].
These shrubs or small trees grow at the interface between land and sea in tropical and sub-tropical latitudes, where they exist in conditions of high salinity (halophytes) and harsh coastal conditions, such as extreme tides, strong winds and high temperatures [
8]. They are also adapted to the low oxygen conditions of waterlogged mud [
9]. Mangroves stand out for the important ecological work that they perform [
10]:
They form a protective barrier against tsunamis and tidal waves [
11,
12] due to the stability created by the complex framework of their roots. In addition, the aerial part, made up of stems and branches that form a tall, dense canopy, is a natural barrier against wind erosion and protection against hurricane-force winds.
The roots of the tree and shrub species function like a green filter, neutralizing pollutants, such as heavy metals and toxic compounds [
13]. They therefore purify the waters of rivers and effluents from surrounding settlements and small industries.
They form mating and breeding areas, and the habitat for the juvenile stages of many coastal pelagic fish, mollusks, crustaceans, echinoderms and annelids, whose habitats in the adult stages are areas of phanerogams, marshes, coastal lagoons and inland fresh water [
14]. Approximately 70% of the organisms captured at sea carry out part of their life cycle in a mangrove swamp or coastal lagoon [
15]. The great variety of species to which the mangals are home make up a complicated trophic network, maintaining a large number of reptile and bird species, some of which are endangered.
They are important carbon sinks, and produce large amounts of oxygen, which they return to the atmosphere [
16]. Furthermore, as they are effective CO
2 fixers, and also because of the redox reactions they carry out on nitrous oxide, one of the main greenhouse gases, they are a palliative against climate change [
17].
They regulate the flow of rainwater and reduce the effects of flooding [
11].
The mangroves are a source of obtaining medicinal plants for the populations that inhabit them [
18].
All these aspects provide the rationale as to why community-based mangrove management has been advocated by both academia and governing agencies and emphasize [
19] the need for sustainably managing the mangrove forests, which are unfortunately disappearing rapidly worldwide [
20].
The mangals in this Guinea-Bissau Natural Park include the following species: Rhizophora racemosa, Rhizophora mangle, Rhizophora harrisonii and Avicennia germinans, Laguncularia racemose, Canocarpus erectus and Machaerium lunatum) [
21]. Associated with this forest, we also find animal species such as the hippopotamus (
Hippopotamus amphibius), Nile crocodile (
Crocodylus niloticus) and the manatee (
Trichechus spp.). The park also provides shelter for a large number of birds [
22].
In addition to mangals, the area of study also contains large areas of palm forest, savannah and paddies, mixed with small population centers, where the cashew crop stands out [
4].
The palm forest area is made up of various species:
Pterocarpus erinaceus,
Dialium guineense,
Khaya senegalensis,
Parinari excelsa,
Landolphia spp. and
Elaesis guineensis [
21]. Of these, the last one—
Elaesis guineensis—is the most important, as its seeds produce a highly prized vegetable oil widely used in different industrial sectors.
The savannah area constitutes the smallest association in the park. It is made up of gramineous plants from different genera, most notably
Panicum,
Hypoltenio and
Melinis [
23]. There is a scattering of acacias (
Acacia arabica,
Acacia senegal and
Acacia catechu).
The paddy area is the result of Portuguese colonization, as the Portuguese colonists introduced this crop [
24]. In recent years, they appear to have expanded considerably due to the increase in population in the area of the natural park [
25,
26].
This paper focuses on studying the changes in land cover and the evolution of vegetation in the Cacheu River Mangroves Natural Park between the years 2010 and 2017. The study is aimed at evaluating the sustainability of the natural park, particularly of the mangrove area, based upon the above-mentioned changes over time.
2. Materials and Methods
There are different types of remotely-sensed data and several methods to analyze it that can be used to assess changes in land cover [
27]. For the present study, vegetation indices were used to quantify the biomass in the Cacheu River Natural Park, its current state, and its evolution over time [
28] with the purpose of evaluating its sustainability according to the current exploitation. These vegetation indices are calculated from digital images resulting from the processing of satellite data.
Specifically, the Normalized Difference Vegetation Index (NDVI) was chosen for the present research because it is the index that demonstrates a more homogeneous behavior with respect to different types of plant cover [
29]. In addition, previous studies carried out in different areas of Asia corroborate the effectiveness of using the NDVI for the determination of mangrove forests, which are a key vegetation type in the area of study [
30,
31,
32].
The NDVI is also an excellent indicator of plant health; a high value for this index means vigorous growth, while a low index indicates unhealthy plants [
28].
The NDVI is calculated based on the data corresponding to the red and near-infrared channels of the TERRA (Latin for Earth) satellite by means of its Advanced Spaceborne Thermal Emission and Reflection Radiometer (ASTER) sensor [
33].
The cartographic data used in the study were based on military maps, which are on the Universal Transverse Mercator coordinate system (UTM) and International ellipsoid. The distance between contour lines is 10 meters. The sheets necessary to produce the mosaic map are those shown in
Table 1 below.
The ASTER images corresponding to the park and the period studied were also required. The image search was done using the ASTER-LANDSAT-USGS-Globalvis catalog [
33].
The ASTER scenes were chosen based on the following selection criteria:
Cloud percentage: 0%
Images covering the entire area of the park
Search period: January 2008–December 2017
Time of year: Spring, as this is the period when the vegetation is in its optimum state.
As a result of this search using the criteria described above, a total of 21 scenes were obtained.
The first ASTER scenes of the park that could be obtained were from July 2008, but they were discarded because they covered a very limited area of the park and the cloud percentage was very high. Expanding the search range to 2010 and discarding the two scenes from 2008, it was only possible to select five scenes, of which just three were valid, given that they were from similar dates and also covered the entirety of the Cacheu River Park.
Therefore, the main determining factor when selecting the year in which to begin the study and the time of year, was the availability of adequate ASTER scenes for the park.
Once the appropriate material, country maps and ASTER images were selected, the NDVIs were calculated. The first step consisted of georeferencing the map sheets, based on the 1/50,000 scale country map sheets shown in
Table 1. These were processed to create the mosaic used as a base to make up the park. The modus operandi is laid out below:
Preparation of the map sheets;
Cutting the 1/50,000 sheets;
Geometric correction of the sheets;
Creation of the mosaic map from all the 1/50,000 sheets that make up the entire Cacheu River Park.
Once the map sheets of the park had been georeferenced, a vector file was created based on the map downloaded from the RAMSAR site [
6]. This was then digitized and georeferenced.
The next step in obtaining the vegetation indices involved the processing of the ASTER images from the TERRA satellite. This consisted of:
Having properly processed the ASTER images for the area under study, the ASTER mosaics were created for the years 2010 and 2017, and the NDVI for each ASTER scene was calculated. Next, the statistics for each of the plots were obtained for each of the classes considered.
In order to concentrate the results in the Cacheu River Natural Park, each mosaic was cut along the park vector. Next, the attributes of each resulting image were edited based on the criteria for designating categories and colors shown in
Table 2.
3. Results
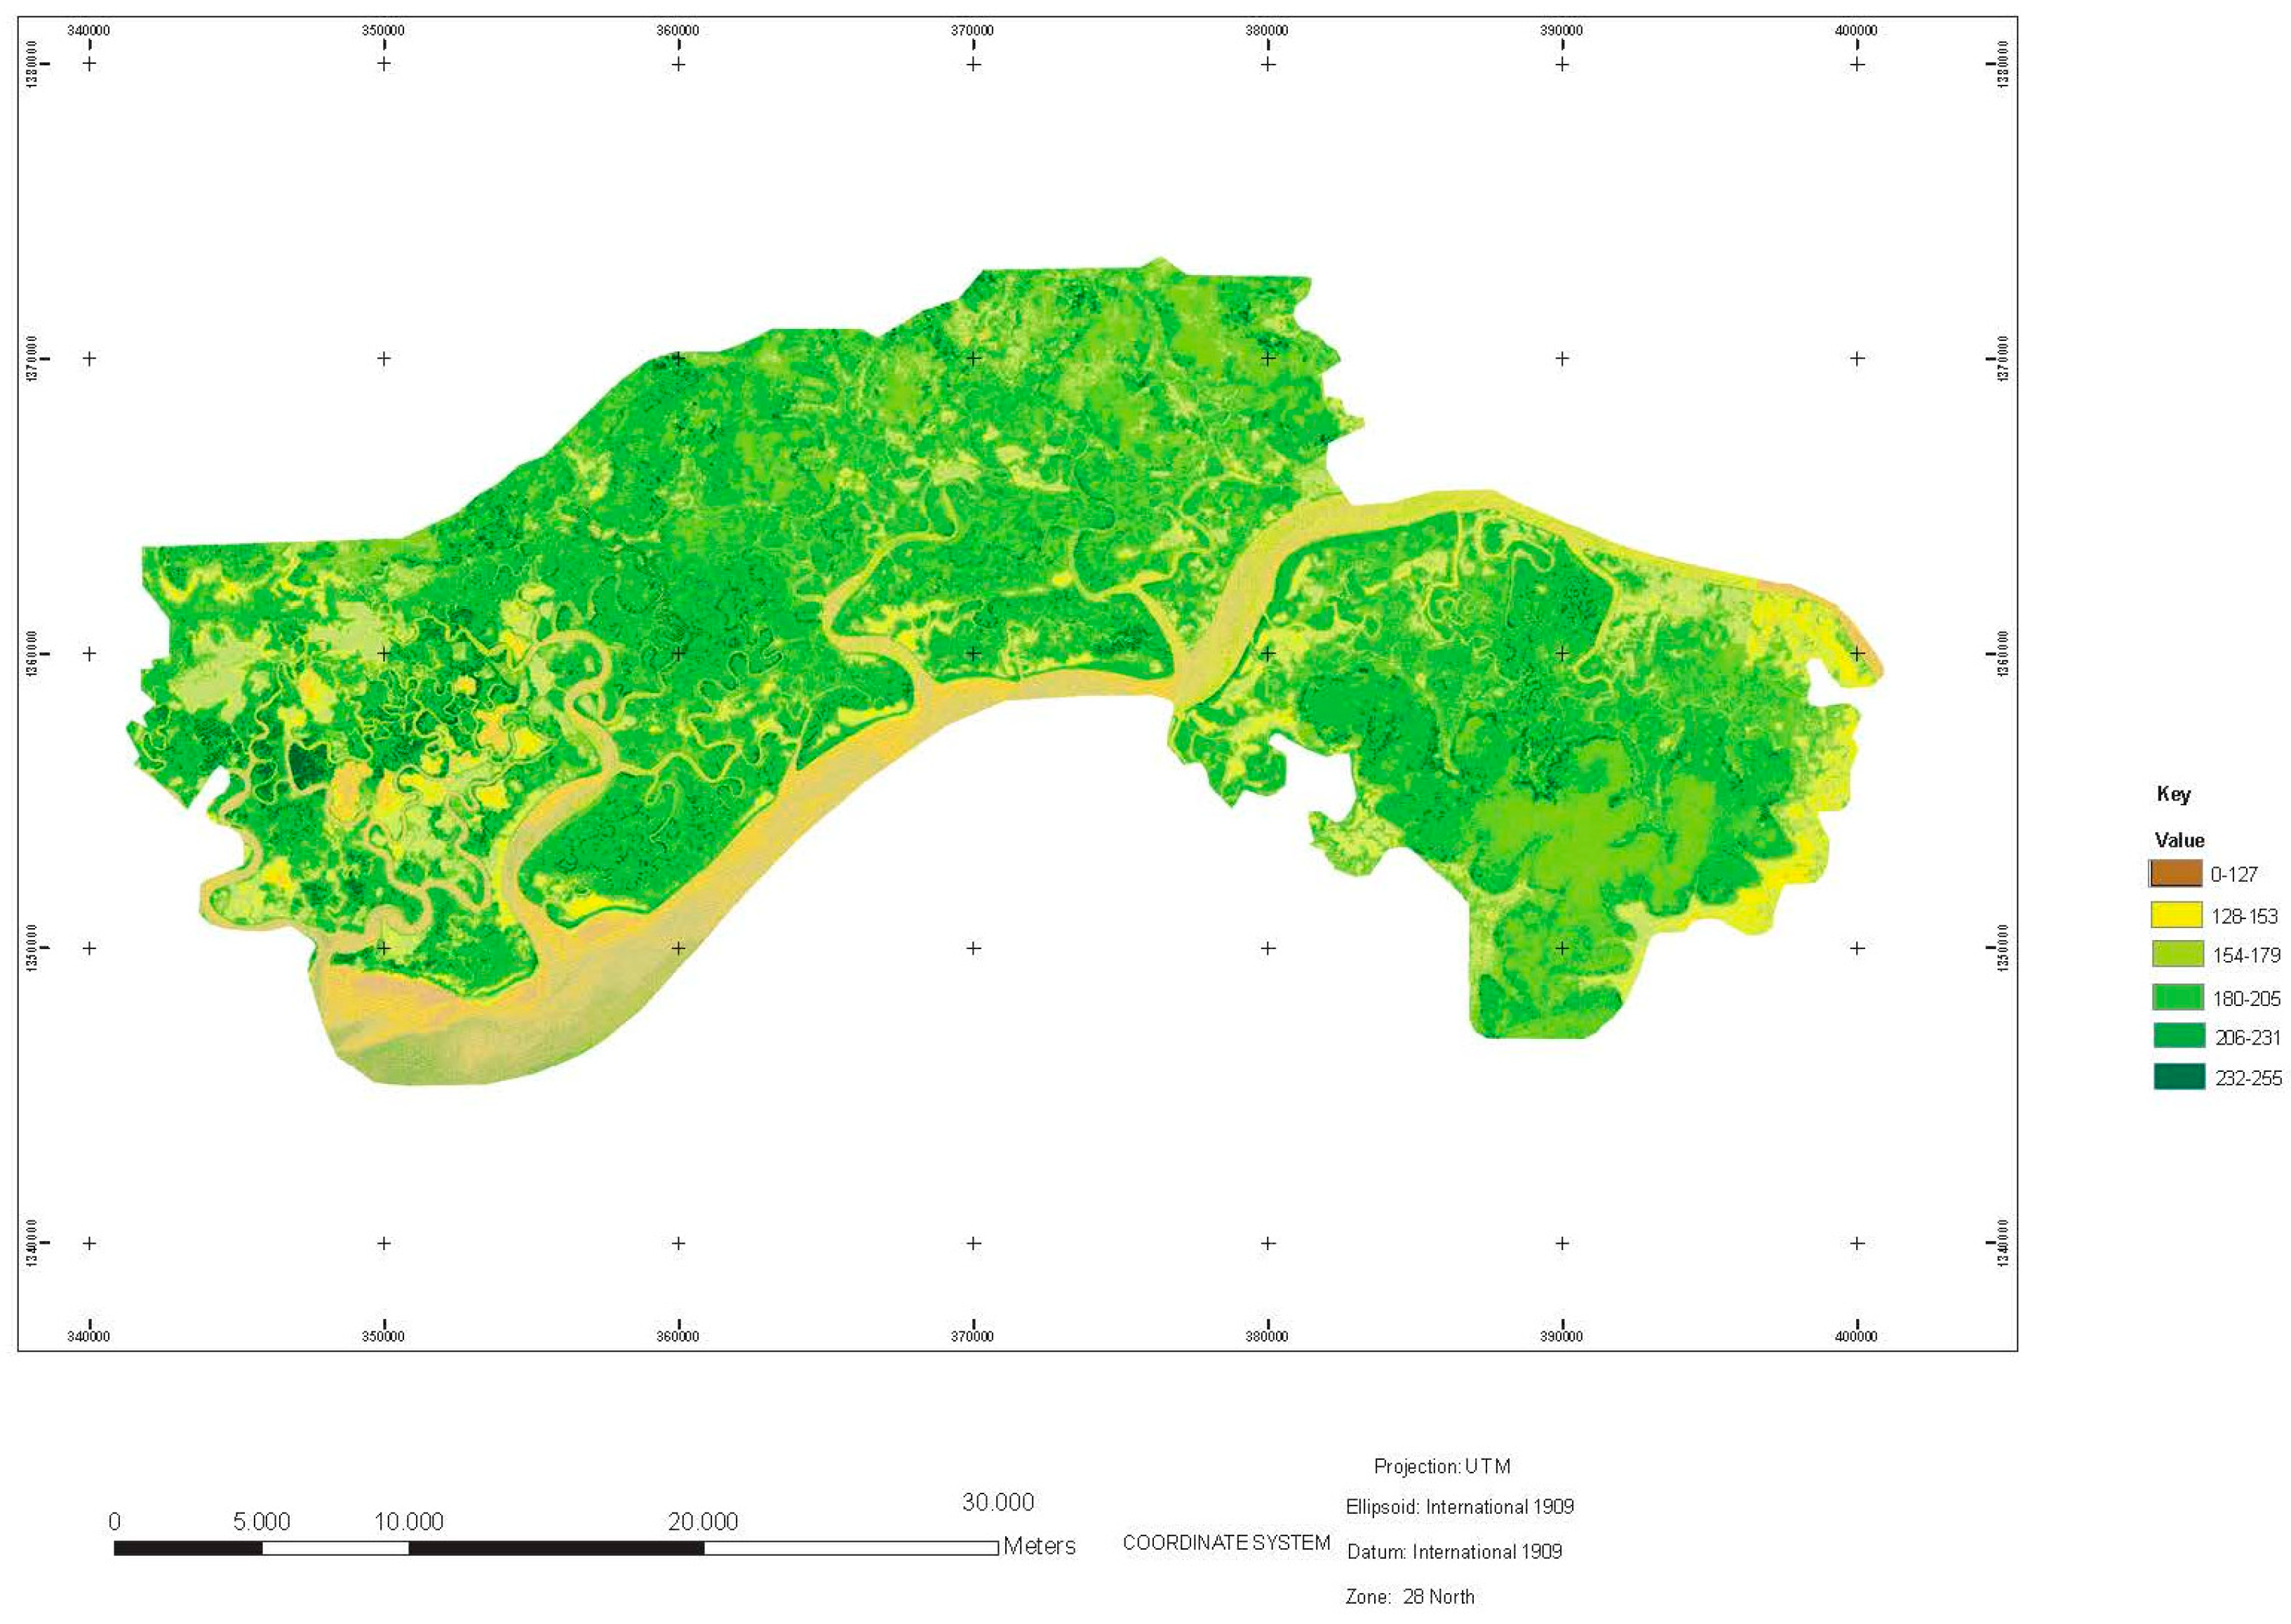
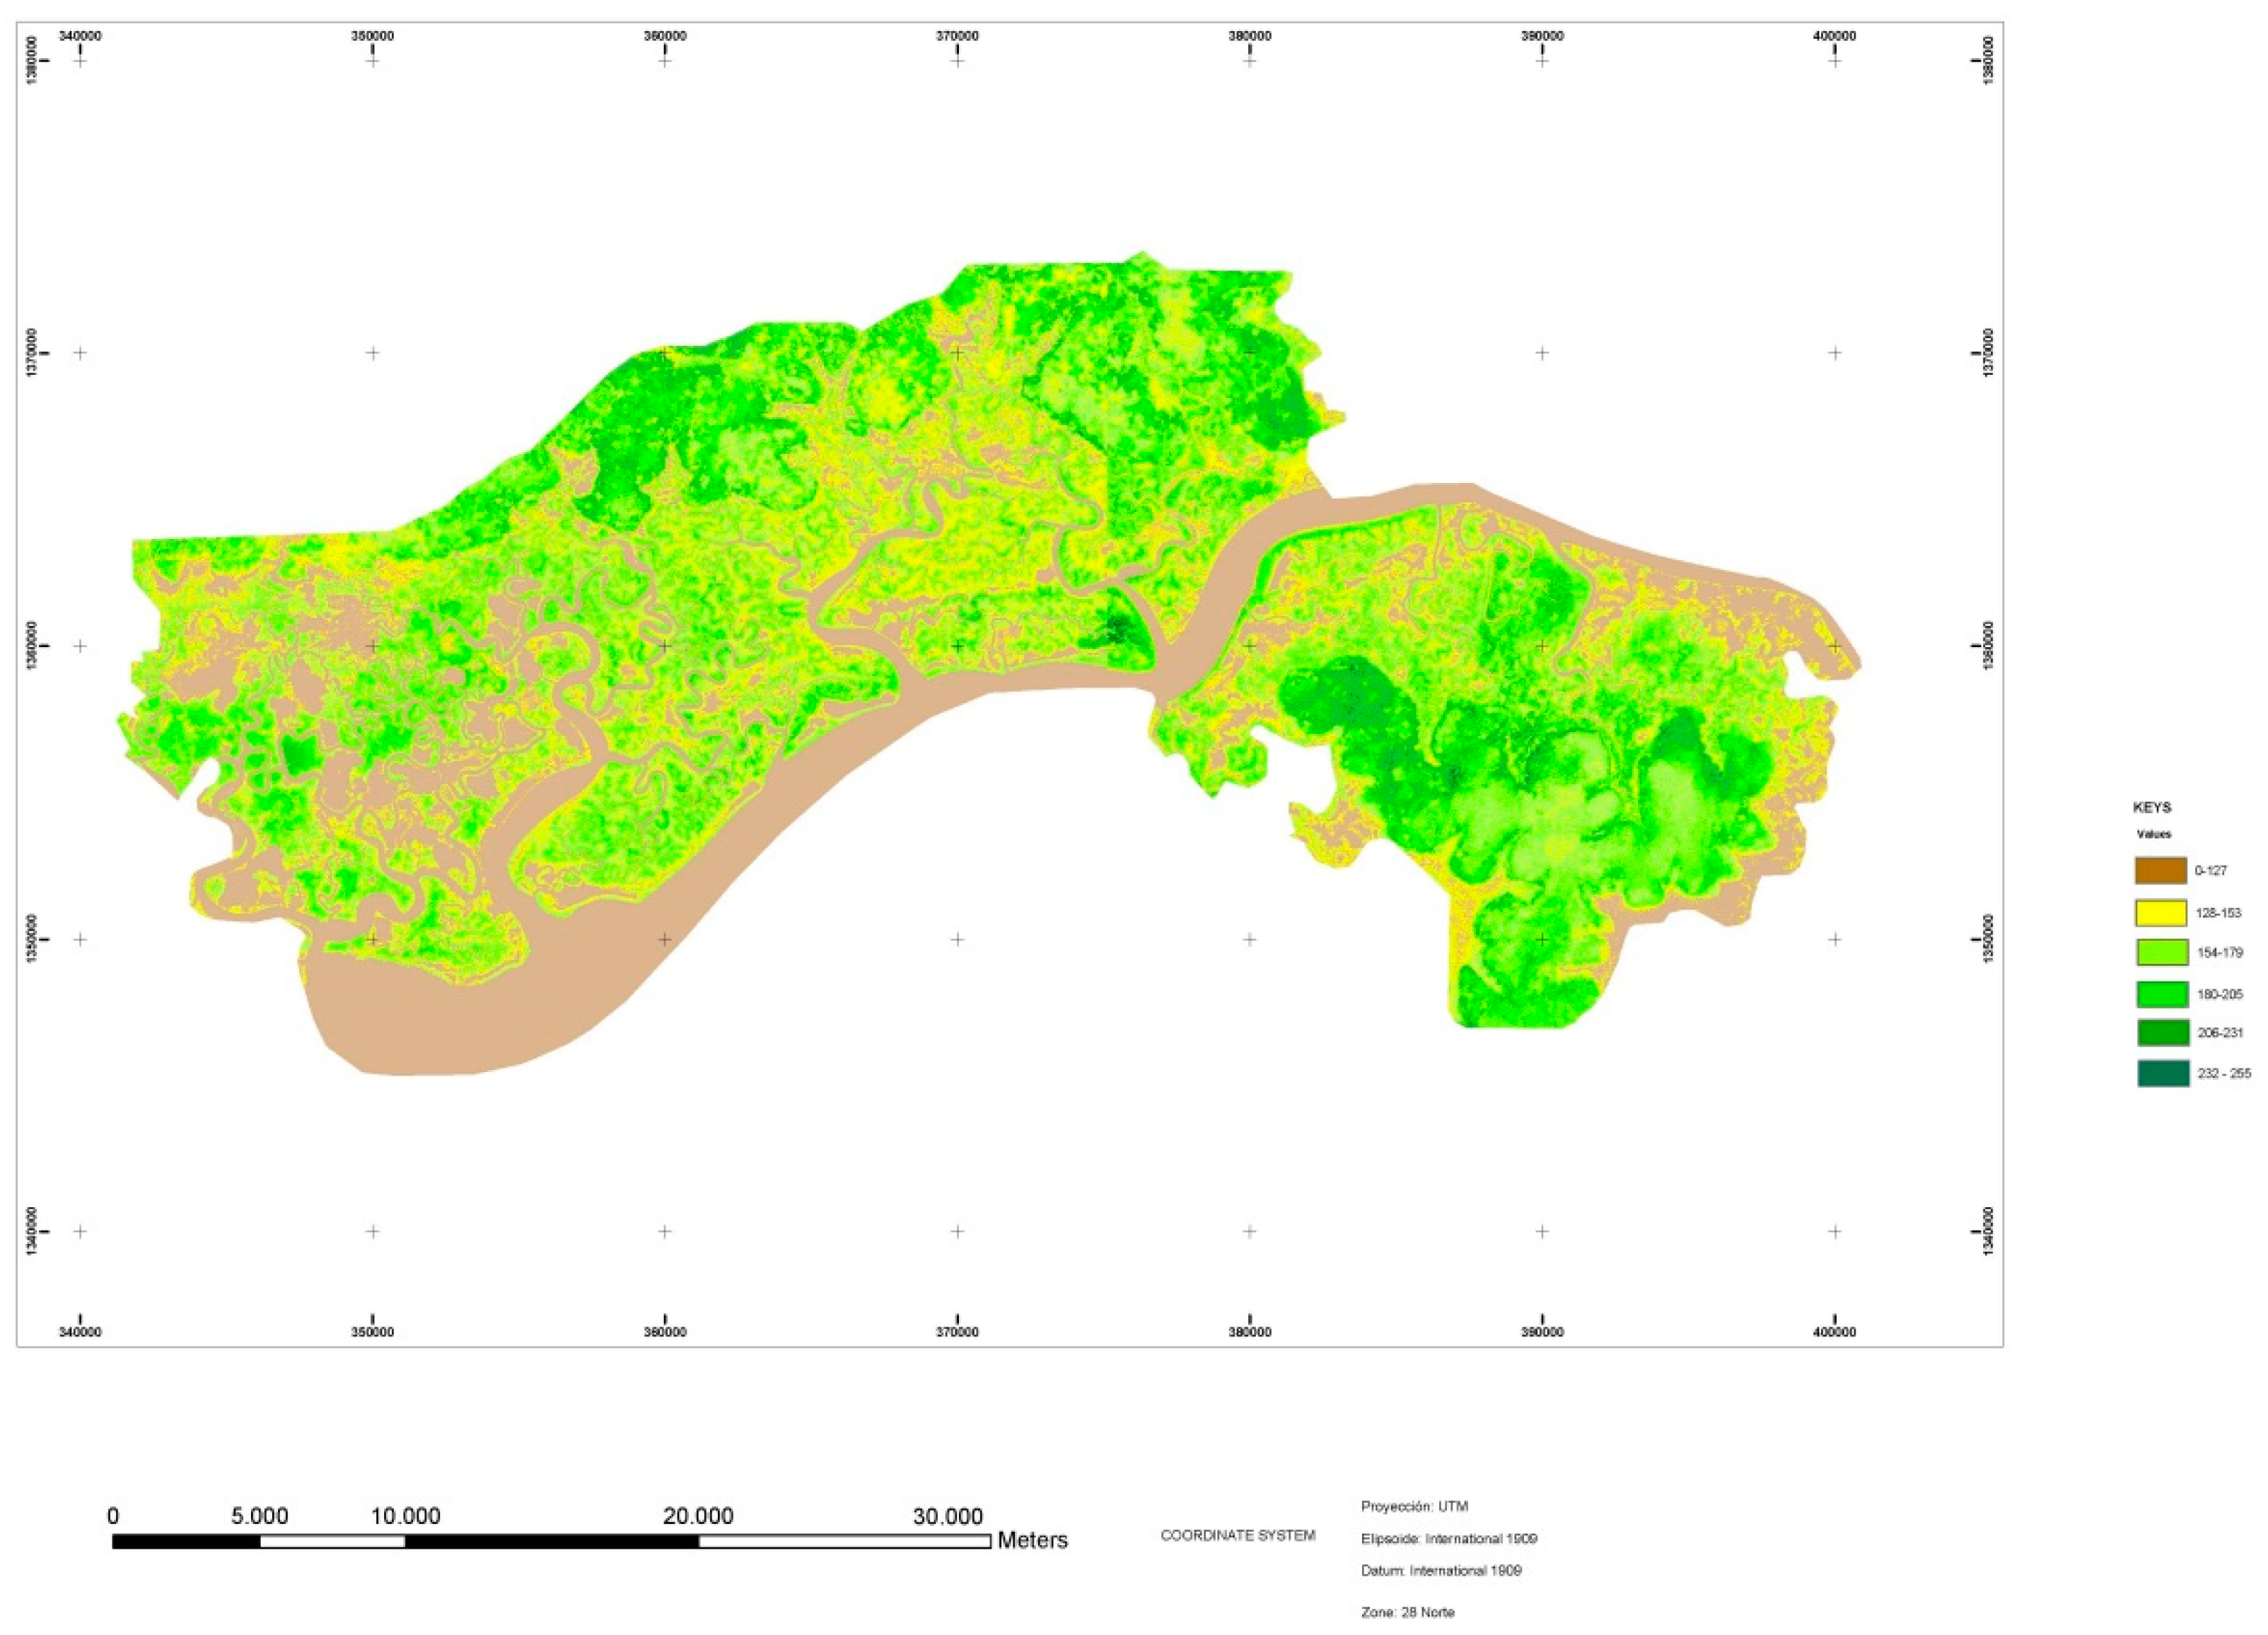
The resulting images, edited with the appropriate NDVI color coding based on the calculations made, are shown below as
Figure 3 and
Figure 4.
Comparing the colors on the figures obtained, it is clear that the vegetation has undergone changes during the time of study. To confirm this, statistical calculations were performed on the ASTER scene mosaics with NDVI for the years 2010 and 2017.
The statistical variables analyzed were the maximum and minimum value, mean, median, mode and standard deviation of the vegetation index.
The statistical calculations were first applied to the entire area of the park, as shown in
Table 3. This gave us an overview of what happened in the entire park over the course of the period studied.
The overall NDVIs for the park for each year studied confirm what it was already possible to see in the ASTER images: The vegetation has undergone significant changes. The general trend observed is a decrease in the vegetation indices through the period studied. This indicates that, generally, the areas covered by vegetation have decreased.
Same calculations were subsequently done for each of the selected areas with the different vegetation types, using stratified statistical sampling. Ten plots of each vegetation type were digitized, except for savannahs, for which only five plots were available. Results per plot and year are presented in the sections below.
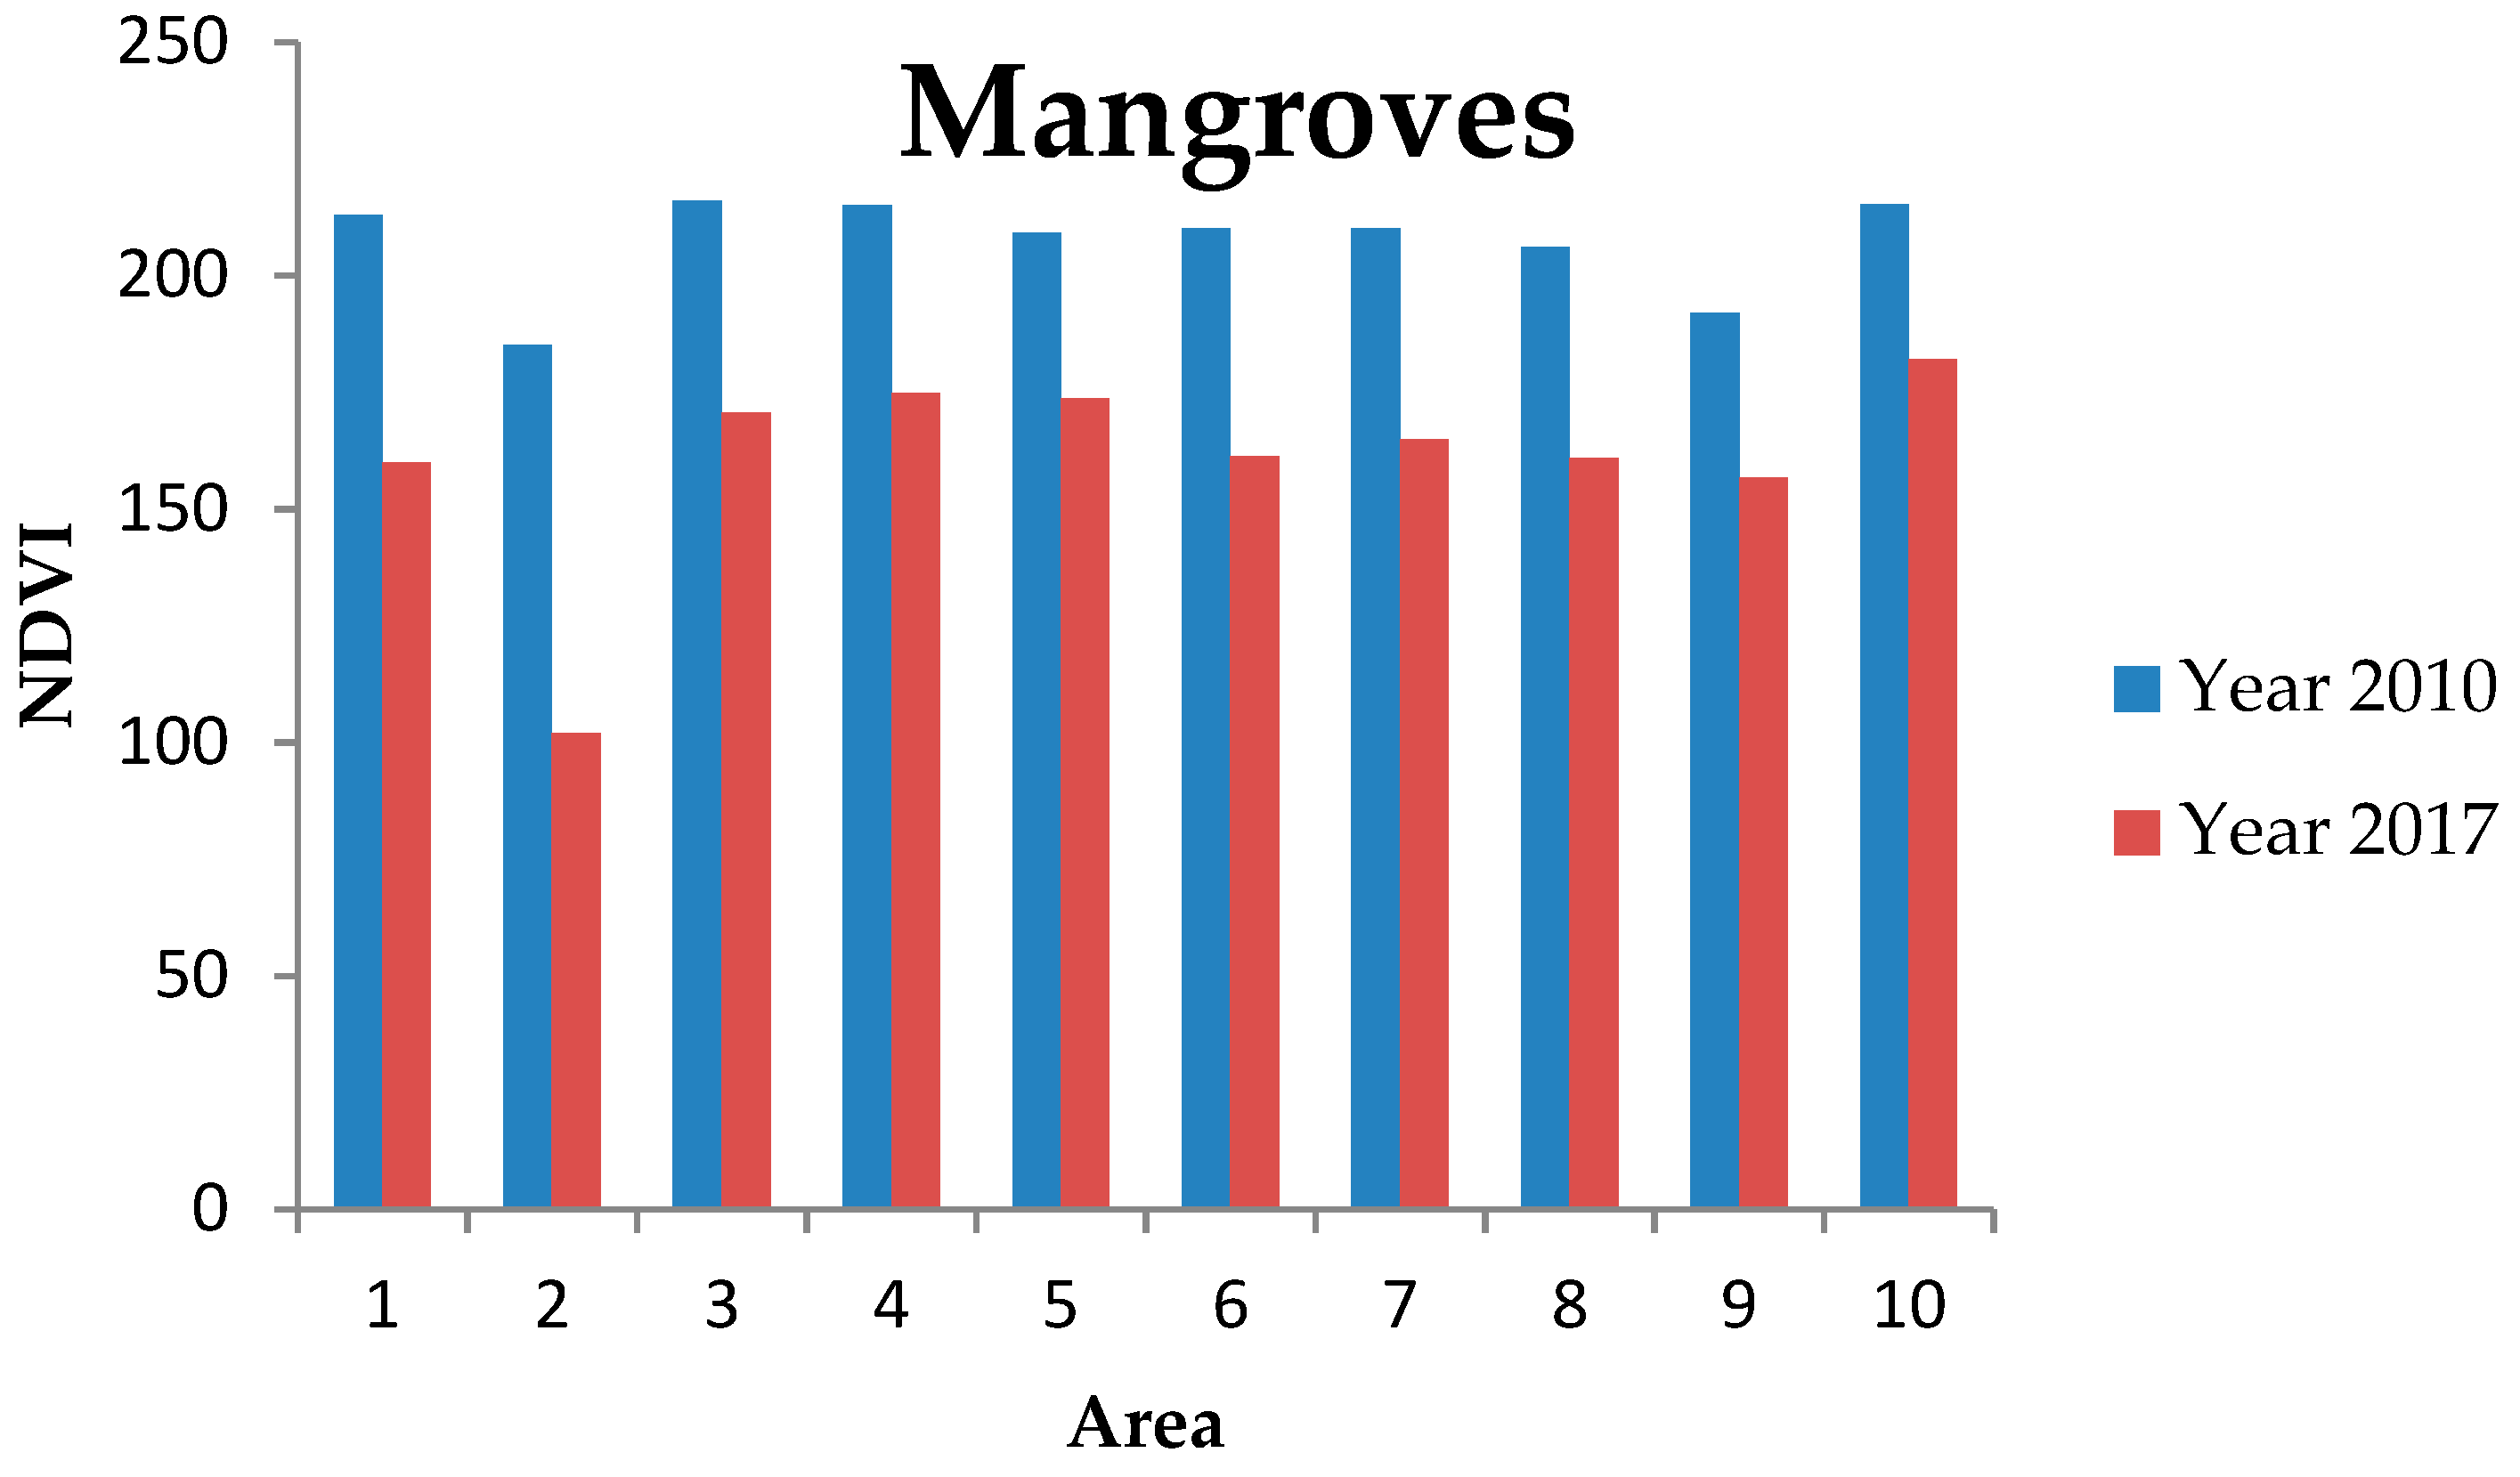
3.1. Mangals
For all of the plots, a decrease in NDVI was observed in the mangal area between 2010 and 2017. This decrease can be seen in
Table 4 and
Figure 5.
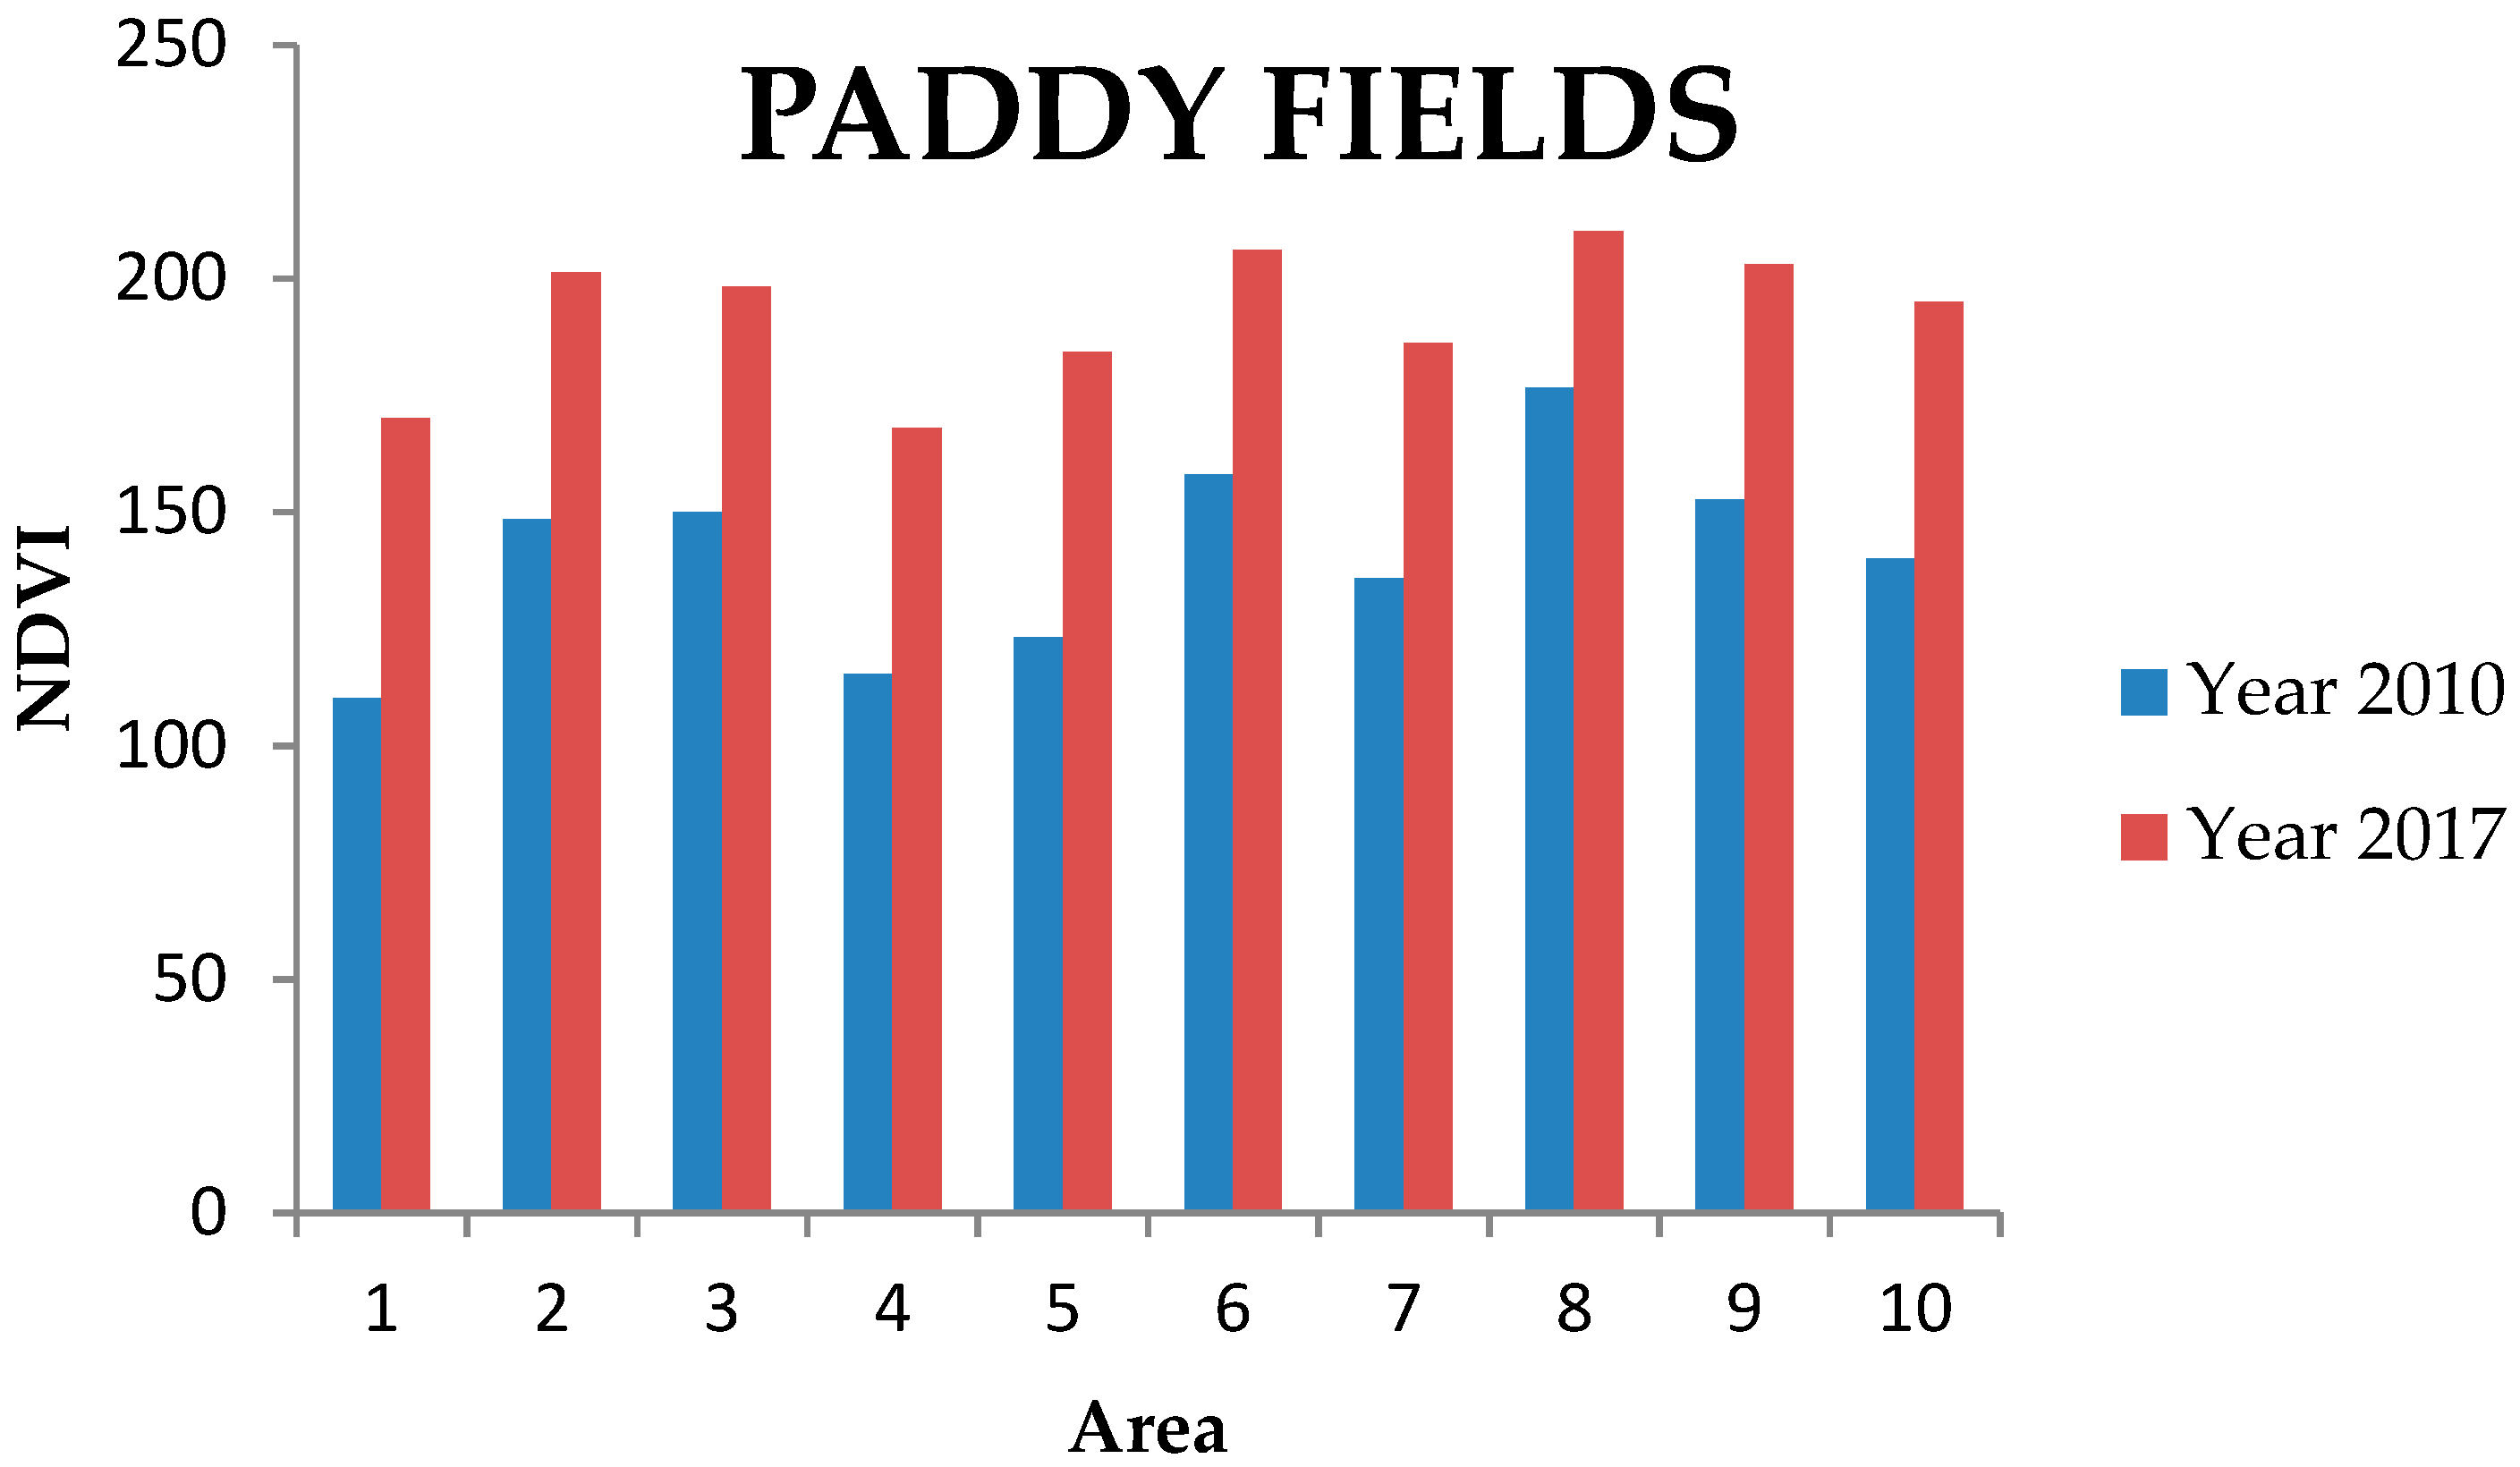
3.2. Paddies
In
Table 5 and
Figure 6 can be seen that the NDVI index has increased for the paddy class, which implies that the biomass in this area has increased over the period of time that has been studied.
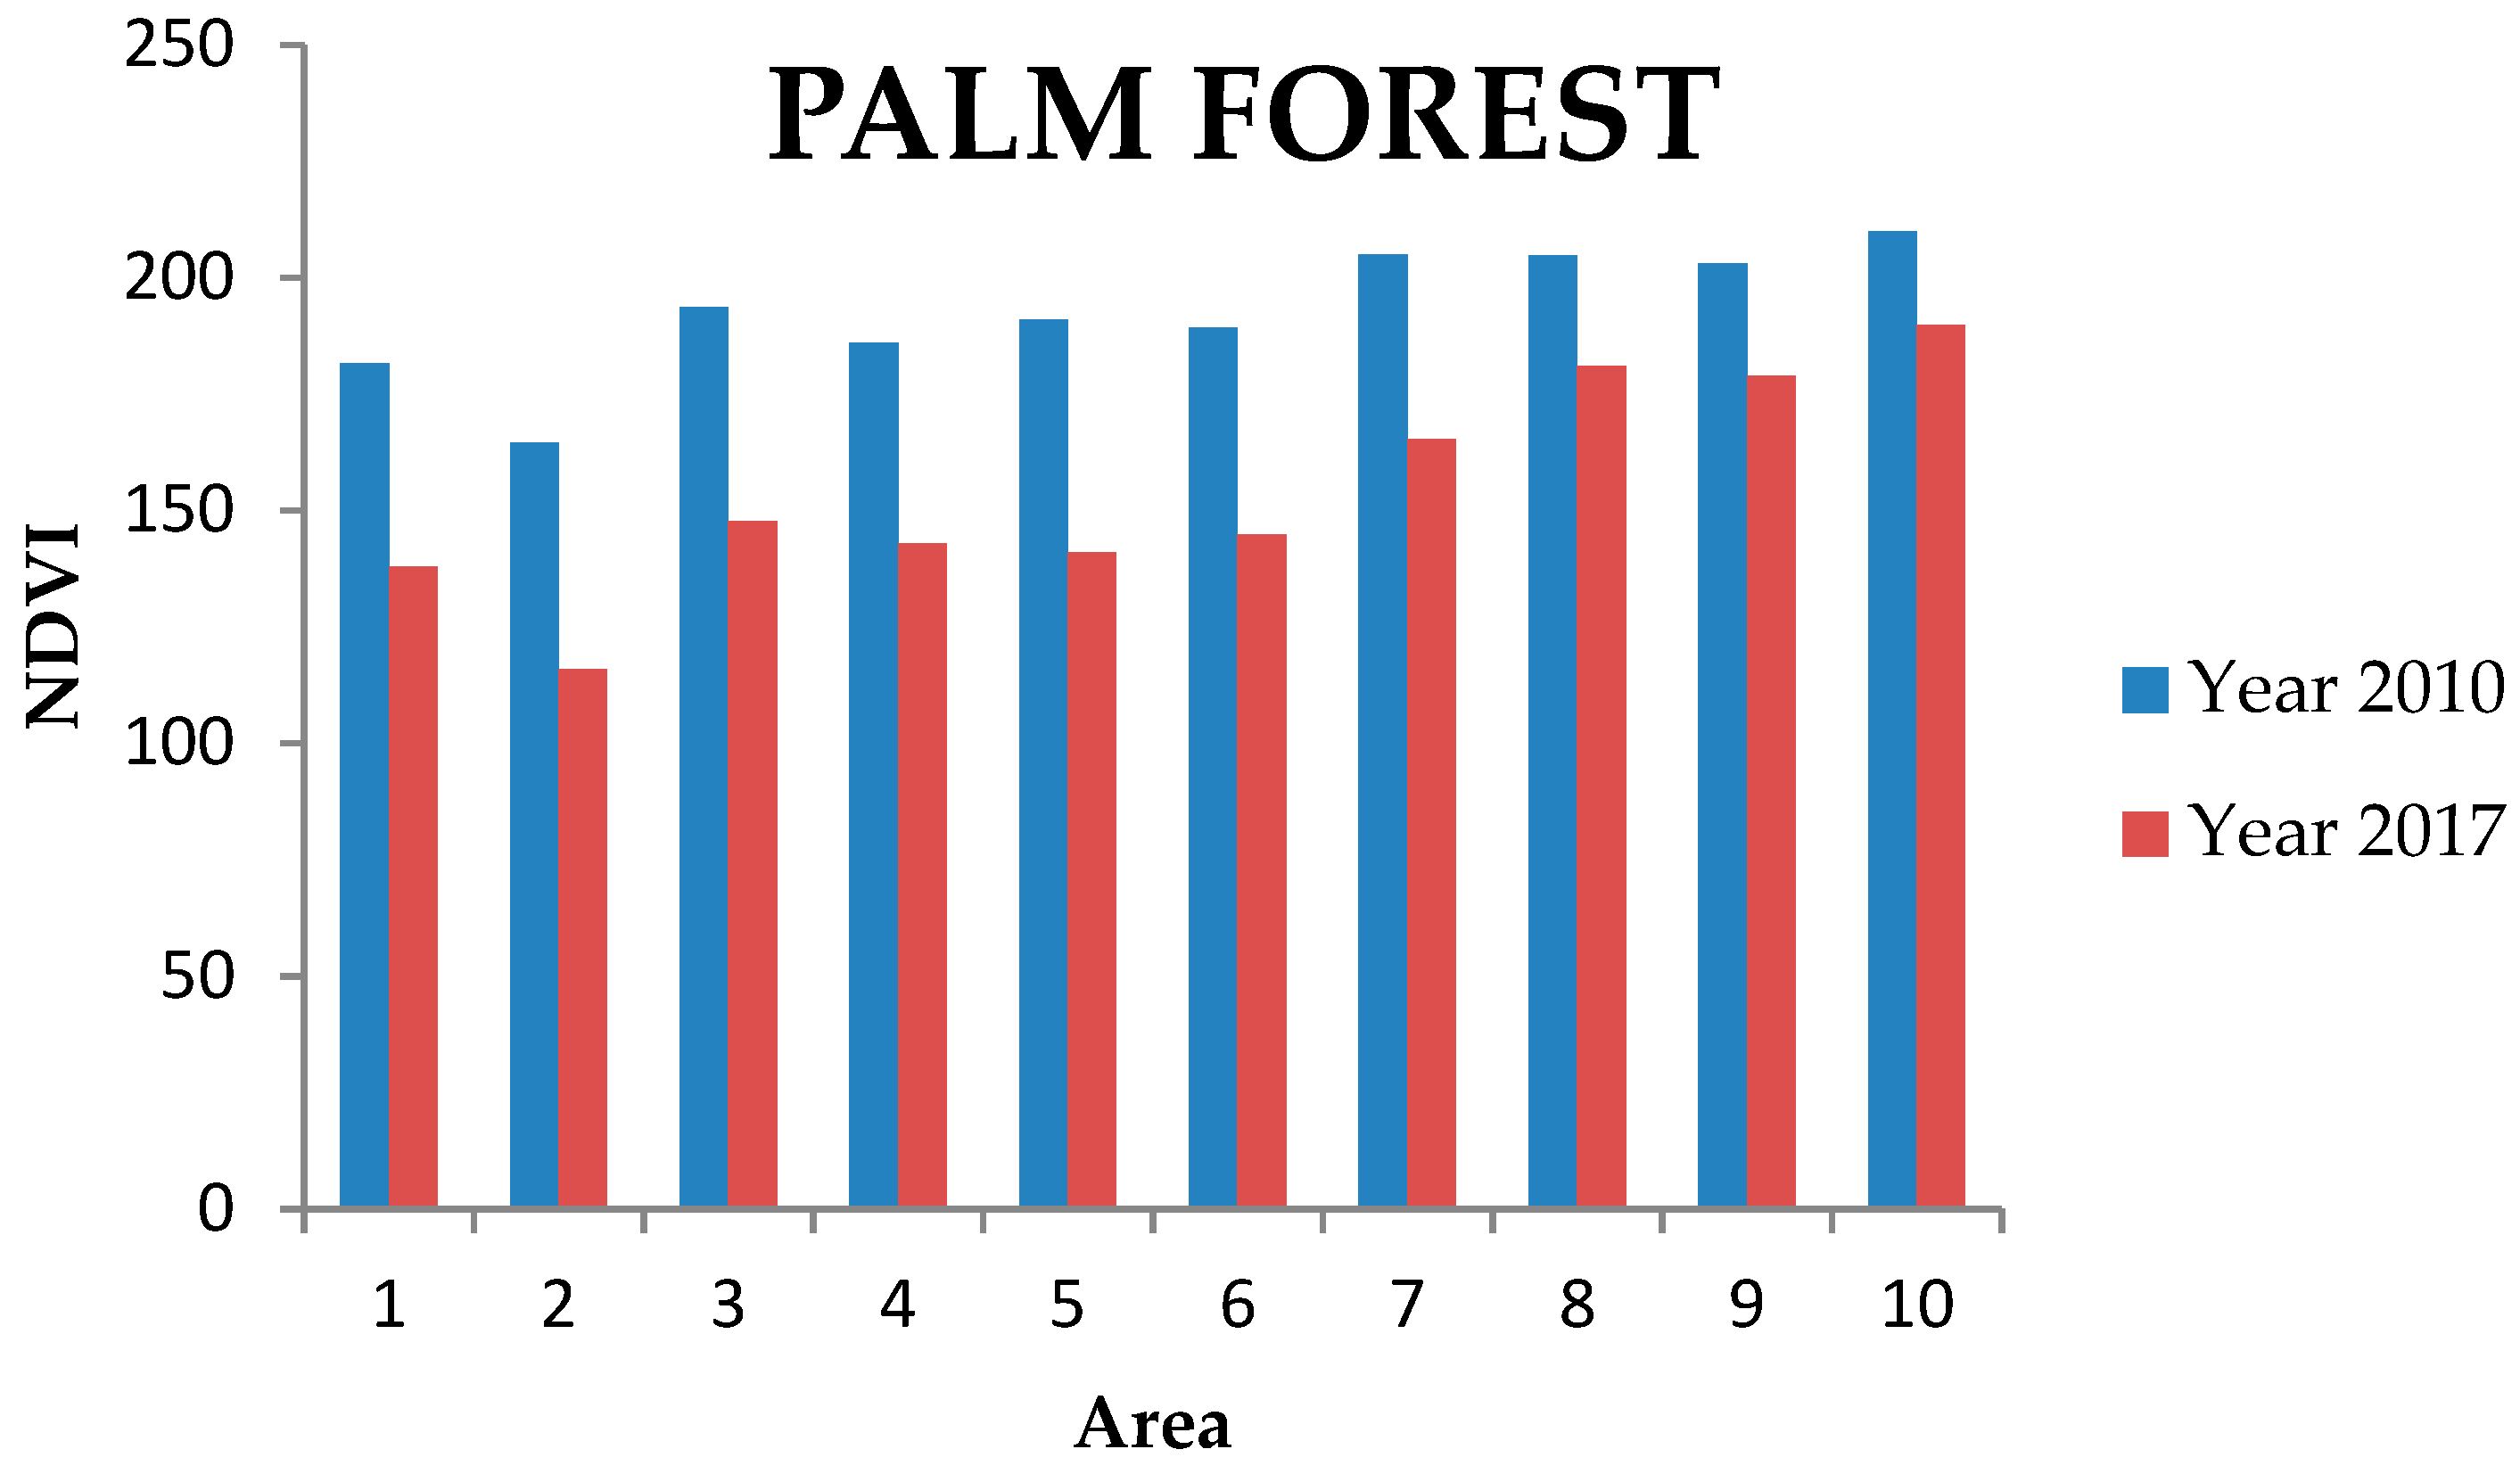
3.3. Palm Forest
Table 6 and
Figure 7 show that the vegetation index for the palm forest area has been decreased on all plots during the period studied.
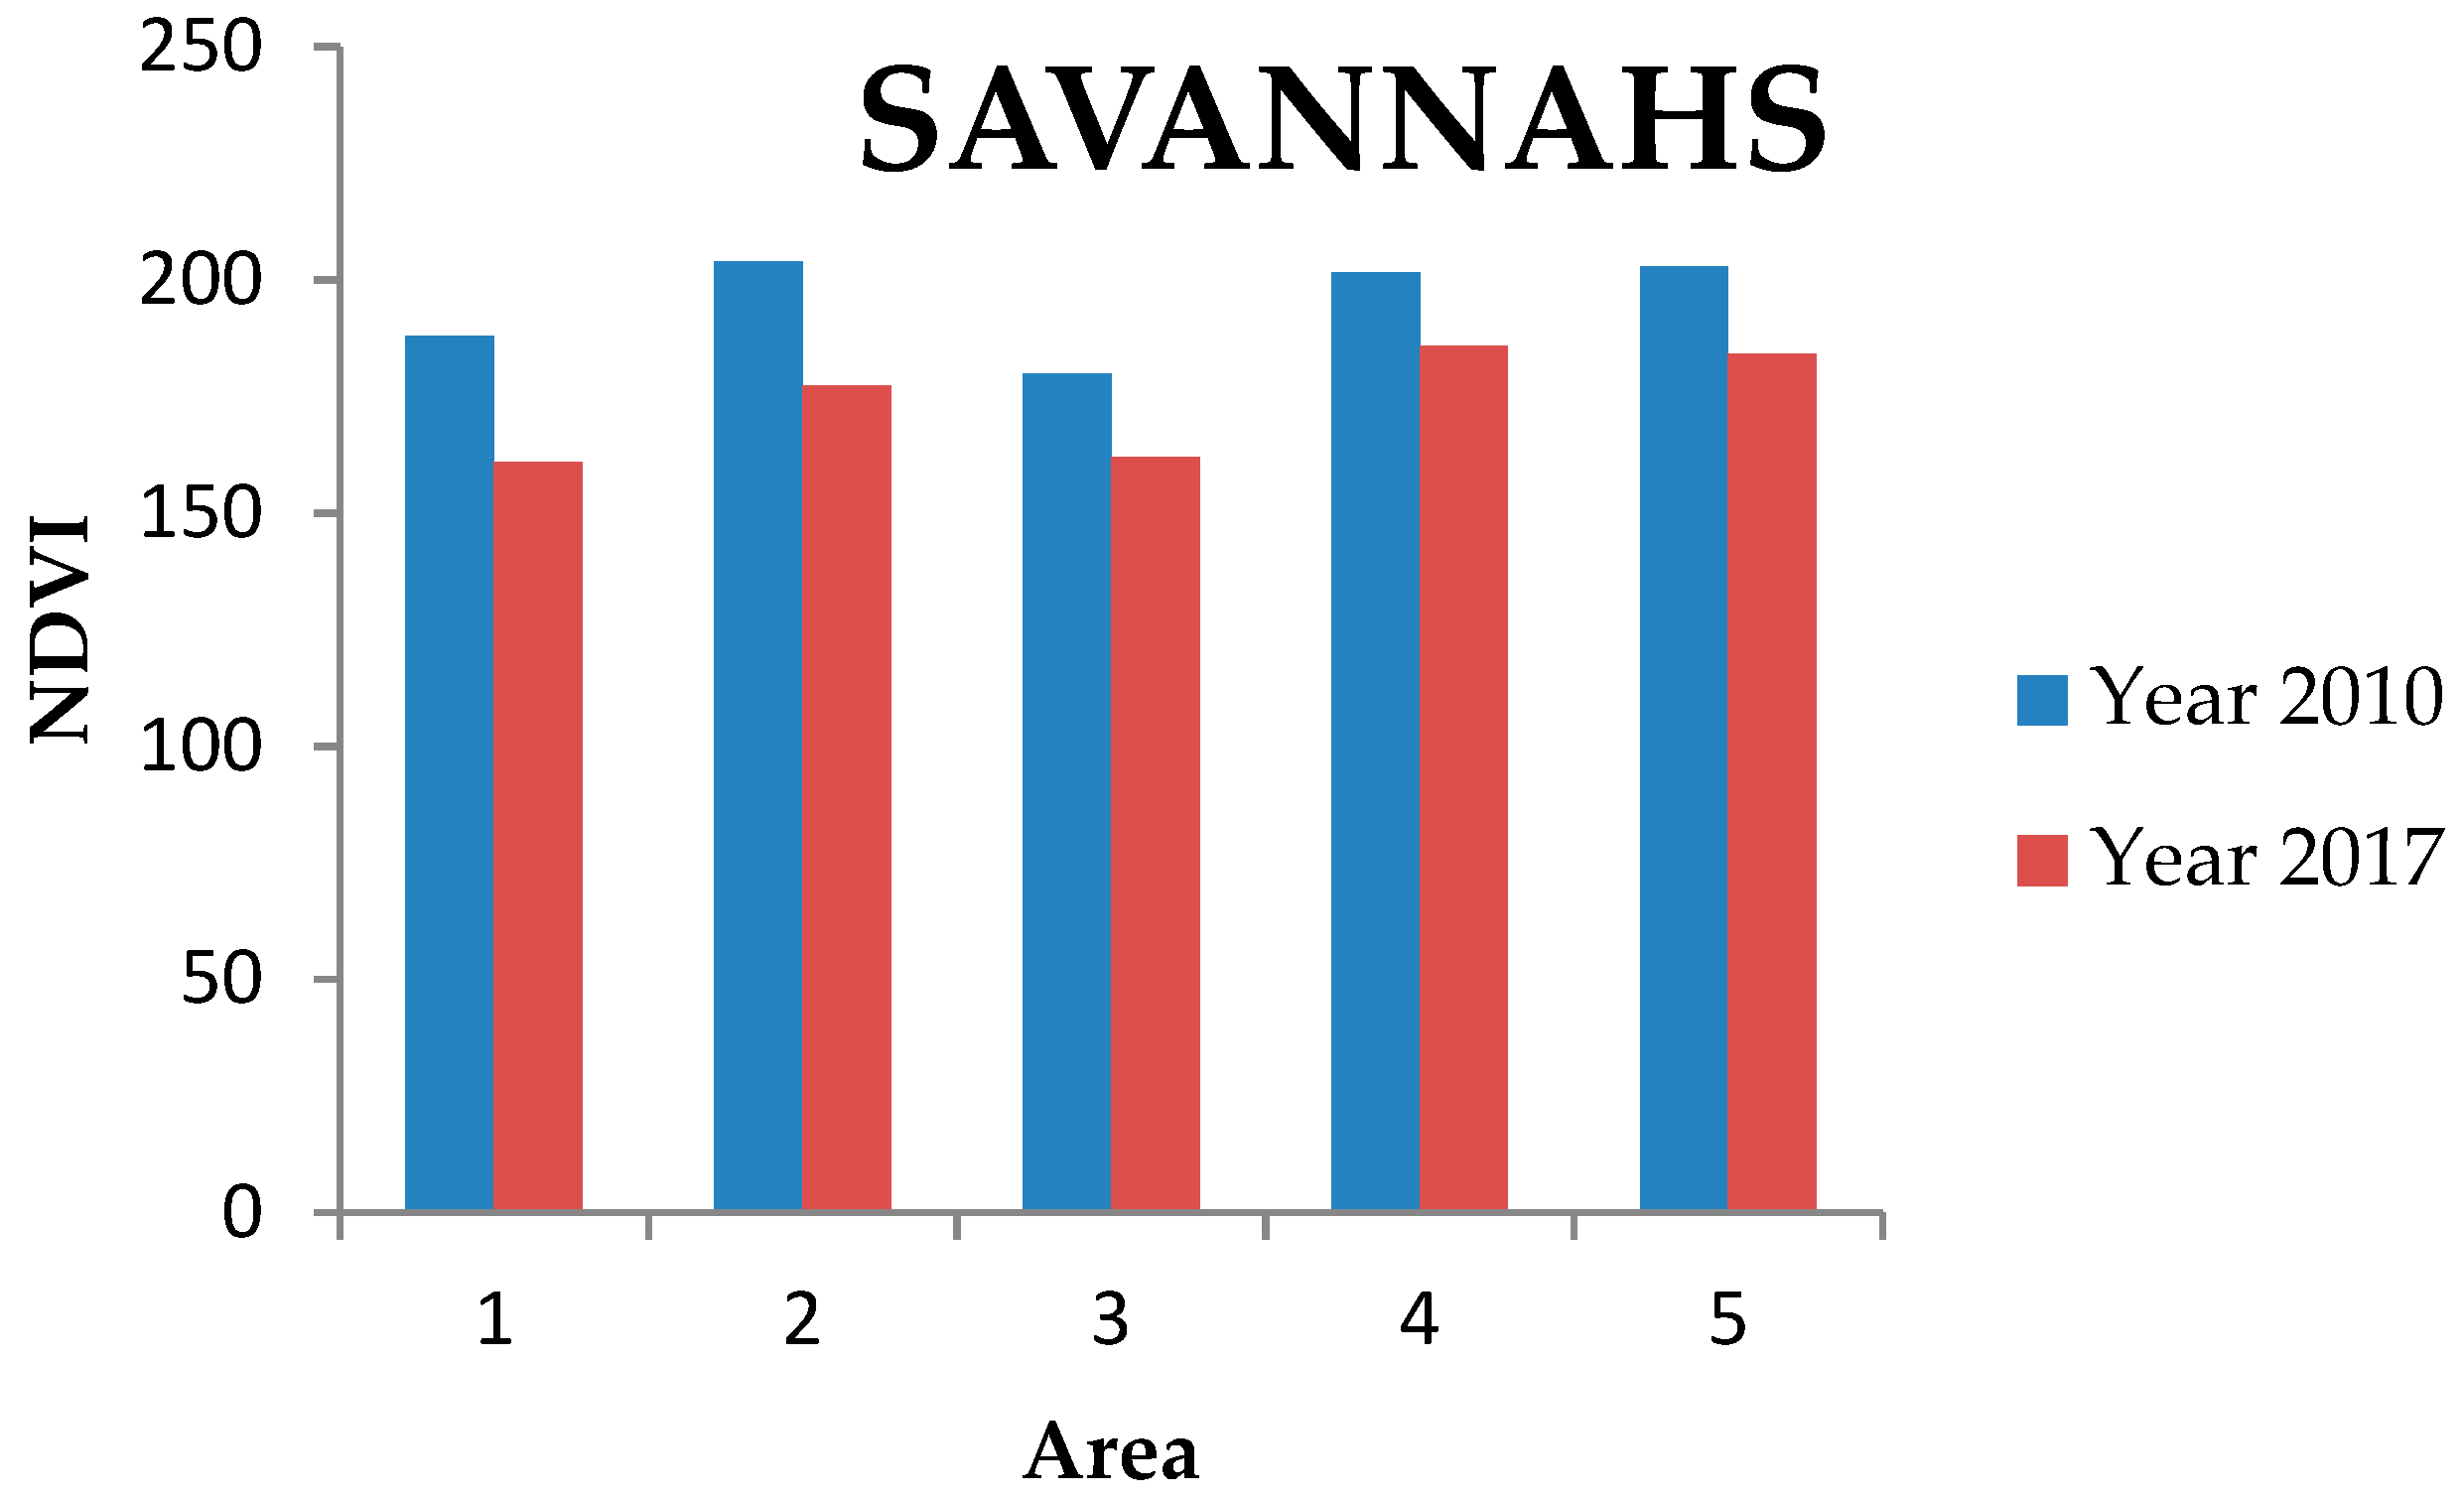
3.4. Savannahs
Of all the formations studied, the savannahs showed the least significant change. However, we can see that the NDVI decreased slightly between 2010 and 2017, as we can see in
Table 7 and
Figure 8.
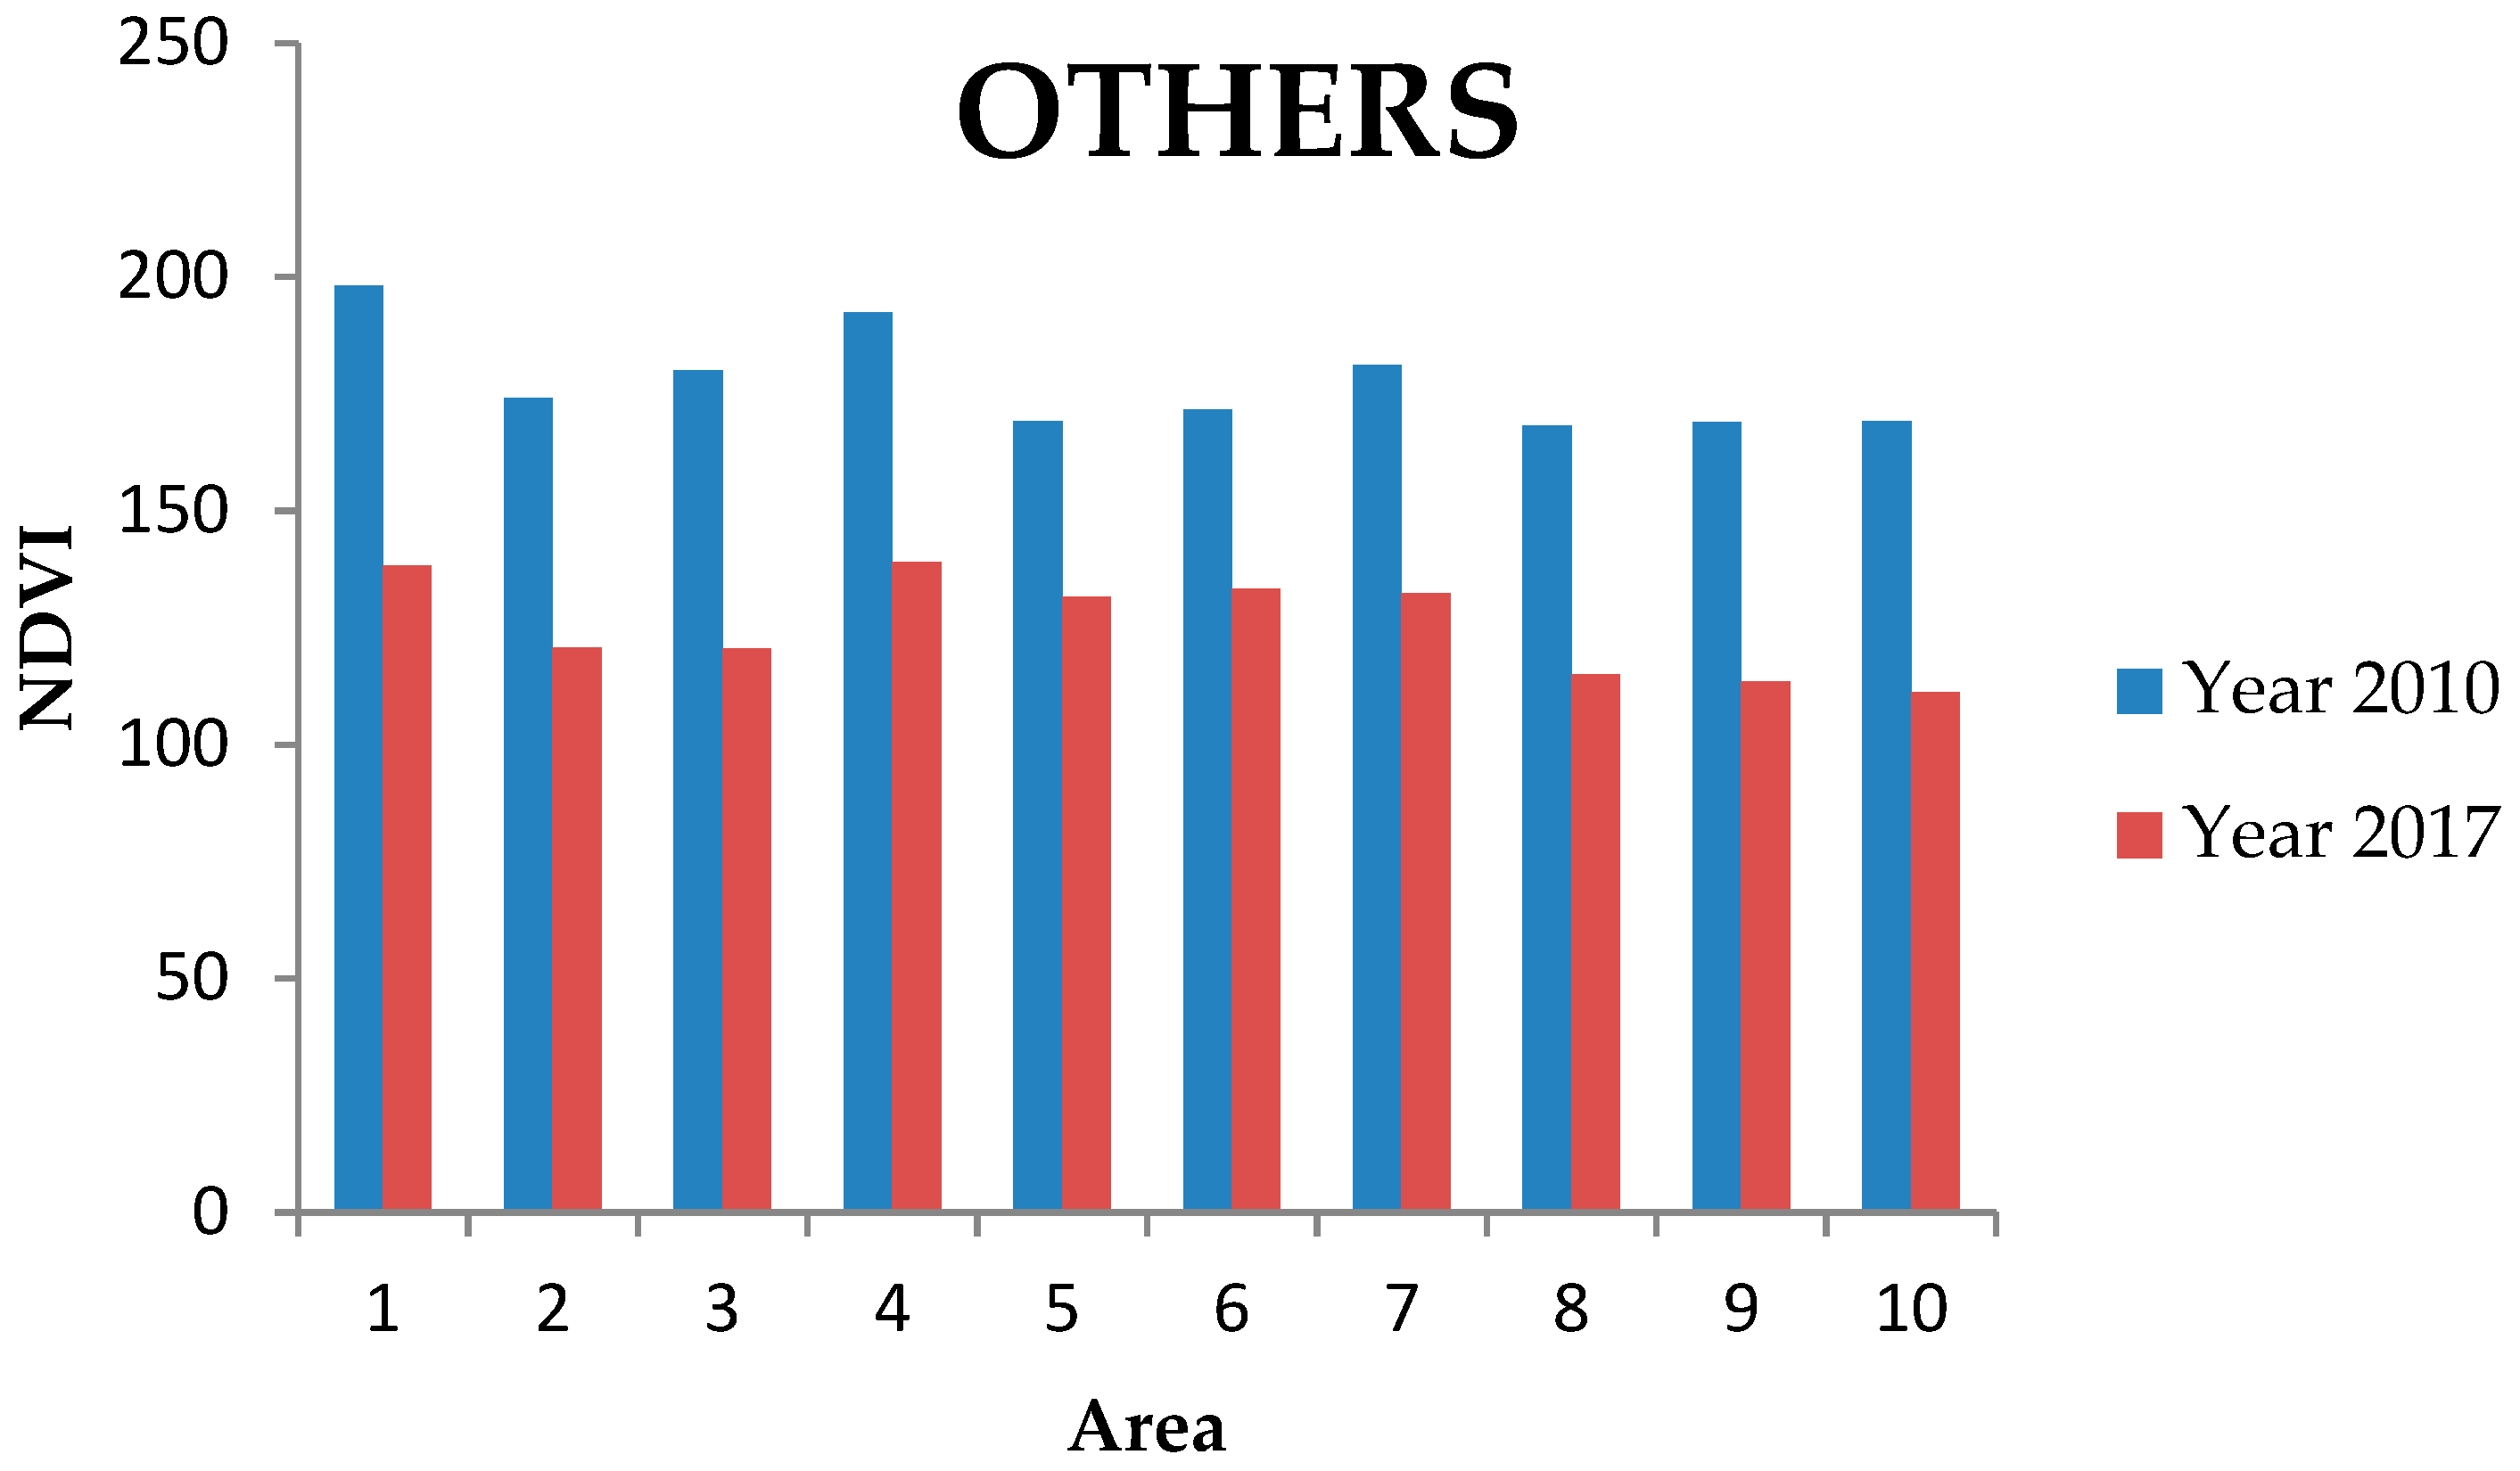
3.5. Other Areas
The analysis of the areas called “Others” (occupied by villages and human settlements) leads to the conclusion that these areas of the park are the ones that have suffered the greatest degradation, as show the
Table 8 and
Figure 9. This degradation could be understood as related to the increase in population, which, as on the rest of the African Continent, is much higher in the vicinity of rivers and along the coast than in inland areas (e.g., almost 80% of Guinea-Bissau’s population resides in the coastal zone). This fact has a very relevant impact upon the degradation of the mangrove swamps due to land reclamation by the increasing population, pointing precisely at this as the principal cause of the disappearance of mangals in the area.
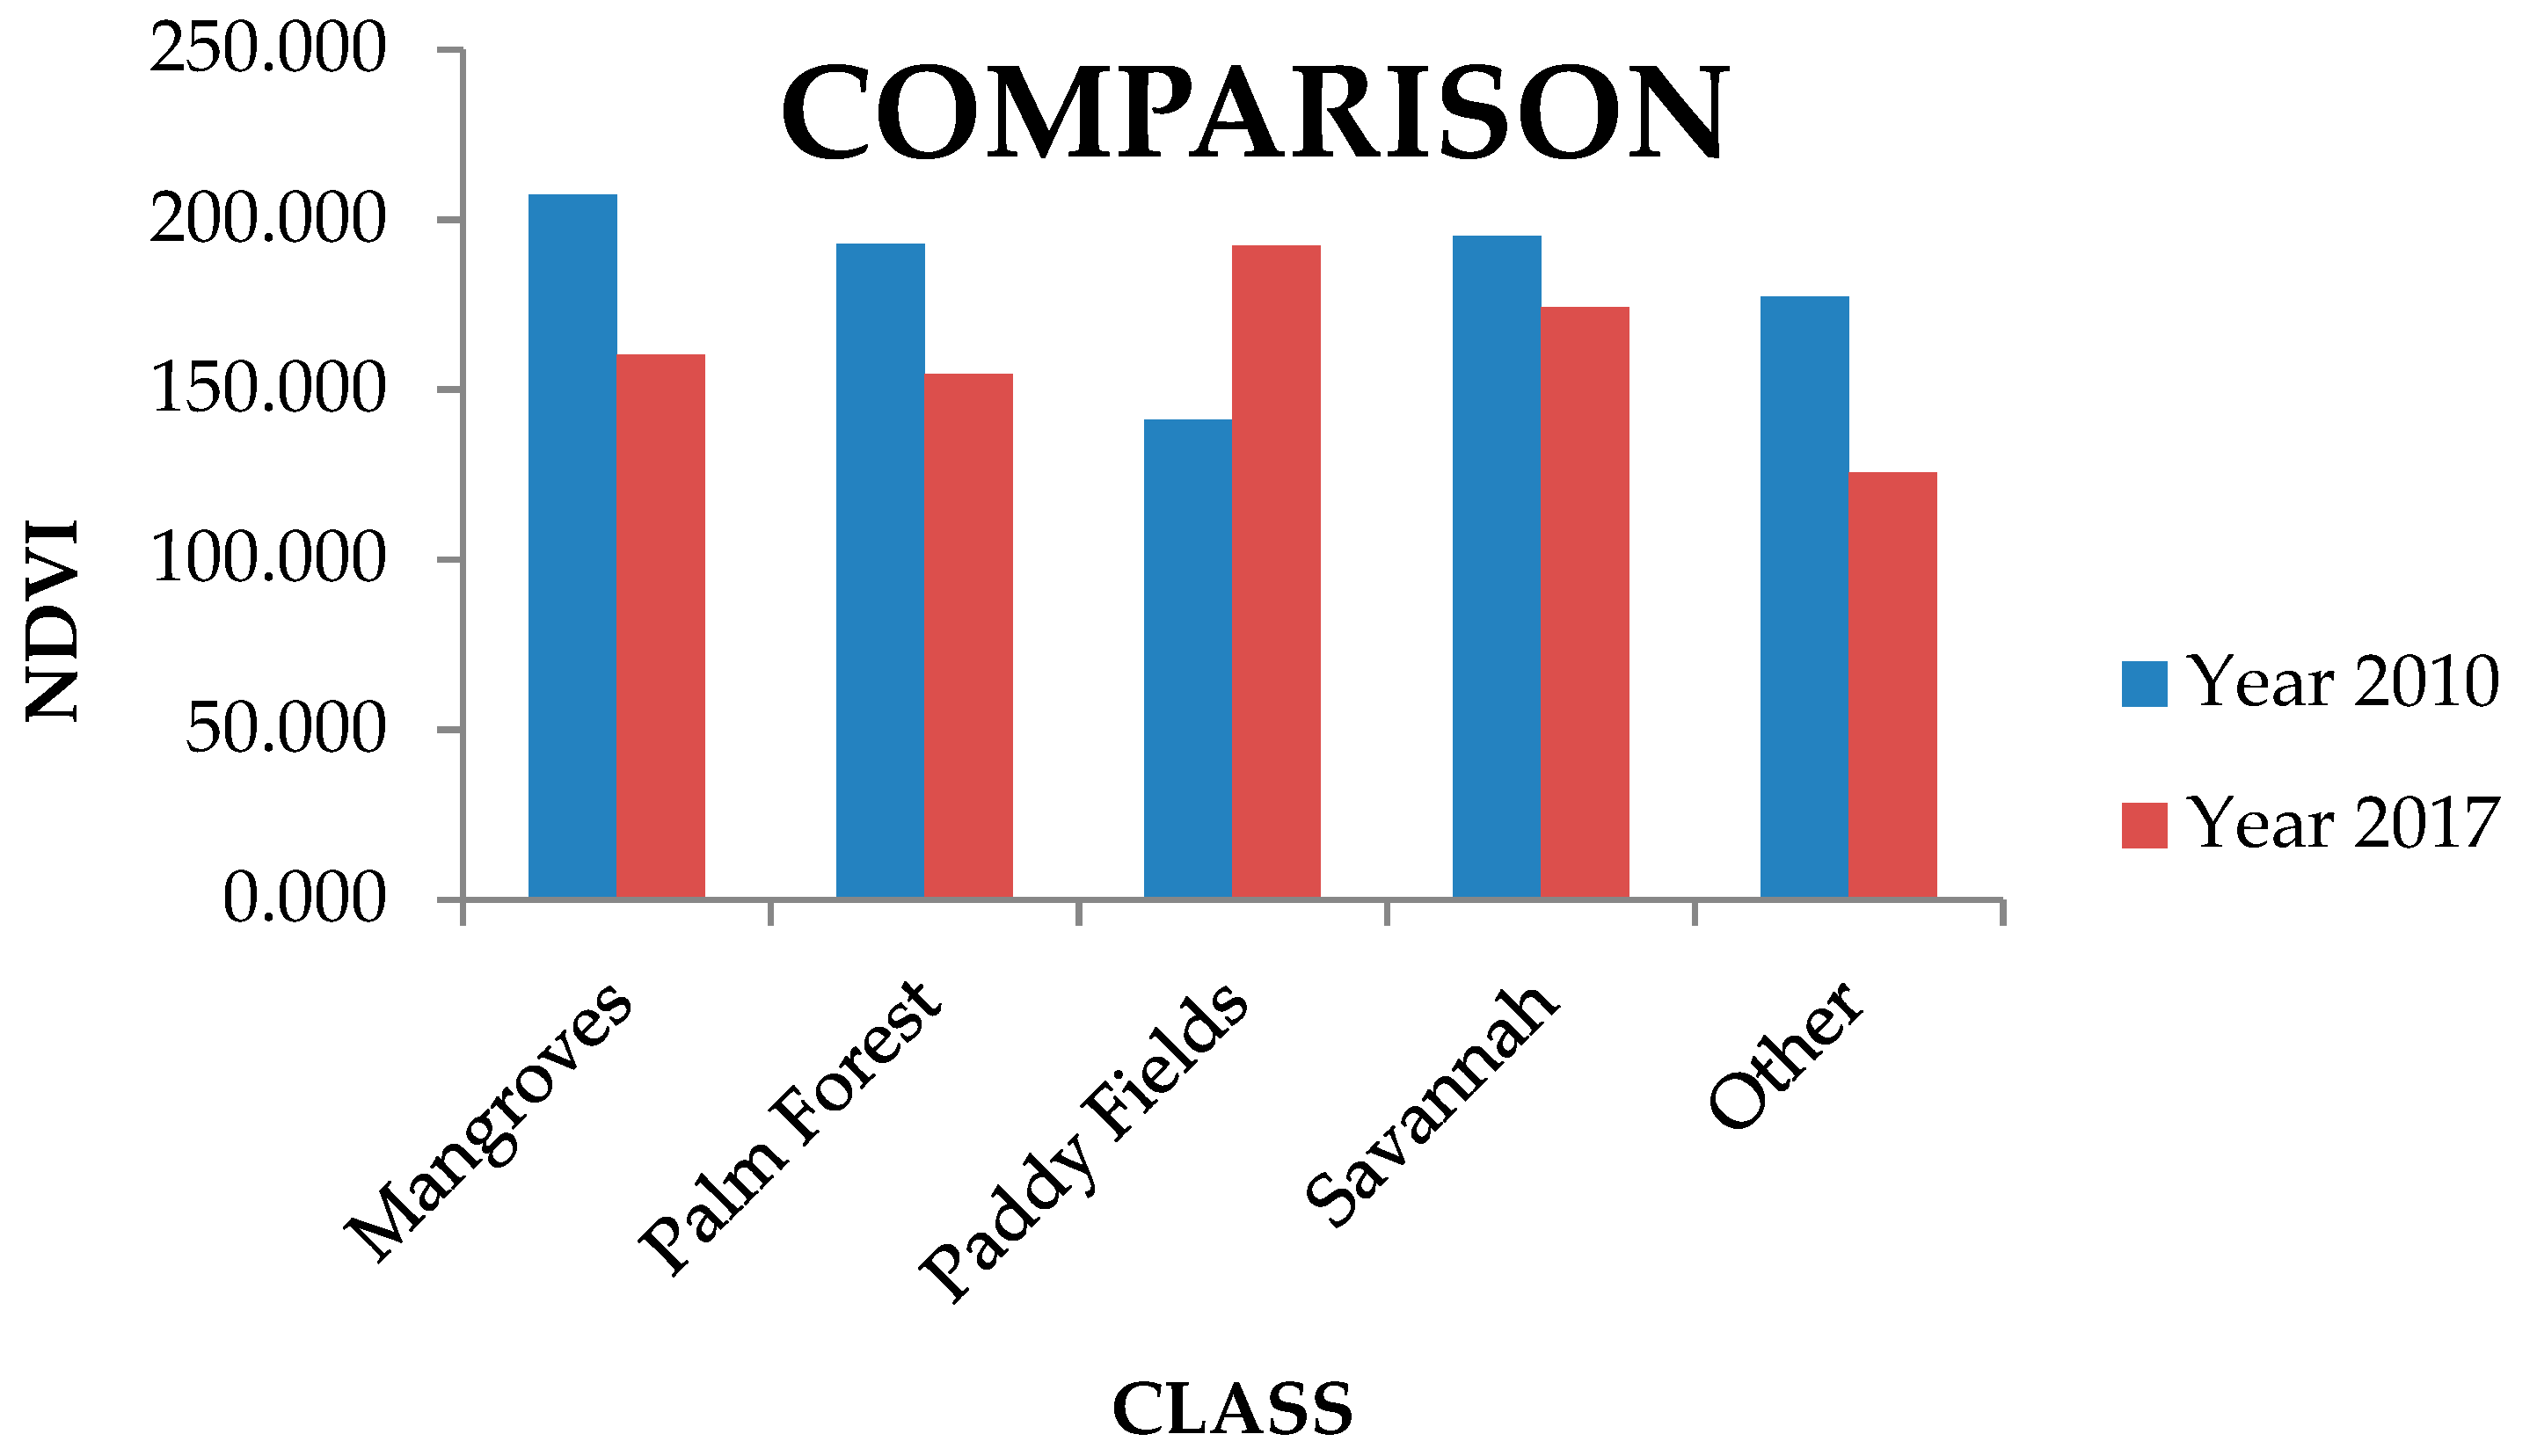
As a summary,
Table 9 is presented with the mean NDVI for each of the classes studied.
As can be seen in the
Figure 10, a decrease in the NDVI indices can be observed for all the vegetation types studied, except for the paddies. This means that, in general, the areas of the park covered with vegetation have been suffering an important loss, which implies a degradation of the natural park.
4. Discussion
By using remote sensing techniques, such as vegetation indices calculated based on ASTER scenes and basemaps of Guinea-Bissau, it is demonstrated that the Cacheu River Mangroves Natural Park is undergoing changes in land use and vegetation. These changes were already detected in previous studies carried out by Vasconcellos et al. for the period of years 1956–1998 [
4].
The observed changes in land use have effect on the degradation of the plant cover in one of the most important protected areas of Guinea-Bissau, containing one of the most significant mangrove formations in West Africa [
26].
The analysis of the different areas studied between the years 2010 and 2017 indicates that the biggest changes occur in the mangrove swamps and in the areas closest to population settlements (areas classified as "other" in this study), for which there was a bigger decrease in the NDVI values over time. The gradual destruction of the mangals seems to be directly related to a change in land use, which could have shifted from mangrove forests to population centers, based on the interpretation of the results obtained and the literature review conducted.
To better understand the changes in land use, it is necessary to take into consideration some socio-economic issues in the area. The majority of the Guinean population directly depends upon the exploitation of biodiversity and natural resources for their survival [
26]. The political instability of the country and the unemployment rate unfortunately contributes to an over exploitation of these natural resources. Agriculture and fishing are the two most important economic activities [
4], and the cultivation of rice represents the main food crop. As pointed out by Vasconcellos et al. [
4] in previous studies, one of the reasons for the degradation in these areas appears to be the systems of production of the rice. In the studied area, there are two main systems of rice production: i) Upland plateau or "Mpam-pam", or production by shifting cultivation; and, ii) cultivation in the hydromorphic mangrove soils. Itinerant rain rice cultivation or "shifting cultivation" is practiced mainly in forest ecosystems and savannahs [
26]. The rice cultivation in the hydromorphic mangrove soils ("salty water fields”) requires the deforestation of the mangals, and also involves the construction and maintenance of anti-salt dams [
26]; as a consequence, not only is there a change in land use due to the shifting from manglars to rice crops, but also an additional degradation of the mangrove forests given the need of wood for the construction and maintenance of the dams. Another reason for the loss of mangroves, as pointed out by Lima da Faria et al. [
5], is the consumption of fuel wood and charcoal, especially in human settlements.
The area of palm forest also experienced a decrease, although less prominent than the one observed for the mangrove swamps. The reason for the better maintenance of these areas is based on economic principles and is related to the production of fruits associated with these palms, which constitute an important agricultural product for export. The lesser change in NDVI in this area could also be due to the replacement of some native palm trees with cashews. Cashew cultivation began to spread after the independence of the country (from Portugal in 1974), motivated by the absence of credit for the reconstruction of dikes for the cultivation of rice in the mangrove area, and in more recent times, due to the demand in the international markets of cashew, as cashew does figure as the most important commercial crop for Guinea Bissau [
34].
In the savannah area, the results obtained indicate a slight decrease, which could be associated with the cashew cultivation and the systems of rice production, known as "Mpam-pam". Both crops involve land clearing and cultivation till the land is no longer productive. Then, it is abandoned and left fallow [
4]. Some of these lands, after enough time have elapsed, can recover their initial vegetation, but in other cases, it is not possible due to the degree of soil and nutrient depletion, which would need to be provided through fertilizers, amendments and other treatments, for which there are no financial resources, given the socio-economic situation of the country.
The villages, which in this study are covered as part of the area named as “Other”, show the greatest degradation of all those studied. This is due to the increase in population which the country experienced during the years studied, which, as in the majority of African countries, is settled along river banks and the coast. These settlements have a particular impact on the degradation of the mangrove swamps and the appearance of more paddies, and that is the only area of study for which an increase in the NDVI values is observed. The increase of population density and the decrease in fertility of the land make that the proportion of land needed for food production is constantly increasing [
4].
In summary, the underlying reason for the changes in land use, especially in mangrove areas, seems to be the increment of the human concentrations in these areas and the necessity to exploit their natural resources in order to meet the basic survival needs of the growing population [
25]. Vasconcelos et al. [
4] in their previous study, point to an increase in population mainly due to the arrival of refugees from southern Senegal (its northern neighbor). At the time of our study, the situation with regards to population growth in this area shall worsen most likely as a result of the period of political instability and the economic crisis experienced by the country.
Given all the changes in land use observed, it is understood that the park is not being managed in a sustainable way, despite the additional protection that is expected to be conferred by the declaration of the area as a Natural Park.
5. Conclusions
By studying the variations in the NDVI through the years 2010 to 2017, changes in land use in the Cacheu River Mangroves Natural Park in the Republic of Guinea-Bissau are observed. These changes, mainly affecting the mangrove swamps, are already identified in previous studies, and despite the declaration of the area as a Natural Park in 2000, it does not seem that any protective actions were put into place to aid in its conservation. Given the high ecological relevance of the mangals and the socio-economic importance of this vegetation type since the survival of the population settled depends mostly upon it, it is of utmost importance that multi-stakeholder attention, starting with the local government, is given to this area, and urgent action is taken to avoid its deforestation. The following measures are proposed to improve the sustainability of the park:
Conducting education and awareness-raising campaigns to inform the local community of the importance of conserving these protected areas, especially the mangrove swamps, and promote their accountability regarding their conservation. Messages will need to emphasize, not only the global ecological relevance of the area, but also the importance of its sustainable management, since an uncontrolled exploitation will compromise their own survival.
Drawing up a rational land use plan, respecting traditional uses and placing special emphasis on the mangrove swamps. This rational plan may consist of the following steps:
- ○
As a first step, work on the reforestation of the most degraded mangrove swamps.
- ○
At the same time, conduct a reforestation of fallow areas with fast-growing species of autochthonous woody plants. This will allow obtaining wood for traditional uses and avoid further degradation of the mangals.
- ○
In the long-term, compile data from all species in the area to create an inventory or accurately update the existing one. This inventory will inform the design of an integral plan of the use of the natural resources and allow a rational exploitation, in order to preserve the sustainability of the area. Ideally, this integral plan would also account for:
- ○
The implementation of a system for ongoing monitoring and control of the forest areas to ensure their optimum growth and maintenance, and;
- ○
The conduct of regular management effectiveness evaluations.


