Article

Comparison of Active Nitrogen Loss in Four Pathways on a Sloped Peanut Field with Red Soil in China under Conventional Fertilization Conditions

1
Jiangxi Provincial Key Laboratory of Soil Erosion and Prevention, Nanchang 330029, China
2
Jiangxi Institute of Soil and Water Conservation, Nanchang 330029, China
*
Author to whom correspondence should be addressed.
Sustainability 2019, 11(22), 6219; https://doi.org/10.3390/su11226219
Submission received: 19 September 2019 / Revised: 22 October 2019 / Accepted: 26 October 2019 / Published: 6 November 2019
(This article belongs to the Special Issue Sustainable Cropping Practices to Counteract Environmental Stresses)

Abstract

:
Active nitrogen loss mainly includes ammonia (NH3) volatilization, nitrous oxide (N2O) emission, NO3-N and NH4+-N deep leakage (N leaching), and NO3-N and NH4+-N surface runoff (N runoff), resulting in serious environmental problems. To analyze the characteristics of active nitrogen loss in the four pathways on sloped farmland under conventional fertilization, six lysimeters with a slope of 8° were used. Losses due to NH3 volatilization, N2O emission, N leaching, and N runoff were investigated after urea application on a peanut field with red soil in China during the growing season from 2017–2018. Results reveal that at conventional nitrogen levels of 150 and 172 kg hm−2, the total active nitrogen loss caused by fertilization accounting for the total nitrogen applied was 5.57% and 14.21%, respectively, with the N2O emission coefficients of 0.18% and 0.10%, respectively; the NH3 volatilization coefficients of 2.24% and 0.31%, respectively; the N leakage loss rates of 3.07% and 10.50%, respectively; and the N runoff loss rates of 0.08% and 3.30%, respectively. The dry year was dominated by leaching and NH3 volatilization, while the wet year was dominated by leaching and runoff; the base fertilizer period was dominated by leakage, while the topdressing period was dominated by leakage and runoff, which suggests that the loss of active nitrogen in the soil-peanut system on a sloped red soil was mainly affected by rainfall and fertilization methods. Taken together, reasonable fertilization management and soil and water conservation measures appear to be effective in minimizing the loss of active nitrogen from nitrogen fertilizer.

1. Introduction

Active nitrogen pollution is a global environmental threat next only to climate warming and biodiversity degradation [1]. Active nitrogen loss from farmland ecosystems has become one of the most concerning topics related to agriculture and the environment. In farmland ecosystems, nitrogen fertilizer is the main active nitrogen input for soil. Since the utilization efficiency of nitrogen fertilizer in the farmland is generally low, high levels of nitrogen fertilizer can easily lead to nitrogen loss in various forms. The pathways by which nitrogen is lost include not only ammonia volatilization in which gaseous nitrogen enters the atmosphere or nitrification–denitrification processes formed by nitrous oxide, but also include surface runoff or deep leakage in the form of ammonium nitrogen and nitrate nitrogen. This can cause a series of environmental problems such as increased greenhouse gas emissions, water eutrophication, and soil acidification [2,3,4]. To this end, many domestic and foreign scholars have quantitatively evaluated and researched the loss of active nitrogen in farmlands [4,5,6,7,8]. Ju et al. [6] found that when 120–360 kg hm−2 urea-N was mixed into 0–10 cm soil or spread before irrigation, the rate of ammonia volatilization loss was 3.8–7.2%, the rate of denitrification loss was 0.21–0.26% in winter wheat, and the rate of denitrification loss was 1–5% in summer maize; the main cause of nitrogen fertilizer loss was leaching below the 0–100 cm soil profile and accumulation in deeper soil. Zhu [8] summarized that only 35% of nitrogen fertilizer is used by crops after application in China; 52% of the applied nitrogen fertilizer is lost via runoff, leaching, and gas emissions; and the remaining 13% includes soil residual and calculation errors. These studies are valuable references for developing methods to reduce active nitrogen loss and optimize nitrogen application techniques. However, the process by which active nitrogen is lost in each pathway is affected by factors such as climatic conditions and fertilization methods, resulting in temporal and spatial diversity. In addition, previous research has focused mainly on flat farmland (especially wheat, corn, and rice fields) and has concentrated on specific nitrogen loss pathways [9,10,11].
China is the largest consumer of nitrogen fertilizer in the world, accounting for 30% of the world’s nitrogen fertilizer application [12]. The red soil region in China covers 2.18 × 10⁶ km2 and is an important agricultural production area that accounts for 36% of the total cultivated land area. This region accounts for more than half of the grain and oil supplies produced in China. Strong red soil eluviation together with frequent ploughing, high fertilization, and abundant regional precipitation, leads to intense soil erosion and severe nitrogen leaching on red soil sloping uplands, which has become a major constraint for the development of hillside agriculture in this region. According to research-based estimates based on China’s red soil region crops, 0.02–14.8% of soil ammonia loss occurs via volatilization [13,14,15]; 1.0–18.0% occurs via nitrification–denitrification processes, such as nitrous oxide emission [16,17]; 0.91–25.5% via leakage [14,18,19]; and 0.44–1.17% via runoff [15]. However, research into the simultaneous loss via NH3, N2O, runoff, and leaching on sloped farmland is still lacking [6]. This research gap prevents further understanding of the loss of active nitrogen in farmland ecosystems on slopes and limits the optimization of nitrogen application methods.
Peanut plants are the primary crop in the red soil region of China, which are grown from April to August on the uplands and conventionally receive N-fertilizer between 150 and 180 kg hm−2. Frequent tillage and high fertilization on sloped peanut fields has led to the loss of nitrogen fertilizer by N2O and NH3 emissions, and runoff and leaching processes. At present, the main pathways for the loss of active nitrogen in peanut planting systems on China’s sloped red soil uplands are still unclear. The objectives of this study were to simultaneously monitor and analyze active nitrogen loss via N2O, NH3, N runoff, and N leaching from red soil on sloped peanut fields under conventional fertilization conditions; lysimeters were used to clarify the main pathways of active nitrogen loss. Based on our findings, the potential pathways that could reduce the loss of active nitrogen in peanut lands are discussed, and provide a reference for nitrogen management on sloped farmlands in the red soil region of China.

2. Materials and Methods

2.1. Background in Formation and Lysimeter Installation

The soil material used in this study was collected from a typical sloped red soil upland (115°42′38″–115°43′06″ E, 29°16′37″–29°17′40″ N) in the De’an Town of Jiujiang City, Jiangxi Province, located in the Poyang Lake area of China. The test area has a semi-tropical monsoon type climate, with mean annual precipitation of 1449 mm, mean annual evaporation of 1558 mm, mean annual temperature of 16.9 °C, mean annual frost-free period of 249 d, and mean annual sunlight duration of 1700–2100 h. Precipitation in this area mainly concentrated in April to August, accounting for 62.8% of the annual precipitation. The soil is dominated by red soil developed from quaternary red clay. The soil sample was collected from a traditional sloped peanut farmland (0–40 cm) in April 2016. The soil samples were air-dried and passed through a 10-mm sieve and mixed thoroughly to obtain homogenous samples before usage. The soil had the following properties: organic matter content: 7.64 g kg−1; total nitrogen content: 0.52 g kg−1; total phosphorus content: 0.18 g kg−1; pH (H2O) 5.0; free Fe and Al oxides were 50 mg g−1 and 20 mg g−1, respectively; the content clay, silt, and sand contents were 28.39%, 50.32%, and 21.29%, respectively. The tested soil was classified as clay loam soil and Plinthosols according to the soil texture classifications of the U.S. system and World Reference Base for Soil Resources 2014, Update 2015, respectively.
Six lysimeters with 3 m length, 0.75 m width, and 0.5 m height were prepared for our study (Figure 1). The slope of lysimeters was adjusted to 8°, representing the typical slope of red soil sloping in the upland in the test area. The floor of the lysimeters was drilled with 10 mm diameter holes with a distance of 15 × 15 cm, and covered with a 10 cm layer of fine sand (silted by 5 mm meshes) to ensure the free infiltration of water. A total of 40 cm soil was filled in each lysimeter by four 10 cm soil layers representing the common till layer thickness of the red soil sloping upland. The soil bulk density was controlled at 1.32 (±0.1) g cm−3 according to the measured values in the field. The lysimeters were placed in the field after filling soil. The experiment was carried out after the soil settlement was stable.

2.2. Experimental Treatments

There were two treatments with three replications: conventional fertilization management (FT) and no fertilizer management (CK). The tested peanut variety was Baisha 1016. Peanuts were planted on 17 May 2017, and harvested on 19 August 2017; peanuts planted on 4 May 2018 were harvested on 16 August 2018. Soil was routinely ploughed before planting at a depth of 20 cm. Fertilization treatment was based on local conventional peanut fertilization levels of 172 kg N hm−2, 117 kg P2O5 hm−2, 100 kg K2O hm−2 application of urea (N, 46.4%), calcium magnesium phosphate fertilizer (P2O5, 14%), and potassium chloride (K2O, 60%) in 2017. Among them, calcium magnesium phosphate fertilizer and potassium chloride were used as the base fertilizer, and urea was applied twice at a ratio of 3:2 base fertilizer to topdressing. The base fertilizer was mixed into 0–10 cm soil, and the topdressing was surface applied after a light rain on 7 July 2017. The basal fertilizers in 2018 were similar to those in 2017. Due to good growth rates, no topdressing was applied. The fertilization level of urea was 150 kg N hm−2 in the 2018 test period. The difference in N applied between 2017 and 2018 was not critical, as this study tested loss rate (the percentage of active nitrogen loss to nitrogen application) as an indicator for annual analysis. The experimental observations were made during the peanut growing season in 2017 and 2018. According to the data collected from the meteorological station in the test area, the average air temperature during the peanut growing season (May–August) was 27.9 °C. The rainfall during May–August was 976.2 mm in 2017. The temperature in 2017 was 0.5 °C higher and rainfall was 255.8 mm higher than that of the average peanut growing season (May–August). In 2018, the average air temperature during the peanut growing season (May–August) was 28.6 °C, and the rainfall during May–August was 408.7 mm. Therefore, the temperature in 2018 was 2.6 °C higher and 301.7 mm less rainfall occurred than that of an average growth period (May–August). According to local long-term observational data, the frequency of rainfall was less than 25% for wet years, more than 75% for dry years, and 25–75% for normal years. In this experiment, 2017 is referred to as the wet year and 2018 as the dry year.

2.3. Sample Collection and Measurement

2.3.1. Collection and Measurement of Runoff and Leakage Water Samples

Observations of runoff/leakage were carried out under natural rain conditions during the whole peanut growing season. The volume of surface runoff and leakage water were calculated according to a pre-determined water level–volume ratio in the runoff/leakage collection tank. At the end of each rain-runoff event, the sample in each collecting tank was allowed to stand for 4 h, and 500 mL of the supernatant was collected in a clean plastic bottle for detection and analysis. Each water sample was fixed with 1–2 drops of concentrated sulfuric acid on site and was quickly brought back to the laboratory for storage at 4 °C. Sample detection and analysis were completed within 48 h. Samples were passed through a 0.45 μm filter to detect ammonia nitrogen (NH4+-N) and nitrate nitrogen (NO3-N). NH4+-N was determined by sodium salicylate spectrophotometry and NO3-N was determined by barium sulfate reduction. The amount of nitrogen lost in surface runoff or leakage water pathways is equal to the sum of the product of the nitrogen concentration in each runoff or seepage water and the volume of the collected water throughout the monitoring period (a complete crop growing season). The calculation performed is as follows:
P = i = 1 n 10 C i × V i A
where P denotes the amount of nitrogen loss, (kg hm−2); Ci denotes the concentration of a certain form of nitrogen in the ith runoff (or leakage), (mg L−1); Vi denotes the water volume of the ith runoff (or leakage), (m3); and A denotes the area of the test lysimeters, which was 2.25 m2 in this study.

2.3.2. Measurement of Ammonia Volatilization

Volatized ammonia was collected by the acid solution aeration method [20]. A PVC tube used as the ammonia gas capture device had an inner diameter of 15 cm and a height of 10 cm. When sampling, the PVC tube was inserted into the soil to a depth of 2 cm. Two sponges (thickness of 2 cm, diameter of 16 cm) uniformly infiltrated with 15 mL solution of glycerol phosphate (5% phosphoric acid + 4% glycerol) were placed in a PVC tube. The lower layer of sponge was 5 cm above the ground. The upper layer of sponge was as high as the top of the tube. The distance between the two sponges was approximately 5 cm. The lower sponge was used to absorb ammonia volatilized from the soil, and the upper sponge was used to absorb ammonia from the air and prevent it from being absorbed by the underlying sponge. Capture of volatized soil ammonia began the day after fertilization and was sampled after 24 h. When sampling, the lower sponge was removed from the top, quickly loaded into a pre-numbered ziplock bag for protecting samples from light, then the PVC position was alternated. After fertilization, ammonia was continuously monitored for 20 days and sampled once a day. After that, the sampling frequency was adjusted to 2–3 times per week according to measured results until the peanut crop was harvested. The sampling time was between 8 and 9 am; sampling was not performed on rainy days.
The lower sponge was taken from the capture device and completely immersed in 300 mL of a 2.0 mol L−1 potassium chloride in a 500 mL plastic bottle. After shaking for 1 h, the NH4+-N in the leaching solution was measured with a Nessler reagent spectrophotometer. The NH3 emission flux of the soil–peanut system was calculated based on the measured content of ammonia nitrogen, the cross-sectional area of the capture device, and the time of each successive capture. The equation used is shown below:
N H 3 N = M i D × S
where NH3-N denotes NH3 emission flux of the ith sampling, (mg m−2 d−1); Mi denotes the ammonia nitrogen content measured by the ith sampling, (mg); S denotes the cross-sectional area of the capture device, (m2); and D denotes the time of each successive collection, (d). The equation for calculating the cumulative amount of NH3 emission is as follows:
N H 3 N = 1 100 1 2 i = 1 n N H 3 N i + N H 3 N i 1 T i T i 1
where NH3-N denotes the cumulative amount of NH3 emission, (kg hm−2); NH3-Ni denotes NH3 emission flux of the ith sampling, (kg hm−2 d−1); NH3-Ni−1 denotes NH3 emission flux of the (i − 1)th sampling, (kg hm−2 d−1); T i denotes the time for the ith sampling; T i 1 denotes the time at which the (i − 1)th sample is taken; n denotes the total number of samples.

2.3.3. Measurement of N2O Emission

N2O was measured by static dark box-gas chromatography [16]. The N2O sample was collected using a stainless-steel static closed box with a cross-sectional area of 30 cm × 20 cm. Since peanut plants are usually not taller than 40 cm, the height of the box was 50 cm. After the peanuts were sown, a stainless-steel base was pre-placed and fixed in the middle of each lysimeter as a watertight seal. When sampling, the sampling box was placed on the base and a micro fan was installed in the box to keep the gas evenly mixed. Samples were taken once a day for the first two days after fertilization and twice a week thereafter from 8:30 am to 12:00 pm. In case of rain, sampling was increased the day after the rain had stopped. Each sampling point was sampled four times per day at a 10-min interval. The sample volume was 30 mL, which was stored in a 100 mL sample vial. The temperature inside the box was recorded at the time of sampling. An improved gas chromatographic method (model: Agilent GC7890A, Agilent Technologies, Inc., Palo Alto, CA USA) was used for analysis; the detector was equipped with an electron capture detector ECD. The detector temperature was 330 °C, and the column temperature was 55 °C. The CA–5 gas sample injector used was from the Institute of Atmospheric Physics at the Chinese Academy of Sciences [16,21]. The N2O concentration was determined by the ratio of the standard gas peak area; standard gas was supplied by the National Standards Center in China. The equation used for calculating N2O emission flux is as follows:
F = 44 22.4 × V A × Δ c Δ t × 273 T × a
where F denotes the N2O emission flux, μg (m−2 h−1); 44/22.4 is the density of N2O under standard conditions, (kg m−3); V denotes the volume of the sampling box, (m3); A denotes the bottom area of the sampling box, (m2); Δ c Δ t denotes the rate of change of N2O concentration for a certain period of time, [10−9m3 (m−3 h−1)]; T denotes the absolute temperature, (K); and a denotes the conversion factor for N2O to N.
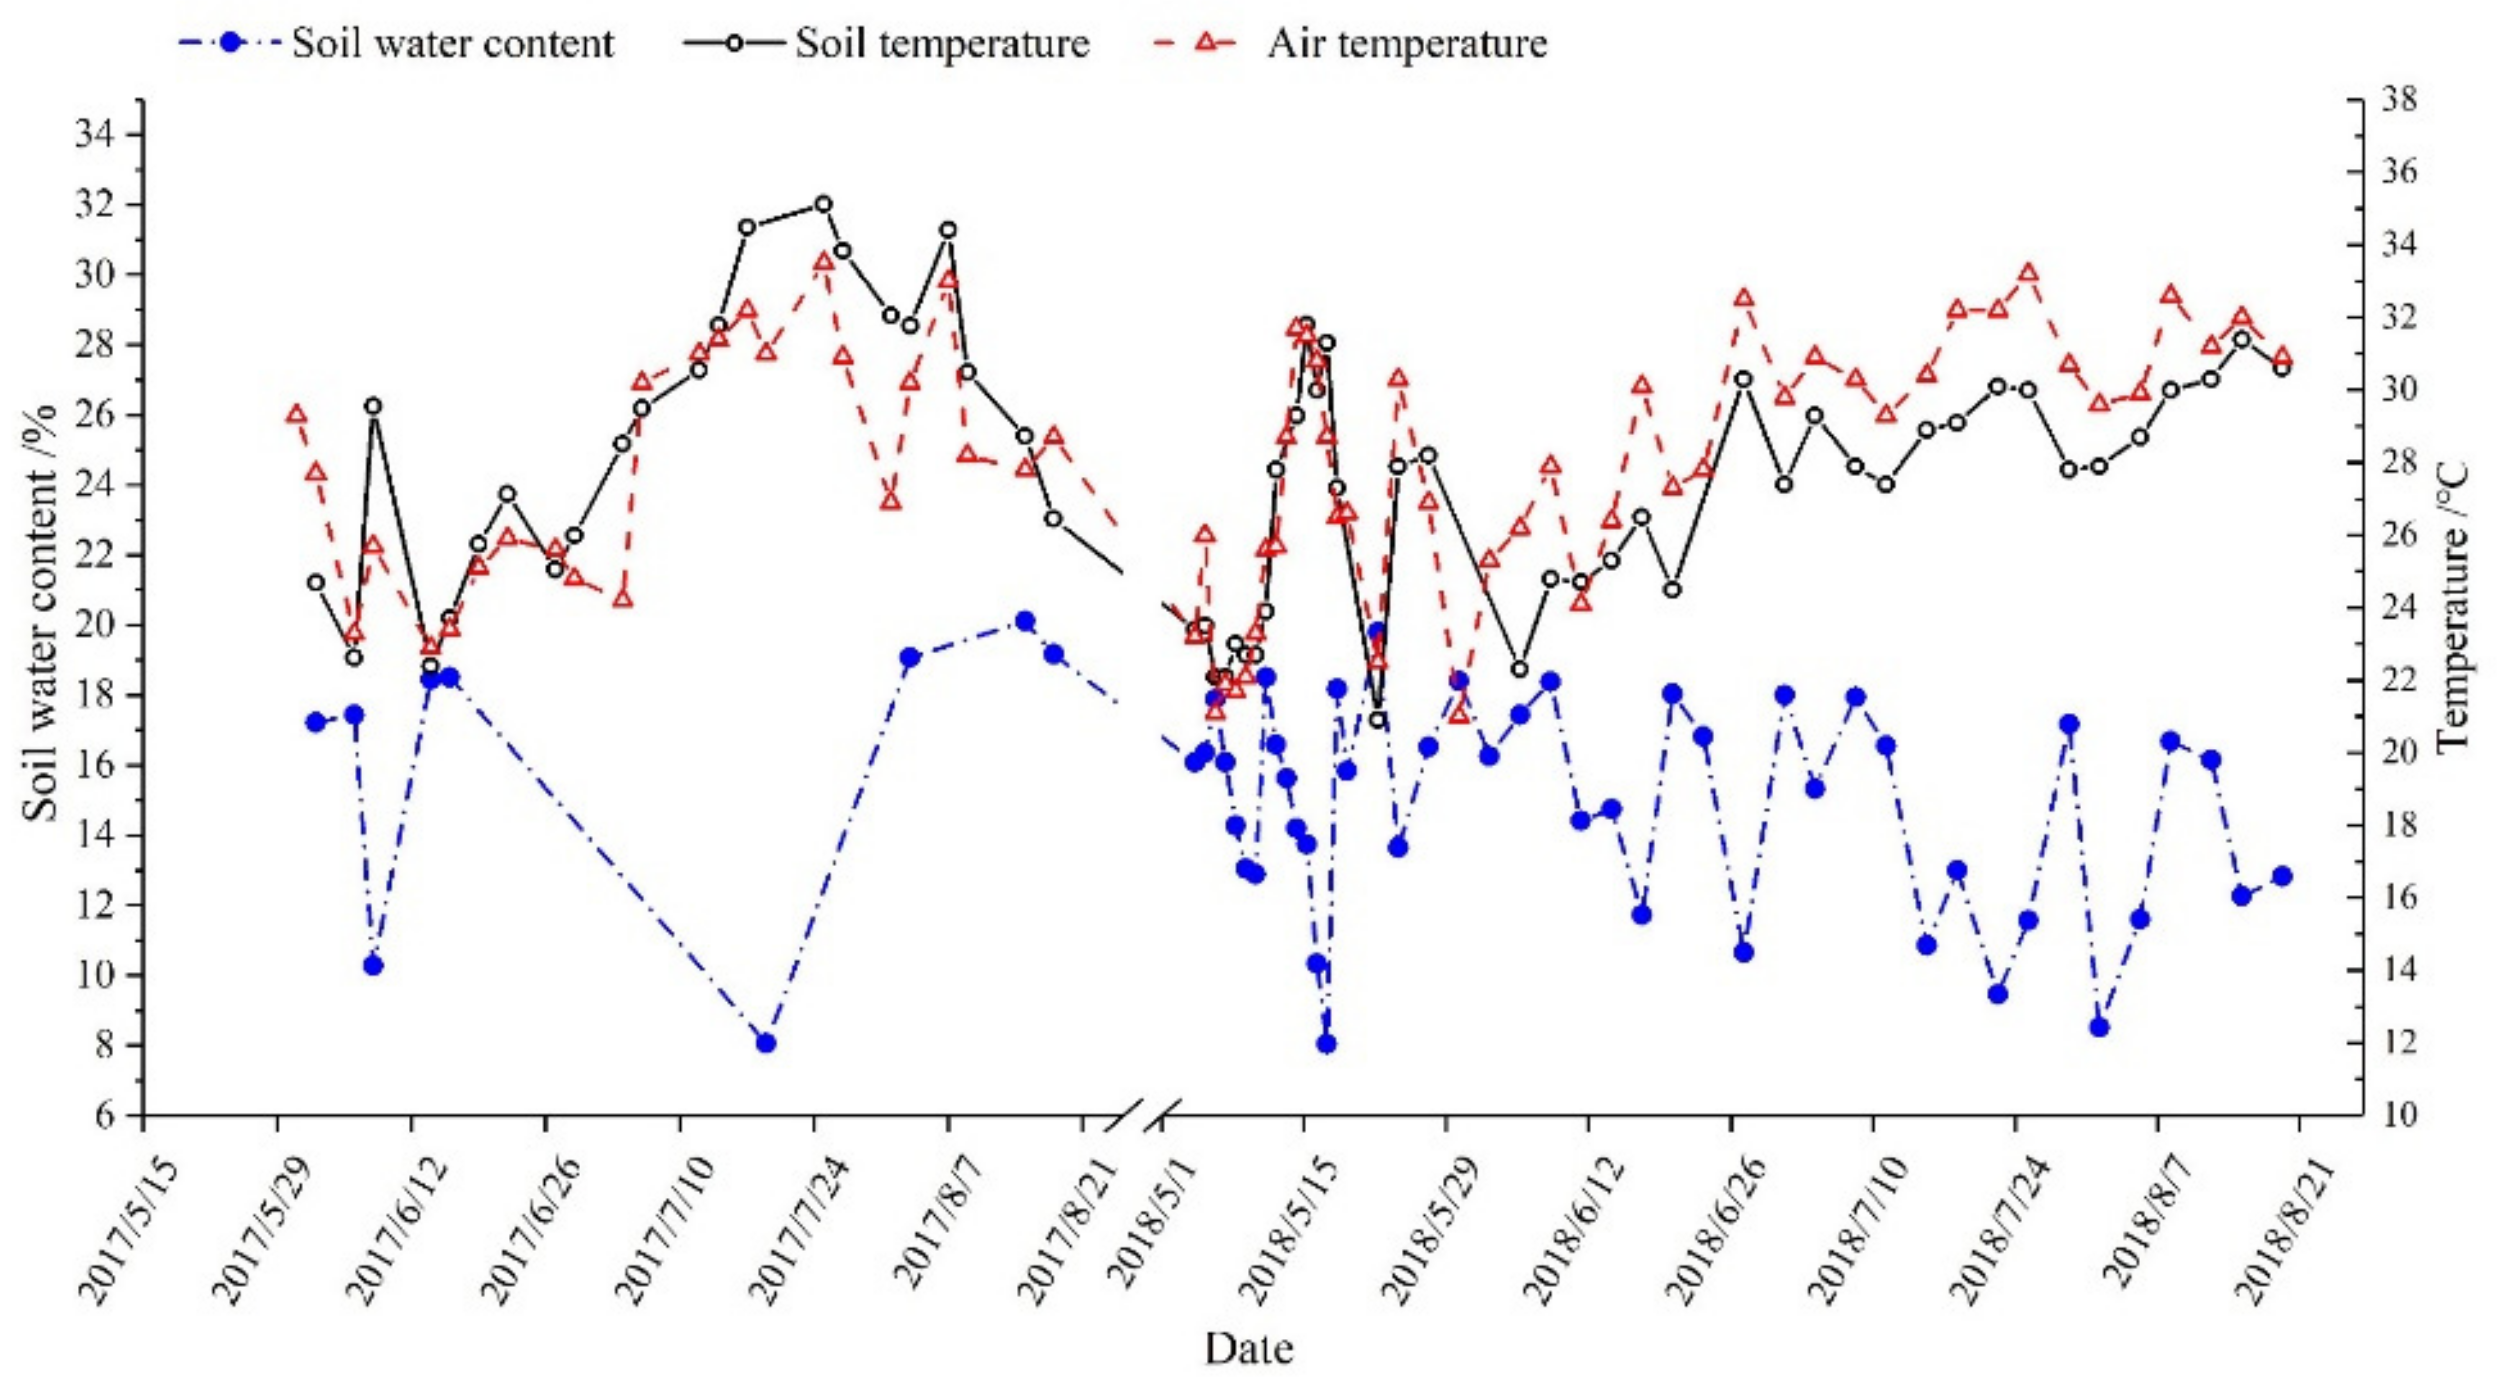
In addition, the soil temperature was obtained by reading a geothermometer previously embedded 0–10 cm below the ground. The soil water content (referred to the mass water content) was determined by the drying method for each lysimeter. The rainfall was obtained from a siphon rainfall recorder of the automatic meteorological station in the test area.

2.4. Data Processing

In order to visually reflect the contribution and impact of the applied nitrogen fertilizer on the atmosphere and water body, the test results were mainly represented by the difference between the nitrogen treatment and the control. The test data were analyzed using SPSS 11.5 software for correlation analysis with a Spearman double tail test. Excel 2013, Origin Pro 2017 (OriginLab Corporation, Northampton, MA USA) and R 3.5.0 software (The R Core Team, Vienna, Austria) were used to process data and draw charts.

3. Results

3.1. Temporal Dynamic Change in Active Nitrogen Loss from Different Pathways

3.1.1. Loss of Active Nitrogen Concentration via Water

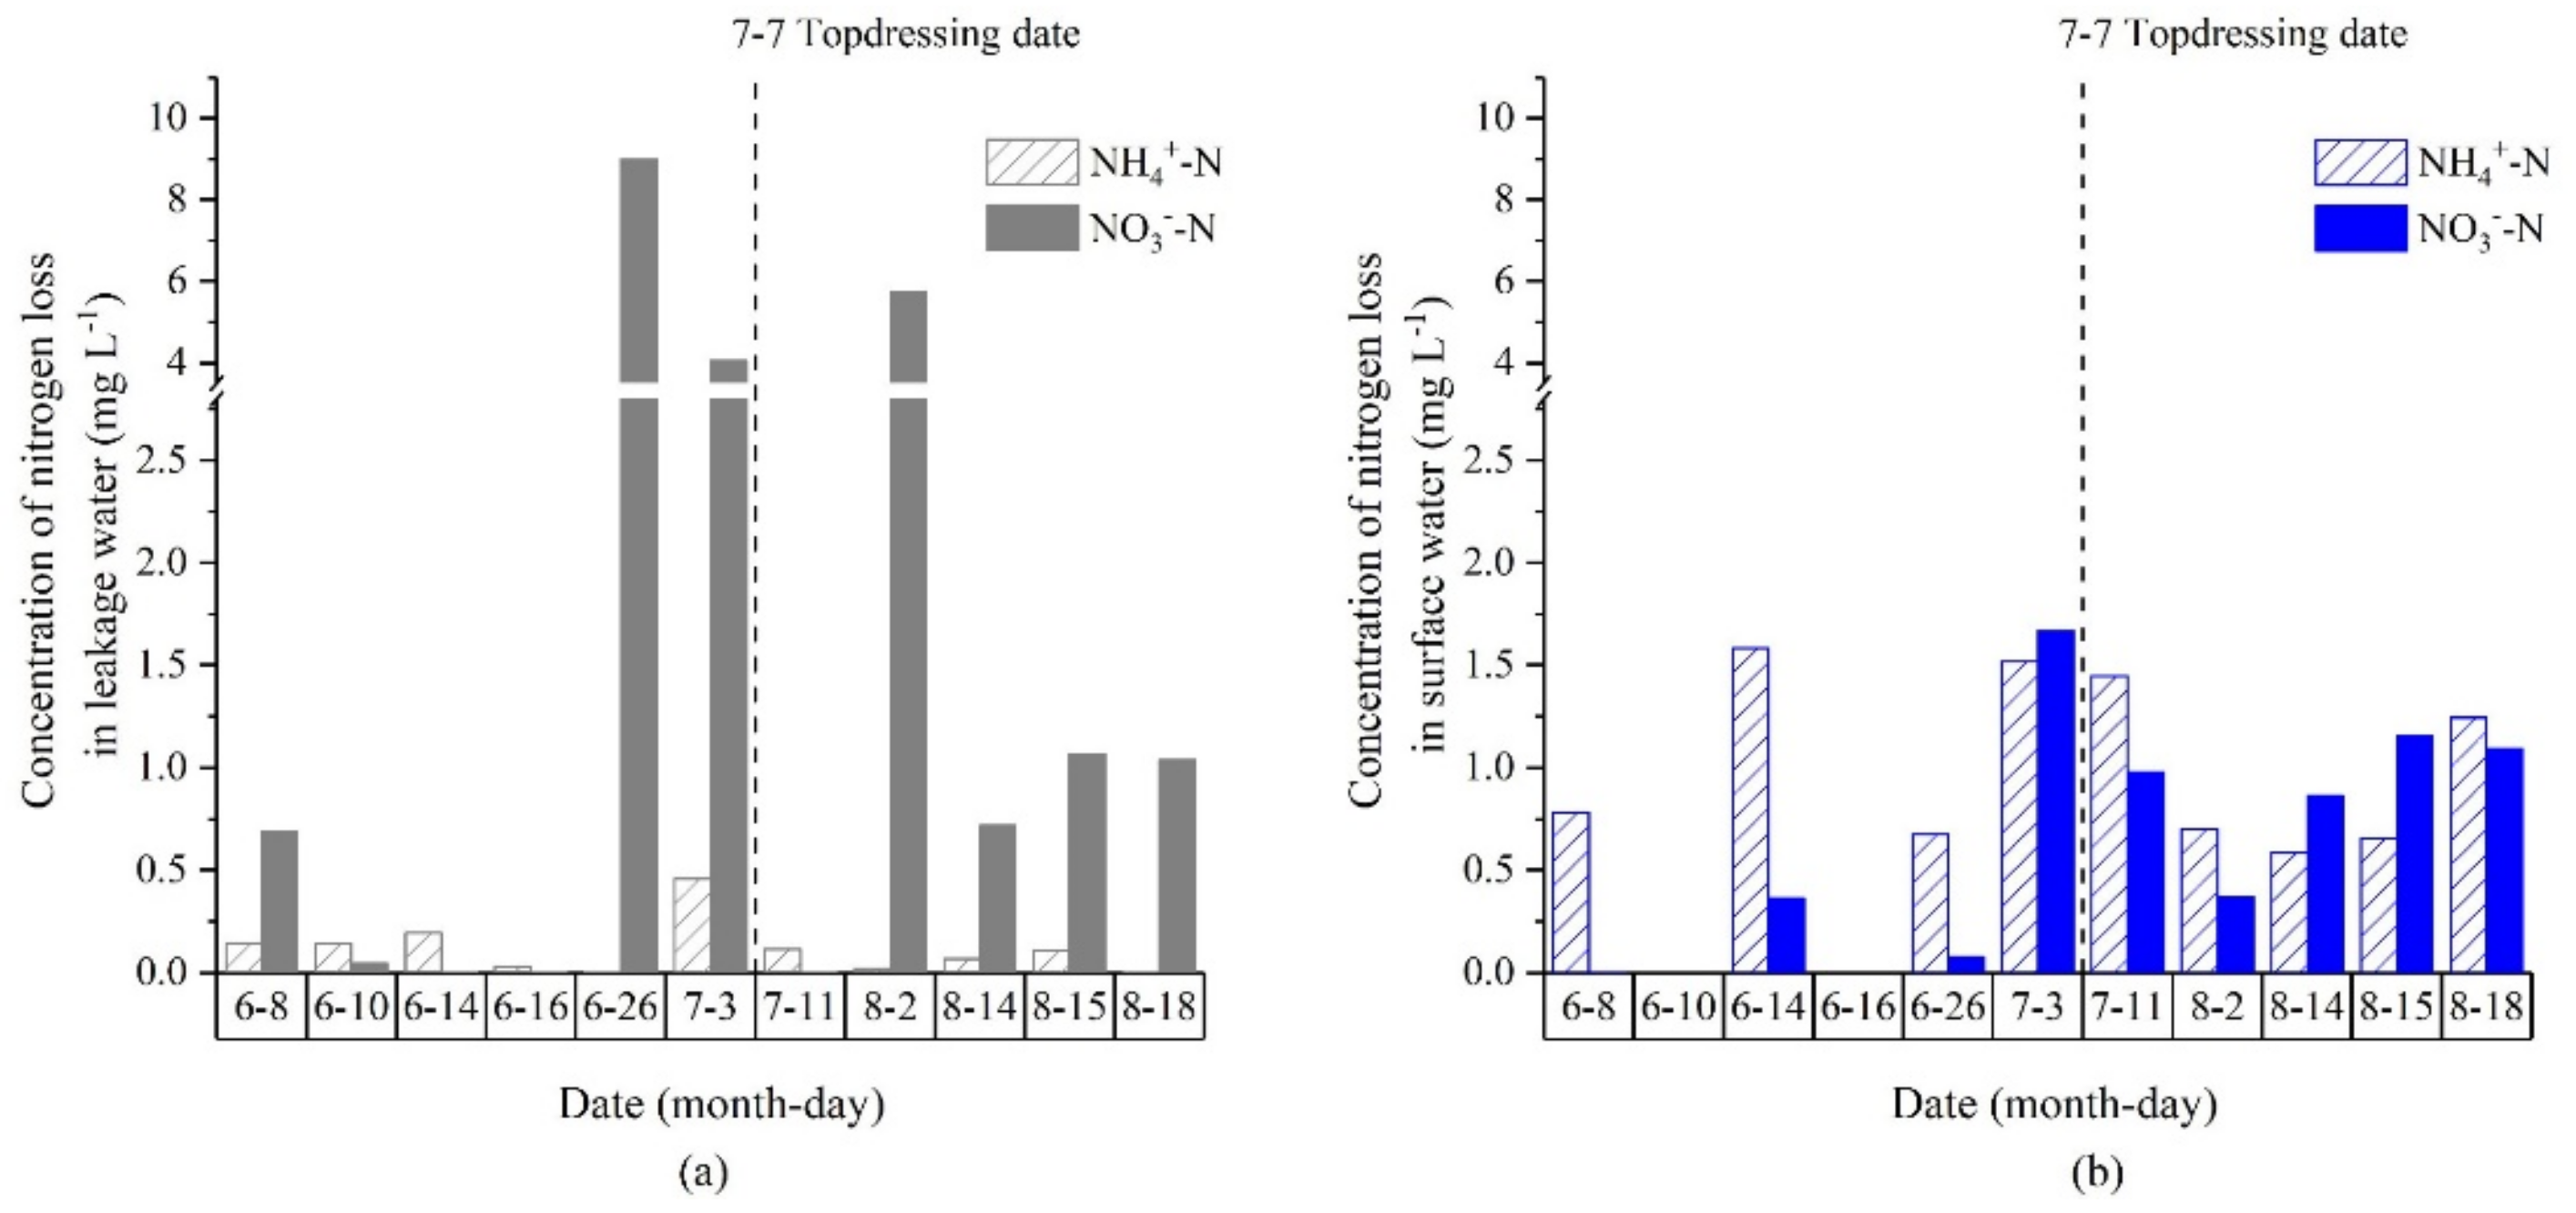
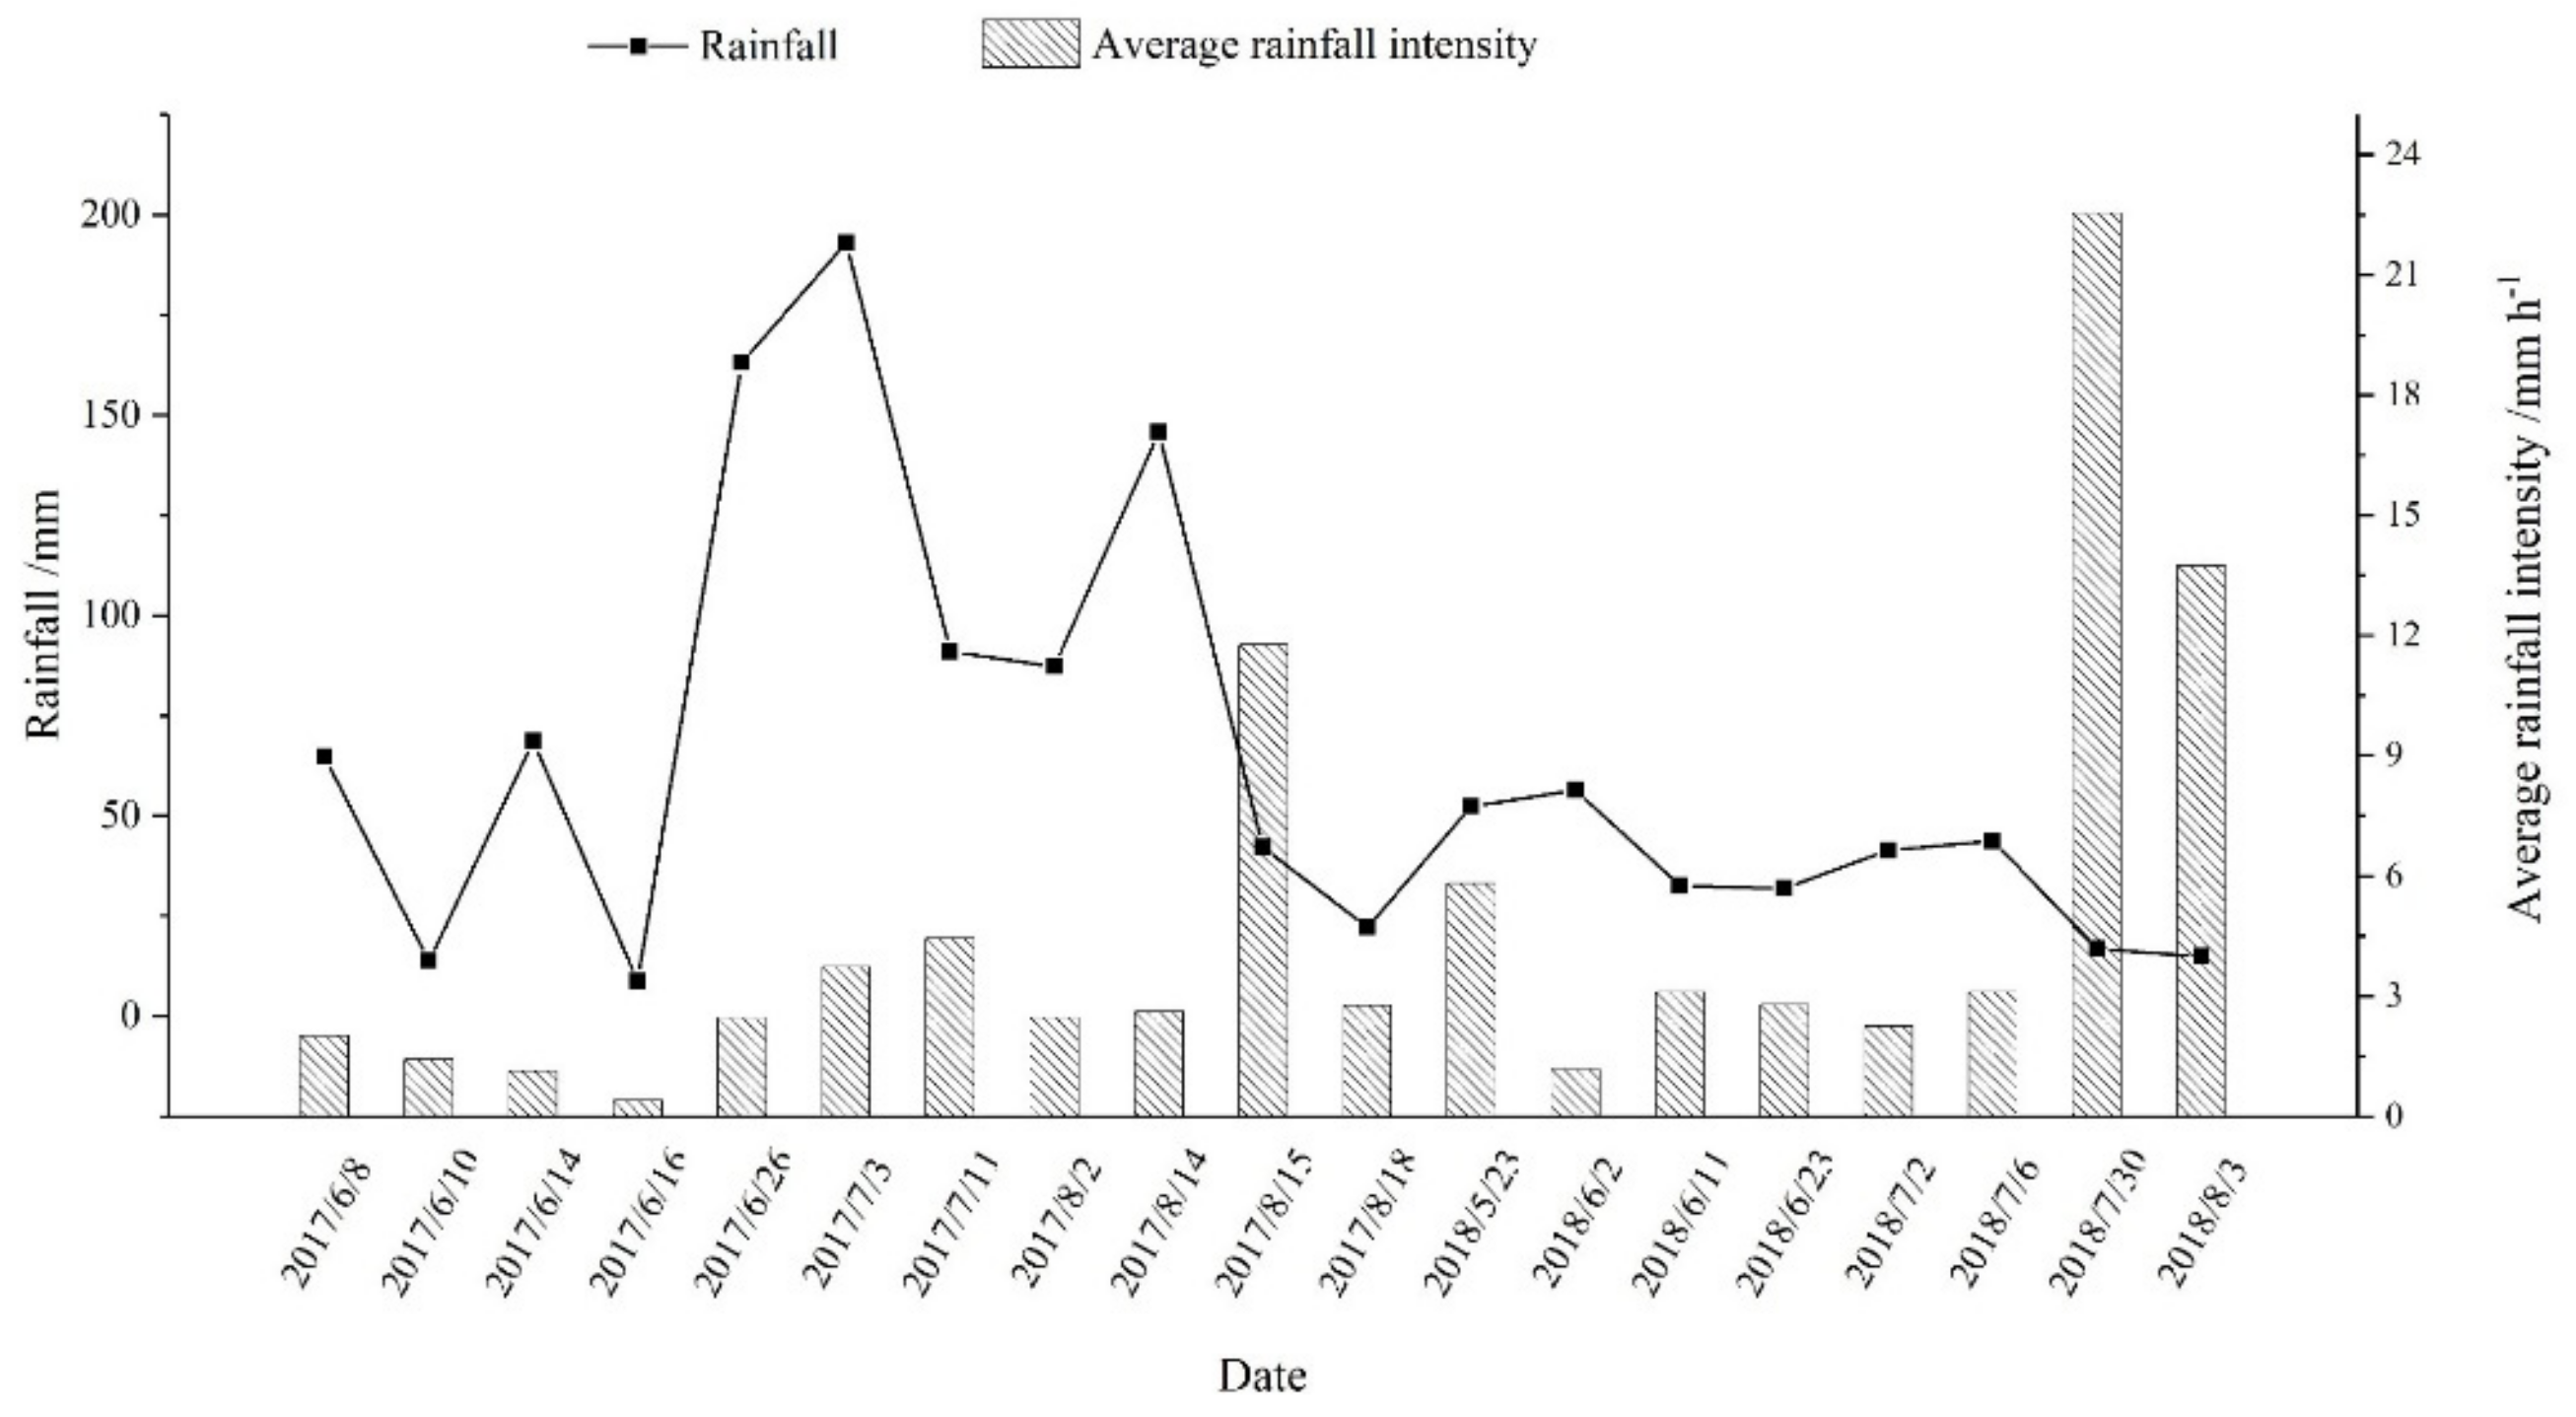
This study collected water samples from 9 runoff events and 11 leakage events during the 2017 test period. As shown in Figure 2, the concentration of NO3-N in the leakage water resulting from fertilizer application was consistently high, while the concentration of NH4+-N was lower. The concentration of NH4+-N in runoff water was equivalent to or even higher than that of NO3-N. For both leakage and runoff water, the peaks of NH4+-N and NO3-N during the base fertilizer period were higher than those of NH4+-N and NO3-N during the topdressing period. This could be related to a higher fertilizer application amount at the base fertilizer stage than at the topdressing stage. The variation in amount of a single rainfall event causing runoff during the growing season ranged from 8.8 to 193.1 mm, with an average of 81.9 mm. The variation of rainfall intensity in a single runoff event ranged from 0.40 to 11.78 mm h−1 with an average of 3.21 mm h−1 (Figure 3). Correlation analysis (Table 1) showed that the NO3-N concentration in leakage water associated with urea fertilizer in the peanut growing season had a significant positive correlation with runoff–rainfall (p < 0.05). The NO3-N concentration of runoff water had a strongly significant correlation with the rainfall intensity (p < 0.01).
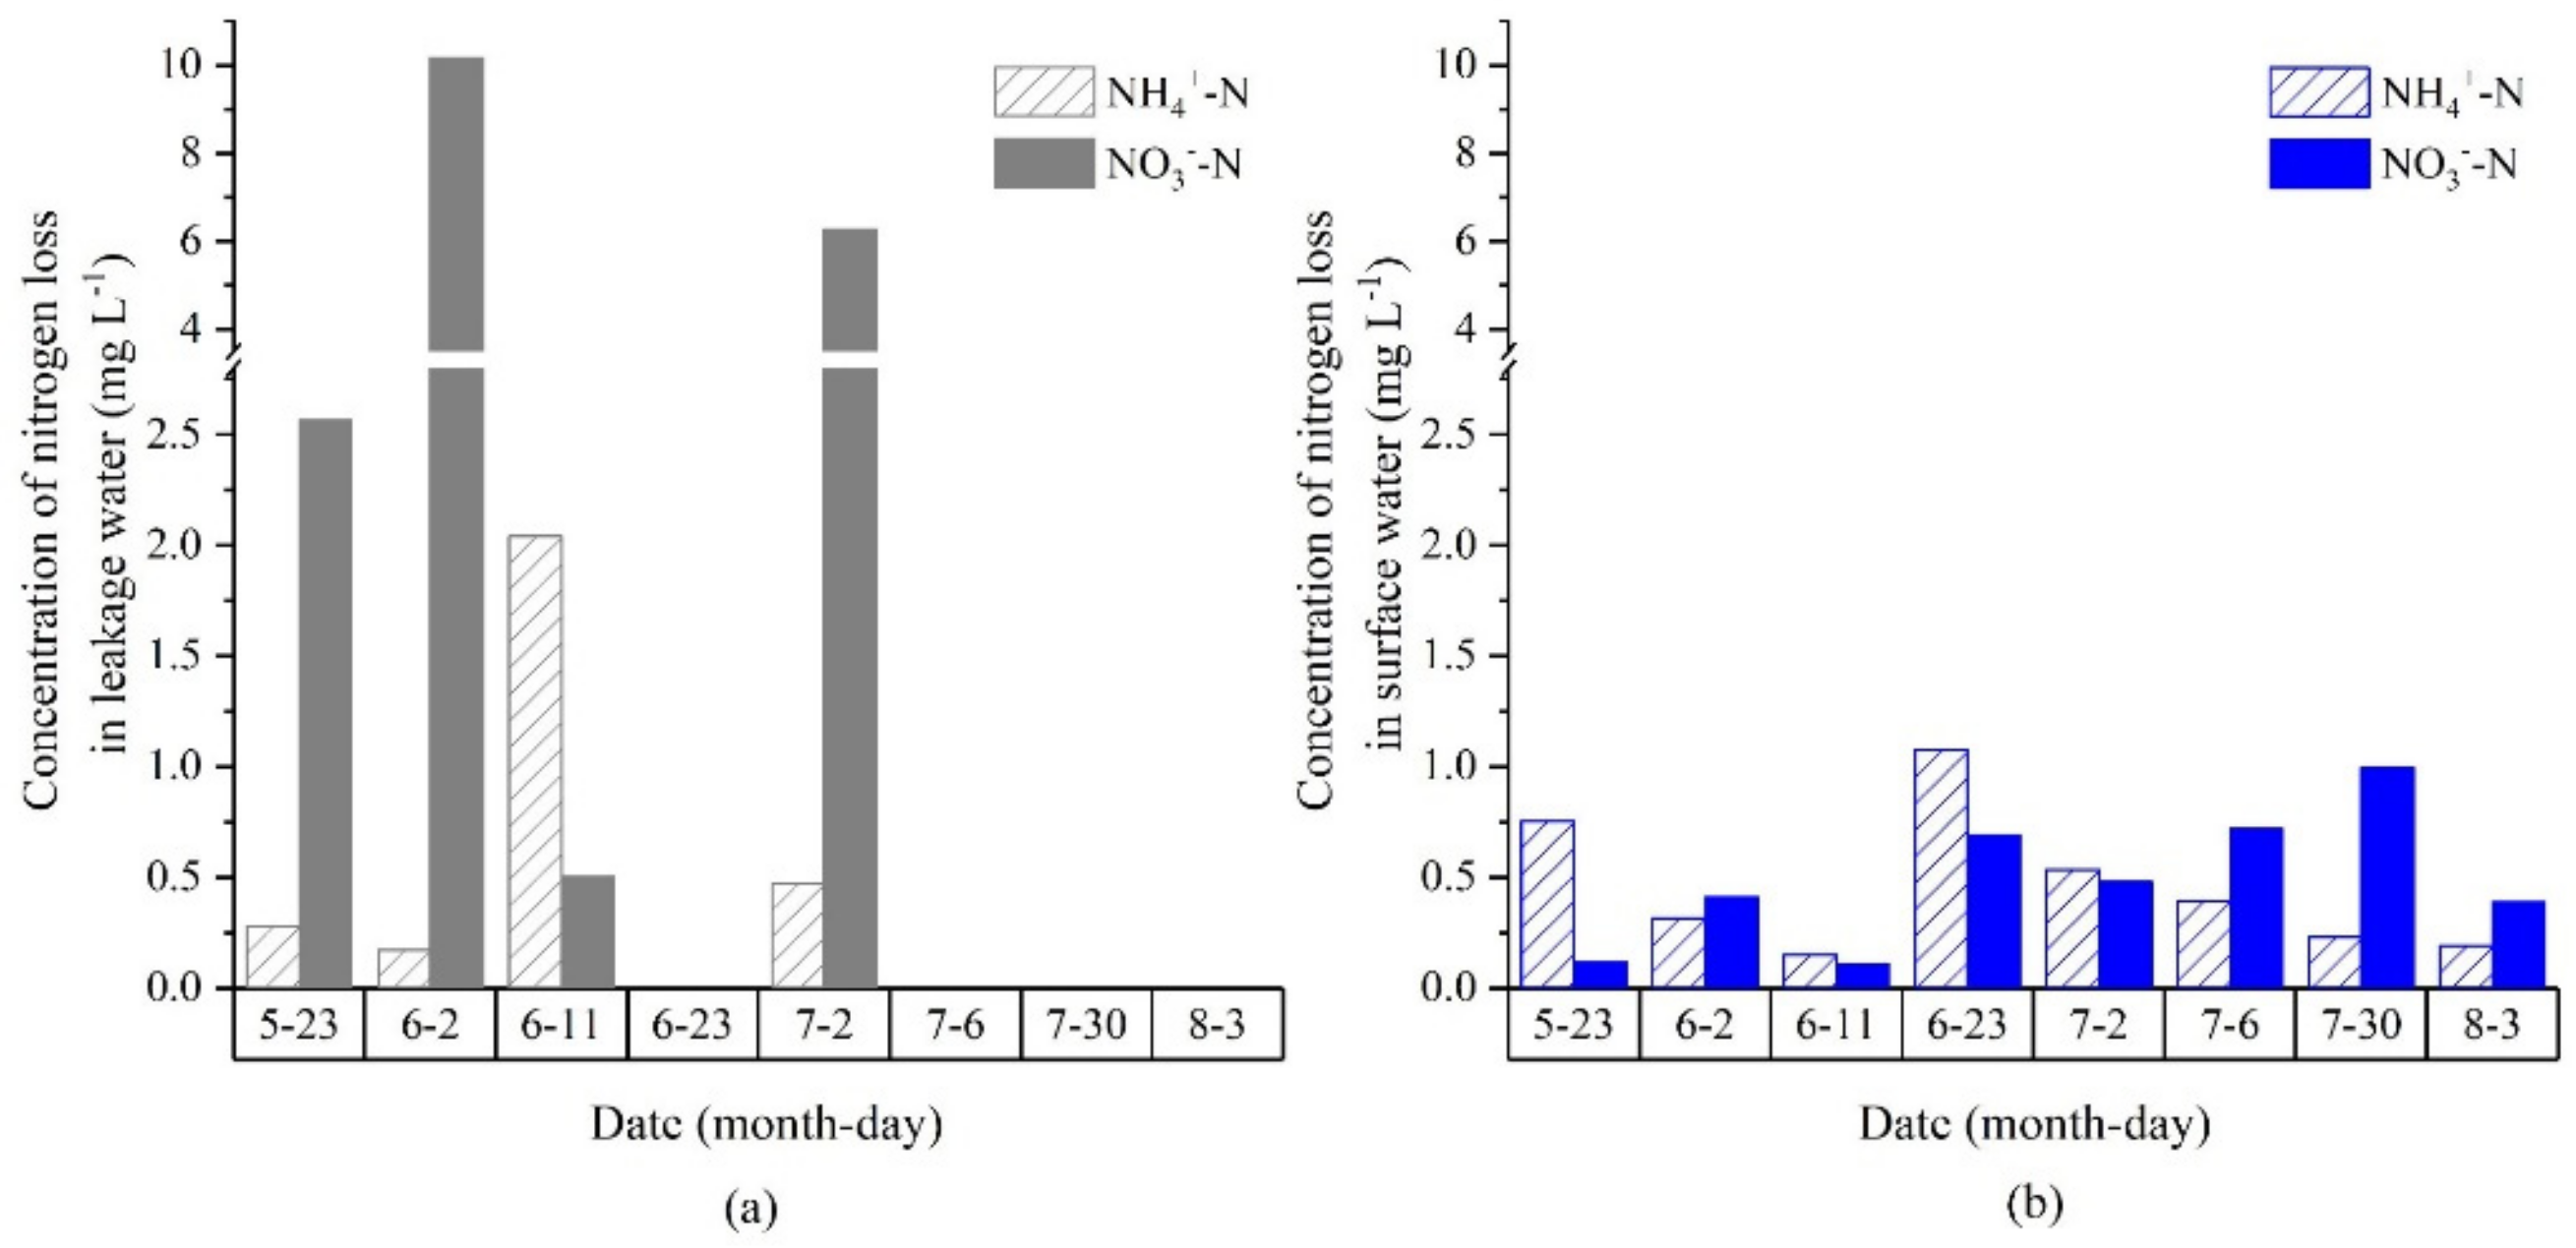
In this study, water samples from 8 runoff and 4 leakage events were collected during the 2018 test period. As shown in Figure 4, the concentration of NO3-N in leakage water during the whole test period was higher than that of the NH4+-N concentration, while the concentration of NH4+-N in the runoff water was not much different from the concentration of the NO3-N; this was consistent with the 2017 results. The variation in single runoff–rainfall during the growing season ranged from 14.9 to 56.5 mm with an average of 36.3 mm. The variation of rainfall intensity in a single runoff event ranged from 1.17 to 22.53 mm h−1 with an average of 6.82 mm h−1 (Figure 3). Correlation analysis (Table 1) showed that the NO3-N concentration of leakage water caused by urea fertilizer in the peanut growing season was significantly positively correlated with the runoff–rainfall.

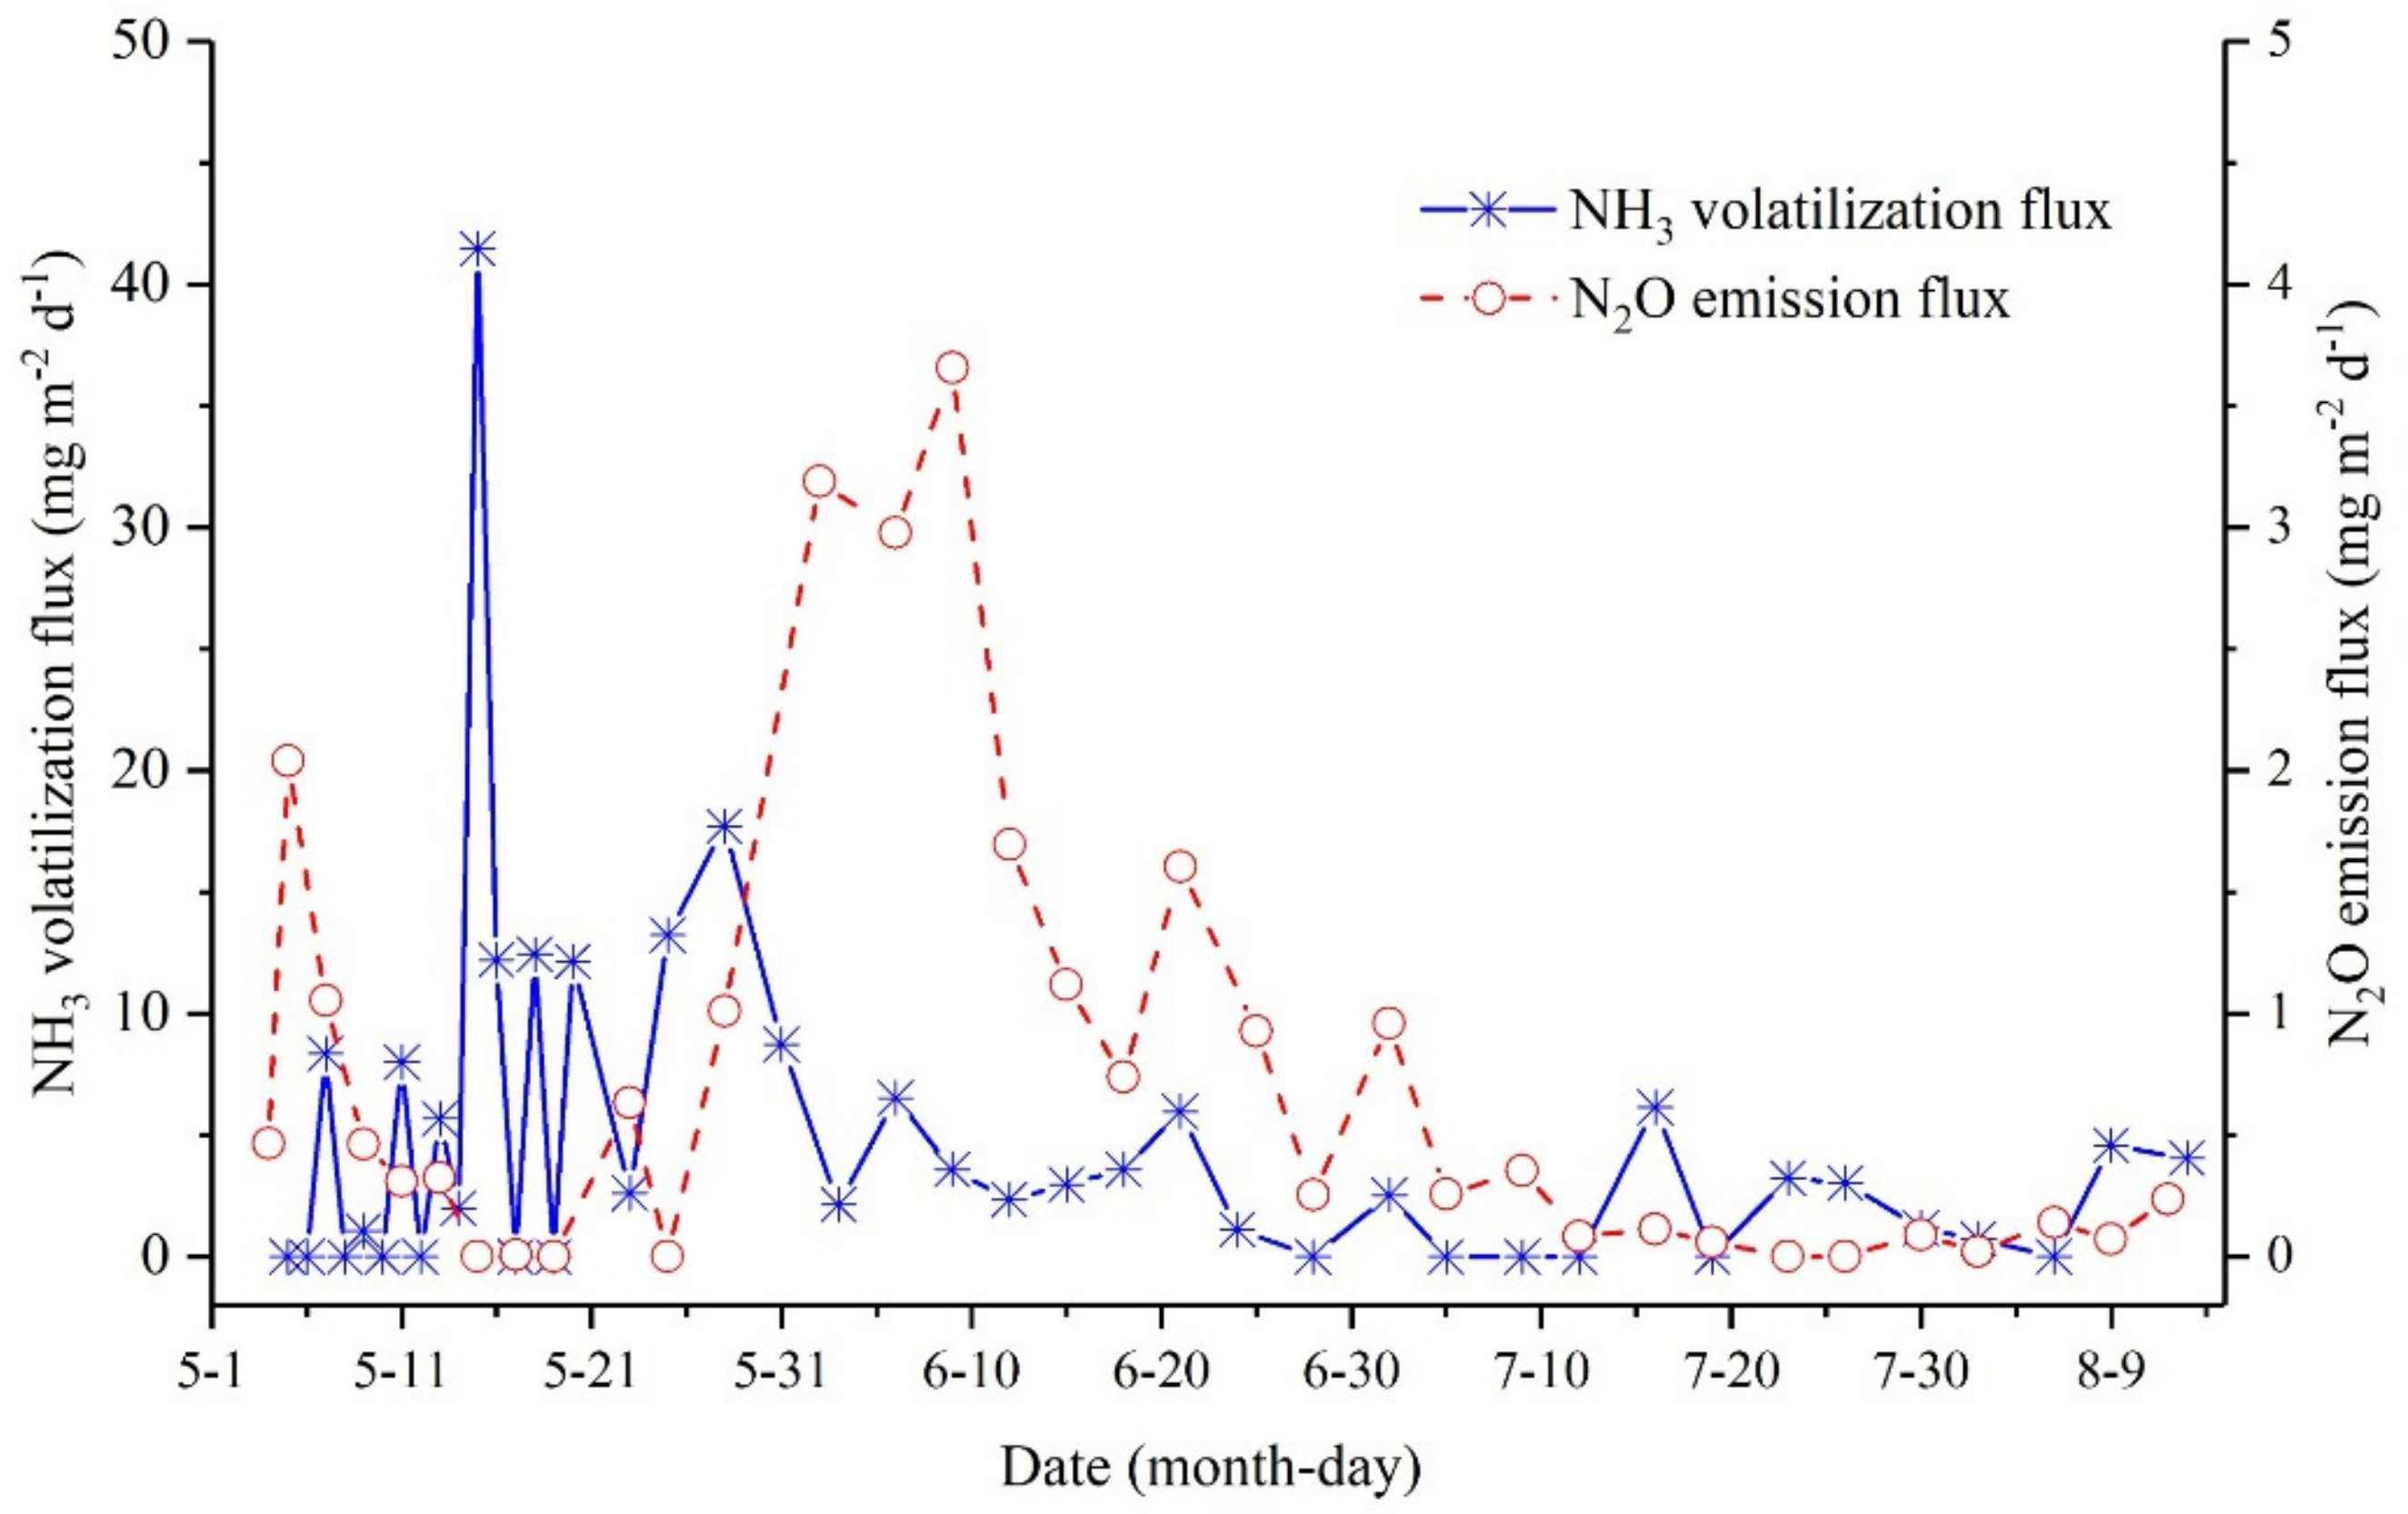
3.1.2. Emission Flux of Active Nitrogen via Gas

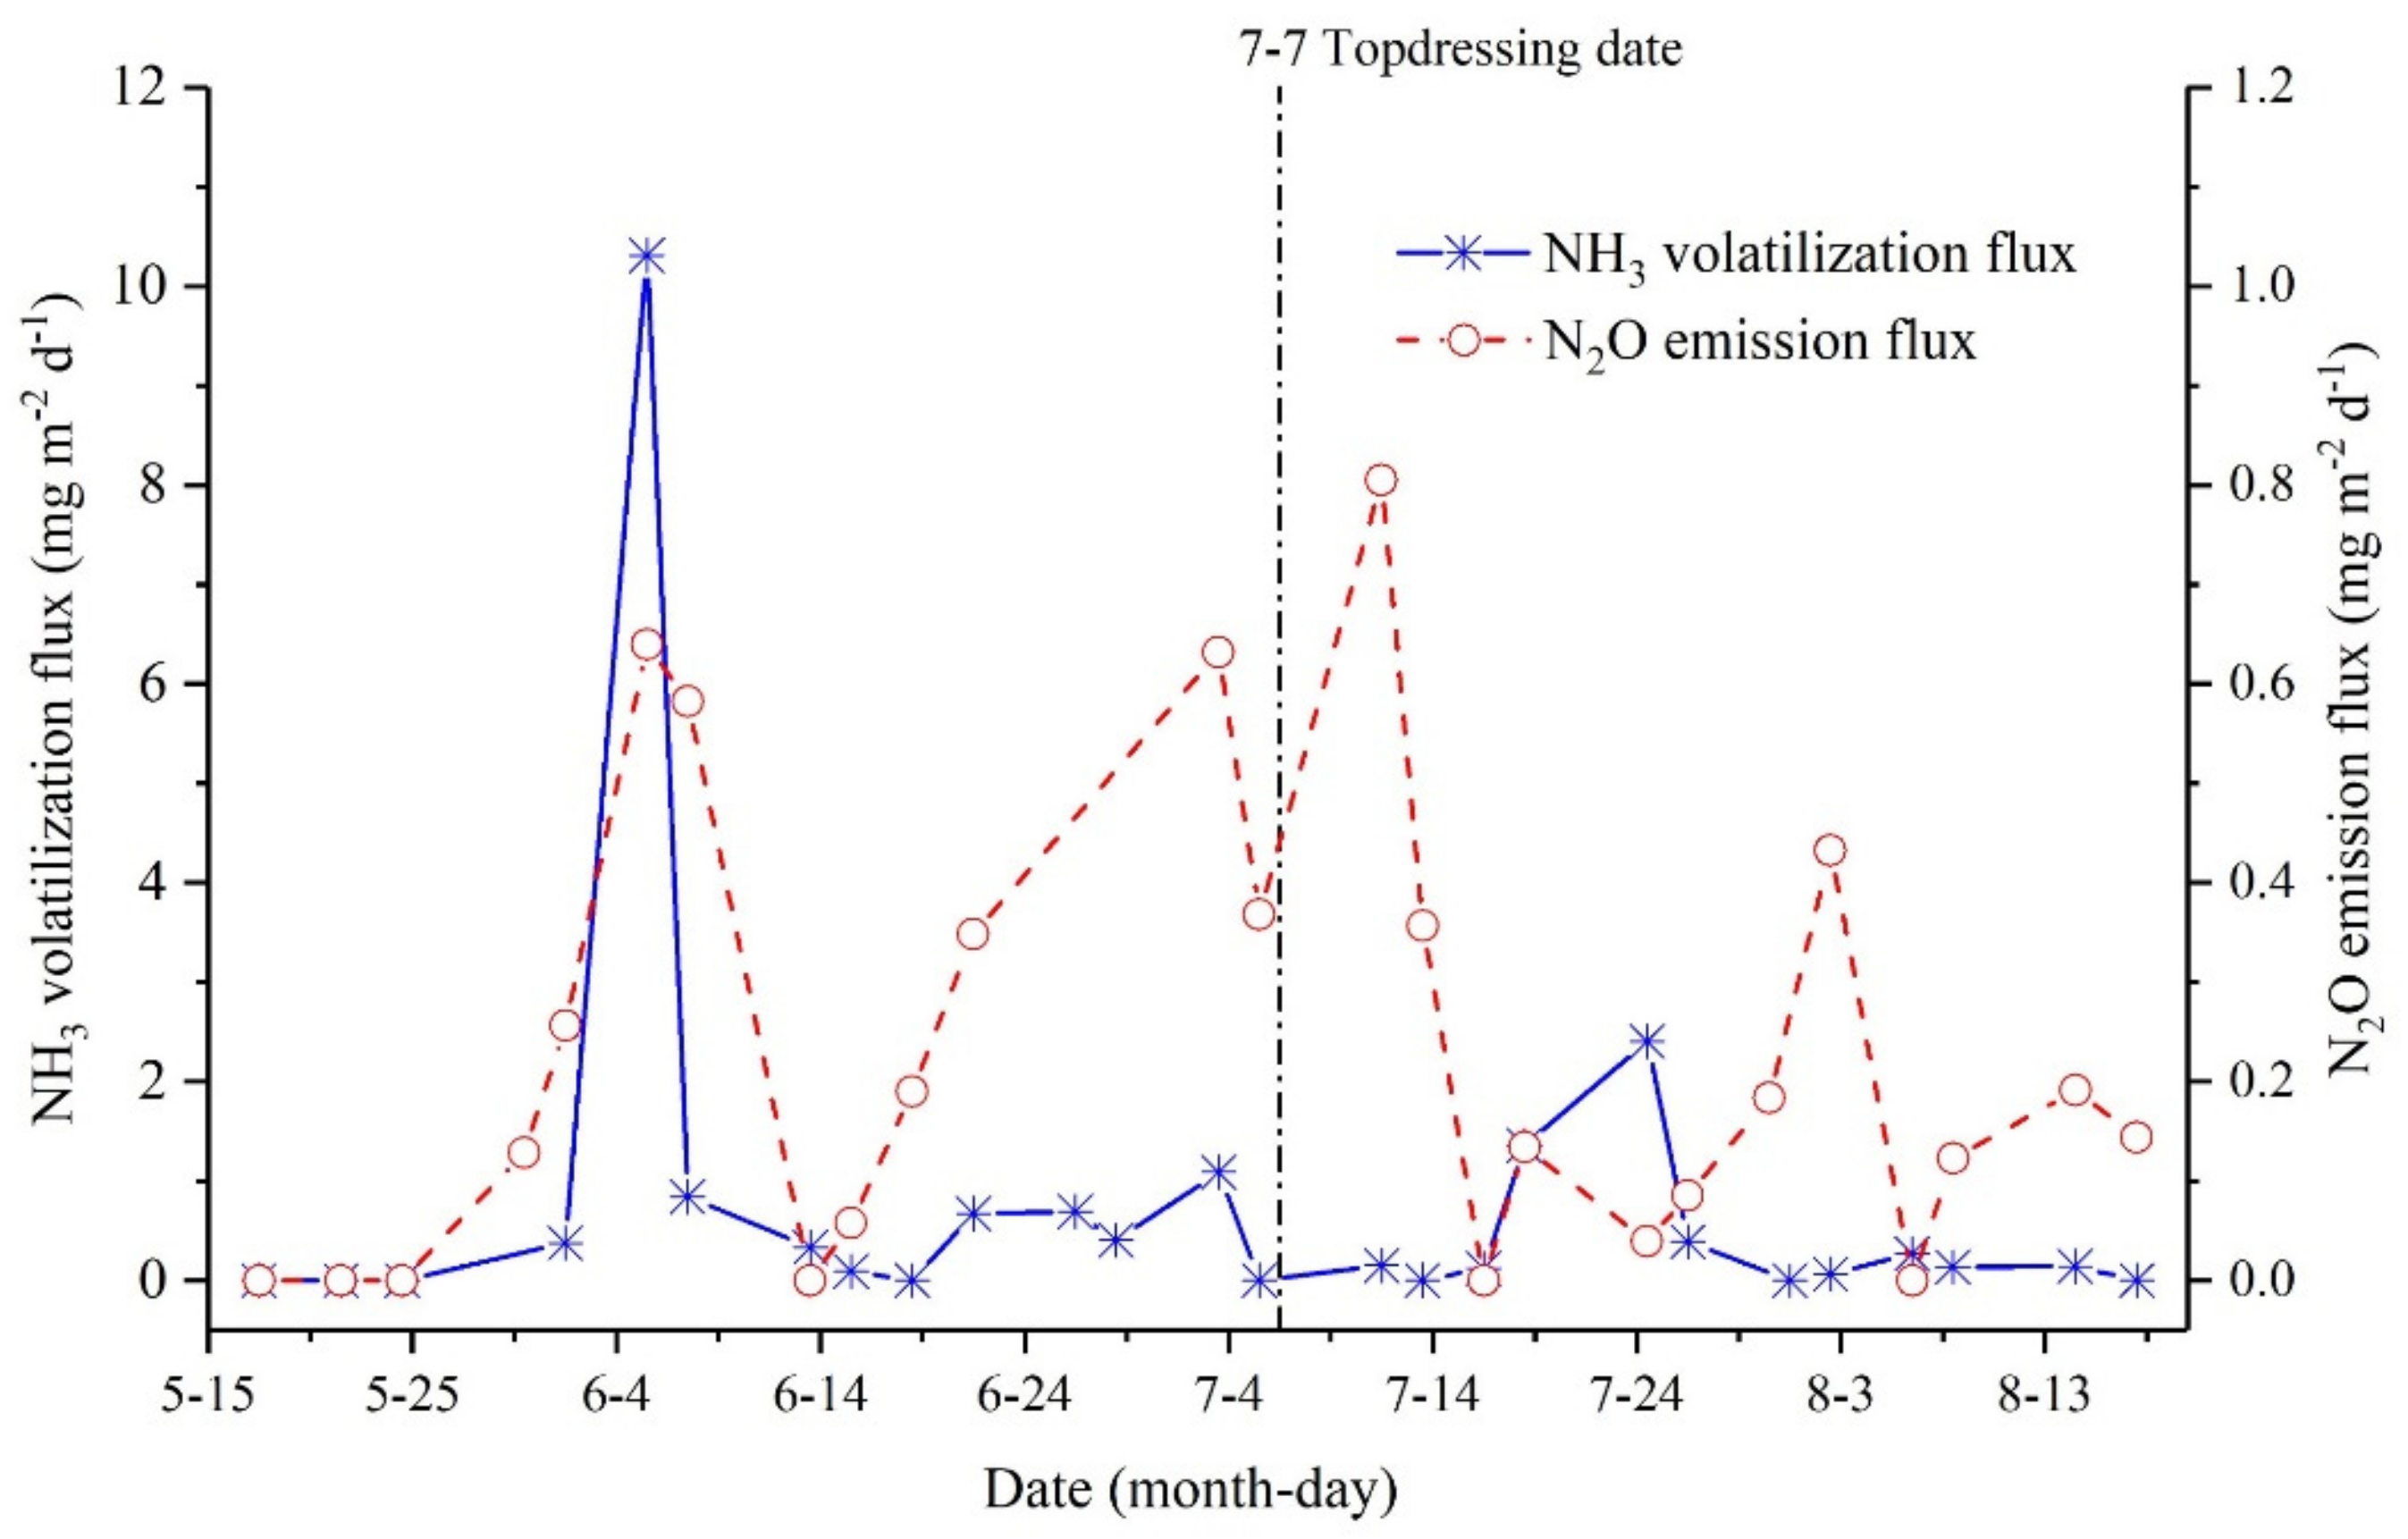
As shown in Figure 5, during the peanut growing season in 2017, NH3 emission flux peaked on the 20th day after basal N application, and then gradually decreased; the peak appeared again on the 18th day after the topdressing N application. The peak value of NH3 emission flux at the urea topdressing stage was significantly lower than that at the urea base fertilizer stage. This was mainly related to the ratio of urea base fertilizer and topdressing being 3:2. The high emission of N2O caused by fertilization occurred 16–22 d after base fertilizer application and 5–7 d after topdressing application. N2O emission flux peaked on the 20th day after base fertilizer application and peaked again on the 5th day after topdressing application. The air temperature in the growing season ranged from 21.8 to 34.4 °C with an average of 27.9 °C; the soil temperature ranged from 22.3° C to 35.1 °C with an average of 28.4 °C; and the soil water content ranged from 3.66% to 20.11% with an average of 14.84% (Figure 6). Correlation analysis (Table 2) revealed that N2O emission caused by urea fertilizer in the peanut growing season of 2017 significantly correlated with the soil water content only (p < 0.05).
As shown in Figure 7, during the peanut growing season of 2018, NH3 emission flux peaked on the 11th day after urea application, and then gradually decreased to a low value with only slight fluctuations. High emission of N2O occurred between days 1–3 and 29–39 after urea application; the highest peak appeared on the 36th day. The air temperature in the growing season of 2018 ranged from 26.8 °C to 33.7 °C, with an average of 28.6 °C; the soil temperature from 20.9 °C to 31.8 °C with an average of 27.0 °C; and the soil water content from 8.05% to 19.80% with an average of 14.81% (Figure 6). Correlation analysis (Table 2) showed that the N2O emission flux caused by nitrogen application in the peanut growing season of 2018 correlated significantly with soil temperature, soil water content, and air temperature (p < 0.01).

3.2. Comparison of the Loss Amount and Loss Rate of Active Nitrogen from Different Pathways

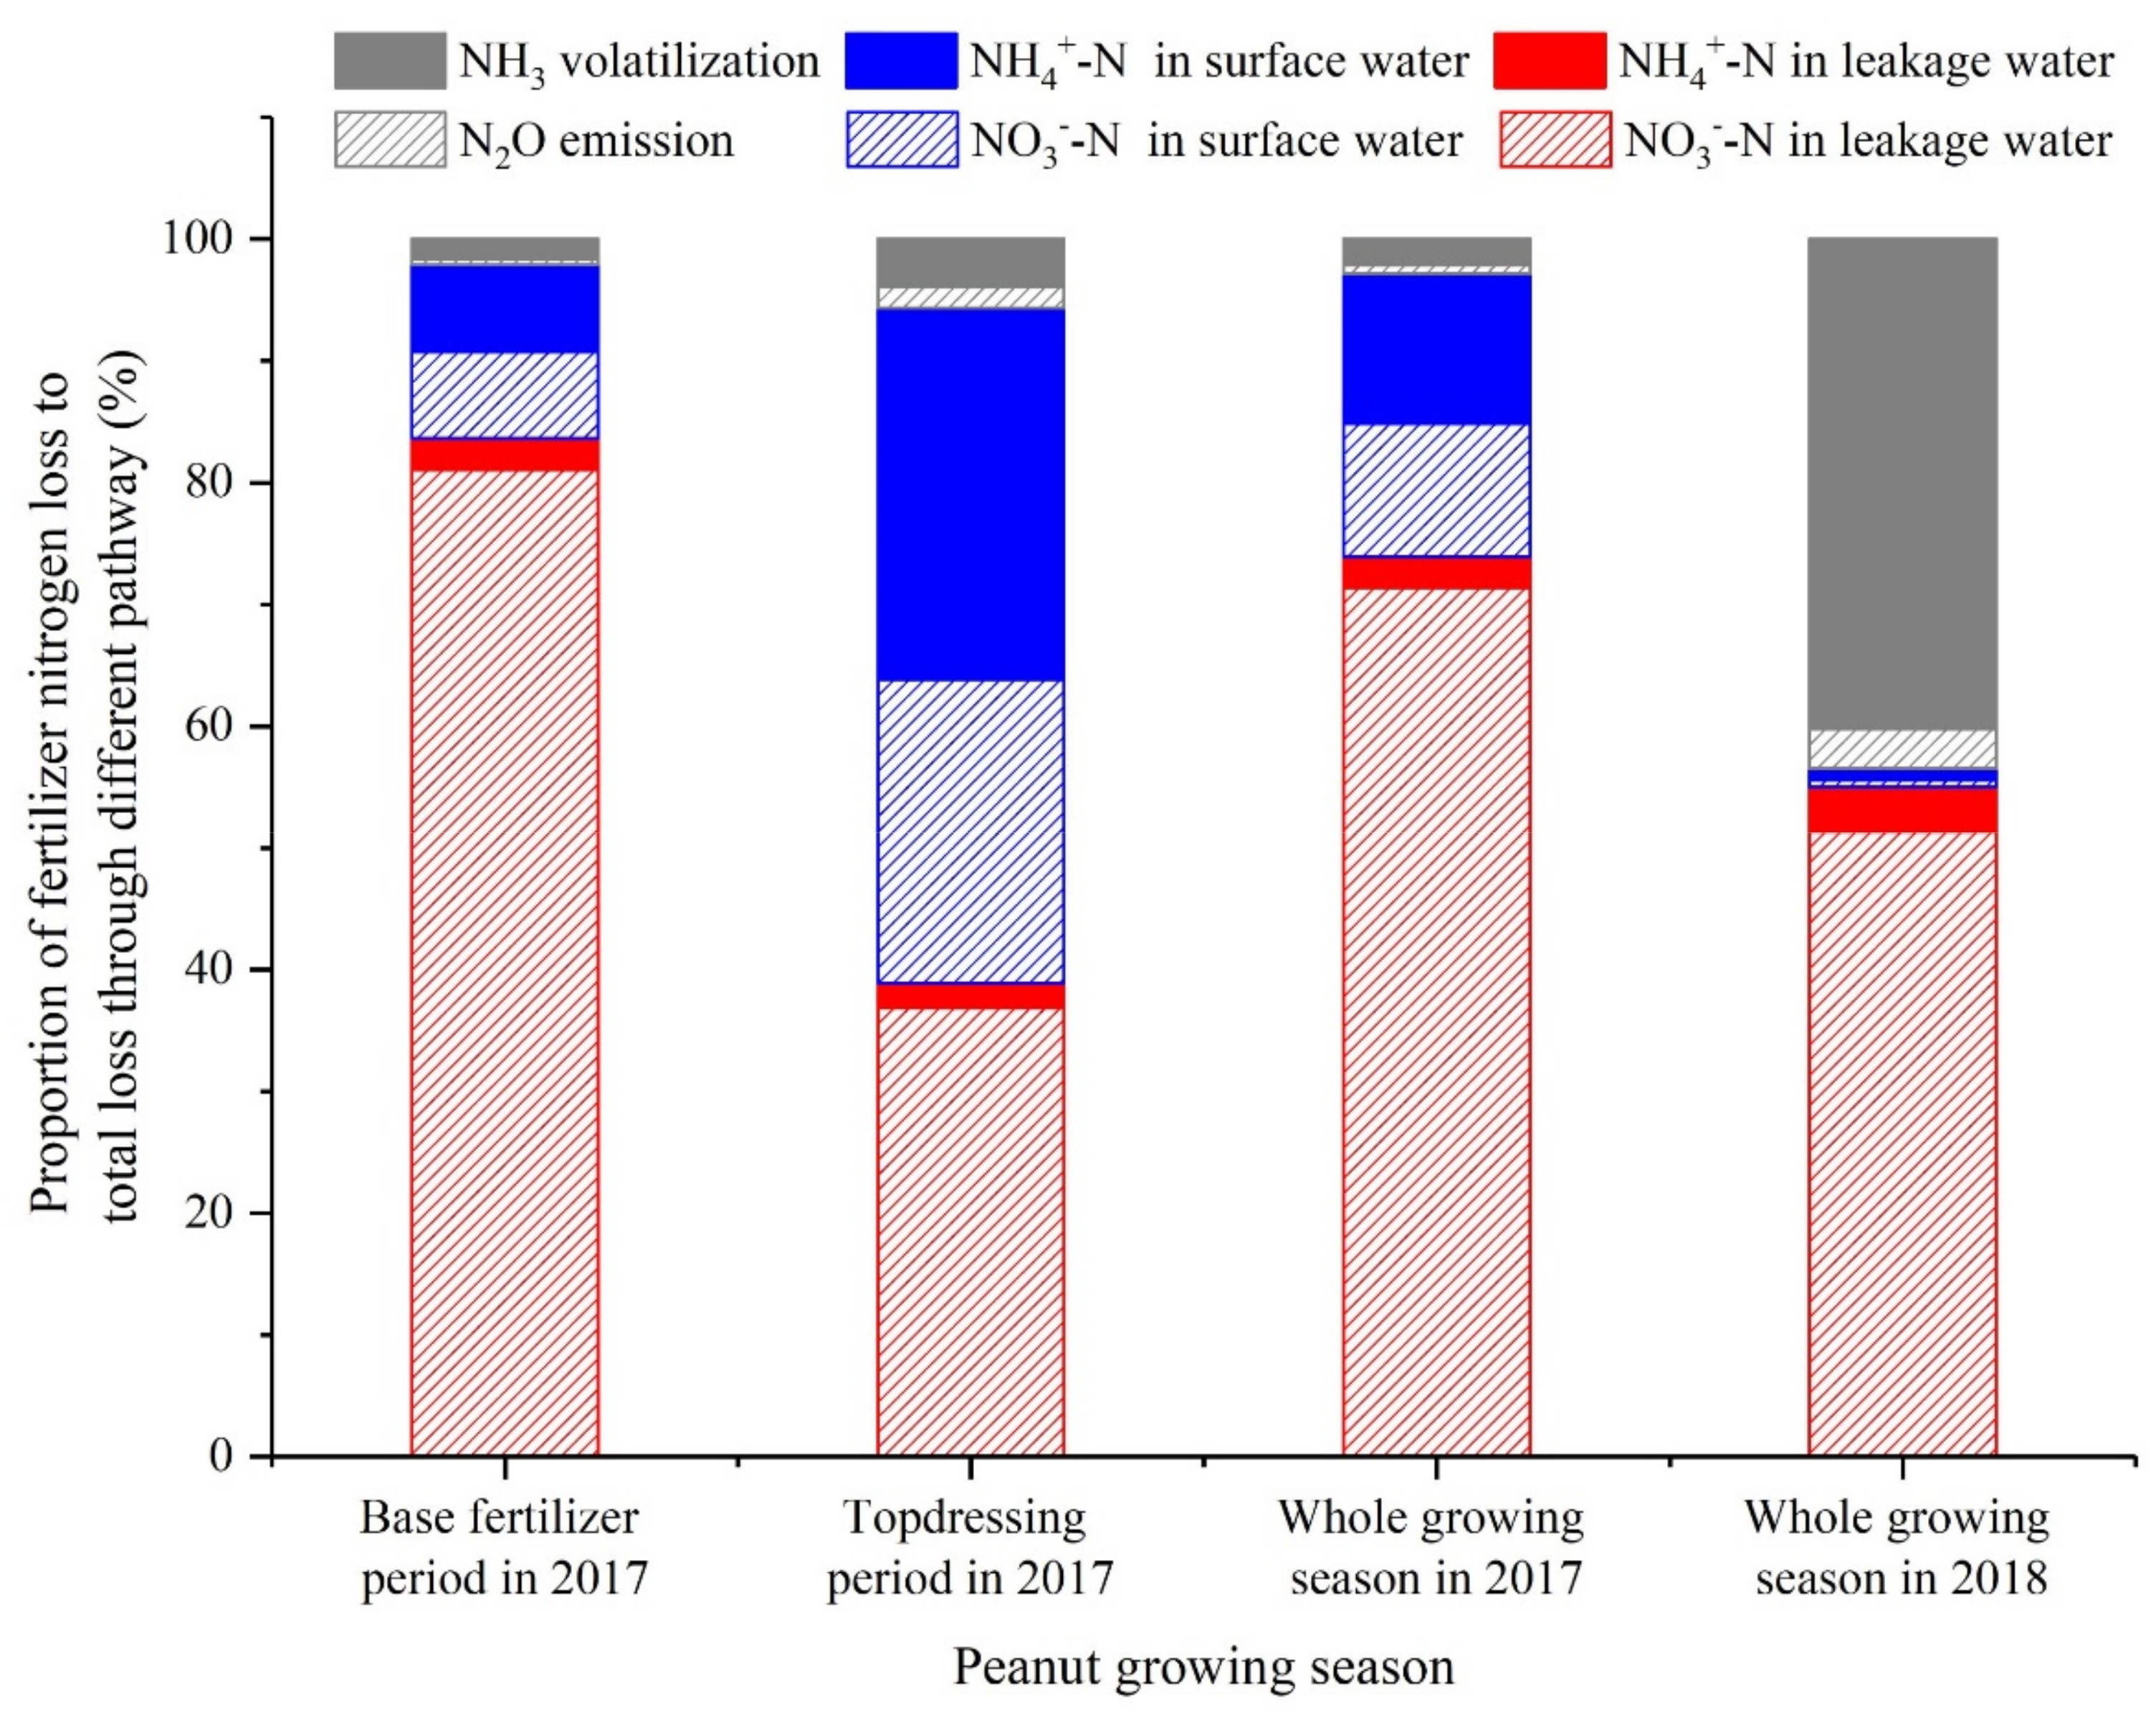
The cumulative loss amount of active nitrogen in different pathways during different periods was calculated separately (Table 3 and Figure 8). In 2017, the urea–N loss pathway caused by base fertilizer application was mainly NO3-N leakage, which accounted for approximately 81.1% of the total urea–N loss during the base fertilizer period. Surface runoff losses of NH4+-N and NO3-N were equivalent, accounting for approximately 7% of the total urea–N loss in the base fertilizer season. NH4+-N leakage loss, N2O emission, and NH3 volatilization were lower than 3% during the base fertilizer period. The urea-N loss pathway caused by topdressing application in 2017 was mainly nitrate surface runoff and deep leakage loss, accounting for 24.9–36.9% of total urea–N loss during the topdressing period. The surface runoff loss of NH4+-N was significant, accounting for 30.6% of the total urea–N loss during the topdressing period, while N2O emissions, NH3 volatilization, and NH4+-N leakage losses were less than 4%. Since the nitrogen application in the base fertilizer period was greater than that in the topdressing period, the total nitrogen loss in four pathways in the base fertilizer period was 3.6 times that of the topdressing period. Combined with statistics from the whole peanut growing season in 2017 and 2018, NO3-N leakage loss was the highest, accounting for 51.3–71.4% of the total urea–N loss in each test period. This indicates that urea–N was first converted to NH4+-N, and then converted to NO3-N, which was mainly lost as nitrate.
Based on the loss rate of active nitrogen fertilizer (the percentage of active nitrogen loss to nitrogen application) in different periods and different pathways (Table 4), the N leakage loss rates were the highest both in the test period of 2017 and 2018, followed by the N runoff loss rate or NH3 volatilization coefficient; the N2O emission coefficient was the lowest. The N leakage loss rate was the highest, which is due to the facts that the red soil is acidic with a variable charge, the soil cation exchange capacity is low, and the nitrogen storage capacity is weak, which results in high levels of nitrogen leaching. The N2O emission coefficient was the lowest, as N2O emission had a very significant negative correlation with pH [17]. In this study, the soil pH was approximately 5.0, and acidic red soil is not conducive to N2O emissions.

4. Discussion

4.1. The Form of Active Nitrogen Loss in Water

Runoff and leakage are important pathways for active nitrogen loss. In the past, most studies have considered active nitrogen in leakage and runoff water mainly as NO3-N [15,22,23]. This study found that the main forms of nitrogen in leakage water and runoff water are different.
For runoff water, regardless of the concentration (Figure 2 and Figure 4) or cumulative amount (Table 3), the NH4+-N in runoff water caused by fertilization is equivalent to or even higher than that of NO3-N (the average concentration of NH4+-N in runoff water in 2017 and 2018 was 1.4 times and 0.9 times of the average concentration of NO3-N, respectively; the loss in the amount of NH4+-N was 1.1 times and 1.9 times of that of NO3-N, respectively). This is related to the form of the nitrogen in the fertilizer and the presence of heavy rainfall. Urea is an amide nitrogen fertilizer, which needs to be hydrolyzed to ammonium by urease and then converted to nitrate by microorganism-aided nitrification [24]. The nitrogen in urea is hydrolyzed into NH4+-N under heavy rainfall and is washed away before being transformed into NO3-N. The relationship is also related to soil colloid and the position of nitrogen fertilizer. Surface runoff contains more suspended matter such as soil colloids, which are generally negatively charged. NH4+-N is positively charged, which is easily adsorbed by colloids, while NO3-N is negatively charged, which is not easily adsorbed.
For leakage water, regardless of the concentration (Figure 2 and Figure 4) or cumulative amount (Table 3), NO3-N accounted for a dominant proportion of the leaching loss pathway (the average concentration of NO3-N in leakage water in the test period of 2017 and 2018 was 17.4 times and 6.6 times of the average concentration of NH4+-N, respectively; the loss amount of NO3-N accounted for 96.6% and 93.3% of inorganic nitrogen loss in leakage water, respectively). This is consistent with the conclusions of most research [15,22,23]. Urea that is applied to the soil is converted to nitrate via nitrification by nitrobacteria; this increases the concentration of NO3-N in the soil solution. Under water infiltration, NO3-N leakage is highly likely. In addition, leakage water has a longer interaction time with soil than surface runoff water and can dissolve more nitrogen from soil, resulting in more dissolved nitrogen per unit of leakage water.

4.2. Potential Harm of Active Nitrogen Loss in Water

According to the Environmental Quality Standard for Surface Water (GB3838–2002) of China, the highest concentration of NH4+-N in surface runoff water during the 2017 test period (1.585 mg L−1) was higher than the standard value (1.5 mg L−1) of Class IV water quality. The average concentration (1.022 mg L−1) also exceeded the standard value (1.0 mg L−1) of the Class III water quality. The average concentration (0.454 mg L−1) of NH4+ -N in the surface runoff during the 2018 test period was slightly lower than the standard value (0.5 mg L−1) of the Class II water quality, but the highest concentration (1.074 mg L−1) exceeded the standard value (1.0 mg L−1) of the Class III water quality. According to the Standard for Groundwater Quality (GB/T 14848-2017) of China, the concentrations of NO3-N in the leakage water during the peanut growing season in 2017 and 2018 were lower than the standard value (20.0 mg L−1) of the Class III water quality. It could be inferred that the loss of active nitrogen in the water caused by fertilizer application in this experiment is a potential threat to surface water and a relatively smaller threat to groundwater.
The study also found that leaching was the main pathway of active nitrogen loss after base fertilizer, while runoff and leakage accounted for the majority of active nitrogen loss after topdressing. This was mainly related to the choice of fertilization methods and the rainfall conditions. In this test, after the base fertilizer was mixed into the topsoil (0–10 cm) in 2017, the fertilizer nitrogen was easily leached with leakage water. However, after the application of topdressing, the fertilizer was directly exposed to the soil surface, and heavy rainfall was frequent in this region. For example, on 30 July and 14 August in 2017, rainfall at an intensity of 4.46 and 11.78 mm h−1 occurred consecutively, and surface runoff occurred before infiltration; consequently, more nitrogen was removed by runoff. As mentioned above, the potential threat from active nitrogen loss caused by fertilization is greater in surface water than leakage water. Therefore, reducing the runoff generation capacity of slope surface and reducing the nitrogen content in runoff water is key to reducing nitrogen fertilizer loss in red soil sloping uplands. An effective technical approach to these is by practicing reasonable fertilization management and soil and water conservation measures, such as applying controlled release of fertilizer instead of conventional fertilizer, because larger coated fertilizer particles are not easily washed away or dissolved quickly under soil [25]. Strip fertilization or topsoil covering methods instead of spraying directly when applying topdressing, or taking protective measures such as strip grass cover and contour hedgerows, can reduce water–soil–nutrient loss [26].

4.3. Key Pathways of Active Nitrogen Loss

Active nitrogen loss is a part of nitrogen loss, which mainly includes NH3 volatilization, N2O emissions, NO3-N or NH4+-N leaching, and runoff. This study shows that the nitrogen loss rate of fertilizers varies greatly from year-to-year. The N loss rate via runoff and leakage decreased from 13.80% in 2017 to 3.15% in 2018, with large interannual variation. This might be mainly related to the difference in rainfall during the two years. As we know, there is a significant positive correlation between leaching water volume as well as runoff water volume and rainfall [25]. In 2017, total rainfall, total runoff–rainfall, and single rainfall in the peanut growing season were 2.4, 3.1, and 4.4 times that received in 2018, respectively, resulting in 12.4 times more surface runoff and 9.8 times more leakage water in 2017. In 2017, the rainy year, more nitrogen was removed by leakage or runoff pathways. In this study, the ammonia volatilization coefficient in 2018 was higher than that in 2017. The reason might be that the rain began on the third day after planting in 2017, and the rainfall during the whole test period was frequent and abundant, resulting in urea leaching into the deep layer of soil. The soil surface hardened subsequently, which hindered the diffusion and escape of ammonia into the soil surface. At the same time, high temperatures and little rain in the whole test period in 2018 was conducive to the conversion of ammonium ions to ammonia molecules in the soil. Correspondingly, the N2O emission coefficient in 2018 was also higher than that in 2017.
The application of large amounts of nitrogen fertilizer results in a lower nitrogen utilization rate and serious nitrogen loss in farmland, which is an important source of non-point source pollution or greenhouse gas emissions. This study showed that in the entire peanut growing season, the NH3 volatilization coefficient caused by urea nitrogen application was 0.31–2.24%, which was within the range of 0.14–12.93% after applying urea nitrogen in the red soil areas [13,15]. However, this is still lower than the ammonia volatilization coefficient of 11.9–20.9% after the application of urea nitrogen fertilizer in the northern damp soils under similar conditions [27,28]. It is also lower than the IPCC [29] recommended value of 10% and the national NH3 volatilization loss rate of 24% estimated by the model in China [30]. These findings confirmed that red soil ammonia is relatively low in volatilization. The N2O emission coefficient during the entire peanut growing season in this study is 0.10–0.18%, which is close to the lower limit of 0.22% for China’s upland fields [31], and is also lower than Zhu’s national estimate of 1% [8] and the international farmland recommended value of 1.25% [32]. This indicates that N2O emissions from red soil upland fields are lower. This is consistent with other findings [15]. In this study, the N runoff and leaching loss rates in 2017 and 2018 were different compared with findings in similar areas under similar conditions of nitrogen application. Zhou et al. [15] obtained the N runoff and leaching loss rate of 1.57% in the red soil drylands of a Digitaria sanguinalis pasture at a level of 160 kg N·hm−2. The data of 13.80% during the dry year (2018) were close to this, but the data of 3.15% from the wet year (2017) were significantly higher. The main reasons for these differences are the difference in rainfall, leaching time, test site, and crop types. Compared with a field experiment from Zhou et al. [15], this test period is longer, the rainfall is larger and more frequent, the leaching time is longer, and the amount of leakage water was able to be completely collected. These differences resulted in the higher N loss via runoff and leaching in 2017.
Previous studies have shown that the loss pathway after nitrogen fertilizer application is mainly via leakage and ammonia volatilization [7,15]. The results of this study are not completely consistent with the results of previous studies. In this study, the simultaneous observation of the loss of fertilizer nitrogen in the red soil drylands planted with peanut showed that for the dry year, the main pathways of artificially active nitrogen loss were leaching and ammonia volatilization. This is consistent with the previous research conclusions. However, for the wet year, the main pathways of artificially active nitrogen loss were leaching and runoff, mainly because the study site was on an arid slope and the rainfall was enough. In the peanut growing season in 2017, the rainfall was large and concentrated, resulting in high levels of soil erosion. The influence of surface runoff on fertilizer nitrogen loss increased, while the previous studies focused on the flat land, ignoring the effects of soil erosion on the loss of active nitrogen. Previous research focused on flat land from one growing season without considering the effects of interannual variations, especially in precipitation. Soil erosion not only causes the nitrogen in farmland to be lost in surface runoff, but also causes it to be lost in the granular state with erosive sediments. Since this study did not observe the particulate nitrogen carried by erosive sediments, it is highly likely that the contribution of soil erosion to the nitrogen loss of fertilizers was underestimated. The long-term effect of active nitrogen loss via NH3 volatilization, N2O emissions, NO3-N or NH4+-N leaching, runoff, and sediment simultaneously requires further study.

5. Conclusions

Under a 3:2 ratio of urea–N base fertilizer to topdressing, the peak concentration of NH4+-N or NO3-N in runoff water and leakage water, and the peak value of NH3 flux during the base fertilizer period were higher than those during the topdressing period. Regardless of the concentration or cumulative amount, NH4+-N was equal to or even higher than NO3-N in runoff water, while NO3-N was higher than NH4+-N in leakage water. Among the four pathways of active nitrogen loss caused by conventional fertilization, during the peanut growing season, N leakage loss rate was the highest, followed by N runoff loss rate or NH3 volatilization coefficient, and finally, the N2O emission coefficient. Active nitrogen loss was specifically affected by rainfall conditions and fertilization methods. For example, the dry year was dominated by leakage and ammonia volatilization, while the wet year was dominated by leakage and runoff. The base fertilizer period with topsoil mixing application was dominated by leakage, while the topdressing period with spraying application was dominated by leakage and runoff. This research helps to provide a better understanding of the loss of active nitrogen in sloped farmland ecosystems and could guide the optimization of nitrogen application management in the red soil region of China.

Author Contributions

Investigation: J.Z. and L.W.; Formal analysis: Z.L., X.N. and H.Z.; Funding acquisition: H.Z., Z.L. and X.N.; Supervision: H.Z.; Writing-original: H.Z.; Writing-editing: H.Z. and Z.L.

Funding

We gratefully acknowledge the National Key Research and Development Program of China (2017YFC0505406), funding support from the National Natural Science Foundation of China (41761060 and 41601297), the Natural Science Foundation of Jiangxi Province in China (20171ACB21072 and 20171BAB213022), and the Program for Excellent Talents of Jiangxi Province in China (20171BCB23080).

Acknowledgments

We would like to thank Faxing Shen and Xiaodan Hu for field observations during the whole experiment. We are grateful for the constructive comments on this manuscript from the reviewers and editors.

Conflicts of Interest

The authors declare no conflict of interest.

References

  1. Sutton, M.A.; Oenema, O.; Erisman, J.W.; Leip, A.; van Grinsven, H.; Winiwarter, W. Too much of a good thing. Nature 2011, 472, 159–161. [Google Scholar] [CrossRef] [PubMed] [Green Version]
  2. Denk, T.R.A.; Mohn, J.; Decock, C.; Lewicka-Szczebak, D.; Harris, E.; Butterbach-Bahl, K.; Kiese, R.; Wolf, B. The nitrogen cycle: A review of isotope effects and isotope modeling approaches. Soil Biol. Biochem. 2017, 105, 121–137. [Google Scholar] [CrossRef] [Green Version]
  3. Zhu, B.; Zhou, M.H.; Zhu, F.H.; Wang, T. Measurement and simulation of nitrogen leaching loss in hillslope cropland of purple soil. Chin. J. Eco-Agric. 2013, 21, 102–109. [Google Scholar]
  4. Zhao, H.; Li, X.Y.; Jiang, Y. Response of nitrogen losses to excessive nitrogen fertilizer application in intensive greenhouse vegetable production. Sustainability 2019, 11, 1513. [Google Scholar] [CrossRef]
  5. Aguilera, E.; Lassaletta, L.; Sanz-Cobena, A.; Garnier, J.; Vallejo, A. The potential of organic fertilizers and water management to reduce N2O emissions in Mediterranean climate cropping systems. A review. Agric. Ecosyst. Environ. 2013, 164, 32–52. [Google Scholar] [CrossRef]
  6. Ju, X.T.; Liu, X.J.; Zou, G.Y.; Wang, Z.H.; Zhang, F.S. Evaluation of nitrogen loss way in winter wheat and summer maize rotation system. Sci. Agric. Sin. 2002, 35, 1493–1499. [Google Scholar]
  7. Sang, M.M.; Fan, H.; Jiang, S.S.; Jiang, J.Y. Nitrogen loss through different ways in cropland under conventional fertilization: An in-situ study of summer maize season in the middle and lower reaches of the Yangtze River. Environ. Sci. 2015, 36, 3358–3364. [Google Scholar]
  8. Zhu, Z.L. Research on soil nitrogen in China. Acta Pedol. Sin. 2008, 45, 778–783. [Google Scholar]
  9. Liu, J.; Li, J.M.; Ma, Y.B.; Wang, E.L.; Liang, Q.; Jia, Y.H.; Li, T.S.; Wang, G.C. Crop productivity and nitrogen balance as influenced by nitrogen deposition and fertilizer application in North China. Sustainability 2019, 11, 1347. [Google Scholar] [CrossRef]
  10. Sun, H.J.; Zhang, H.L.; Wu, J.S.; Jiang, P.K.; Shi, W.M. Laboratory lysimeter analysis of NH3 and N2O emissions and leaching losses of nitrogen in a rice-wheat rotation system irrigated with nitrogen-rich waste water. Soil Sci. 2013, 178, 316–323. [Google Scholar] [CrossRef]
  11. Bell, M.J.; Hinton, N.J.; Cloy, J.M.; Topp, C.F.E.; Rees, R.M.; Williams, J.R.; Misselbrook, T.H.; Chadwick, D.R. How do emission rates and emission factors for nitrous oxide and ammonia vary with manure type and time of application in a Scottish farmland? Geoderma 2016, 264, 81–93. [Google Scholar] [CrossRef]
  12. Shi, Y.L.; Cui, S.H.; Ju, X.T.; Cai, Z.C.; Zhu, Y.G. Impacts of reactive nitrogen on climate change in China. Sci. Rep. 2015, 5, 8118. [Google Scholar] [CrossRef] [PubMed] [Green Version]
  13. Ai, S.Y.; Yao, J.W.; Liu, G.J.; Zhou, X.C. Study on ammonia loss by volatilization for urea fertilized to dry land in the tropics and subtropics. Chin. Agric. Sci. Bull. 1999, 15, 13–17. [Google Scholar]
  14. Liu, D.L.; Nie, J.; Xiao, J. Study on 15N labeled rice controlled release fertilizer in increasing nitrogen utilization efficiency. Acta Laser Biol. Sin. 2002, 11, 87–92. [Google Scholar]
  15. Zhou, J.; Cui, J.; Hu, F.; Wang, G.Q.; Ma, Y.H. N-loss through volatilization, runoff and leaching from red soil planted with digitaria ischaemum. Acta Pedol. 2007, 44, 1076–1082. [Google Scholar]
  16. Wang, Y.S.; Wang, Y.H. Quick measurement of CH4, CO2 and N2O emissions from a short-plant ecosystem. Adv. Atmos. Sci. 2003, 20, 842–844. [Google Scholar]
  17. Li, M.Y.; Xu, M.G.; Wang, B.R.; Bao, Y.X.; Li, G.H.; Sun, N. Effects of long-term fertilizations on N2O emission and its relationship with soil properties in red soil of Southern China. J. Agro-Environ. Sci. 2009, 12, 2645–2650. [Google Scholar]
  18. Yao, J.W.; Ai, S.Y.; Zhou, X.C. Study on simulation of N fertilizer leaching loss to dry land in the tropics and subtropics. Soil Environ. Sci. 1999, 18, 314–315. [Google Scholar]
  19. Bi, J.W.; Zhang, J.B.; Chen, X.M.; Zhu, A.N.; Feng, J. Simulation of soil water leaching and Nitrate_N loss with Lechate in the field using HYDRUS-1D model. Rural Eco-Environ. 2004, 20, 28–32. [Google Scholar]
  20. Wang, C.H.; Liu, X.J.; Ju, X.T.; Zhang, S.F. Field in situ determination of ammonia volatilization from soil: Venting method. Plant Nutr. Fertil. Sci. 2002, 8, 205–209. [Google Scholar]
  21. Zheng, X.H.; Mei, B.L.; Wang, Y.H.; Xie, B.H.; Wang, Y.S.; Dong, H.B.; Xu, H.; Chen, G.X.; Cai, Z.C.; Yue, J.; et al. Quantification of N2O fluxes from soilplant systems may be biased by the applied gas chromatograph methodology. Plant Soil 2008, 311, 211–234. [Google Scholar] [CrossRef]
  22. Wang, X.X.; Zhang, T.L.; Zhang, B. Nutrient cycle and balance of sloping upland ecosystem on red soil. Acta Ecol. Sci. 1999, 19, 335–341. [Google Scholar]
  23. Zheng, H.J.; Hu, J.M.; Huang, P.F.; Wang, L.Y.; Wan, J.L. Comparative study of nitrogen and phosphorus through surface-flow and interflow on red soil farmland. J. Soil Water Conserv. 2014, 28, 41–45. [Google Scholar]
  24. Zhang, Y.; Rong, X.M.; Wang, X.X.; Zhou, L.; Zhang, Y.P.; Liu, Q.; Xie, G.X.; Song, H.X. Effects of ecology interception and film mulching on surface runoff and nitrogen loss in Upland soil. J. Soil Water Conserv. 2014, 28, 15–19. [Google Scholar]
  25. Tan, D.S.; Jiang, L.H.; Zhang, Q.; Meng, L.; Zheng, F.L.; Gao, X.H.; Xu, Y.; Liu, Z.H. In situ study on influences of different fertilization patterns on inorganic nitrogen losses through leaching and runoff: A case of field in Nansi Lake Basin. Acta Ecol. Sin. 2011, 31, 3488–3496. [Google Scholar]
  26. Chen, X.A.; Yang, J.; Zheng, T.H.; Zhang, J. Sediment, runoff, nitrogen and phosphorus losses of sloping cropland of quaternary red soil in northern Jiangxi. Trans. Chin. Soc. Agric. Eng. 2015, 31, 162–167. [Google Scholar]
  27. Su, F.; Huang, B.; Ding, X.; Gao, Z.; Chen, X.P.; Zhang, F.S.; Feng, Z.; Kogge, M.; Römheld, V. Ammonia volatilization from nitrogen fertilization of winter wheat-summer maize rotation system in the North China Plain. Chin. Environ. Sci. 2007, 27, 409–413. [Google Scholar]
  28. Xie, Y.X.; Liu, Y.; Jin, H.Y.; Wang, C.Y.; Zhu, Y.J.; Guo, T.C.; He, D.X. Effects of nitrogen application patterns on ammonia volatilization, summer maize yield and nitrogen use efficiency in sandy loam fluvo-aquic soil. J. Maize Sci. 2015, 23, 124–129. [Google Scholar]
  29. IPCC. IPCC Guidelines for National Greenhouse Gas Inventories; Volume 4: Agriculture, Forestry, and Other Land Use; Institute for Global Environmental Strategies: Hayama, Japan, 2006. [Google Scholar]
  30. Wang, G.L.; Chen, X.P.; Cui, Z.L.; Yue, S.C.; Zhang, F.S. Estimated reactive nitrogen losses for intensive maize production in China. Agric. Ecosyst. Environ. 2014, 197, 293–300. [Google Scholar] [CrossRef]
  31. Zheng, X.H.; Han, S.H.; Huang, Y.; Wang, Y.S.; Wang, M.X. Re-quantifying the emission factors based on field measurements and estimating the direct N2O emission from Chinese croplands. Glob. Biogeochem. Cycles 2004, 18, 1–19. [Google Scholar] [CrossRef]
  32. Bouwman, A.F. Factors regulating nitrous oxide and nitric oxide emission. In Global Estimates of Gaseous Emissions of NH3, NO and N2O from Agricultural Land; Bouwman, A.F., Boumans, L.J.M., Batjes, N.H., Eds.; FAO/IFA: Rome, Italy, 2001; pp. 11–16. [Google Scholar]
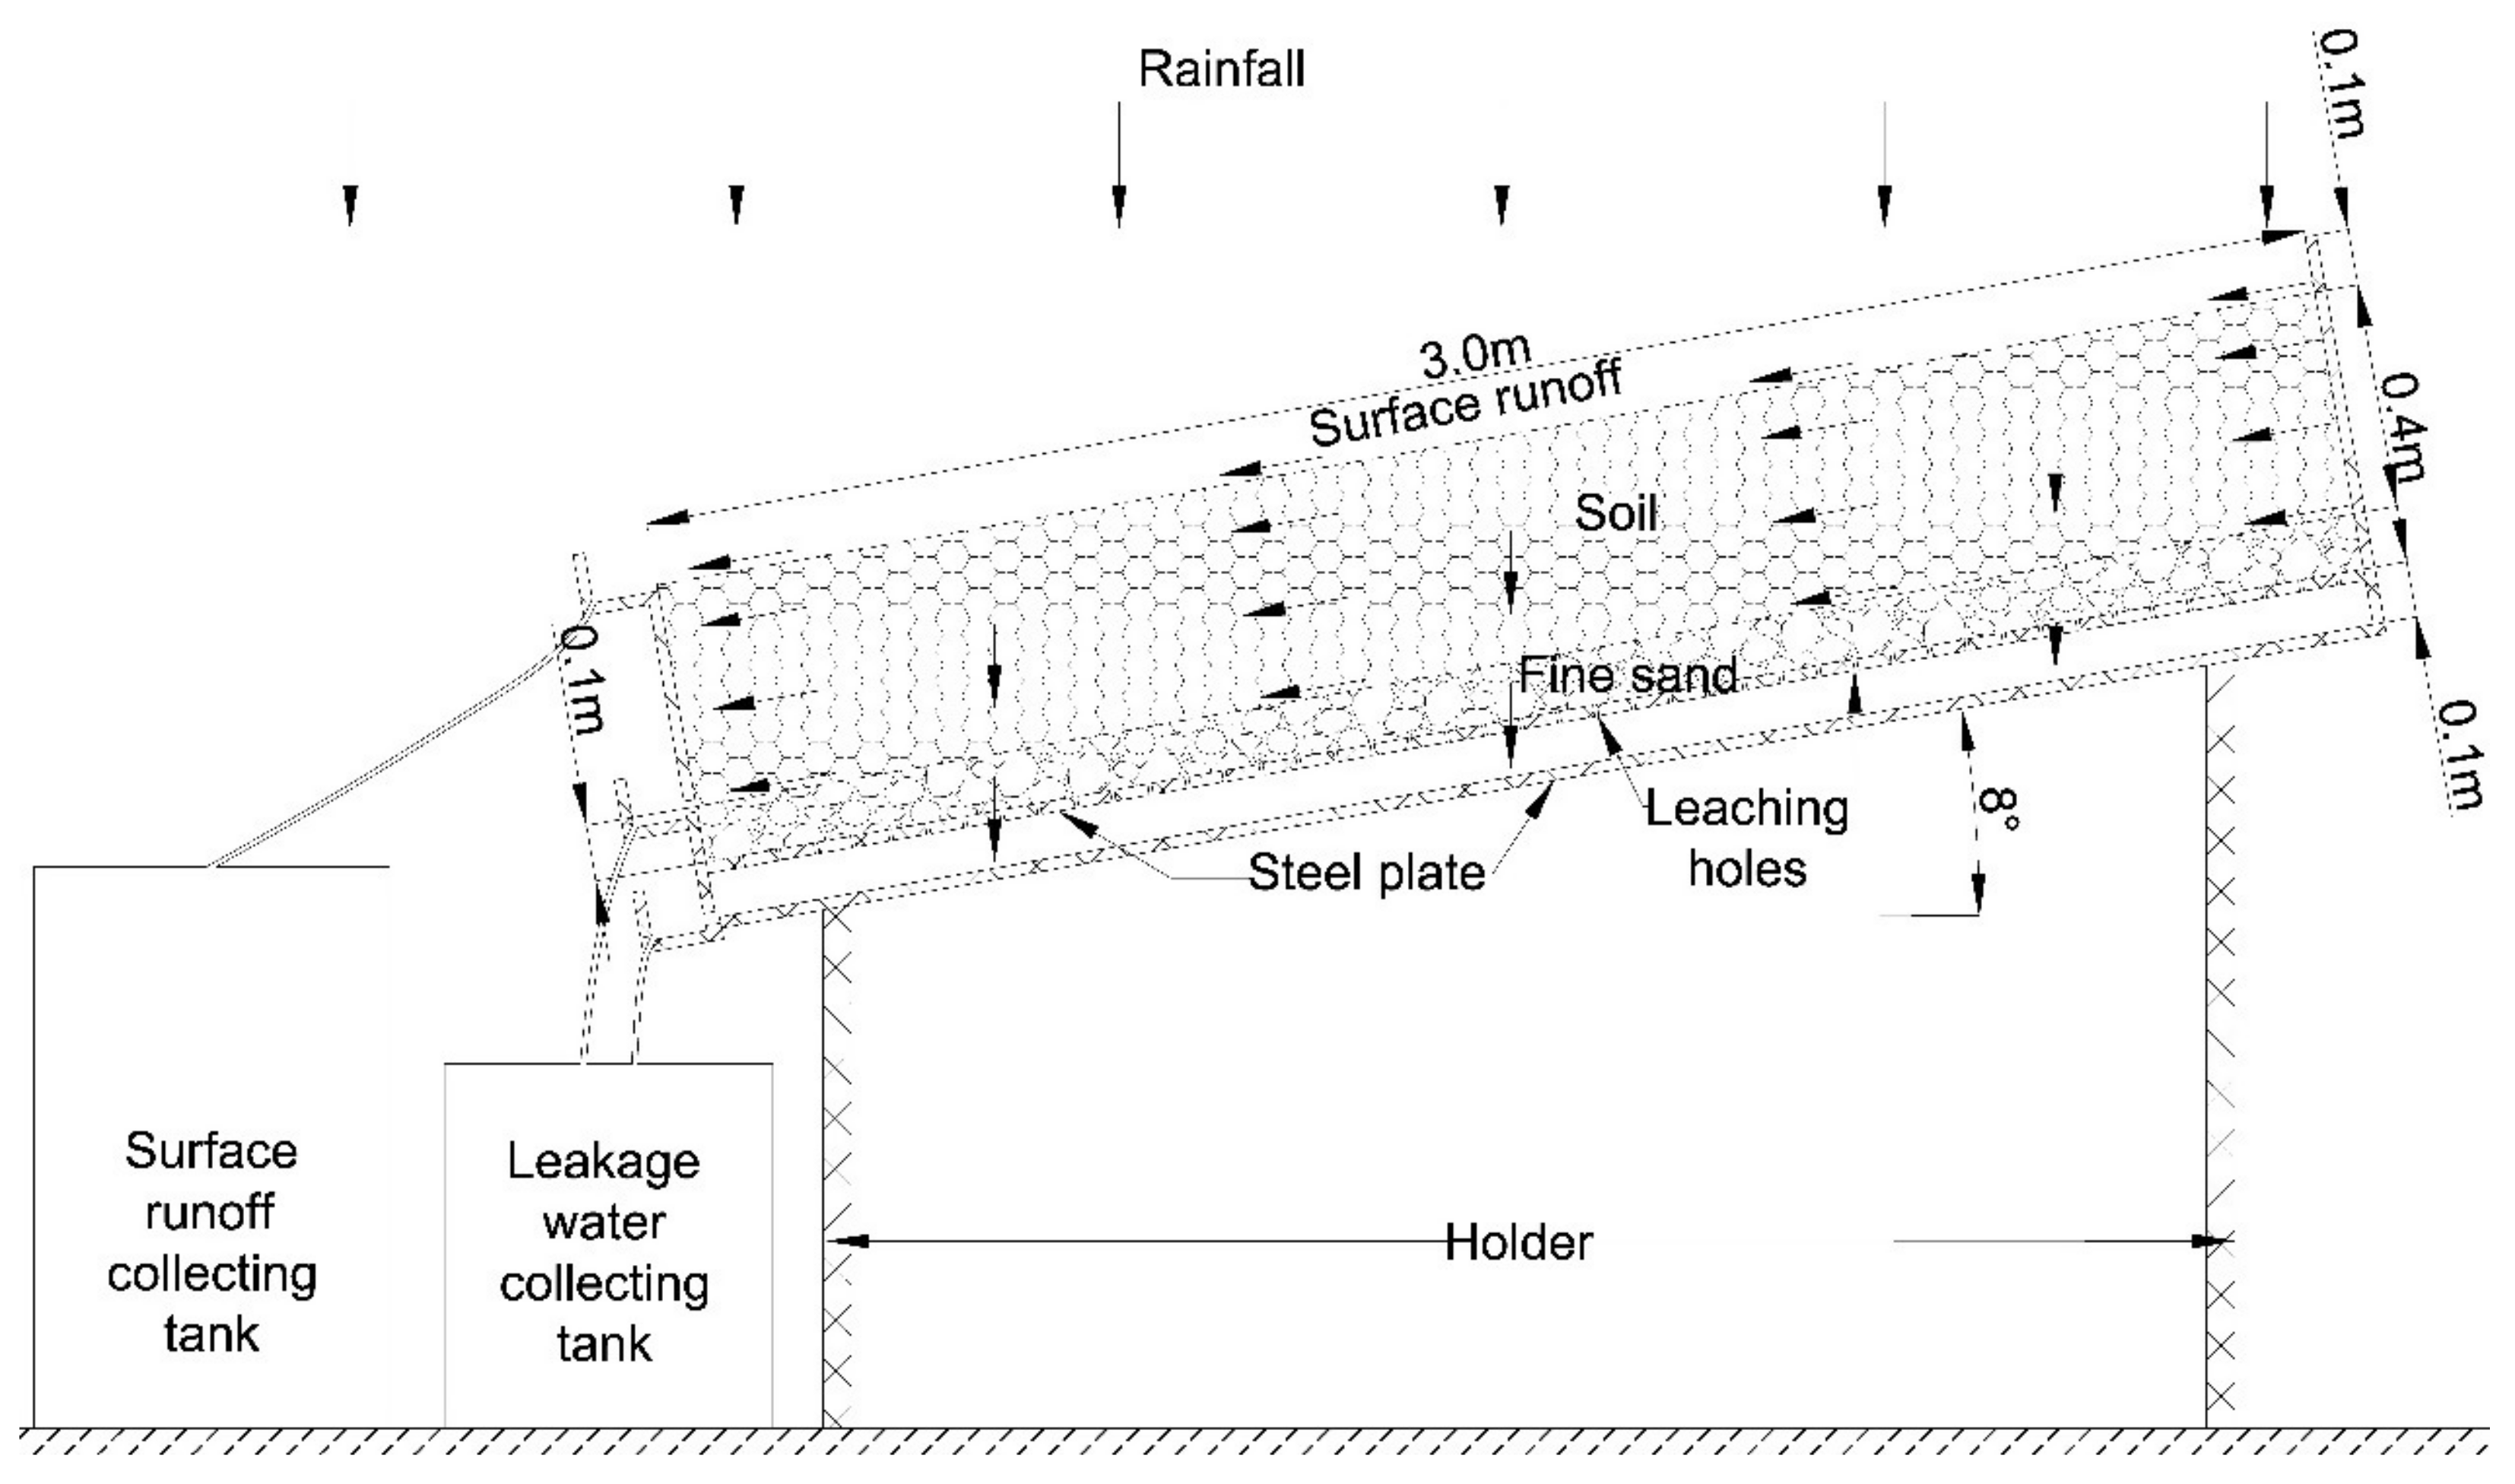
Figure 1. Profile diagram of the experimental equipment.
Sustainability 11 06219 g001
Figure 2. Changes of the concentrations of NH4+-N and NO3-N in (a) seepage water and (b) runoff water caused by fertilization in 2017.
Sustainability 11 06219 g002
Figure 3. Changes of rainfall and rainfall intensity during the test period.
Sustainability 11 06219 g003
Figure 4. Changes of the concentrations of NH4+-N and NO3-N in (a) seepage water and (b) runoff water caused by fertilization in 2018.
Sustainability 11 06219 g004
Figure 5. Changes of the flux of ammonia (NH3) volatilization and nitrous oxide (N2O) emission caused by fertilization in 2017.
Sustainability 11 06219 g005
Figure 6. Changes of soil temperature, soil moisture and air temperature during the test period.
Sustainability 11 06219 g006
Figure 7. Changes in the flux of ammonia (NH3) volatilization and nitrous oxide (N2O) emission caused by fertilization in 2018.
Sustainability 11 06219 g007
Figure 8. Loss amount of active nitrogen in different pathways during different periods.
Sustainability 11 06219 g008
Table 1. Correlation coefficients of the loss concentration of active nitrogen via water with rainfall and rainfall intensity caused by fertilization.
Nitrogen Loss Concentration20172018
RainfallRainfall IntensityRainfallRainfall Intensity
NH4+-N in leakage water0.436−0.0410.431−0.444
NO3-N in leakage water0.616 *0.4040.736 *−0.672
NH4+-N in runoff water0.4130.2730.301−0.310
NO3-N in runoff water0.3930.893 **−0.4040.120
* for significant at 0.05 level, and ** for significant at 0.01 by spearman double tail test.
Table 2. Correlation coefficients of the emission flux of active nitrogen via gas with soil temperature, soil moisture, and air temperature caused by fertilization.
Nitrogen Emission Flux2017 2018
Soil TemperatureSoil MoistureAir TemperatureSoil TemperatureSoil MoistureAir Temperature
NH3-N volatilization−0.224−0.076−0.0340.1120.027−0.011
N2O-N emission0.0060.418 *−0.143−0.686 **0.520 **−0.656 **
* for significant at 0.05 level, and ** for significant at 0.01 by Spearman double tail test.
Table 3. Loss amount of active nitrogen via ammonia (NH3) volatilization, nitrous oxide (N2O) emission, N leaching, and N runoff during the peanut growing season Unit: kg hm−2.
TreatmentsPeanut Growing SeasonN Leaching LossN Runoff LossN2O-N Emission LossNH3-N Volatilization Loss
NH4+-NNO3-NSubtotalNH4+-NNO3-NSubtotal
FT2017Base fertilizer period1.52 ± 0.5023.30 ± 4.9824.82 ± 5.403.48 ± 1.132.21 ± 0.645.69 ± 1.770.17 ± 0.093.48 ± 0.97
Topdressing period0.46 ± 0.274.31 ± 0.664.77 ± 0.882.61 ± 0.751.98 ± 0.654.59 ± 1.260.12 ± 0.061.38 ± 0.38
Whole growing season1.98 ± 0.7727.61 ± 5.6329.59 ± 6.286.09 ± 0.744.19 ± 0.9410.28 ± 1.670.29 ± 0.154.86 ± 1.34
2018Whole growing season0.60 ± 0.147.89 ± 3.488.49 ± 3.380.27 ± 0.190.11 ± 0.060.38 ± 0.040.41 ± 0.0813.19 ± 2.04
CK2017Base fertilizer period1.02 ± 0.337.82 ± 2.568.84 ± 2.722.11 ± 1.140.86 ± 0.562.97 ± 1.550.09 ± 0.043.16 ± 0.39
Topdressing period0.35 ± 0.112.34 ± 0.462.69 ± 0.550.98 ± 0.220.65 ± 0.291.63 ± 0.140.03 ± 0.011.17 ± 0.55
Whole growing season1.37 ± 0.4310.16 ± 3.0111.53 ± 3.263.09 ± 0.961.51 ± 0.854.60 ± 1.560.12 ± 0.054.33 ± 0.95
2018Whole growing season0.29 ± 0.043.60 ± 0.243.89 ± 0.280.19 ± 0.060.07 ± 0.030.26 ± 0.010.14 ± 0.029.83 ± 0.31
FT—conventional fertilizer, CK—no fertilizer. Mean values of three replicates (n = 3) and standard deviations (±).
Table 4. Loss rate of active nitrogen via different pathways caused by fertilization in the peanut growing season.
Peanut Growing SeasonTotal Nitrogen Applied (kg hm−2)N Leakage Loss Rate (%)N Runoff Loss Rate (%)N2O Emission Coefficient (%)NH3 Volatilization Coefficient (%)Total Loss Rate of Active Nitrogen in Four Pathways (%)
2017Base fertilizer period103.215.522.640.080.3118.55
Topdressing period68.83.014.290.130.317.73
Whole growing season172.010.503.300.100.3114.21
2018Whole growing season150.03.070.080.182.245.57