Article

Copper Toxicity and Prediction Models of Copper Content in Leafy Vegetables

Department of Horticulture and Landscape Architecture, National Taiwan University, Taipei 10617, Taiwan
*
Author to whom correspondence should be addressed.
Sustainability 2019, 11(22), 6215; https://doi.org/10.3390/su11226215
Submission received: 15 October 2019 / Revised: 28 October 2019 / Accepted: 5 November 2019 / Published: 6 November 2019
(This article belongs to the Section Sustainable Agriculture)

Abstract

:
Copper (Cu), a toxic metal pollution found in the soil and water of industrialized areas, causes continuous issues for agriculture product contamination and human health hazards. However, information on copper phytotoxicity and its accumulation in vegetables is largely unknown. To evaluate the related agricultural loss and health risks, it is necessary to assess copper phytotoxicity and develop prediction models for copper concentration in vegetables. Here, we assess the growth performance and copper concentration of four leafy vegetables: Water spinach, amaranth, pakchoi, and garland chrysanthemum in copper-contaminated soil. The plant’s height and fresh weight is dramatically reduced when the soil copper concentration is over ~250 mg·kg−1. This yield reduction and copper accumulation are associated with an increase of soil copper concentration, suggesting high copper phytotoxicity levels in plants and soil. The prediction models of plant copper concentration were developed using multiple regressions based on one-step extractions of the soil copper as independent variables. One prediction model derived for amaranth copper using hydrochloric acid (HCl)-extractable and ethylenediaminetetraacetic acid (EDTA)-extractable copper from soil is able to describe 78.89% of the variance in the measured copper. As a result, the phytotoxic copper level for four leafy vegetables is revealed. Although the prediction models may not be universal, the predicted and phytotoxic copper levels are useful tools for evaluating vegetable yield and daily copper intake.

1. Introduction

Toxic metal contamination in soil is mainly caused by human activities, especially industrialization. The economy of Taiwan is largely supported by the electronics, petroleum refining, chemical and iron machinery industries, but such industrialization pollutes water bodies by the discharge of waste water, which further accumulates in the soil by irrigating contaminated water [1]. Among the toxic metal pollutions in Taiwan, copper contamination has the highest numbers of reported cases, in which copper contamination occurs in 5684 sites out of a total 7460 heavy metal contamination sites, according to the Taiwan Environmental Protection Administration database (https://sgw.epa.gov.tw/ContaminatedSitesMap/Default.aspx, searched on December 2018). These facts suggest that the effects of copper-contaminated soil upon crop cultivation and copper content in food must be investigated.
Copper is an essential element for plant nutrients, but it becomes toxic at high concentrations. Copper is required for constituting enzymes catalyzing redox reactions, and is involved in photosynthetic functions [2]. Excess copper induces high levels of reactive oxygen species (ROS) and affects the photosystem in photosynthesis [3,4,5], which subsequently reduces the yield or quality of crops. The toxic effects of copper are studied in several crops. When the soil’s copper level is over 300 mg·kg–1, the rice grain yields a decrease of about 50% [6].
With an increase in copper concentration, wheat germination is greatly affected in its percentage, total chlorophyll content and the number of its lateral roots [7]. When cabbage is exposed to high copper concentrations in a nutrient solution, copper toxicity leads to a chlorosis of its leaves, and subsequently reduces the biomass in both its shoots and roots [8]. The assessment and quantification of toxic metals in fruits and vegetables is reported over the past decades. Cadmium (Cd), zinc (Zn), lead (Pb) and copper (Cu) are the main elements that accumulate in staple foods, fruits and vegetables in mining areas or industrial-polluted fields [9,10,11,12]. Recent publications increasingly focus on vegetables as healthy foods, but vegetables still face exposure to toxic metal contamination [9,11,13,14,15,16,17]. Most of these studies quantify multiple toxic metals in vegetables, but few of them mention the negative effects of copper upon growth and production in leafy vegetables [9,13,14,16].
To improve food safety from toxic metal contamination, it is an efficient strategy to predict the toxic metal contamination of crops by using the toxic metal information in the soil. The transportation of metals from the soil to the crops could be affected by the dissolved, exchangeable, structural components of soil and insoluble precipitation [18,19]. The bioavailability of heavy metals is a logical approach to predicting plant–soil interactions [19,20,21,22,23,24]. One-step extraction approaches using calcium chloride (CaCl2) and sodium nitrate (NaNO3) are frequently used to mimic soil background electrolyte solutions [12,18,22,23,24,25,26]. Chelating agents, such as ethylenediaminetetraacetic acid (EDTA) and diethylenetriaminepentaacetic acid (DTPA), are often used to form stable and soluble metal-organic complexes, simulating plant chelating uptake [18,19,22,23,25,27]. Hydrochloric acid (HCl) is another extracting reagent that is often utilized for assessing heavy metal bioavailability [12,18,19,22]. Several prediction models are developed for cadmium, chromium, copper and zinc in barley and rice [23,28]. No specific prediction model is constructed for copper contamination in major leafy vegetables in subtropical regions.
The aim of this study is to determine the effects of copper toxicity on leafy vegetables and to develop prediction models for copper concentration in leafy vegetables. For this purpose, it is critical to evaluate the growth performance of vegetables under different levels of copper-contaminated soil and to measure the copper concentration in the edible parts of vegetables. Growing performance and copper concentration are the key information needed to evaluate the production of vegetables and the health hazards of foods, respectively. In this work, we cultivated four of the most popular leafy vegetables in a subtropical region, including two warm-season and two cold-season vegetables, using five levels of copper-contaminated soil. The copper concentration of the vegetables and multiple growth indicators, such as height and fresh weight, were used to assess the health hazard and copper toxicity of the plants. To provide predicted information prior to the cultivation or harvest of vegetables by simply analyzing the soil, we presented prediction models for the copper concentration in vegetables formulated with parameters from one-step soil extraction. The health risk of vegetables cultivated on copper-contaminated soil and the applications of copper prediction models were also discussed.

2. Materials and Methods

2.1. Soil Preparation

Soil for vegetable cultivation was collected in Sankuaicuo, Dayuan District, Taoyuan City, Taiwan, where four farms were randomly selected to collect soil at 0–15 cm in depth; all collected soil samples were pooled and evenly mixed. The collected soil was of the oxisol order, as they derived from a red sandstone parent material. To prepare the five levels of copper-contaminated soil for vegetable cultivation, the soil was air-dried and then soaked with deionized water, and 370 mg·kg−1, 1546 mg·kg−1, 2164 mg·kg−1, and 2783 mg·kg−1 of copper sulfate (CuSO4) solution for 16 h, respectively. To remove the unabsorbed copper, the copper-treated soil was leached twice per week using a doubled-soil-volume of deionized water in each run of leaching for four weeks. To evenly distribute the copper concentration for each level of copper contamination, the leached soil was air-dried, crushed, and mixed before being filled into five inch pots for vegetable cultivation.
To prepare the soil property analysis and chemical analysis, the soil was air dried, and stones and visible organic residues were removed. The air-dried soil was ground and screened with a 2 mm standard sieve. The sieved soil was then passed through a 0.5 mm standard sieve, and the soil was further passed through a 0.149 mm standard sieve for the samples subjected to aqua regia (mixture of HNO3 with HCl) digestion.

2.2. Plant Materials

Two warm season leafy vegetables, water spinach (Ipomoea aquatic F.) (Hsinhocheng Seed, Taipei, Taiwan), and amaranth (Amaranthus inamoenus W.) (Known-You Seed Co., Kaohsiung, Taiwan), as well as two cold season leafy vegetables, pakchoi (Brassica rapa var. chinensis) (Hsinhocheng Seed, Taipei, Taiwan) and garland chrysanthemum (Chrysanthemum coronarium L.) (Hsinhocheng Seed, Taipei, Taiwan), were used as commercially-available seeds. Before seed imbibition, fully filled seeds without obvious damage were selected. The selected seeds were imbibed with deionized water at 25 °C for 8 to 10 h until germination. The imbibed seeds were sprinkled on the soil’s surface in the five inch pots, containing five different levels of copper-contaminated soil. Pakchoi and amaranth seeds were covered with a thin layer of soil, whereas water spinach and garland chrysanthemum were buried with about 1 cm of soil. These pots of vegetables were cultivated in a greenhouse situated in the National Taiwan University Experimental Farm, Taipei, Taiwan (25°00′43.7″ N, 121°32′50.4″ E). Seedlings were thinned to three seedlings per pot at 3 and 5 days post-germination. Plants in each pot were considered to be a unit, which was arranged using completely randomized designs, with six pots for each copper-contaminated level. Two batches of vegetables were cultivated for each species. For the warm season vegetables, water spinach and amaranth were cultivated from June to July and from September to October 2017, while the cold season vegetables, pakchoi and garland chrysanthemum, were cultivated from February to March 2017 and from February to March 2018. Plant height was defined as the average distance from the soil’s surface to the highest leaf tip of the three plants in each pot. The edible parts of the vegetables were weighed immediately after being harvested to avoid post-harvest water loss. For copper content measurement, the harvested vegetables were rinsed with tap water and deionized water. After air-drying the surface water, the vegetables were dehydrated in an oven at 60 °C for 72 h. The dehydrated samples were immediately subjected to dry weight measurement and were ready for the following copper content analysis.

2.3. Soil Property Analysis

Soil organic matter (OM) was determined using the loss-on-ignition method. Twenty grams of sieved soil were oven-dried at 105 °C for 2 h, followed by ignition at 375 °C for 16 h. The weight loss between the oven-dried soil and the ignited soil was considered to be the weight of the OM. Regarding the soil pH, 20 g of sieved soil was extracted with 20 cm3 of deionized water in 50 cm3 conical tubes. The tubes were horizontally laid onto a horizontal shaker at 200 rpm, at 25 °C for 30 min, followed by one hour of vertical standing on a bench. The supernatants were used to determine the soil pH using a pH meter (pH 510, Eutech Instruments, Singapore). Clay content was determined using the hydrometer method to analyze the particle size of the soil [29].
The cation exchange capacity (CEC) was determined using 1 M NH4OAc buffered at pH 7.0 (neutral) to exchange cation capacity, followed by measuring the ammonium level with colorimetric methods [30]. Briefly, the cation in 1 g of sieved soil was exchanged with 10 cm3 of 1 M NH4OAc buffered at pH 7.0 at 200 rpm, 25 °C for 1 h, followed by washing three times with 10 cm3 of 75% ethanol. Ammonium in the washed soil was then replaced with 10 cm3 of 1 M MgCl2 two times. The replaced ammonium solution was adjusted to a volume of 50 cm3 with a volumetric flask. The ammonium concentration was then quantified with a colorimetric method by measuring the production of indophenol blue [30]. Briefly, 1 cm3 of samples or ammonium standard solutions were mixed with 40 mm3 of 0.1% phenol solution, 40 mm3 of 0.005% nitroferricyanide solution, and 40 cm3 of oxidizing solution, followed by incubation at 25 °C for 1 h.
The concentration of ammonium was determined based on ammonium standard solutions at 630 nm absorbance. The total amount of ammonium exchanged from the soil was reflected in the soil’s CEC.

2.4. Chemical Analysis

To analyze the copper content in plants, dehydrated vegetable samples were weighed and digested with a nitric acid-based microwave digestion method, as described in [31]. One hundred mg of dehydrated samples were transferred to a Teflon vessel (xpress vessel replacement, 55 cm3, CEM, Matthews, NC, USA) and digested with 5 cm3 of HNO3 (65% nitric acid, Tracepur for analysis, Merck, Darmstadt, Germany) and 2 cm3 of H2O2 (30% hydrogen peroxide, Suprapur for analysis, Merck, Germany) in a MARS 5 microwave digestion system (CEM, Matthews, NC, USA). Metal content-certified tomato leaf powder [SRM-1573a, the National Institute of Standards and Technology (NIST), Gaithersburg, MD, USA] was used as a digestion and quantification reference. The volume of the digested solution was adjusted to 20 cm3 with deionized water, followed by filtering with a 0.45 μm membrane filter (promax syringe filter, 25 mm 0.45 μm pes, DIKMA, Lake Forest, CA, USA) before elemental analysis. Soil metal concentrations were analyzed with two types of methods separately. One method employed aqua regia extraction to digest metal from soil to determine its total metal concentration. This approach is supposed to extract all forms of metals, including the dissolved, the exchangeable, the structural components of soil and insoluble precipitation. The other method utilized one-step extraction using a neutral salt solution, chelating agents and acids to extract dissolved and/or exchangeable fractions. Regarding the total metal concentration in the soil, the aqua regia digestion in the soil followed ISO 11466:1995 standard procedures with minor modifications. Briefly, 1 g soil was digested with 7 cm3 of 32% HCL and 2.3 cm3 of 65% nitric acid for 16 h at 25 °C and 2 h at 108 °C. Certified heavy metal-containing soil (SRM 2711a - Montana II soil, NIST, Gaithersburg, MD, USA) was used as a digestion and quantification reference. To analyze extractable metal contents, dried soils were extracted by 0.01 M CaCl2, 0.1 M NaNO3, 0.1 M HCl and 0.05 M EDTA, respectively. Briefly, the sieved soil samples were further dried in a 60 °C oven for one day before weighing. One gram of dried soil was extracted with 10 cm3 of extractants with 200 rpm of horizontal shaking for 1 h at 25 °C. For elemental analysis, all samples, including the digested plant samples, aqua regia digested soil samples and four types of soil extracts, were determined by the core lab at the Joint Center for Instruments and Research, College of Bioresources and Agriculture, National Taiwan University (NTU), by using inductively coupled plasma optical emission spectroscopy (ICP-OES) (Optima 8000, PerkinElmer, Waltham, MA, USA) or an inductively coupled plasma mass spectrometer (ICP-MS) (Agilent 7700x, Agilent Technologies, Santa Clara, CA, USA).

2.5. Statistical Analysis

All statistical analyses were carried out using the statistical package, SPSS version 22 (SPSS, Chicago, IL, USA). The results presented were obtained from at least five replicates. Statistical comparisons between the different levels of copper-contaminated soil were first subjected to a Levene test of the homogeneity of variance, followed by a one-way analysis of variance (ANOVA). Subsequent multiple comparison post hoc tests were performed with Fisher’s Least Significant Difference (LSD) at p ≤ 0.05.
A forward stepwise multiple linear regression was used to derive the models of plant copper concentration as functions of the total/extractable copper from the soil. The stepping method criteria used the probability of F as the entry (0.05) and removal (0.1). The p values for the Pearson correlation coefficients in the regression models were determined by correlating the copper concentration in vegetables with the total/extractable copper from the soil. The p values of the regression model and the R square of the linear regression were determined by correlating the expected and measured copper concentration in vegetables.

3. Results

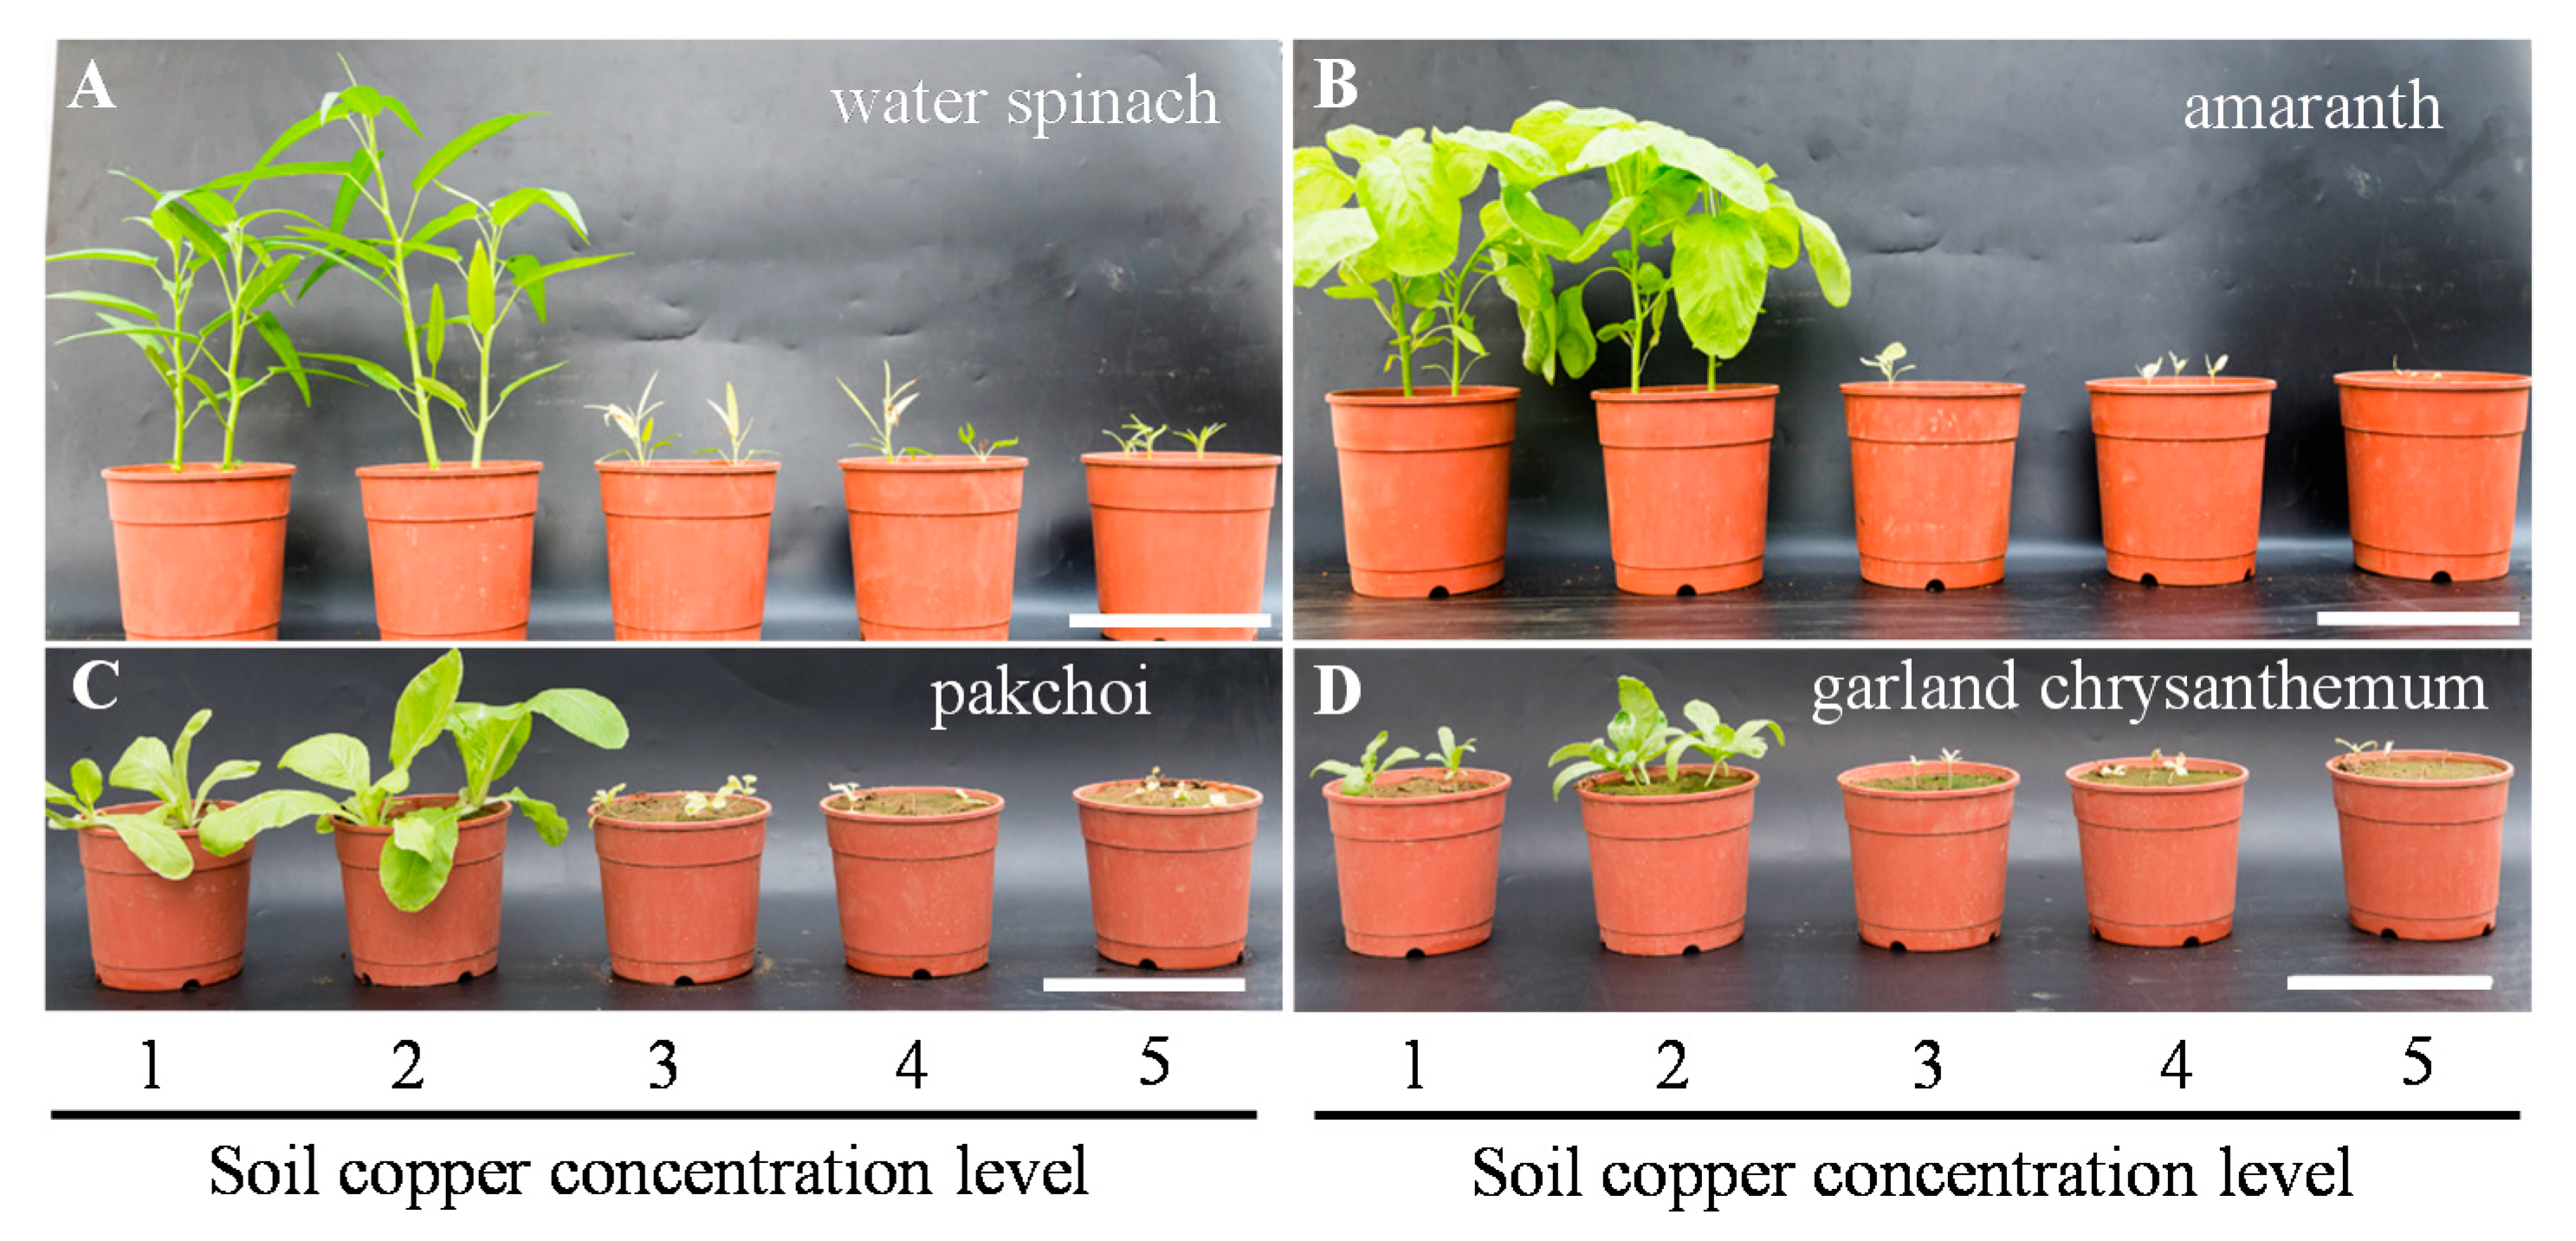
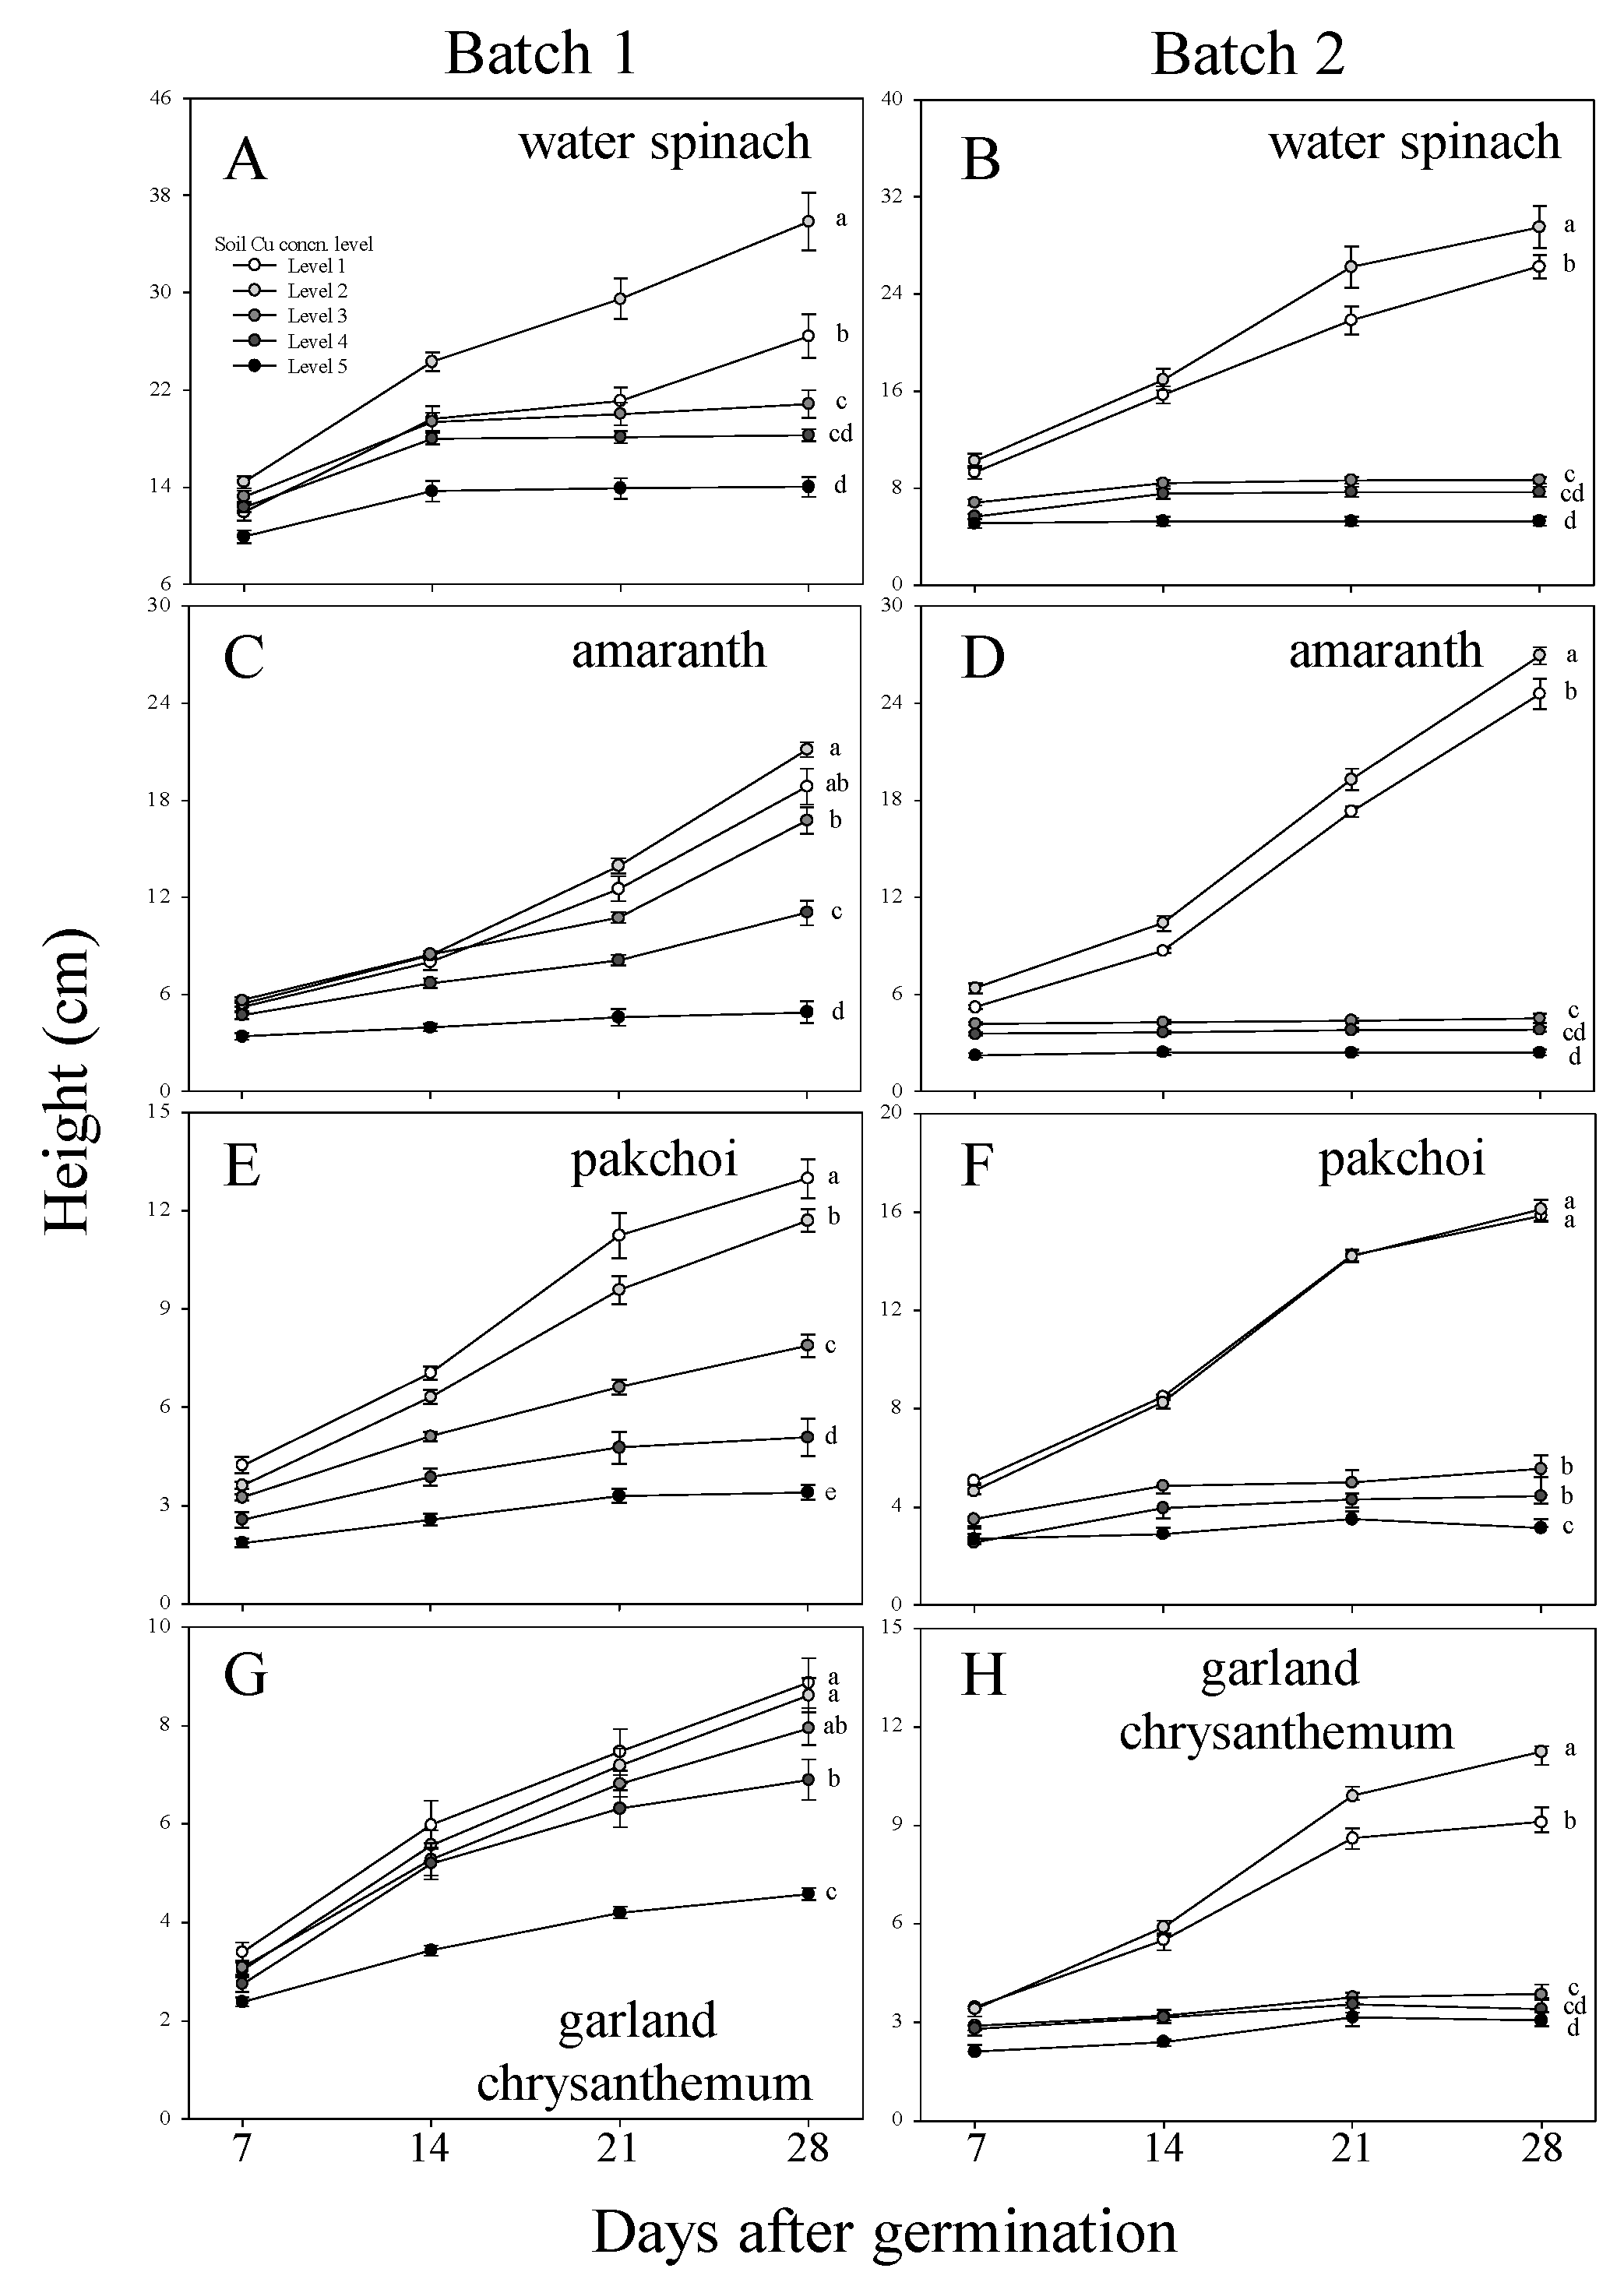
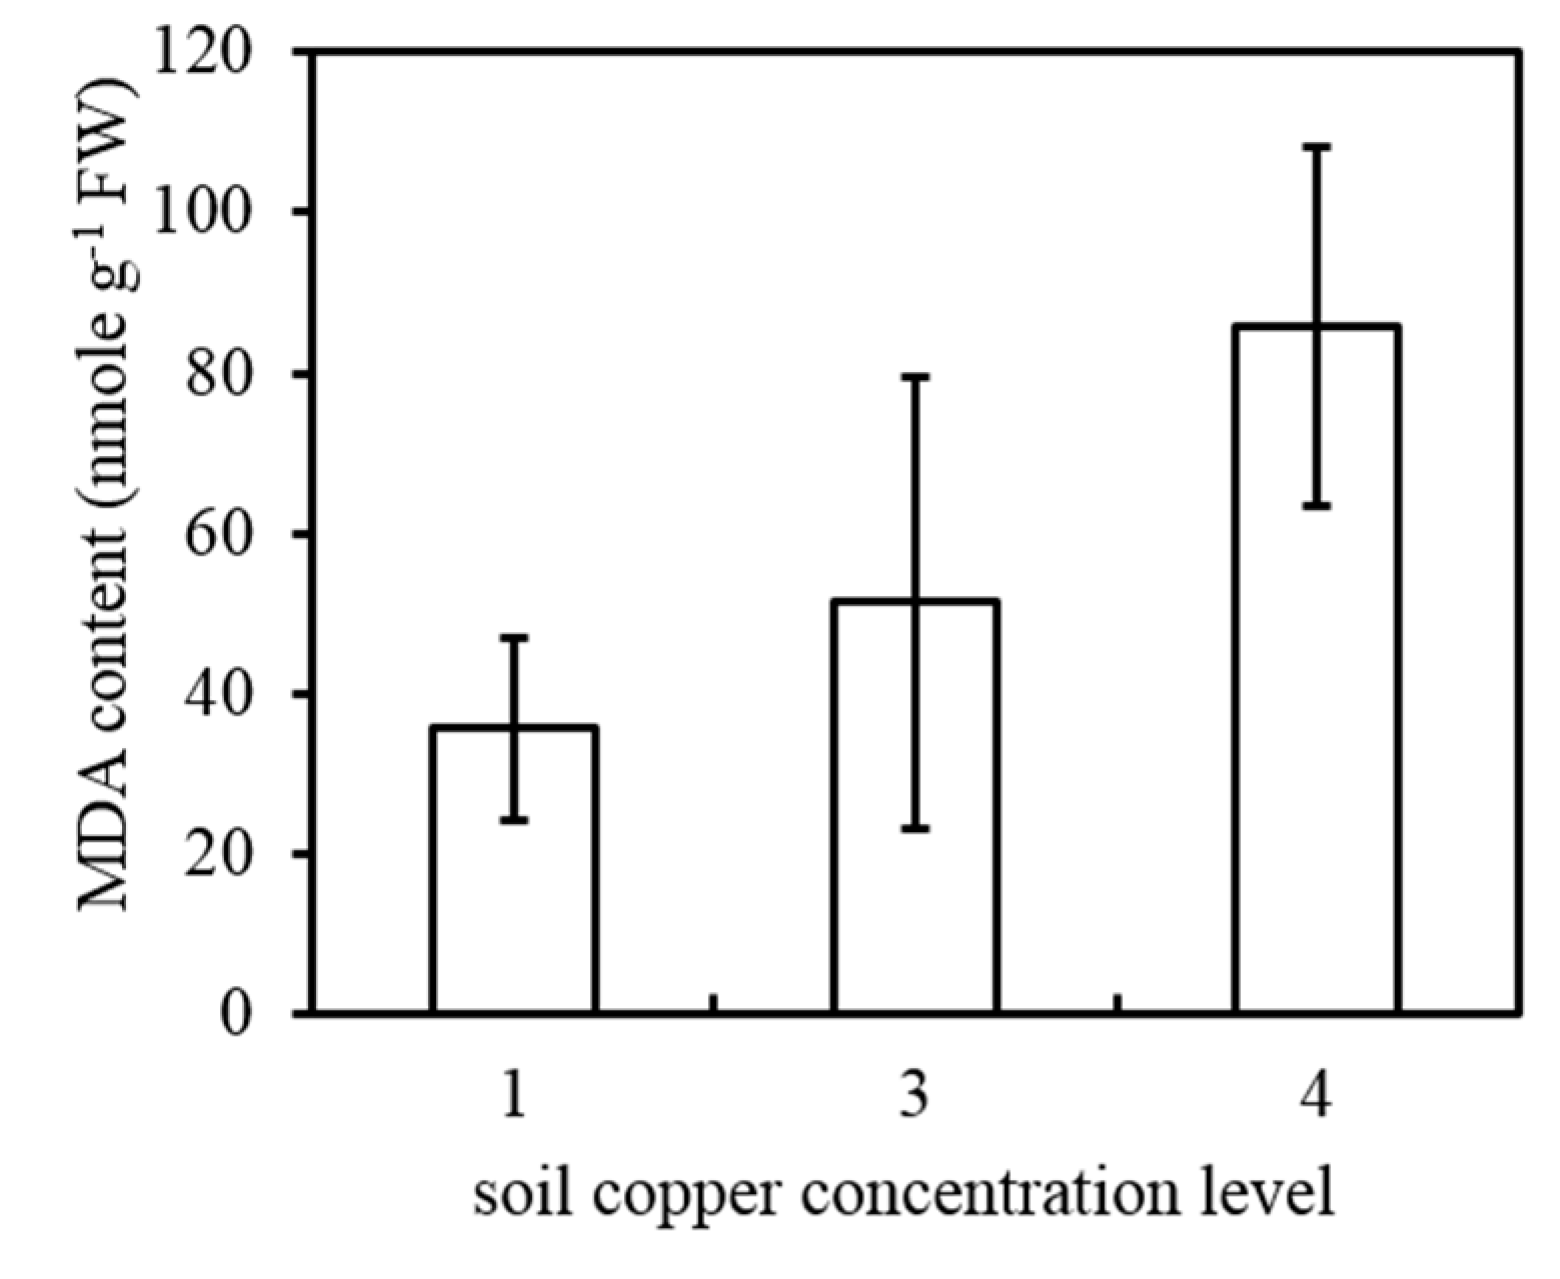
3.1. The Effect of Copper Toxicity on Vegetable Growth

To evaluate the copper toxicity in vegetables, we prepared five levels of copper-contaminated soil from the Taoyuan area in northern Taiwan for cultivated vegetables under green house conditions. The range of copper contamination for the five copper levels, ranging from no copper contamination to around 500 mg·kg−1 of copper, is decided based on 50 sets of field sample surveys from a potentially polluted field in the Taoyuan area. The basic physicochemical properties of the non-contaminated paddy soil for preparing the five copper levels is measured (Table 1). The soil collected is silty clay with pH 5.84 (acidic), which is a typical condition for cultivated vegetables and rice. Four of the most popular leafy vegetables in Taiwan, including two warm season vegetables, water spinach (Ipomoea aquatic F.) and amaranth (Amaranthus inamoenus W.), as well as two cold season vegetables, pakchoi (Brassica rapa var. chinensis) and garland chrysanthemum (Chrysanthemum coronarium L.), were selected to investigate their growth and accumulation of copper. Five levels of copper-contaminated soil were prepared, as described in the Materials and Methods. The copper concentration was measured after each cultivation trial to ensure the existence of a copper gradient (Table 2). The levels of copper are stable during the first cultivation (March 2017) until the end of the fourth cultivation (March 2018), suggesting that the copper levels in the soil are consistent between the cultivation batches.
The growth of all four vegetables is clearly inhibited by copper when the copper level is higher than level 3 (251–296 mg·kg−1), while their growth is promoted at copper level 2 (78–86 mg·kg−1) compared to copper level 1 (17–30 mg·kg–1), which features no copper addition (Figure 1). This growth inhibition could be due to the toxicity of excessive copper, and the growth promotion may be explained by providing sufficient copper at a low concentration, in which copper could act as a micronutrient supplement. The fresh weight and plant height are further used to describe the growth (Figure 2 and Figure 3).
In batch one, the fresh weight of water spinach, amaranth and pakchoi is significantly reduced when soil copper concentration exceeds level 3; however, a fresh weight reduction in garland chrysanthemum is observed when soil copper concentration exceeds level 4 (Figure 2A,C,E,G). Additional batches of water spinach were subjected to determine malodialdehyde (MDA) content which is often used as an indicator of lipid peroxidation caused by oxidative stress. Increase of soil copper concentration leads to an increase of MDA concentration in water spinach (Appendix A Figure A1), suggesting that lipid peroxidation increases when soil copper concentration exceeds level 4. In batch two, the fresh weight of all four vegetables is significantly decreased when soil copper concentration exceeds level 3 (Figure 2B,D,F,H). Similarly, these reduction patterns in fresh weight are also observed for plant height measured at 28 days after germination (Figure 3). Although the growth reduction caused by copper toxicity between batch one and batch two is not identical, the trends of the toxic effects are consistent between batches. Taken together, these results suggest that the copper toxicity for these four vegetables could be observed when soil copper concentration exceeds ~250 mg·kg–1 (copper level 3).

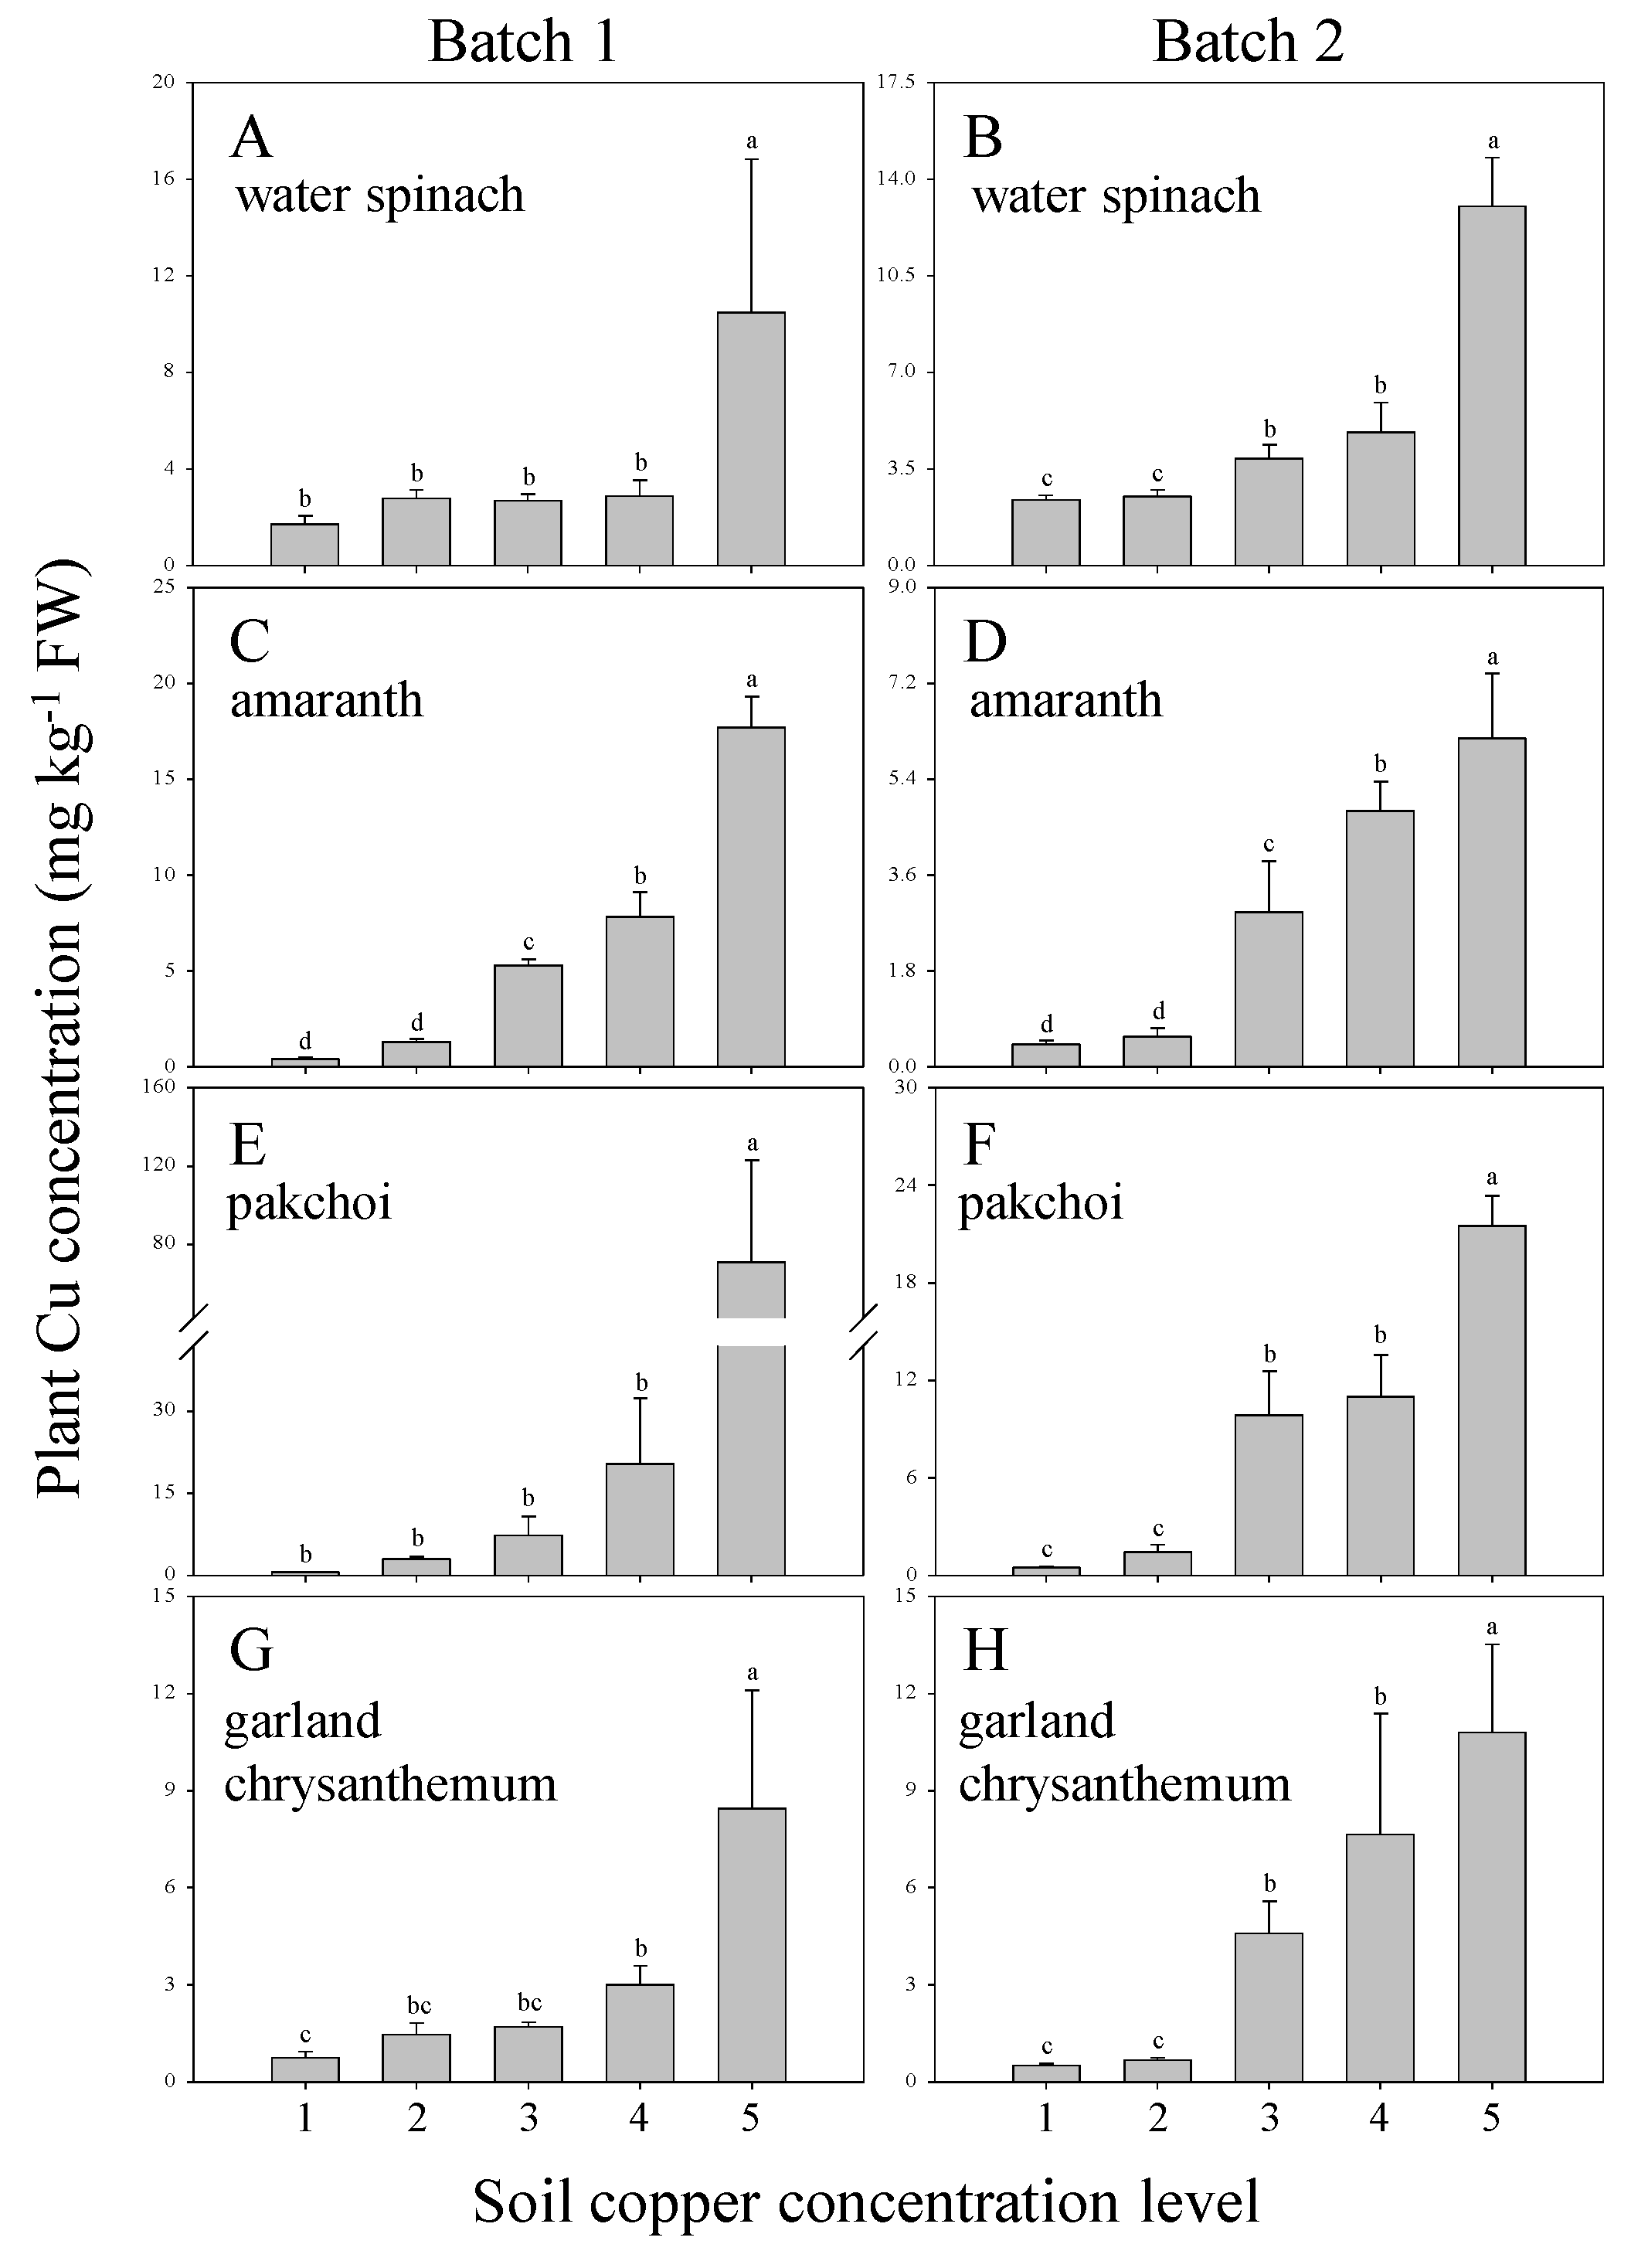
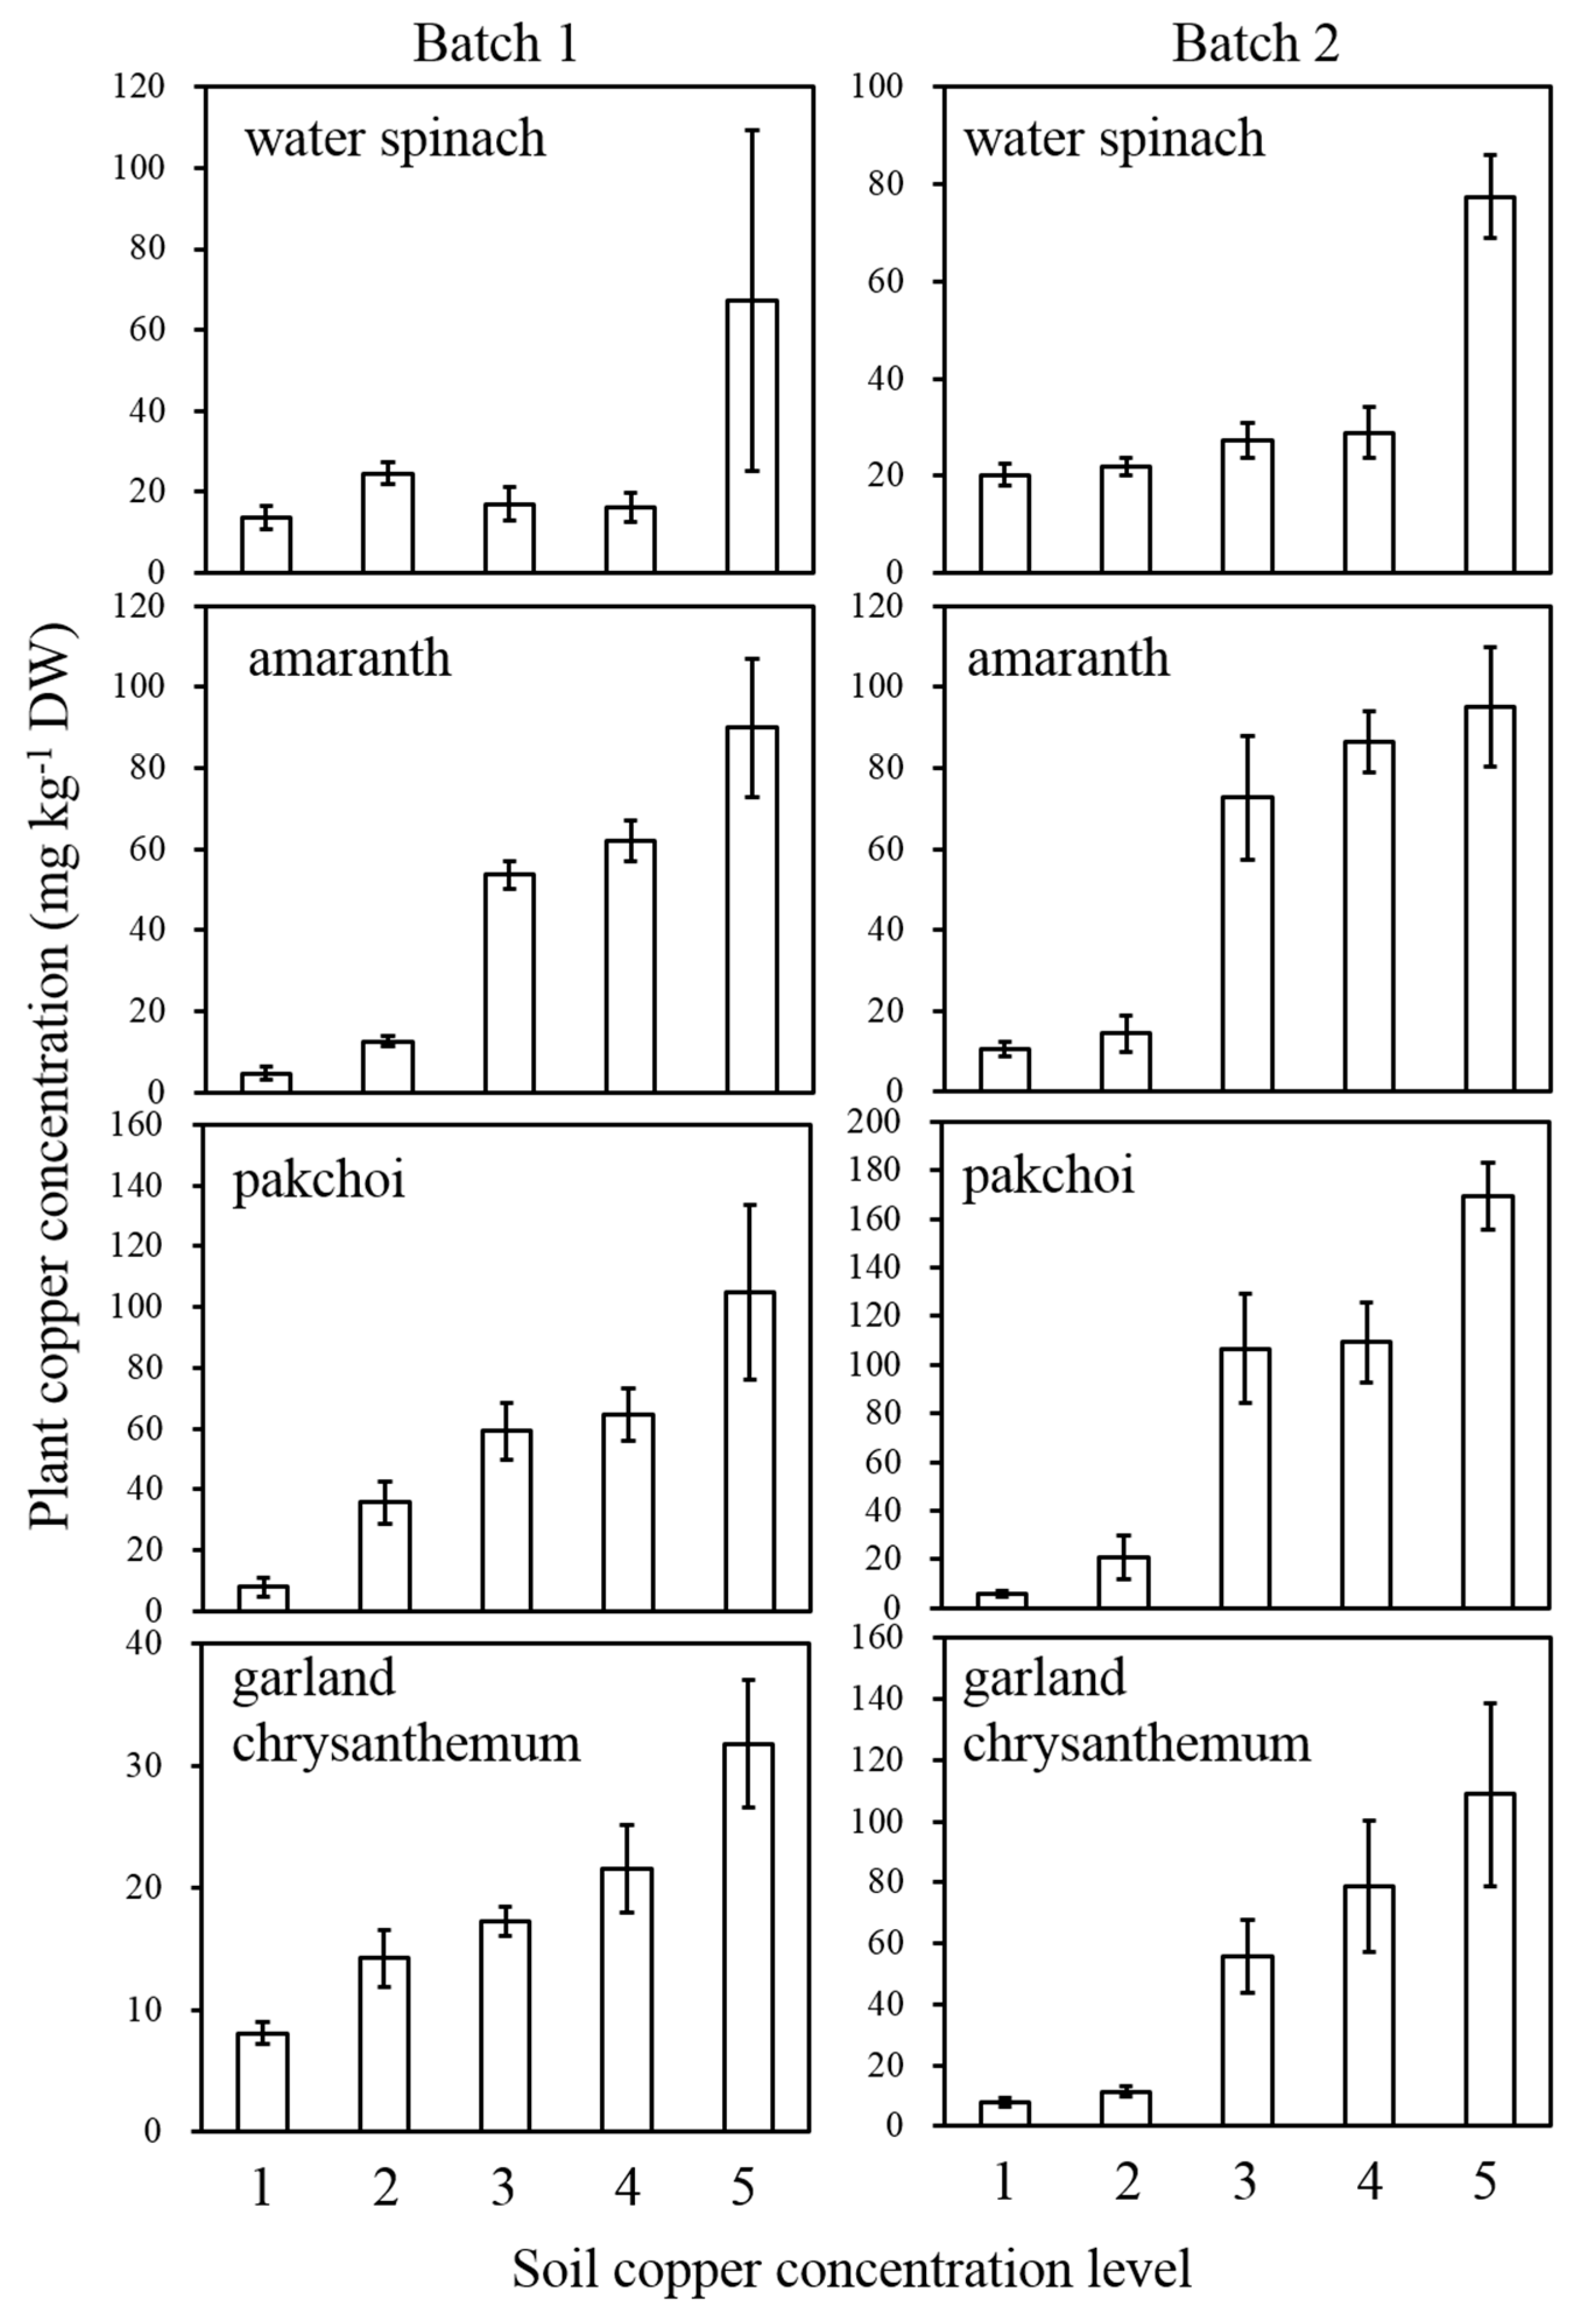
3.2. Copper Concentrations in Four Vegetables

Excessive copper is known to have cytotoxicity on animals and plants [8,32]. Other than a reduction of agricultural production, the accumulation of copper in crops could produce a risk to human health [33]. To decrease the risk of copper intake from vegetables (apart from assessing the phytotoxicity of copper in vegetables), it is necessary to quantify the copper contents in vegetables cultivated in copper-contaminated soil. Copper accumulation in the aerial parts of plants increases as the soil copper levels in all test vegetable varieties increase (Figure 4). The copper content in vegetables could explain the reduction of growth mentioned previously. All four vegetables show growth retardation in fresh weight and plant height when their soil copper concentration exceeds level 3 in batch two (Figure 2 and Figure 3). Consistent with the growth reduction in batch two, the copper concentration in all four vegetables presents a dramatic increase when the soil copper concentration exceeds level 3 (Figure 4B,D,F,H). Similar accumulation of dry weight-based copper concentration is also observed when the soil copper concentration exceeds level 3 in batch 2 (Appendix A Figure A2). These results suggest that this significant accumulation of copper contributes to phytotoxicity in the aerial parts of plants. Notably, although the water spinach and pakchoi in batch one show a significant growth reduction (Figure 2A,E and Figure 3A,E), the copper concentration in water spinach and pakchoi are not significantly higher at soil copper level 3.
This inconsistency could be due to the copper phytotoxicity in roots but not in shoots. Taken together, revealing the copper concentrations of these vegetables could not only provide explanations for toxicity, but also copper dose information when consuming vegetables.

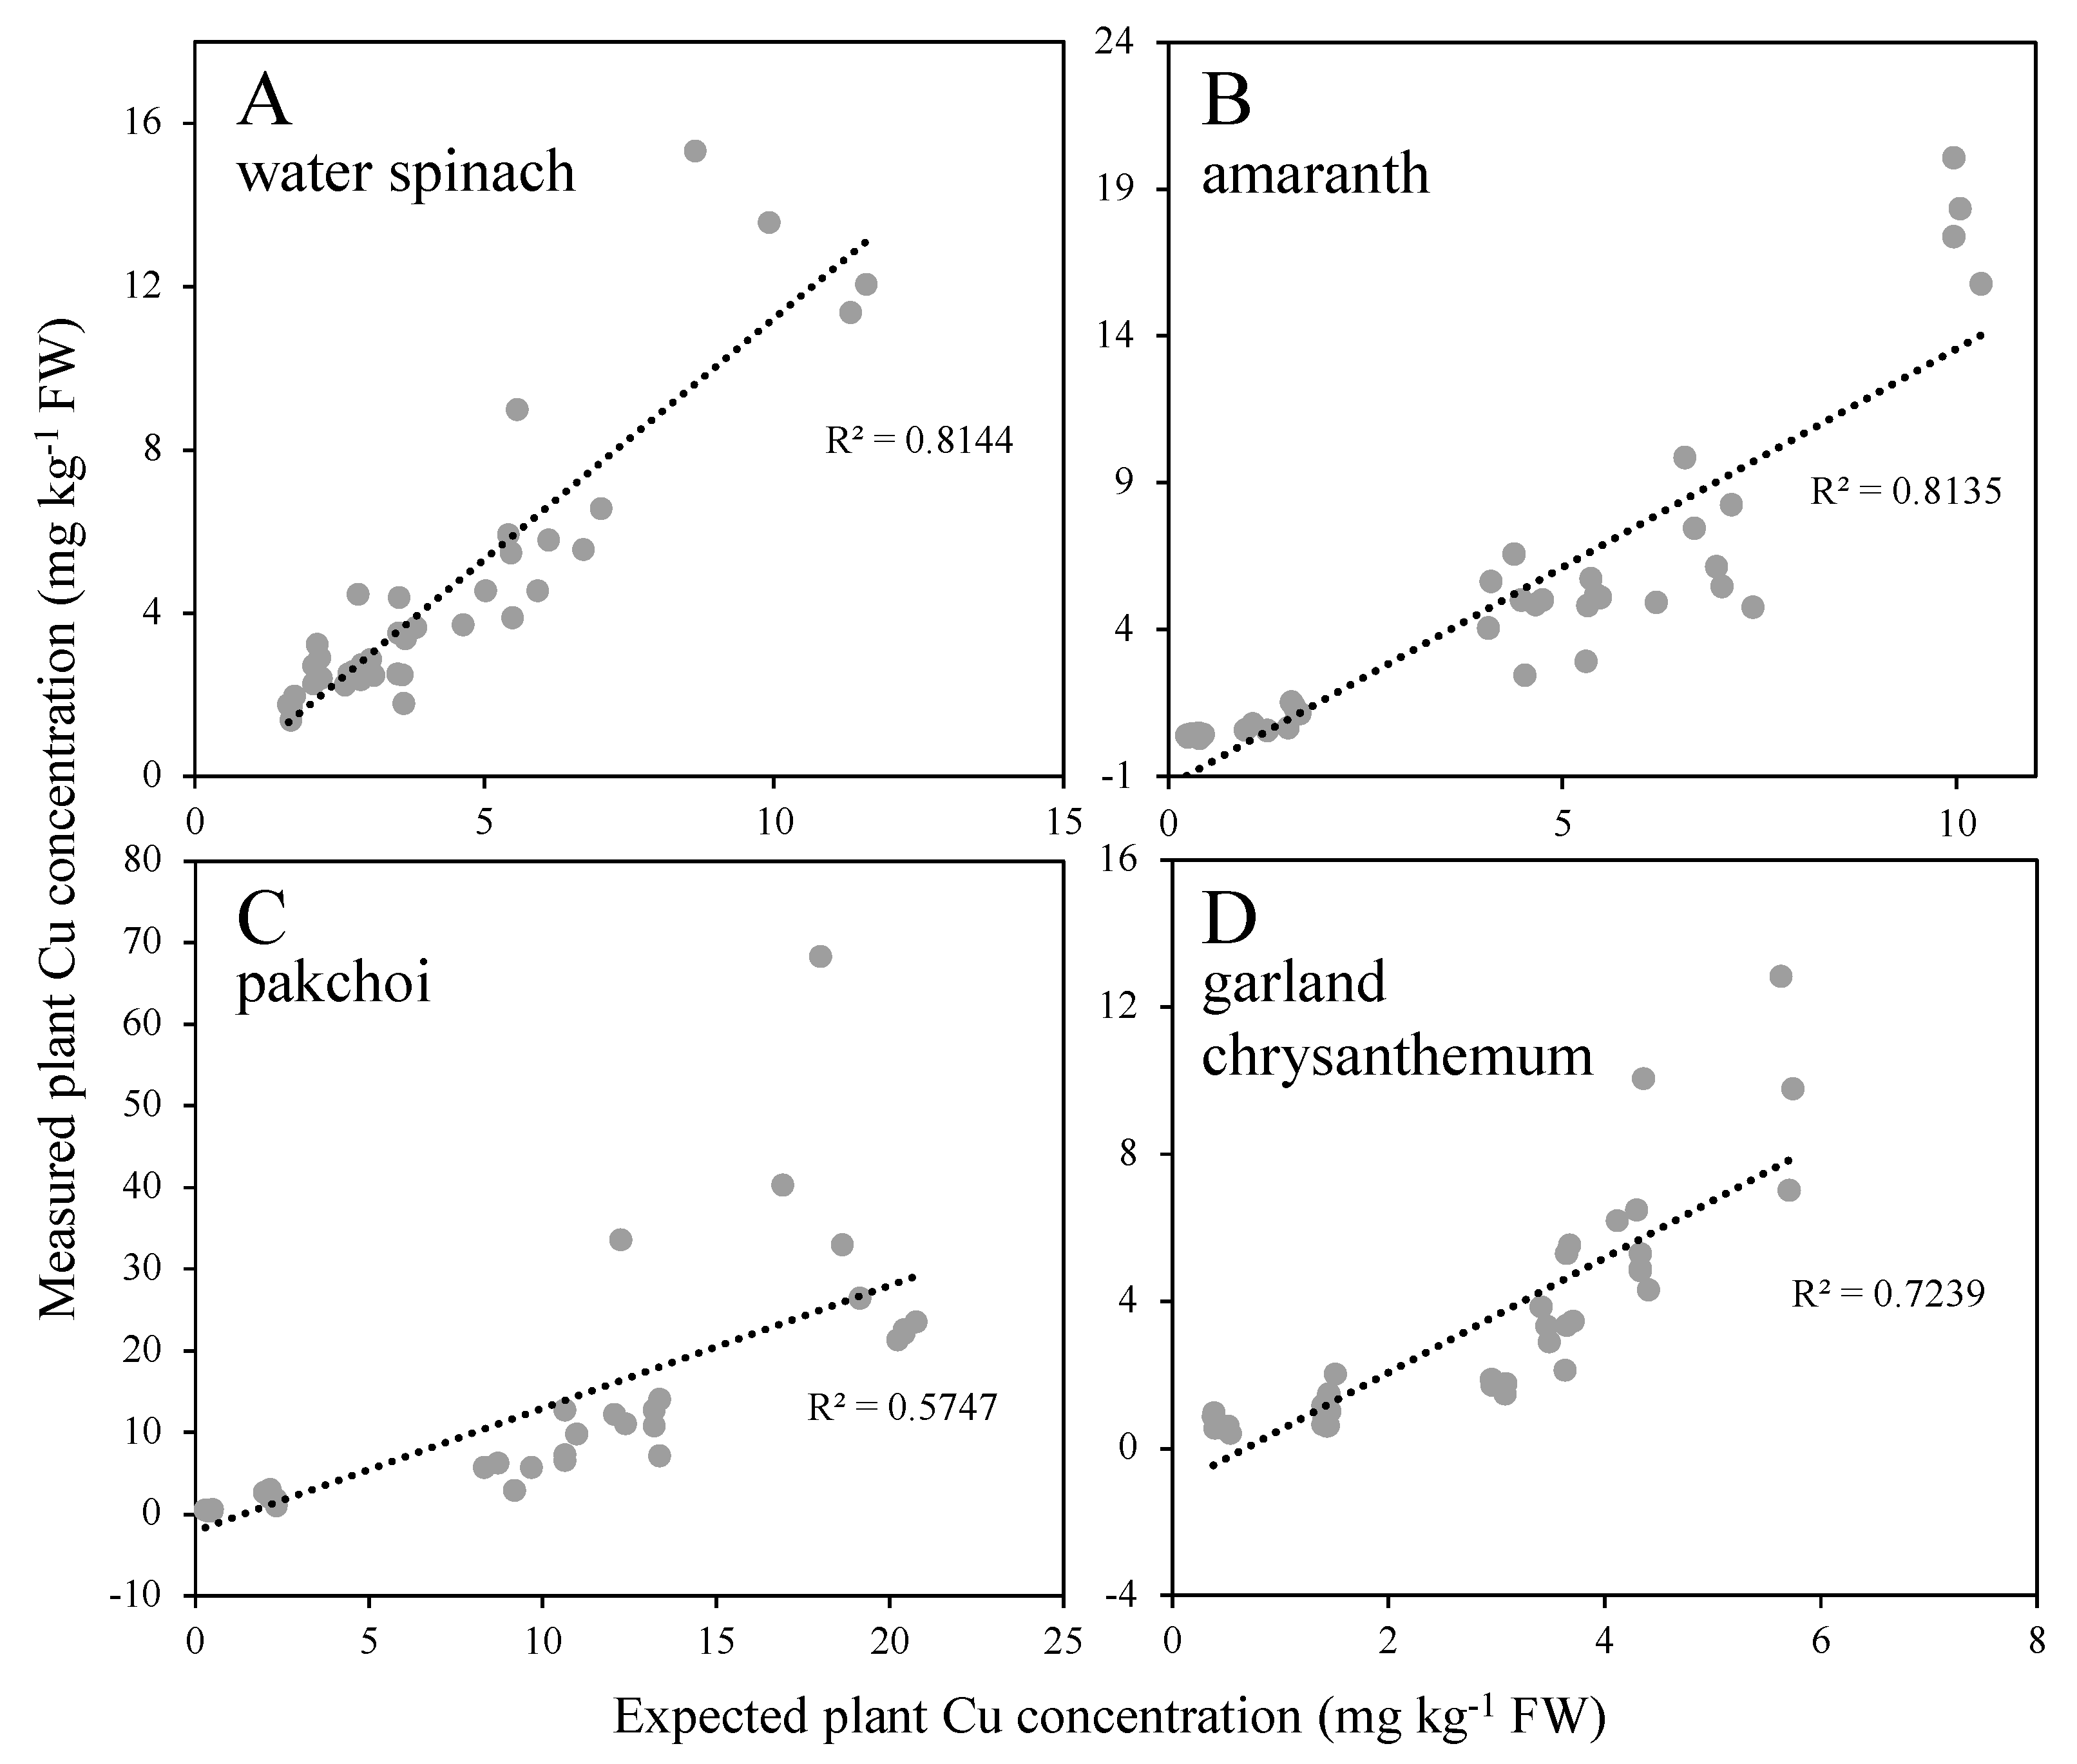
3.3. Regression Models for Crop Copper Concentrations

Since the copper concentration in crops is valuable information, it is important to develop a copper content prediction platform for crops based on clues from the soil. One way to develop such a platform is by utilizing regression models and employing one-step extractable copper, using CaCl2, NaNO3, HCl and EDTA solutions. The one-step extraction is a relatively fast method, and metal concentrations in the extracts are frequently used to describe the biologically available fraction [19]. In contrast, the tedious and time-consuming aqua regia digestion method extracts almost all forms of metals from the soil, but this total metal content in soil does not reflect to the biologically-available fraction. To develop a more efficient approach, both regression models derived from this aqua regia digestion method and the one-step extraction method are shown (Table 3), and the fitness of both models is assessed.
The correlation coefficients of these extractable copper concentrations that are significant to the copper concentrations in vegetables are subjected to a stepwise regression analysis. The combination of NaNO3-extractable copper concentration, HCl-extractable copper concentration and EDTA-extractable copper concentration produces a significant (p < 0.001) multiple linear regression model for water spinach copper concentration, which could explain 79.7% of the variance, while a simple regression model produced by the aqua regia-digested copper concentration can only explain 45.5% of the variance (Table 3), suggesting that the prediction model has higher fitness and offers a better explanation of variance compared to the simple regression model built according to the aqua regia-digested copper concentration. Since the prediction model derived from one-step extraction shows better fitness than that from the aqua regia method, the correlation of the expected and measured plant copper concentrations are evaluated (Figure 5). When this multiple linear regression model for water spinach is used to estimate the copper concentration in plants, the correlation between the expected and measured copper concentration is described by a linear regression line with an R square of 0.8144 (Table 3 and Figure 5A). Similar approaches are used to build regression models for amaranth, pakchoi and garland chrysanthemum (Table 3 and Figure 5). The model for amaranth copper with the highest fitness incorporates the HCl-extractable copper concentration and EDTA-extractable copper concentration with an R square of 0.7889 (Table 3 and Figure 5B). The models for pakchoi and garland chrysanthemum are derived from a single extraction, which greatly simplifies the quantification processes. The model for pakchoi copper can be described by the EDTA-extractable copper concentration with an R square of 0.5747 (Table 3 and Figure 5C), whereas the model for garland chrysanthemum utilizes an HCl-extractable copper concentration with an R square of 0.7239 (Table 3 and Figure 5D). The fitness of these models is comparable with the published multiple regression models for copper, zinc and nickel uptake by barley, wheat and corn [34,35,36]. For example, copper prediction models for barley roots derived from CaCl2- and low-molecular-weight organic acids-extractable copper have R squares from 0.617 to 0.801 [34]. A cadmium prediction model based on Na4P2O7-extractable cadmium and solubilized organic carbon for Durum Wheat grain shows 74% of fitness [35]. A copper prediction model for copper concentration in potato tubers shows an R square of 0.541 [36].
At least two types of models are shown for each vegetable, including an aqua regia digestion-based model and a one-step extraction-derived model. All concentration values are in μg kg−1, and are log10-transformed to ensure the homogeneity of the variance. Stepwise regression criteria: The probability of F to enter p ≤ 0.05; the probability of F to remove p ≥ 0.10.

4. Discussion

4.1. The Development of Copper Prediction Models for Vegetables

One purpose of this study is to develop prediction models for plant copper content based on soil parameters. We developed models for water spinach, amaranth, pakchoi and garland chrysanthemum (Table 3 and Figure 5). The effects of cadmium and copper mixtures on growth and the nutrients in pakchoi were investigated [17]. The contents of nickel, cadmium and copper are measured in a variety of water spinach samples collected from Sri Lanka [13]. However, no copper prediction model for pakchoi or water spinach was available until this study.
In our study, we agree that one-step extraction is an efficient method to evaluate copper phytotoxicity and accumulation in vegetables. A wide variety of extraction reagents are utilized to mimic the mobility and availability of heavy metals in soil, and even in rhizosphere soil, which includes a neutral salt solution, acids and chelators [19,20,23,25]. We took advantage of CaCl2-, NaNO3-, HCl- and EDTA-extractable copper concentrations to derive models with higher fitness by comparing them to time- and labor-intensive aqua regia-based models. Soil background electrolyte solutions are frequently mimicked using CaCl2, NaNO3 or NH4NO3 to extract metal concentrations for bioavailability prediction [19,23,37]. Metals in the solid phase of soil are usually considered as potential available metals which can be exchanged by HCl and HNO3, or chelated with EDTA or DTPA [19,25,37,38].
The EDTA-extractable copper is reported as an indicator of the copper bioavailability for tomato [27]. The DTPA extraction method for predicting copper concentration in barley roots is suitable for neutral and near-alkaline soils, and the EDTA extraction method is suitable for acidic soil (pH ≤ 6.5) [23]. Based on the soil pH (pH 5.84) in our study (Table 1), the EDTA solution is a suitable chelating reagent for model building. Although these extraction methods developed over more than two decades and the prediction models are usually not universal [24,39,40,41], current studies still utilize these approaches to develop prediction models for toxic metals in maize, water lettuce, cucumber and pakchoi [42,43,44,45,46].
Five levels of copper-contaminated soil in this study are obtained by adding CuSO4, but spiked soil may not represent a real scenario. Nevertheless, spiked soil, an artificial addition of copper into the culture medium, is one of the stable and frequently used approaches to study copper phytotoxicity and copper uptake [4,5,6,7,8,10,17,47,48]. A study utilizes the addition of CuCl2 to soil for exploring copper toxicity on rice growth and copper accumulation in rice grain [6]. Recent studies add CuSO4 or Cu(NO3)2 into soil for investigating accumulation of copper and physiological changes in black oat, carrot and pakchoi [10,17]. Addition of CuSO4 in soil is also used to study the effect of biochar on reducing copper toxicity in quinoa and mustard [47,48]. Nutrient solutions and hydroponic cultures with the addition of toxic metals are general approaches to study phytotoxicity in plants [4,5,7,8,43]. The mixtures of sewage sludge and cultivated field soil are alternative approaches to obtain various levels of metal contamination [45], or the sludge samples can be spiked with metal solutions to mimic the wastewater treatment [34]. In real cases of toxic metal pollution, high levels of copper in soil are often elevated with other metals. The influence of copper prediction by other metals is discussed in the next section.

4.2. Influence on Copper Prediction Models

Even though this study develops copper prediction models based on simple one-step extraction methods, these models may not be universally able to estimate the copper concentration in vegetables because the bioavailability of metal for plant uptake is affected by the metal’s constituents and by soil properties [26]. Under long-term field conditions, cadmium uptake by lettuce grown on biosolid-amended soil is lower than that grown on soil supplemented with equivalent cadmium salt [49], suggesting that the source and constitution of metals affects bioavailability. To estimate the bioavailability of metals in the soil, chemical extractions using neutral salts, acids, or chelating solutions, have been recommended [19]. Many cases of prediction models use the concentrations of multiple metals or soil properties to estimate one metal. For example, the chromium multiple regression model suggests that chelating-solution-extractable chromium and iron oxides contribute to chromium bioavailability in soil [23]. In the rice cadmium prediction model, some equations also include the neutral salt-extractable zinc concentration, due to the uptake competition of cadmium and zinc [12]. Furthermore, the soil’s pH effect is known to affect copper bioavailability and organic matter retention in tomatoes [27]. Because the influences of other metals and soil properties are not included as variables in this study, the developed copper prediction models are limited to similarly polluted cases. Certain cultivation methods contribute to similar cases of copper contamination. Predominantly fertilizing with manure instead of nitrate increases copper availability to the roots [50,51,52]. Fields applied with copper-based fungicides have a higher potential to accumulate copper in soil and crops [27,53,54], which are cases of single metal contamination. For soil contaminated with multiple metals or with extreme soil pH, a further validation of soil properties and the extractable concentrations for other metals are required to obtain more reliable predictions.

4.3. The Four Tested Leafy Vegetables Cultivated in Copper-Contaminated Soil May Not Pose a Significant Risk to Human Health

Although the copper concentration in these vegetables increases along with an increase in the soil’s copper levels (Figure 4), the market value of these vegetables is lost when the soil copper level increases over level 3 (Figure 1), suggesting a low possibility to be ingested when the soil copper concentration exceeds level 3 (251–296 mg·kg−1).
When the soil copper concentration is under level 2 (78-86 mg·kg−1) and level 3, the copper concentrations are around 2.79 mg·kg−1 and 3.88 mg·kg−1 in water spinach, 1.29 mg·kg−1 and 5.29 mg·kg−1 in amaranth, 2.91 mg·kg−1 and 9.89 mg·kg−1 in pakchoi, and 1.46 mg·kg−1 and 4.59 mg·kg−1 in garland chrysanthemum. According the World Heath Organization (WHO) daily recommendation of 400 g of vegetables and fruits, the copper intake from the vegetables above ranges from 0.52 mg to 3.96 mg per day. To evaluate the risk to human health from consuming these levels of copper from vegetables, the recommended levels of copper in water and food must be considered. The No-Observed-Adverse-Effect Level (NOAEL) and Lowest-observed-adverse-effect level (LOAEL) of copper for adult humans are reported as 4 mg·L−1 and 6 mg·L−1 of copper in drinking water, respectively [55]. The NOAEL of copper in copper gluconate supplementation is 10 mg per day, based on 12 weeks of trials without significant adverse effects on liver function and no changes in the copper level in serum, urine, or hair [56]. Increasing the dietary intake of copper to 7.53 mg per day for 24 days shows no significant increase in plasma copper, ceruloplasmin, or whole-blood superoxide dismutase [57]. The European Food Safety Authority recommends the tolerable upper intake level (UL) for copper to be 5 mg per day for adults and 2 mg per day for children ages 4 to 6 [58]. Since the copper content from the vegetables in this study is lower than the NOAEL, LOAEL and UL of copper, the health risk from consuming such vegetables cultivated on copper-contaminated soil is low for adults. To further reduce the health risk, one approach is to reduce the accumulation of copper in vegetables. Biochar has been reported to be a soil amendment that can reduce copper in the water of soil pores and copper accumulation in Brassica juncea and Chenopodium quinoa [47,48,59]. Another approach is to reduce the source of copper from soil amendments. Fertilizing with manure potentially rises copper availability to the roots and increases copper uptake and toxicity [50,51,52]. Further studies on soil amendments to attenuate the uptake of copper in leafy vegetables could be required.

5. Conclusions

This study demonstrates that assessing the growth performance and quantification of the copper content in four selected leafy vegetables can be a useful approach for evaluating copper toxicity for these vegetables. Combining the one-step extractions of soil copper with plant copper content suggests multiple regression as a novel prediction model for the copper content in vegetables. This study not only integrates copper phytotoxicity and copper accumulation, but also develops prediction tools and discusses health risks. Although such a result may only be limited to these four vegetables, this strategy gives insight into other crops and other toxic metals.

Author Contributions

Conceptualization, formal analysis, funding acquisition, and writing—original draft, F.-C.H.; visualization, investigation, and methodology, W.-Y.C.

Funding

This research was funded by the Council of Agriculture, Executive Yuan, R.O.C., grant number 107AS-12.2.2-IE-b1 and 108AS-11.2.2-IE-b1.

Acknowledgments

The authors thank Sinotech Environmental Technology, LTD for soil sampling and the research team of Chihhao Fan from NTU for discussions and administrative project support. The authors gladly thank Jing-Chi Lo and Kuo-Chen Yeh from the Agricultural Biotechnology Research Center, Academia Sinica for facilitating the nitric acid-based microwave digestion method. The authors specially thank the Joint Center for Instruments and Research, College of Bioresources and Agriculture, NTU for their technical support for ICP-MS and ICP-OES.

Conflicts of Interest

The authors declare no conflict of interest. The funders had no role in the design of the study; in the collection, analyses, or interpretation of data; in the writing of the manuscript, or in the decision to publish the results.

Appendix A

Figure A1. The effect of soil copper concentration on malodialdehyde (MDA) content in water spinach. The three levels shown here of soil copper concentration are 1: 17–30 mg·kg−1, 3: 251–296 mg ·kg−1, and 4: 296–367 mg·kg−1 (see Table 2 for details). MDA content indicates lipid peroxidation that is caused by copper toxicity. MDA content was analyzed with the thiobarbituric acid (TBA) method as described previously [60]. Briefly, 0.02 g vegetable tissue from the edible part were homogenized with 400 mm3 of 5% trichloroacetic acid (TCA) and centrifuged at 10,000× g for 5 min. One hundred mm3 of supernatant was mixed with 0.9 cm3 of 0.5% TBA in 20% TCA followed by incubating at 95 °C for 30 min. The reaction was stopped by ice bath and centrifuged at 10,000× g for 10 min. MDA concentration was estimated by subtracting the 600 nm absorption from the 532 nm absorption with an absorbance coefficient of extinction (155 mM−1 cm−1). The value are the means ± standard deviation (n = 3).
Sustainability 11 06215 g0a1
Figure A2. The effect of soil copper concentration on dry weight (DW) basis copper accumulation in water spinach, amaranth, pakchoi and garland chrysanthemum. The five levels of soil copper concentration are 1: 17–30 mg·kg−1, 2: 78–86 mg·kg−1, 3: 251–296 mg·kg−1, 4: 296–367 mg·kg−1 and 5: 409–518 mg·kg−1 (see Table 2 for details). Two batches of cultivation were carried out. Two batches of warm season cultivation ran from June to July 2017 and from September to October 2017 for water spinach and amaranth, and two batches of cold season cultivation ran from February to March 2017 and from February to March 2018 for pakchoi and garland chrysanthemum. The value are the means ± standard deviation (n = 5–6).
Sustainability 11 06215 g0a2

References

  1. Vu, C.T.; Lin, C.; Shern, C.-C.; Yeh, G.; Le, V.G.; Tran, H.T. Contamination, ecological risk and source apportionment of heavy metals in sediments and water of a contaminated river in Taiwan. Ecol. Indic. 2017, 82, 32–42. [Google Scholar] [CrossRef]
  2. Adrees, M.; Ali, S.; Rizwan, M.; Ibrahim, M.; Abbas, F.; Farid, M.; Zia-ur-Rehman, M.; Irshad, M.K.; Bharwana, S.A. The effect of excess copper on growth and physiology of important food crops: A review. Environ. Sci. Pollut. Res. 2015, 22, 8148–8162. [Google Scholar] [CrossRef] [PubMed]
  3. Schutzendubel, A.; Polle, A. Plant responses to abiotic stresses: Heavy metal-induced oxidative stress and protection by mycorrhization. J. Exp. Bot. 2002, 53, 1351–1365. [Google Scholar] [CrossRef] [PubMed]
  4. Bouazizi, H.; Jouili, H.; Geitmann, A.; El Ferjani, E. Copper toxicity in expanding leaves of Phaseolus vulgaris L.: Antioxidant enzyme response and nutrient element uptake. Ecotoxicol. Environ. Saf. 2010, 73, 1304–1308. [Google Scholar] [CrossRef]
  5. Quartacci, M.F.; Pinzino, C.; Sgherri, C.L.; Dalla Vecchia, F.; Navari-Izzo, F. Growth in excess copper induces changes in the lipid composition and fluidity of PSII-Enriched membranes in wheat. Physiol. Plant. 2000, 108, 87–93. [Google Scholar] [CrossRef]
  6. Xu, J.; Yang, L.; Wang, Z.; Dong, G.; Huang, J.; Wang, Y. Toxicity of copper on rice growth and accumulation of copper in rice grain in copper contaminated soil. Chemosphere 2006, 62, 602–607. [Google Scholar] [CrossRef]
  7. Singh, D.; Nath, K.; Sharma, Y.K. Response of wheat seed germination and seedling growth under copper stress. J. Environ. Biol. 2007, 28, 409. [Google Scholar]
  8. Ali, S.; Shahbaz, M.; Shahzad, A.N.; Khan, H.A.A.; Anees, M.; Haider, M.S.; Fatima, A. Impact of copper toxicity on stone-head cabbage (Brassica oleracea var. capitata) in hydroponics. PeerJ 2015, 3, 1119. [Google Scholar] [CrossRef]
  9. Oteef, M.D.Y.; Fawy, K.F.; Abd-Rabboh, H.S.M.; Idris, A.M.J.E.M. Assessment. Levels of zinc, copper, cadmium, and lead in fruits and vegetables grown and consumed in Aseer Region, Saudi Arabia. Environ. Monit. Assess. 2015, 187, 676. [Google Scholar] [CrossRef]
  10. De Conti, L.; Ceretta, C.A.; Tiecher, T.L.; da Silva, L.O.S.; Tassinari, A.; Somavilla, L.M.; Mimmo, T.; Cesco, S.; Brunetto, G. Growth and chemical changes in the rhizosphere of black oat (Avena strigosa) grown in soils contaminated with copper. Ecotoxicol. Environ. Saf. 2018, 163, 19–27. [Google Scholar] [CrossRef]
  11. Reboredo, F.H.; Pelica, J.; Lidon, F.C.; Ramalho, J.C.; Pessoa, M.F.; Calvão, T.; Simões, M.; Guerra, M.J.E.M. Heavy metal content of edible plants collected close to an area of intense mining activity (Southern Portugal). Environ. Monit. Assess. 2018, 190, 484. [Google Scholar] [CrossRef] [PubMed]
  12. Hseu, Z.-Y.; Su, S.-W.; Lai, H.-Y.; Guo, H.-Y.; Chen, T.-C.; Chen, Z.-S. Remediation techniques and heavy metal uptake by different rice varieties in metal-contaminated soils of Taiwan: New aspects for food safety regulation and sustainable agriculture. Soil Sci. Plant Nutr. 2010, 56, 31–52. [Google Scholar] [CrossRef] [Green Version]
  13. Kananke, T.; Wansapala, J.; Gunaratne, A.J.E.M. Assessment. Detection of Ni, Cd, and Cu in green leafy vegetables collected from different cultivation areas in and around Colombo District, Sri Lanka. Environ. Monit. Assess. 2016, 188, 187. [Google Scholar] [CrossRef] [PubMed]
  14. Sharma, A.; Katnoria, J.K.; Nagpal, A.K.J.S. Heavy metals in vegetables: Screening health risks involved in cultivation along wastewater drain and irrigating with wastewater. SpringerPlus 2016, 5, 488. [Google Scholar] [CrossRef]
  15. Rahmdel, S.; Rezaei, M.; Ekhlasi, J.; Zarei, S.H.; Akhlaghi, M.; Abdollahzadeh, S.M.; Sefidkar, R.; Mazloomi, S.M.J.E.M. Assessment. Heavy metals (Pb, Cd, Cu, Zn, Ni, Co) in leafy vegetables collected from production sites: Their potential health risk to the general population in Shiraz, Iran. Environ. Monit. Assess. 2018, 190, 650. [Google Scholar] [CrossRef]
  16. Qureshi, A.S.; Hussain, M.I.; Ismail, S.; Khan, Q.M. Evaluating heavy metal accumulation and potential health risks in vegetables irrigated with treated wastewater. Chemosphere 2016, 163, 54–61. [Google Scholar] [CrossRef]
  17. Hou, S.; Zheng, N.; Tang, L.; Ji, X. Effects of cadmium and copper mixtures to carrot and pakchoi under greenhouse cultivation condition. Ecotoxicol. Environ. Saf. 2018, 159, 172–181. [Google Scholar] [CrossRef]
  18. Bolan, N.; Kunhikrishnan, A.; Thangarajan, R.; Kumpiene, J.; Park, J.; Makino, T.; Kirkham, M.B.; Scheckel, K. Remediation of heavy metal(loid)s contaminated soils—To mobilize or to immobilize. J. Hazard. Mater. 2014, 266, 141–166. [Google Scholar] [CrossRef]
  19. Kim, R.-Y.; Yoon, J.-K.; Kim, T.-S.; Yang, J.E.; Owens, G.; Kim, K.-R. Bioavailability of heavy metals in soils: Definitions and practical implementation—A critical review. Environ. Geochem. Health 2015, 37, 1041–1061. [Google Scholar] [CrossRef]
  20. Janssen, R.P.T.; Posthuma, L.; Baerselman, R.; Den Hollander, H.A.; Van Veen, R.P.M.; Peijnenburg, W.J.G.M. Equilibrium partitioning of heavy metals in dutch field soils. II. Prediction of metal accumulation in earthworms. Environ. Toxicol. Chem. 1997, 16, 2479–2488. [Google Scholar] [CrossRef]
  21. Sahito, O.M.; Afridi, H.I.; Kazi, T.G.; Baig, J.A. Evaluation of heavy metal bioavailability in soil amended with poultry manure using single and BCR sequential extractions. Int. J. Environ. Anal. Chem. 2015, 95, 1066–1079. [Google Scholar] [CrossRef]
  22. Chojnacka, K.; Chojnacki, A.; Górecka, H.; Górecki, H. Bioavailability of heavy metals from polluted soils to plants. Sci. Total Environ. 2005, 337, 175–182. [Google Scholar] [CrossRef] [PubMed]
  23. Feng, M.-H.; Shan, X.-Q.; Zhang, S.; Wen, B. A comparison of the rhizosphere-based method with DTPA, EDTA, CaCl2, and NaNO3 extraction methods for prediction of bioavailability of metals in soil to barley. Environ. Pollut. 2005, 137, 231–240. [Google Scholar] [CrossRef] [PubMed]
  24. Gupta, S.K.; Aten, C. Comparison and evaluation of extraction media and their suitability in a simple model to predict the biological relevance of heavy metal concentrations in contaminated soils. Int. J. Environ. Anal. Chem. 1993, 51, 25–46. [Google Scholar] [CrossRef]
  25. Norvell, W.A. Comparison of chelating agents as extractants for metals in diverse soil materials. Soil Sci. Soc. Am. J. 1984, 48, 1285–1292. [Google Scholar] [CrossRef]
  26. Basta, N.T.; Ryan, J.A.; Chaney, R.L. Trace element chemistry in residual-treated soil: Key concepts and metal bioavailability. J. Environ. Qual. 2005, 34, 49–63. [Google Scholar] [CrossRef]
  27. Chaignon, V.; Sanchez-Neira, I.; Herrmann, P.; Jaillard, B.; Hinsinger, P. Copper bioavailability and extractability as related to chemical properties of contaminated soils from a vine-growing area. Environ. Pollut. 2003, 123, 229–238. [Google Scholar] [CrossRef]
  28. Lin, Y.-W.; Liu, T.-S.; Guo, H.-Y.; Chiang, C.-M.; Tang, H.-J.; Chen, H.-T.; Chen, J.-H. Relationships between Cd concentrations in different vegetables and those in arable soils, and food safety evaluation of vegetables in Taiwan. Soil Sci. Plant Nutr. 2015, 61, 983–998. [Google Scholar] [CrossRef] [Green Version]
  29. Ashworth, J.; Keyes, D.; Kirk, R.; Lessard, R. Standard procedure in the hydrometer method for particle size analysis. Commun. Soil Sci. Plant Anal. 2001, 32, 633–642. [Google Scholar] [CrossRef]
  30. Koroleff, F. Direct spectrophotometric determination of ammonia in precipitation. Tellus 1966, 18, 562–565. [Google Scholar] [CrossRef] [Green Version]
  31. Lin, Y.-F.; Liang, H.-M.; Yang, S.-Y.; Boch, A.; Clemens, S.; Chen, C.-C.; Wu, J.-F.; Huang, J.-L.; Yeh, K.-C. Arabidopsis IRT3 is a zinc-regulated and plasma membrane localized zinc/iron transporter. New Phytol. 2009, 182, 392–404. [Google Scholar] [CrossRef] [PubMed]
  32. Michaud, A.M.; Bravin, M.N.; Galleguillos, M.; Hinsinger, P. Copper uptake and phytotoxicity as assessed in situ for durum wheat (Triticum turgidum durum L.) cultivated in Cu-contaminated, former vineyard soils. Plant Soil 2007, 298, 99–111. [Google Scholar] [CrossRef]
  33. Gaetke, L.M.; Chow-Johnson, H.S.; Chow, C.K. Copper: Toxicological relevance and mechanisms. Arch. Toxicol. 2014, 88, 1929–1938. [Google Scholar] [CrossRef] [PubMed]
  34. Soriano-Disla, J.M.; Gómez, I.; Navarro-Pedreño, J.; Lag-Brotons, A. Evaluation of single chemical extractants for the prediction of heavy metal uptake by barley in soils amended with polluted sewage sludge. Plant Soil 2009, 327, 303–314. [Google Scholar] [CrossRef]
  35. Garrett, R.G.; I. MacLaurin, A.; Gawalko, E.J.; Tkachuk, R.; Hall, G.E.M. A prediction model for estimating the cadmium content of durum wheat from soil chemistry. J. Geochem. Explor. 1998, 64, 101–110. [Google Scholar] [CrossRef]
  36. Zogaj, M.; Düring, R.-A. Plant uptake of metals, transfer factors and prediction model for two contaminated regions of Kosovo. J. Plant Nutr. Soil Sci. 2016, 179, 630–640. [Google Scholar] [CrossRef]
  37. Takeda, A.; Tsukada, H.; Takaku, Y.; Hisamatsu, S.; Inaba, J.; Nanzyo, M. Extractability of major and trace elements from agricultural soils using chemical extraction methods: Application for phytoavailability assessment. Soil Sci. Plant Nutr. 2006, 52, 406–417. [Google Scholar] [CrossRef]
  38. Zhang, M.-K.; Liu, Z.Y.; Wang, H. Use of single extraction methods to predict bioavailability of heavy metals in polluted soils to rice. Commun. Soil Sci. Plant Anal. 2010, 41, 820–831. [Google Scholar] [CrossRef]
  39. Hammer, D.; Keller, C. Changes in the rhizosphere of metal-accumulating plants evidenced by chemical extractants. J. Environ. Qual. 2002, 31, 1561–1569. [Google Scholar] [CrossRef]
  40. Lindsay, W.L.; Norvell, W.A. Development of a DTPA soil test for zinc, iron, manganese, and copper. Soil Sci. Soc. Am. J. 1978, 42, 421–428. [Google Scholar] [CrossRef]
  41. Novozamsky, I.; Lexmond, T.M.; Houba, V.J.G. A single extraction procedure of soil for evaluation of uptake of some heavy-metals by plants. Int. J. Environ. Anal. Chem. 1993, 51, 47–58. [Google Scholar] [CrossRef]
  42. Adegbe, A.A.; Eneji, I.S.; Aboiyar, T.; Wuana, R.A. Modelling of heavy metals concentration in maize (Zea may L.) grown in artificially contaminated soil. Asian J. Phys. Chem. Sci. 2018, 5, 1–13. [Google Scholar] [CrossRef] [PubMed]
  43. Kumar, V.; Singh, J.; Kumar, P. Heavy metal uptake by water lettuce (Pistia stratiotes L.) from paper mill effluent (PME): Experimental and prediction modeling studies. Environ. Sci. Pollut. Res. Int. 2019, 26, 14400–14413. [Google Scholar] [CrossRef] [PubMed]
  44. Zia, A.; van den Berg, L.; Ahmad, M.N.; Riaz, M.; Zia, D.; Ashmore, M. Controls on accumulation and soil solution partitioning of heavy metals across upland sites in United Kingdom (UK). J. Environ. Manag. 2018, 222, 260–267. [Google Scholar] [CrossRef] [PubMed]
  45. Eid, E.M.; Alrumman, S.A.; Farahat, E.A.; El-Bebany, A.F. Prediction models for evaluating the uptake of heavy metals by cucumbers (Cucumis sativus L.) grown in agricultural soils amended with sewage sludge. Environ. Monit. Assess. 2018, 190, 501. [Google Scholar] [CrossRef]
  46. Dai, Y.; Nasir, M.; Zhang, Y.; Lv, J. Establishment of a model to assess soil cadmium uptake by Brassica Chinensis. Soil Sci. Soc. Am. J. 2019, 83, 380–387. [Google Scholar] [CrossRef]
  47. Buss, W.; Kammann, C.; Koyro, H.-W. Biochar reduces copper toxicity in Chenopodium quinoa Willd. in a sandy soil. J. Environ. Qual. 2012, 41, 1157–1165. [Google Scholar] [CrossRef]
  48. Silva Gonzaga, M.I.; Oliveira da Silva, P.S.; Carlos de Jesus Santos, J.; Ganassali de Oliveira Junior, L.F. Biochar increases plant water use efficiency and biomass production while reducing Cu concentration in Brassica juncea L. in a Cu-contaminated soil. Ecotoxicol. Environ. Saf. 2019, 183, 109557. [Google Scholar] [CrossRef]
  49. Brown, S.L.; Chaney, R.L.; Angle, J.S.; Ryan, J.A. The phytoavailability of cadmium to lettuce in long-term biosolids-amended soils. J. Environ. Qual. 1998, 27, 1071–1078. [Google Scholar] [CrossRef]
  50. Hsu, J.-H.; Lo, S.-L. Effect of composting on characterization and leaching of copper, manganese, and zinc from swine manure. Environ. Pollut. 2001, 114, 119–127. [Google Scholar] [CrossRef]
  51. Mantovi, P.; Bonazzi, G.; Maestri, E.; Marmiroli, N. Accumulation of copper and zinc from liquid manure in agricultural soils and crop plants. Plant Soil 2003, 250, 249–257. [Google Scholar] [CrossRef]
  52. Xiong, X.; Yanxia, L.; Wei, L.; Chunye, L.; Wei, H.; Ming, Y. Copper content in animal manures and potential risk of soil copper pollution with animal manure use in agriculture. Resour. Conserv. Recycl. 2010, 54, 985–990. [Google Scholar] [CrossRef]
  53. Pankotai, M.G.; Fodor, P. The copper level dependence in vegetable crops at pesticide treatment. J. Environ. Sci. Health Part B 1996, 31, 621–626. [Google Scholar] [CrossRef]
  54. Senkondo, Y.H.; Tack, F.M.G.; Semu, E. Copper accumulations in soils, coffee, banana, and bean plants following copper-based fungicides in coffee farms in Arusha and Kilimanjaro regions, Tanzania. Commun. Soil Sci. Plant Anal. 2014, 45, 2032–2045. [Google Scholar] [CrossRef]
  55. Araya, M.; McGoldrick, M.C.; Klevay, L.M.; Strain, J.J.; Robson, P.; Nielsen, F.; Olivares, M.; Pizarro, F.; Johnson, L.; Poirier, K.A. Determination of an Acute No-Observed-Adverse-Effect Level (NOAEL) for Copper in Water. Regul. Toxicol. Pharmacol. 2001, 34, 137–145. [Google Scholar] [CrossRef]
  56. Pratt, W.B.; Omdahl, J.L.; Sorenson, J.R.J. Lack of effects of copper gluconate supplementation. Am. J. Clin. Nutr. 1985, 42, 681–682. [Google Scholar] [CrossRef]
  57. Turnlund, J.R.; Keen, C.L.; Smith, R.G. Copper status and urinary and salivary copper in young men at three levels of dietary copper. Am. J. Clin. Nutr. 1990, 51, 658–664. [Google Scholar] [CrossRef]
  58. EFSA. Tolerable Upper Intake Levels for Vitamins and Minerals. Available online: http://www.efsa.europa.eu/sites/default/files/efsa_rep/blobserver_assets/ndatolerableuil.pdf (accessed on 7 October 2019).
  59. Oustriere, N.; Marchand, L.; Galland, W.; Gabbon, L.; Lottier, N.; Motelica, M.; Mench, M. Influence of biochars, compost and iron grit, alone and in combination, on copper solubility and phytotoxicity in a Cu-contaminated soil from a wood preservation site. Sci. Total Environ. 2016, 566, 816–825. [Google Scholar] [CrossRef]
  60. Ali, M.B.; Hahn, E.-J.; Paek, K.-Y. Effects of light intensities on antioxidant enzymes and malondialdehyde content during short-term acclimatization on micropropagated Phalaenopsis plantlet. Environ. Exp. Bot. 2005, 54, 109–120. [Google Scholar] [CrossRef]
Figure 1. Performance of water spinach, amaranth, pakchoi and garland chrysanthemum in the soil with five levels of copper concentrations for 28 days. The five levels of soil Cu concentration are 1: 17–30 mg·kg–1, 2: 78–86 mg·kg–1, 3: 251–296 mg·kg–1, 4: 296–367 mg·kg–1 and 5: 409–518 mg·kg–1 (see Table 2 for detail). Six replications were used for each treatment in one batch of cultivation, and these pictures are one representative for the six replications. Two batches were carried out, including two batches of warm season cultivation from June to July 2017 and from September to October 2017 for water spinach and amaranth and two batches of cold season cultivation from February to March 2017 and from February to March 2018 (for pakchoi and garland chrysanthemum). The scale bars indicate 15 cm.
Sustainability 11 06215 g001
Figure 2. The effect of soil copper concentration on the fresh weight of water spinach, amaranth, pakchoi and garland chrysanthemum. The five levels of soil Cu concentration are 1: 17–30 mg·kg–1, 2: 78–86 mg·kg–1, 3: 251–296 mg·kg–1, 4: 296–367 mg·kg–1 and 5: 409–518 mg·kg–1 (see Table 2 for detail). Two batches of cultivation were carried out. Two batches of warm season cultivation ran from June to July 2017 and from September to October 2017 for water spinach and amaranth, and two batches of cold season cultivation ran from February to March 2017 and from February to March 2018 for pakchoi and garland chrysanthemum. The values are the means ± standard deviation (n = 5–6). The same letters above the error bars indicate that there are no significant differences at p ≤ 0.05 according to the LSD.
Sustainability 11 06215 g002
Figure 3. The effect of soil copper concentration on the plant height of water spinach, amaranth, pakchoi and garland chrysanthemum. Plant height is defined from the root shoot junction to the highest leaf tip. The five levels of soil copper concentration are 1: 17–30 mg·kg–1, 2: 78–86 mg·kg–1, 3: 251–296 mg·kg–1, 4: 296–367 mg·kg–1 and 5: 409–518 mg·kg–1 (see Table 2 for detail). Two batches of cultivation were carried out. Two batches of warm season cultivation ran from June to July 2017 and from September to October 2017 for water spinach and amaranth, and two batches of cold season cultivation ran from February to March 2017 and from February to March 2018 for pakchoi and garland chrysanthemum. The value are the means ± standard deviation (n = 5–6). The same letters above the error bars indicate that there are no significant differences at p ≤ 0.05 according to the LSD.
Sustainability 11 06215 g003
Figure 4. The effect of soil copper concentration on copper accumulation in water spinach, amaranth, pakchoi and garland chrysanthemum. The five levels of soil copper concentration are 1: 17–30 mg·kg–1, 2: 78–86 mg·kg–1, 3: 251–296 mg·kg–1, 4: 296–367 mg·kg–1 and 5: 409–518 mg·kg–1 (see Table 2 for details). Two batches of cultivation were carried out. Two batches of warm season cultivation ran from June to July 2017 and from September to October 2017 for water spinach and amaranth, and two batches of cold season cultivation ran from February to March 2017 and from February to March 2018 for pakchoi and garland chrysanthemum. The value are the means ± standard deviation (n = 5–6). The same letters above the error bars indicate that there are no significant differences at p ≤ 0.05 according to the LSD.
Sustainability 11 06215 g004
Figure 5. The correlation of the expected and measured plant Cu concentration in water spinach, amaranth, pakchoi and garland chrysanthemum using models derived from one-step extractions. The expected plant Cu concentrations are calculated according to the following multiple linear regression formula by fitting the Cu parameters from one-step extractions: A, Log(Cuwater spinach) = 0.305 Log(CuNaNO3) – 1.123 Log (CuHCl) + 0.978 Log(CuEDTA) + 3.29; B, Log(Cuamaranth) = −0.487 Log(CuEDTA) + 1.309 Log(CuHCl) – 0.496; C, Log(Cupakchoi) = 1.027 Log(CuEDTA) – 1.327; D, Log(Cugarland chrysanthemum) = 0.669 Log(CuHCl) + 0.124.
Sustainability 11 06215 g005
Table 1. Basic physicochemical properties of the soil.
Soil PropertyValue
Texturesilty clay
Sand (%)5.42
Silt (%)52.6
Clay (%)41.98
pH5.84
OM (w/w%)3.9
CEC (cmol·kg−1)133
Copper in soil (mg·kg−1)24.1
OM, organic matter; CEC, cation exchange capacity.
Table 2. Soil copper concentration during four trials.
Soil Copper Concentration Level (mg·kg−1) *
Number of Trials12345
117 ± 0.878 ± 0.6 272 ± 2.2340 ± 0.1479 ± 2.6
212 ± 0.381 ± 0.5294 ± 3.9352 ± 4.6518 ± 2.3
323 ± 0.780 ± 1.6251 ± 25.4296 ± 19.2409 ± 7.8
430 ± 0.586 ± 4.0296 ± 1.9367 ± 8.2484 ± 10.6
* copper concentration of the potted soil was defined into five grades, and the copper concentration of the soil was detected after each batch of trials harvested. Duration of the trials: 1, from February to March 2017; 2, from June to July 2017; 3, from September to October 2017; and 4, from February to March 2018. Each value represents the mean ± SD, n = 3.
Table 3. Multiple linear correlation models for predicting copper concentrations in vegetables.
Multiple Regression AnalysisR2adj.ap Value bR2cor.c
Log(Cuwater spinach) = 0.325 *** Log(Cuaqua regia) + 1.888 ***0.455<0.0010.3360
Log(Cuwater spinach) = 0.305 *** Log(CuNaNO3) – 1.123 *** Log (CuHCl) + 0.978 ** Log(CuEDTA) + 3.29 ***0.797<0.0010.8144
Log(Cuamaranth) = 0.972 *** Log(Cuaqua regia) – 1.605 ***0.881<0.0010.7474
Log(Cuamaranth) = 0.822 *** Log(CuHCl) – 0.512 *0.902<0.0010.7889
Log(Cuamaranth) = −0.487 Log(CuEDTA) + 1.309 *** Log(CuHCl) – 0.496 *0.905<0.0010.8135
Log(Cupakchoi) = 1.253 *** Log(Cuaqua regia) – 2.836 ***0.892<0.0010.6115
Log(Cupakchoi) = 1.027 *** Log(CuEDTA) – 1.327 ***0.895<0.0010.5747
Log(Cugarland chrysanthemum) = 0.77 *** Log(Cuaqua regia) – 0.6730.739<0.0010.6602
Log(Cugarland chrysanthemum) = 0.669 *** Log(CuHCl) + 0.1240.756<0.0010.7239
*, for p ≤ 0.05; **, for p ≤ 0.01; ***, and for p ≤ 0.001 for the coefficients or constants using a Pearson Correlation. a, Adjusted R square for the model. b, p value for the model. c, R square in the correlation analysis (Figure 5) for the linear regression between the expected and measured Cu concentration.

