Article

Elevated Risk of Ecological Land and Underlying Factors Associated with Rapid Urbanization and Overprotected Agriculture in Northeast China

1
Institute of Land Management, Northeastern University, 195 Chuangxin Road, Shenyang 110169, China
2
College of Earth Sciences, Jilin University, 2199 Jianshe Street, Changchun 130061, China
*
Author to whom correspondence should be addressed.
Sustainability 2019, 11(22), 6203; https://doi.org/10.3390/su11226203
Submission received: 23 September 2019 / Revised: 26 October 2019 / Accepted: 4 November 2019 / Published: 6 November 2019
(This article belongs to the Section Sustainability in Geographic Science)

Abstract

:
Ecological land with considerable ecological value can be regarded as an important indicator in guaranteeing ecosystem function and sustainable development. Generally, the urbanization process has been considered to be the primary factor affecting ecological land use. However, the influence of agricultural development, particularly in a typical farming area, has rarely been studied. In this paper, we present a method to assess the ecological risk of ecological land (ELER) in a black soil area in northeastern China. Furthermore, the underlying factors were detected using the geographically weighted regression model, which took into account conditions of natural elements, the urbanization process, and grain production conditions. The results indicate that ecological land experienced remarkable changes with an evident loss and decline from 1996–2015. The ELER progressively increased in the concentrated farming area and the western agro-pastoral ecotone, and the ecological land in the eastern forest area was always at a high risk level. According to the regression coefficients, the relationships between influence factors and ELER could be better explained by the variables of elevation, slope, proportion of rural residential area, and ratio of cultivated land area to residential area. To summarize, agricultural occupation and urban expansion were verified as the two main causes of ecological land loss, as well as elevated risks. In light of the current situation, measures such as policy adjustment and ecological restoration should be taken to avoid risk and optimize land use.

1. Introduction

Multiple impacts of anthropogenic activities and natural succession have triggered drastic land use and global environmental changes over the centuries, which inevitably gave rise to various conflicts between economic growth and sustainable development [1,2,3,4]. Ecological security has become an environmental issue in both developed and developing countries throughout the world [5,6]. Urban land expansion and industrialization have provided significant economic benefits during past decades, which has also led to considerable negative effects on biodiversity [7], air quality [1], water resources [8], and food security [9]. Generally, urbanization and its accompanying landscape pattern changes, physical and chemical pollution, and irresponsible resource utilization have been considered as the key factors leading to the increase of ecological risk [10,11,12]. Thus, it became increasingly important for researchers and policy makers to clarity the interactions between the ecosystem and social system in maintaining regional ecological security.
Previous studies have measured regional ecological security and detected its influencing factors in view of multi-scale and multi-source data [13,14,15]. Jackson et al. evaluated the ecological vulnerability caused by land use changes and economic development in the U.S. Mid-Atlantic region by overlaying the maps of land-use change projections and sensitive ecological resources [16]. Mattson and Angermeier took ecological integrity as the end point to evaluate the risk of human impacts to freshwater ecosystems, and the ecological risk index was proposed by integrating land use frequency and its potential impact on biotic drivers to identify risk regions at different levels [17]. Islam et al. analyzed the hazardous elements from different land-use urban soils in Bangladesh, and the results showed that metals were at high potential risk in that country, due to anthropogenic and geogenic factors [11]. Recent studies have suggested that good policies and reasonable structures of ecological land could considerably improve the environment [18,19]. Even so, the demand of economic growth has still taken precedence over ecological protection in many regions, and the lack of coordination between different management departments has also made ecological protection measures difficult to execute [20].
During the past few decades, rapid urbanization in China, and the accompanying population growth and urban expansion, has encroached upon large amounts of ecological space, and the natural landscape has been continuously pushed outward along the urban-rural gradient [21,22]. In addition, within agriculturally developed regions, especially in northeast China, ecological land resources, such as forests and grasslands, have been converted into cultivated land by deforestation and reclamation as a result of strict cultivated land protection strategies [23]. The requisition–compensation balance policy, which was meant to maintain the dynamic balance of the total amount of cultivated land by the supplementation of other land resources, has occupied a large amount of reserve areas, many of which had prominent ecological functions [24]. These exogenous factors have directly or indirectly affected land use structures and led to an increase in risks, not only in ecological land, but also in land used for cultivation and other purposes. Therefore, comprehending the dynamics of ecological land resources and their responses to external elements is supposed to be a prerequisite for regional land use planning and ecological management.
Ecological land, which refers to land use types with significant ecological value, plays an important role in providing ecosystem goods and services, regulating regional climate, and optimizing ecological patterns [25,26]. Even though the term “ecological land” has been used in China since 1999, there is still no unified definition or classification system of the concept [27]. The applications of ecological land in the fields of landscape ecology, land management, and other related domains have been studied, and some progress has been made [28,29]. Moreover, the introduction of ecological spatial entities, such as green infrastructure, greenways, and ecological networks, further enriched the formulation of ecological land [30,31,32]. Nevertheless, studies of ecological land have mostly focused on the definition, classification, and spatial distribution patterns, and the dynamic changes and underlying mechanisms need to be discussed further.
Landscape ecological risk is an effective indicator to measure the ecological land health by estimating the exogenous pressure on the environment at a landscape scale [13]. Traditional ecological risk assessments have mainly focused on the impact of physical and chemical pollutants on species and populations [33,34]. With the increasing complexity of external environmental factors and the multiple scales of evaluation, more environmental stresses were taken into account, such as urbanization, climate change, and land use change [35]. Studies have demonstrated that a decrease in landscape integrity and stability can lead to a high ecological risk in regional landscapes [14]. Calculating landscape ecological risk and putting forward reasonable risk avoidance measures has been a useful way to improve landscape quality [36]. Natural elements and socio-economic factors are generalized as the two major factors that affect the ecological risk of land use. Nevertheless, it appears that, in a typical farming area, resource distribution and production conditions for cultivated land should not be overlooked. Geographically, these variables are distributed in a continuous way over the study area, and show significant spatial non-stationarity [37]. Detecting the relationships between landscape ecological risk and associated factors will correspondingly contribute to ecological risk reduction. Regression analysis is often used to measure the correlation between variables and influencing factors. Globally, the regression-estimated parameter should not be a single value, but discrete values in the whole region, varying with geographic positions [38]. From this point of view, the ordinary linear regression models using average or global parameter estimations show no advantage. The geographically weighted regression (GWR) model has been demonstrated to be more appropriate for spatial data with non-stationarity, and is increasingly applied in studies of landscape ecology, land price, and environmental changes, so that the heterogeneity and non-stationarity of variables can be recognized [39,40,41,42].
The contradictions between economic development, food security, and ecological environment conservation in the process of rapid urbanization have become a primary issue in China. As a strategic commodity grain base, the black soil area in northeast China may be subject to the most restrictive cultivated land protection strategies; meanwhile, it is also facing severe challenges in land degradation, ecological land loss, and urban sprawl, as well as heavy metal pollution due to the heavy industrial development in the early days of the founding of new China [43]. Under this high pressure, we presume that in addition to economic development, excessive agricultural protection may also be an important inducement affecting the quantity and integrity of ecological land. In this paper, we took Changchun City as a case study; ecological land was extracted from the land use databases at three time nodes (1996, 2009, and 2015) to depict land use changes and conversions. Furthermore, the ecological risk and its driving factors were evaluated to examine how ecological land was affected by the dual pressures of rapid urbanization and agricultural protection. The present study aimed to further the understanding of the existing situation related to ecological land in order to alleviate the conflicts between human needs and nature conservation, and to seek a method for sustainable development in a black soil area.

2. Materials and Methods

2.1. The Study Area

Changchun City, which is the capital of Jilin Province, belongs to the black soil farming area in the hinterland of the Songliao Plain in northeastern China (Figure 1). The prefecture covers a total area of 20,595 km2, and encompasses two prefecture-level cities, seven districts, and two counties. The zonal soils are comprised of black soil and chernozem, and the elevation is 250–350 m, increasing from east to west. Climatically, Changchun City is subject to a temperate continental monsoon climate with distinct seasons, and the mean annual temperature is 4.8 °C. The dominant land use type is cultivated land, occupying over 70% of the total area. The fertile soil resources in Changchun City not only create favorable conditions for food production, but also provide significant ecosystem services, directly or indirectly. At the same time, a growth-oriented economic mode has led to a blooming expansion of the urban area, accompanied by more environmental conflicts. As a result, the ecological land in this region, as elsewhere in the world, is facing unsolved issues. How to regulate the contradictions between economic growth and the environmental conservation under increasingly strict cultivated land protection policies is the primary barrier to achieving sustainable development.

2.2. Ecological Land Definition and Land Classification

Confronted with the severe situation of resource constraints, environmental pollution and ecosystem degradation, “ecological civilization” was put forward as a concept for promoting natural conservation and sustainable development. Ecological civilization construction (ECC) was first proposed in the 17th Congress of the communist party of China in 2007, and upgraded as a national strategy in the 18th Congress of the party in 2012 [44]. As the basic carrier, ecological land plays an important role in maintaining regional ecological security and offering ecosystem services [18]. However, the definition of ecological land has still not been unified, and it seems that the current land classification system does not involve an “ecological land” type, despite its significance being widely acknowledged [29,45,46]. In 2017, the “Current Land Use Classification”, which was the predominant land use classification system for land use management and was issued by the Ministry of Land and Resources (renamed the Ministry of Natural Resources) of China, was officially revised, and wetland was proposed as a new land use type to emphasize the increasing importance of protecting ecological land [47]. However, other land use types with certain ecological value, such as forest land and grassland, were not redefined and reclassified, and the above changes did not play a substantive role in land management. In this study, we defined ecological land as a land use type that embodies considerable or potential ecological value in maintaining regional ecological security and offering ecosystem services. Thus, based on the current classification system and ecological attributes, land use types were reclassified into six categories: cultivated land (CL), forest land (FL), grassland (G), water (W), other ecological land (OEC), and urban and rural construction land (URCL). Among them, forest land, grassland, water, and other ecological land were incorporated into ecological land (Table 1).

2.3. Data Sources and Processing

Data in the study included (1) land use data, (2) social and economic data, and (3) spatial data, including digital elevation model (DEM) and normalized difference vegetation index (NDVI) data. Land use data were extracted from the national land survey databases in 1996, 2009, and 2015, which were established by the Ministry of Land and Resources of China. Social and economic data were collected from the Changchun Statistical Yearbook, China Statistical Yearbook (county level), and relevant statistical bulletins. DEM (digital elevation model) data were obtained from the Chinese Academy of Sciences (http://www.gscloud.cn), with a resolution of 30 m; the NDVI (normalized difference vegetation index) was obtained from the MODIS13Q1 product of the United States Geological Survey (USGS), with a resolution of 250 m (https://earthexplorer.usgs.gov). As the evaluation units were set for both landscape ecological risk assessment and driving factors analysis, it was necessary to consider the adaptability of cell size to landscape metrics and the dimension of influencing factors, as well as the local situation in the study area. It was generally believed that taking 2–5 times the average patch area size as the grid cell could better reflect the heterogeneity characteristics of landscape patterns. Besides, all data should be processed and expressed in appropriate units through resampling and spatialization. In conclusion, 5 km x 5 km was determined as the cell size in this study, in combination with the study range and literature review [48].

2.4. Methods

2.4.1. Modeling of Landscape Ecological Risk Assessment

Landscape ecological risk can be shown as the vulnerability of landscape function and structural changes to external influences [49,50,51]. Thus, this study built an evaluation model using the landscape fragmentation index and the vulnerability index to measure the stress on ecological land. The detailed methods are as follows.
(1) Fragmentation Index
The fragmentation index can effectively indicate the external disturbance on the landscape. Considering the current circumstances of the study area, four landscape metrics that delineated the characteristics of the landscape were selected to calculate the fragmentation index: patch density (PD), edge density (ED), landscape shape index (LSI), and aggregation index (AI). The specific implications are detailed in Table 2.
The abovementioned metrics comprehensively describe the landscape characteristics from the aspect of patch area (PD and ED), patch shape (LSI), and aggregation (AI). To calculate the fragmentation index, the relevant metrics were integrated as follows:
F = α P D + β E D + γ L S I + μ A I
where F is the fragmentation index, and α, β, γ, and μ are the weights of each metric, which were determined to be 0.14, 0.14, 0.46, and 0.26, respectively, using the analytic hierarchy process (AHP) method [52,53]. All the landscape metrics were processed using the normalization method to eliminate the effects of dimension.
(2) Vulnerability Index
Vulnerability (V) in this study referred to the ability of the landscape to resist external interference. Land use types endowed with multiple attributes showed differences in their ability to maintain landscape functions over long-term natural and cultural successions. For example, the landscape structure of ecological land, which mostly embodies natural attributes, is relatively unstable and easily disturbed by external factors, so its vulnerability is relatively high. However, construction land is mainly developed by human activities and has a relatively stable land structure, giving it a high resistance to external interference and a low vulnerability. Based on Yu’s study, we determined the vulnerability degree by combining the real situations in the study area as follows: other ecological land-6, water-5, cultivated land-4, grassland-3, forest land-2, and urban and rural construction land-1 [54]. A normalization analysis was used to eliminate the effect of dimension on the results. Ultimately, the vulnerability index was calculated as other ecological land-0.2857, water-0.2381, cultivated land-0.1905, grassland-0.1429, forest land-0.0952, and urban and rural construction land-0.0476.
(3) Landscape Ecological Risk Index
Synthesizing the fragmentation index and vulnerability index can comprehensively denote the risk characteristics of land use. Therefore, the landscape ecological risk index of ecological land (ELER) was constructed as follows [54]:
E L E R = 10 × F × V
where ELER is the landscape ecological risk of ecological land, F is the fragmentation index, and V is the vulnerability index. The higher the value, the higher the risk to which the landscape is exposed.

2.4.2. Analysis of Associated Driving Factors

(1) Geographically Weighted Regression Model
Geographically weighted regression (GWR) is a spatial data analysis method that embeds geospatial information into a regression model [37,38]. Specifically, the local estimation method adopted by the geographically weighted regression can avoid the impact of study scale and sampling precision, which are sensitive to linear regression methods. It has been widely proven to be advantageous over ordinary least square (OLS) regression models when estimating the spatial non-stationarity of geographical elements [10,39]. GWR can be seen as an extension of the general linear regression method, and the calculation equation is as follows:
y i = β 0 ( u i , v i ) + k = 1 p β k ( u i , v i ) x i k + ε i
where yi is the dependent variable that represents the landscape ecological risk index in grid i; (ui,vi) are the coordinates of sampling site i, represented by the geographical coordinates of the ith grid center point; βk (ui, vi) is the kth regression parameter of sampling site i; and εi is the random error of sampling site i. The values are normally distributed.
(2) Moran’s I Index
The precondition of applying GWR is that the dependent variables show significant autocorrelation in their spatial characteristics, so that the regression analysis results can be better explained. Moran’s I is a geospatial analysis indicator used to depict the spatial concentration characteristics of geographical elements over a total space [55]. In this study, the index was used to estimate the autocorrelation of ELER, and the calculation formula is as follows:
I = n i = 1 n j = 1 n W i j ( X i X ¯ ) ( X j X ¯ ) i = 1 n j = 1 n W i j i = 1 n ( X i X ¯ ) 2
where n is the total number of grid units; Xi and Xj are the variable values in grids i and j, respectively; X ¯ is the mean variable value in the grid unit; and Wij is the spatial weight matrix. The range of Moran’s I is between −1 and 1. The higher the value, the more relevant the dependent variable. If I > 0, the variables are positively correlated; if I < 0, the variables are negatively correlated; if I = 0, the variables are spatially unrelated or randomly distributed. Moran’s I was analyzed using the ELER results in 2015 as the dependent variable, and the spatial weight matrices were created by the k-nearest neighbors rule after careful consideration, and the number of neighbors was set as four. The index was calculated as 0.4965, indicating that the landscape ecological risk was highly correlated in study area.
(3) Explanatory Variables
Ten explanatory variables were selected to detect the relationships between landscape ecological risk and influencing factors, considering the local conditions and available data, which were elevation (X1), slope (X2), water resource (X3), vegetation coverage (X4), population density (X5), proportion of rural residential area (X6), density of road network (X7), per capita construction land area (X8), ratio of cultivated land area to residential area (X9), and per capita cultivated land area (X10) (Table 3). The variables consisted of three element layers, which were the basic natural elements layer, the urbanization layer, and the grain production conditions layer. Specifically, X9 and X10 were selected to constitute the grain production condition layer, in light of the importance of cultivated land resources in a typical black soil area, as well as to explore the impact of cultivated land distribution on landscape ecological risk. To reduce the outliers and eliminate zero values, all the variables were processed by z-score standardization. However, the multicollinearity among the variables could result in poor stability of the model and low accuracy of parameter estimation. Multicollinearity refers to the correlation between explanatory variables, and it may be caused by the close physical meaning of indicators or the finiteness of the sample data. Before establishing the model, linear regression analysis was applied to detect the multicollinearity. The results showed that all the VIF (variance inflation factor) values were no more than 10, and all explanatory variables passed the multicollinearity test.
In this study, the OLS regression analysis was first applied to find a properly specified OLS model, and then the same explanatory variables were used to run GWR. The results showed that the R2 adjusted of OLS was 0.2381, which was much lower than the 0.5338 of the GWR model. It could be concluded that the GWR model in this study had higher interpretation accuracy than the OLS model and was more suitable for regression analysis. The kernel function and bandwidth were the most important parameters in the model. The Gaussian function was selected as the kernel function, and the optimal bandwidth was determined using the Akaike Information Criterion (AIC), with the software as a reference. The results showed that most of the condition numbers were greater than 30, which indicated that there could be local multicollinearity among the explanatory variables, according to the interpretation of the geographically weighted regression results. Stepwise regression was a method to detect multicollinearity by introducing new variables step-by-step. Therefore, we used this method to conduct the second test on the variables. According to the output results, four variables, including water resource, population density, density of road network, and per capita cultivated land area, were excluded. The results indicated that the VIF value can usually explain the global multicollinearity of variables, but is lacking when explaining the possible local multicollinearity in a geographically weighted regression.

2.4.3. Hot Spot Analysis

Hot spot analysis is a spatial statistics method used to identify the locations of statistically significant hot and cold spots. A unit with high value that is surrounded by other high-value units is recognized as a hot spot, while a low-value unit that is surrounded by other low-value units is recognized as a cold spot. In this study, hot spot analysis was used to detect the spatial clusters of changes in ELER, and to reveal both the distribution of areas with drastic changes and those without obvious changes. Specifically, the Getis-Ord Gi* statistical analysis was performed, and a visualization map was created with confidence level bin (Gi_Bin) for the feature of ELER changes [56]. Based on the p-value and z-score of the results, it can be concluded that the higher the confidence level, the more statistically significant the spot.

3. Results and Analysis

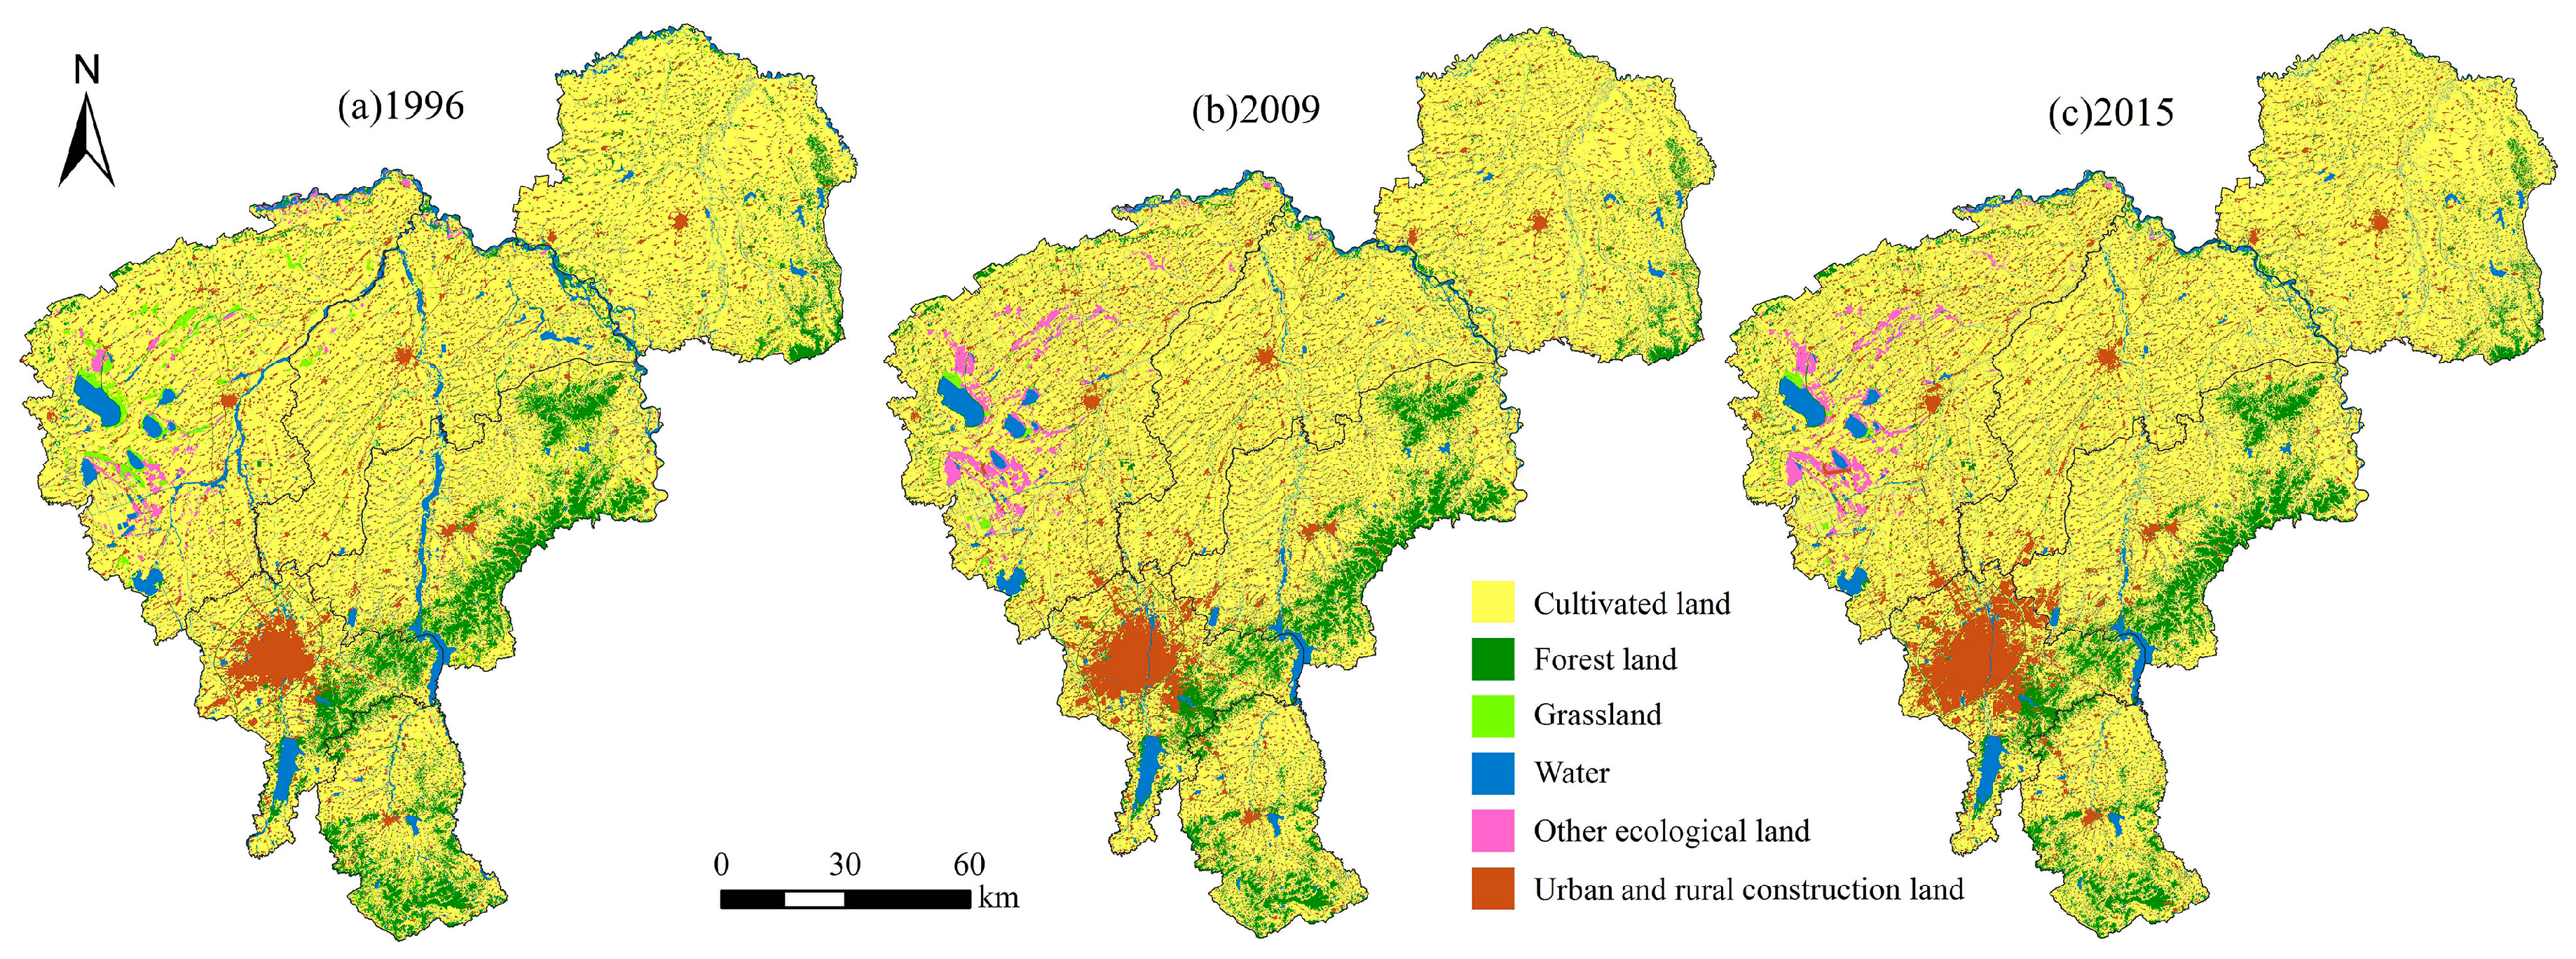
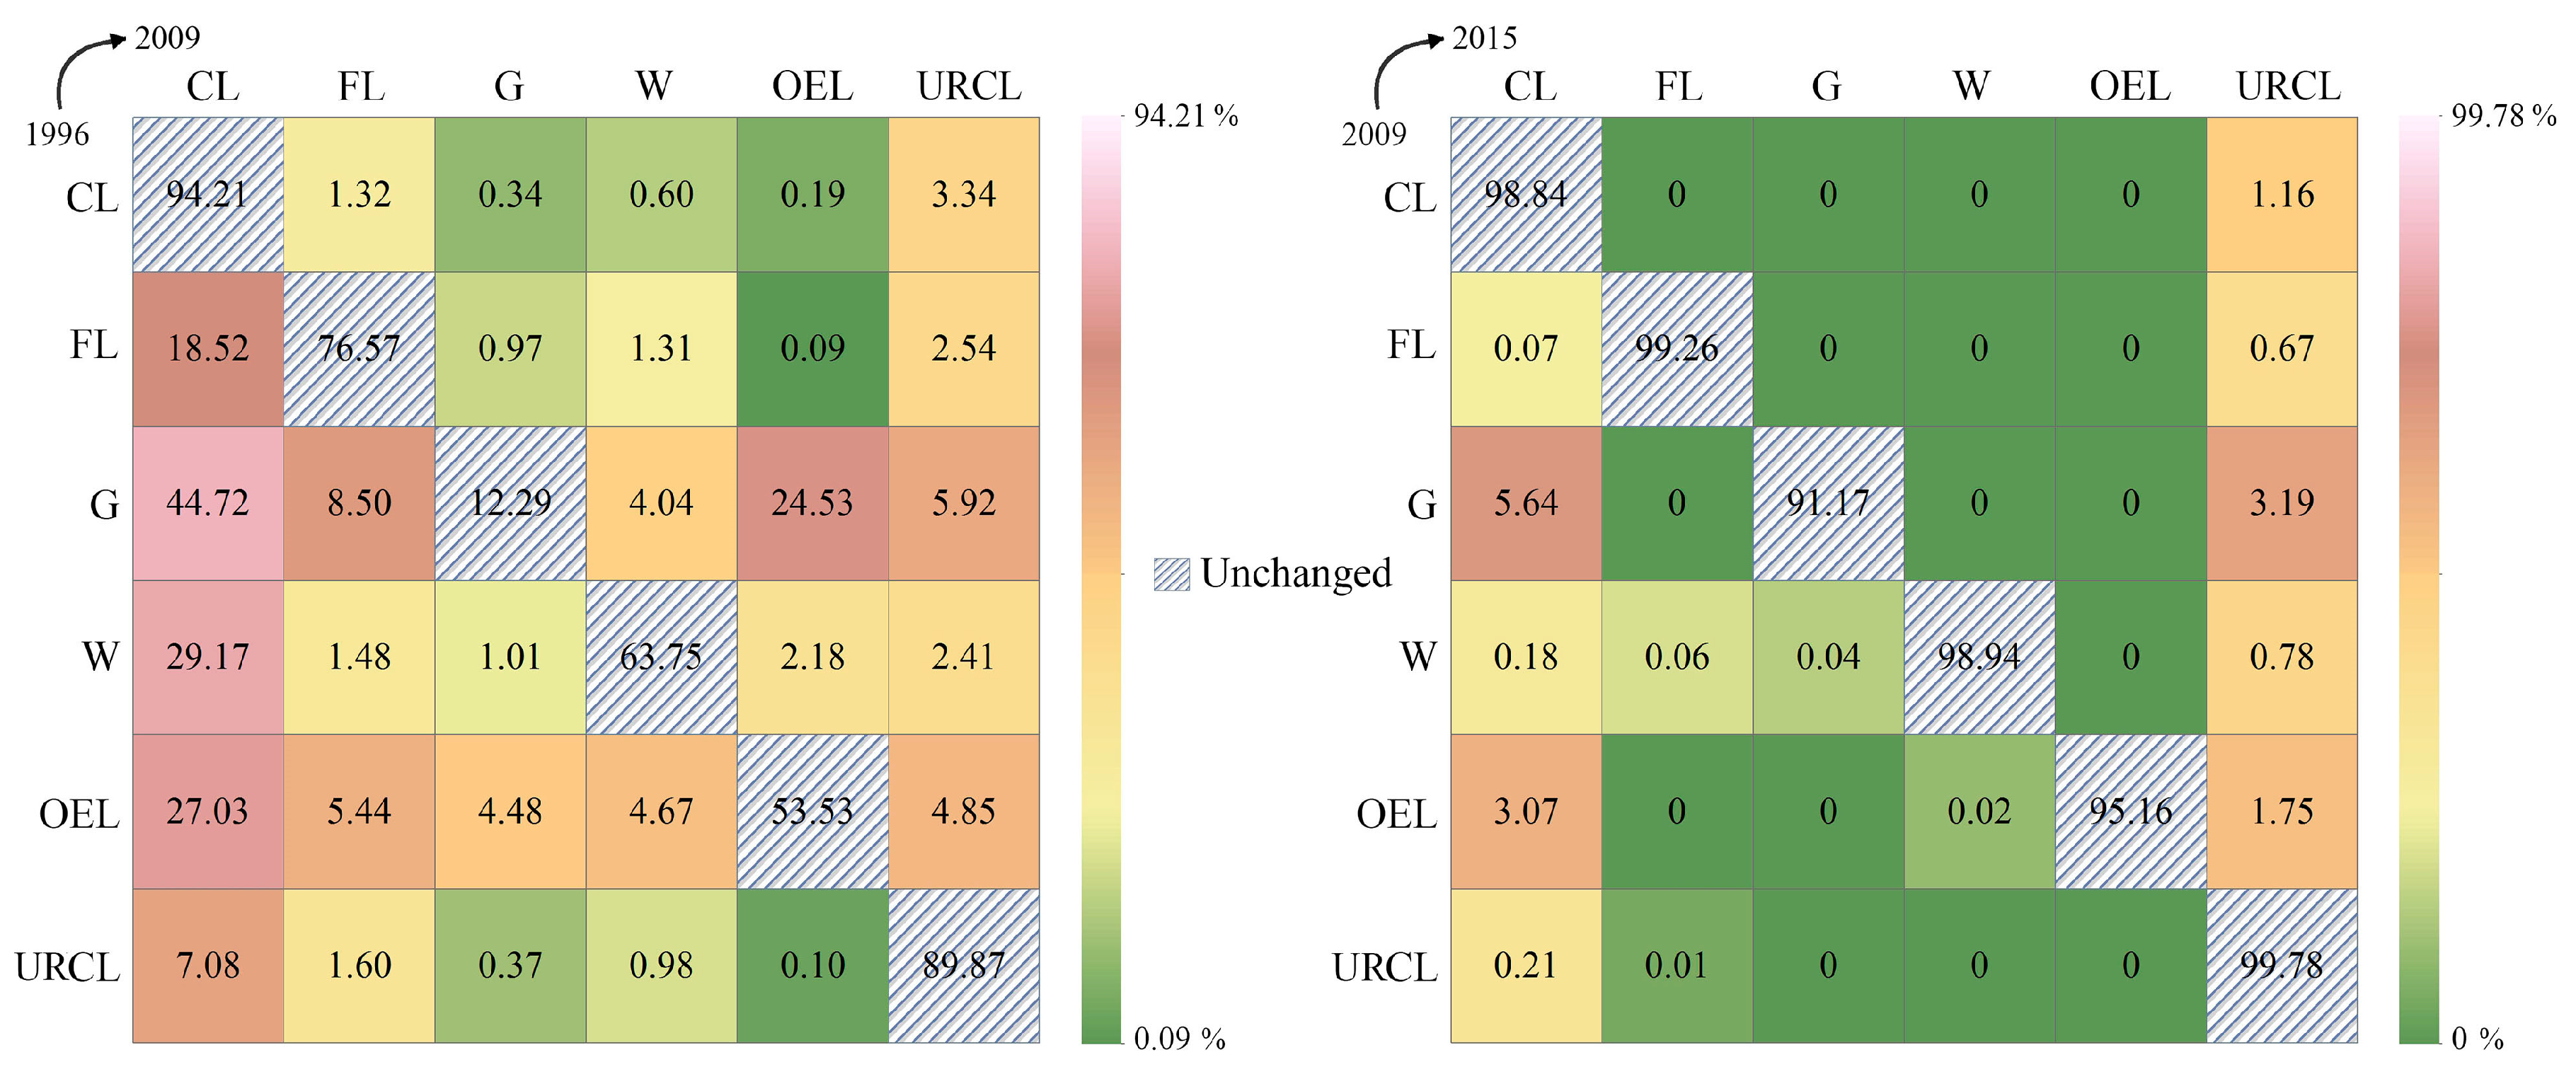
3.1. Variations in Ecological Land from 1996–2015

Land use patterns from 1996, 2009, and 2015 (Figure 2) showed that cultivated land was consistently the dominant land use type during the study period. Construction land that was concentrated in the main urban area and the administrative center of each junior district expressed an evident expanding tendency that echoed the rapid urbanization in recent years. As the ecological land type with the largest proportion, forest land spread out to the south and east of the study area and remained relatively stable. Grassland area, which was mostly distributed in the western region, was small, and experienced a remarkable decrease from 1996 to 2015. Correspondingly, other ecological land in the same region increased significantly and mostly converted to saline–alkali land and sandy land, which indicated serious land degradation and soil salinization. Water in the study area was basically composed of lakes, reservoirs, rivers, and tidal flats, and large amounts of other ecological land had been reclaimed for cultivation during the study period.
Land use transition probability matrices in Figure 3 show that cultivated land was relatively stable during the study period. However, given the large base, there was still a considerable loss (861.86 km2) from 1996–2009. Construction land and forest land were the predominant land use types to which cultivated land was converted. Meanwhile, large percentages of grassland, water, and other ecological land (44.72%, 29.17%, and 27.03%, respectively) had transformed to cultivated land on account of the strict farmland protection strategy and slack discipline on ecological protection. Grassland experienced the most dramatic changes during 1996–2009, and was mostly converted to cultivated land and other ecological land. As far as it is concerned, the extent of ecological land loss was obviously higher than that of cultivated land and construction land. The internal changes of ecological land were not significant, and the degradation of grassland to saline–alkali land (24.53% of total grassland area in 1996) held a significant proportion. Conversions from 2009 to 2015 were relatively slight, and mostly happened between cultivated land, construction land, grassland, and other ecological land. Overall, the succession of cultivated land loss and supplement, expansion of construction land, and encroachment on ecological land were the major transition types in the study area. Significantly, ecological land was converted more to cultivated land than to construction land, especially during the first study period. Large amounts of high-quality cultivated land in peri-urban areas were occupied for development activities accompanying the reclamation of ecological land, in order to keep certain area for cultivation. This process directly decreased the quality of cultivated land and led to poor ecological environment.

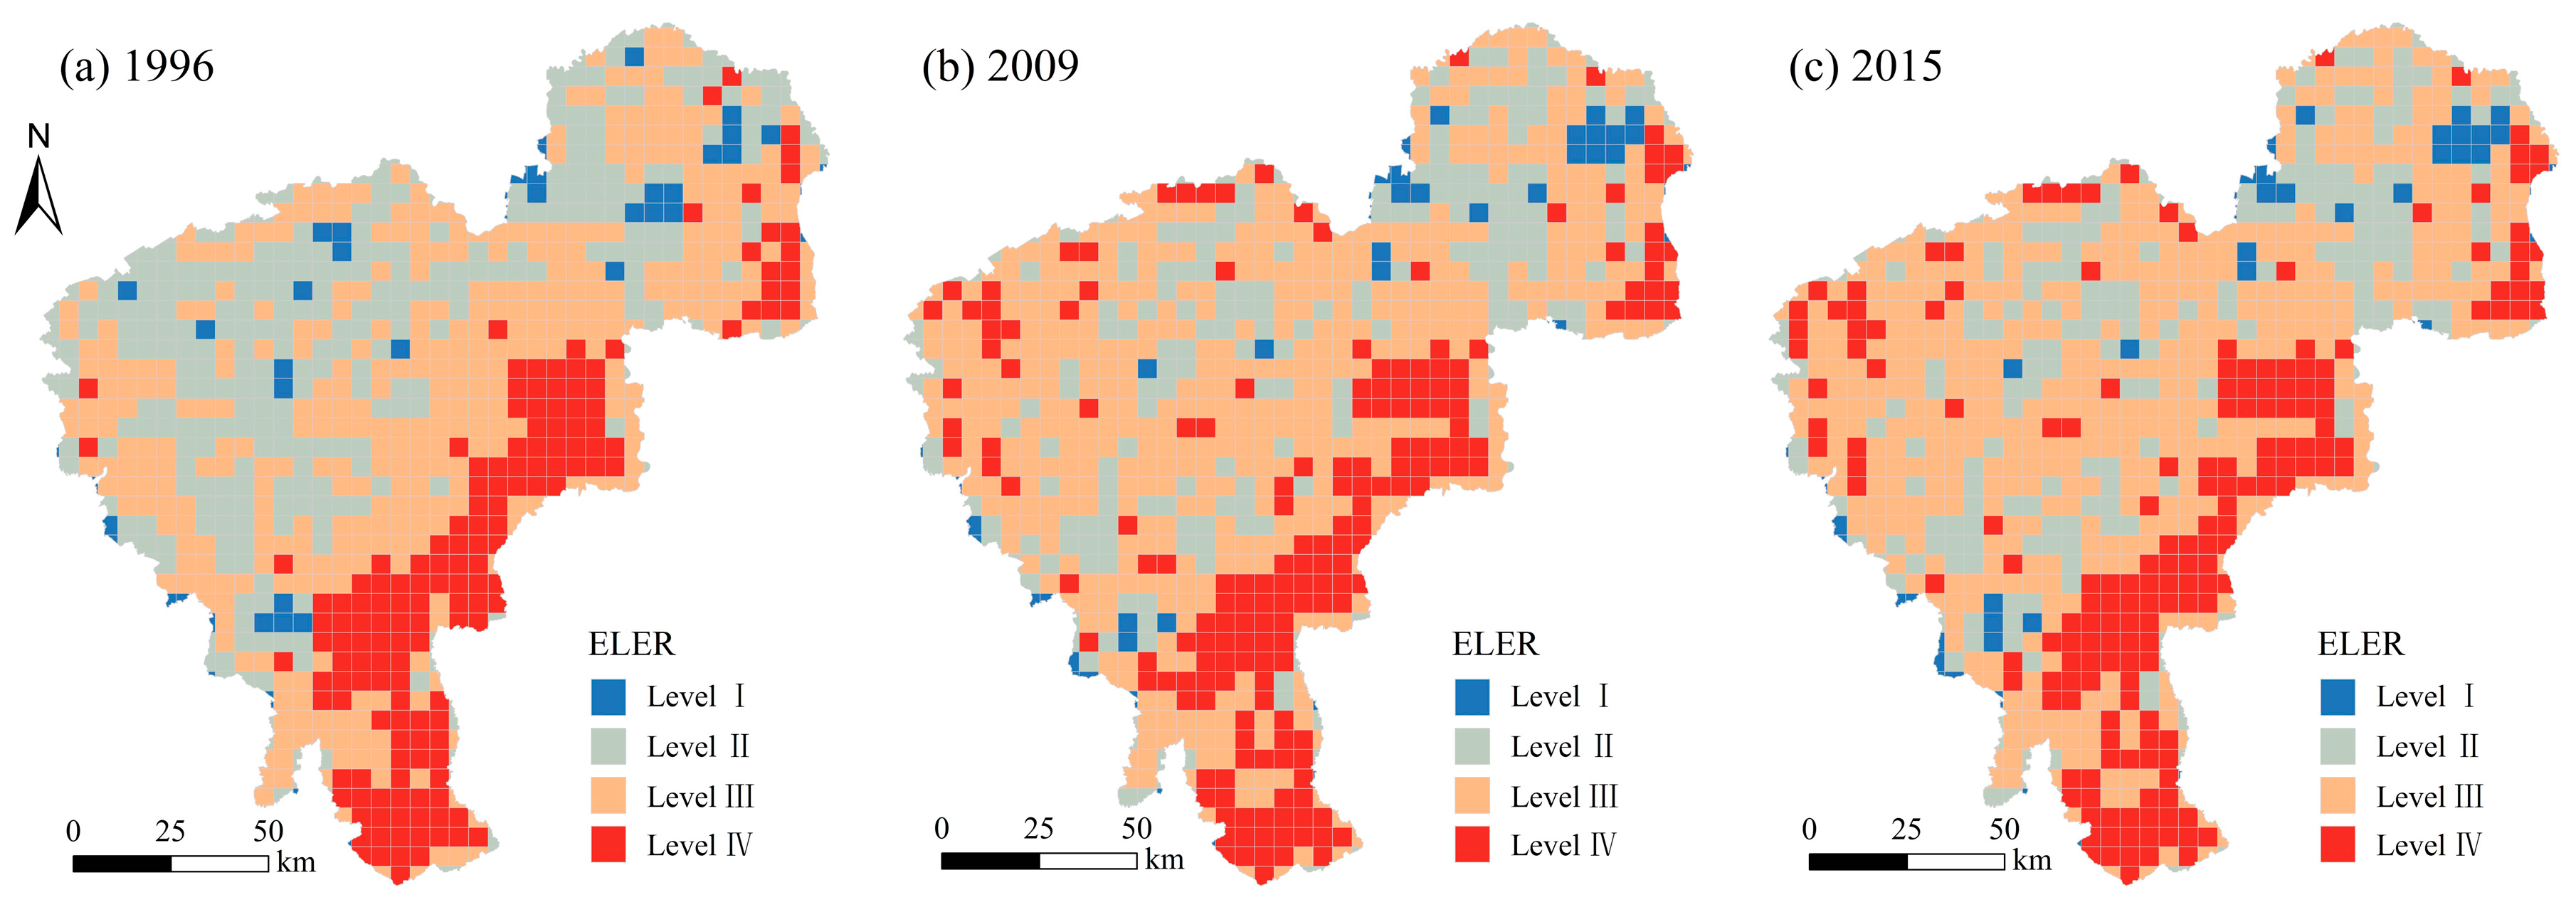
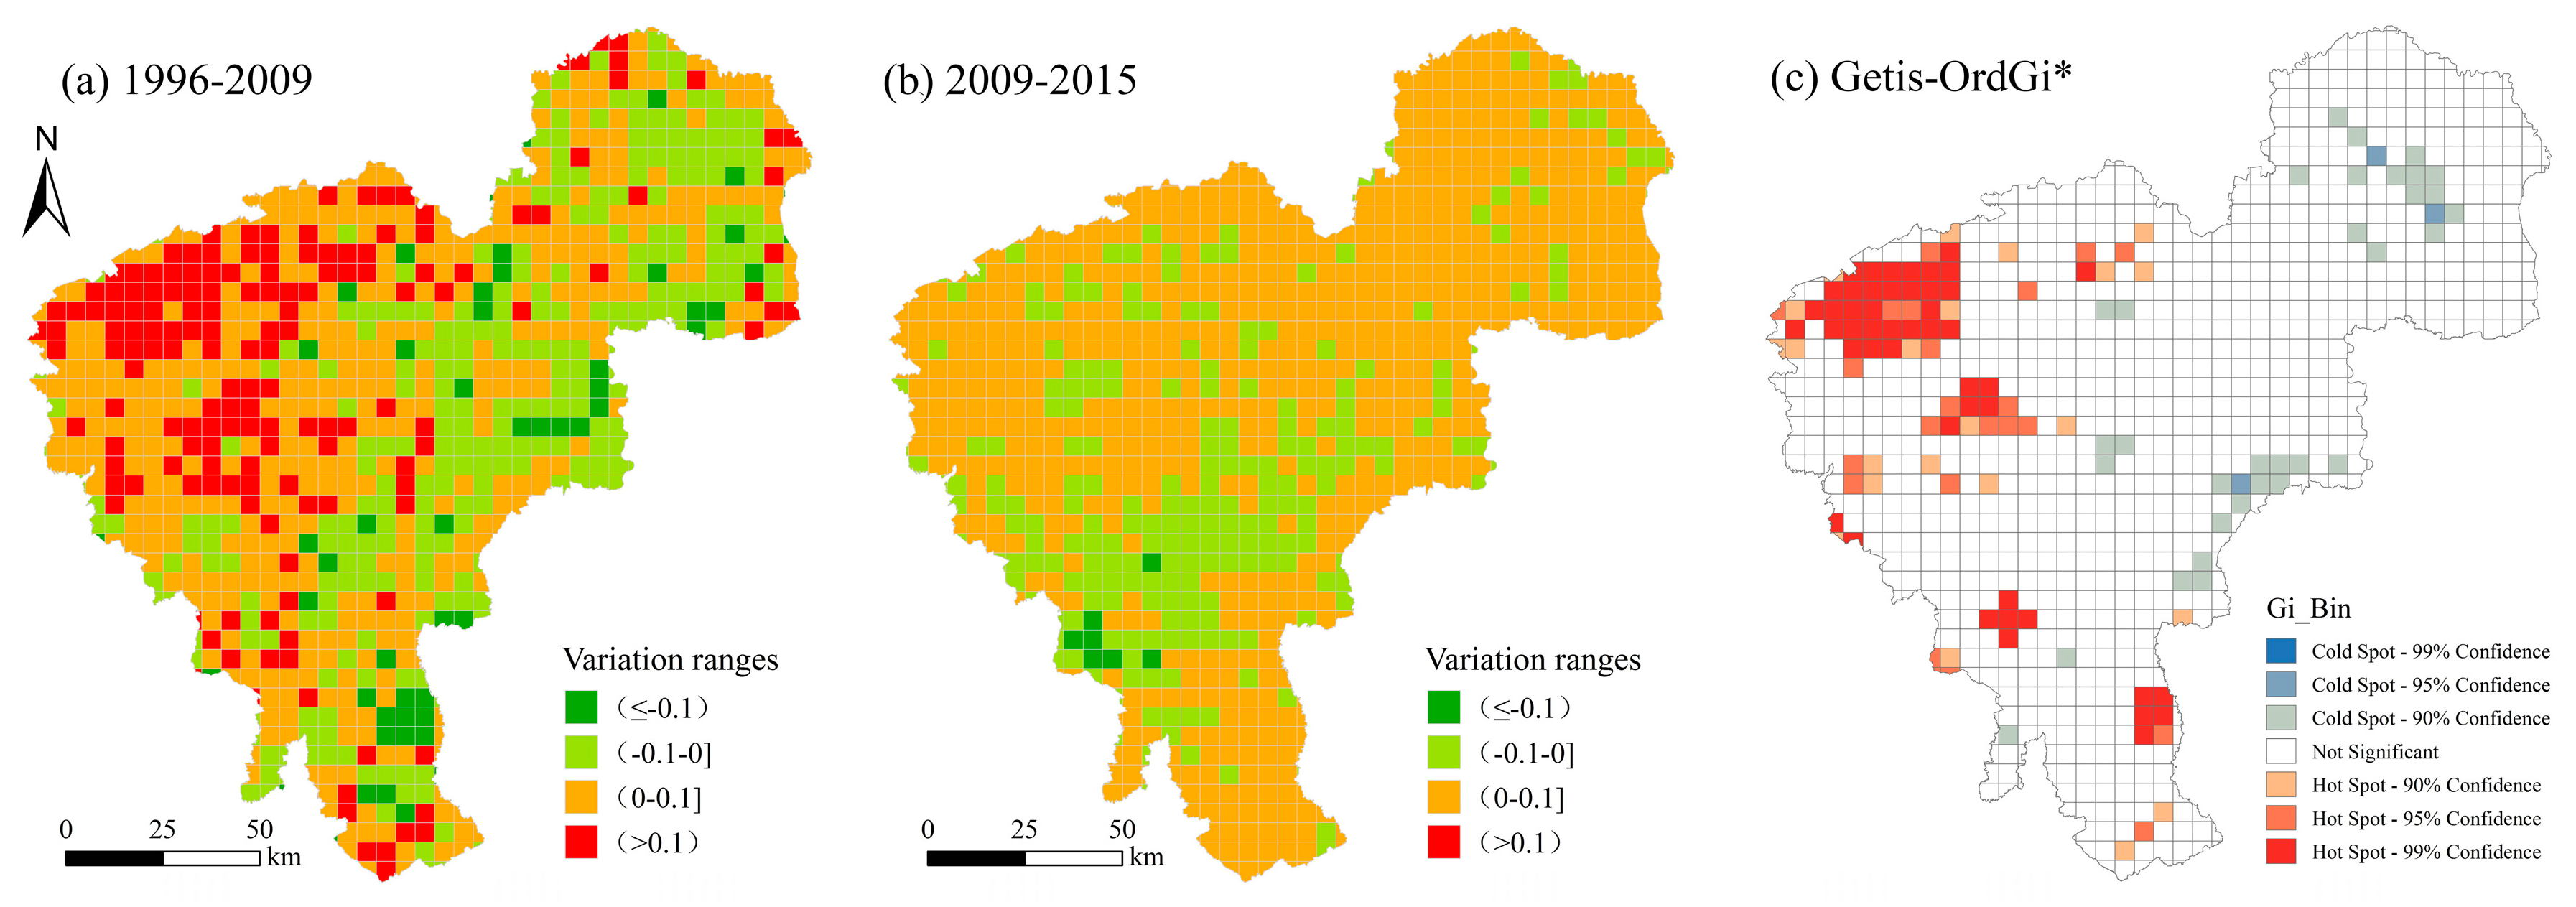
3.2. Landscape Ecological Risk Assessment Results of Ecological Land

Considering the value ranges and previous experience, we classified the results into the following four levels, using the equal interval method: level I (ELER ≤ 0.5), level II (0.5 < ELER ≤ 0.7), level III (0.7 < ELER ≤ 0.9), and level IV (ELER > 0.9). Regions in level I were at lower risk, and regions in level IV were at higher risk. The statistical results of the different levels are shown in Figure 4 and Table 4.
According to the topography and land use type, the study area can be divided into four typical types: the eastern part is the mountainous area, the middle and northern parts are the black soil farming areas, the western part is the agro-pastoral ecotone, and the southern part is the central urban area. Spatially, level I regions are randomly distributed across the study area, and level IV regions are mostly distributed in the eastern and southern parts of the study area, where they are broadly covered by forestland. Grids in level II and level III are spread over the central and northern parts of the study area, where cultivated land is the dominant land use category. As shown in Table 4, the ELER levels were mainly concentrated in level II and level III, accounting for approximately 75% of the total units in 2015. Level I accounted for approximately 5% and level IV accounted for approximately 20% of the total area. From 1996 to 2015, the units of level I were basically unchanged, and the proportion of level II units decreased significantly from 34.58% to 23.57%. The proportion of level III regions increased from 42.62% to 50.99%, and the proportion of level IV regions increased slightly, from 17.73% to 20.37%. Overall, the ELER showed a distinct increase during the study period, which was mainly dominated by the transformation from level II to level III.
From 1996–2009, the dramatic increase in ELER from level II to level III could have been caused by reclamation, soil salinization, and rapid urbanization under intense human interference and climatic changes (Figure 5a). The number of grids in level IV had decreased in the eastern forest area, which owed much to the “Grain for Green” project in China, as well as other beneficial practices, such as land consolidation and ecological restoration. During the shorter period of 2009–2015, the ELER in the urban construction region decreased to some extent, which demonstrated that appropriate urban planning could regulate land shape to be regular and stable; this played a positive role in the interaction between urban development and landscape ecological patterns (Figure 5b).
Hot spot analysis indicated that significant changes in ELER occurred in the western part of the study area, where soil salinization has been a notable problem since the 1990s (Figure 5c). In addition, hot spots also appeared sporadically in the urban construction areas and forest regions. The cold spots were relatively fewer in number, and were distributed in parts of the northeastern and eastern regions, which was in accordance with the stable area indicated by the ELER.

3.3. Results of the Geographically Weighted Regression

The regression coefficients of six explanatory variables all showed spatial directional heterogeneity, which further revealed the non-stationarity of the geographical elements (Table 5). Among them, the median regression coefficients of X2, X8, and X9 were all positive, indicating that the relationship between the explanatory variables and the ELER was positively correlated in more than half of the units. In these units, the landscape ecological risk would go up with the increased values of explanatory variables. The median regression coefficients of X1, X4, and X6 were negative, meaning that the ELER would go down with the increased values of the explanatory variables in more than half of the units. According to the statistical results, variables with a high explanatory ability for ELER included X1, X2, X6, and X9. In terms of the range of regression coefficients, the influencing factor with the largest magnitude was X6, and that with the smallest was X4.

3.4. Spatial Distribution of the Regression Coefficients of Explanatory Variables

3.4.1. Basic Natural Elements

The influence of elevation on ELER was negatively correlated in most areas, and three positive clusters of correlation coefficients were distributed in a northeast–southeast direction (Figure 6a). In that region, the forest-dominated land use structure was exposed to strong external disturbances, and the regression coefficient verified that with the increase in elevation, the landscape tended to be vulnerable and gradually fragile, in addition to exhibiting biodiversity loss and high-level ELER. A negative cluster was located in the southwest, where the urban sprawl area and the ecologically vulnerable region intersected, and where the ecological environment and construction activities were sensitive to elevation changes. Therefore, the ecological land in this region was seriously damaged and faced high landscape ecological risks.
The correlation relationship between slope and ELER was mostly positive throughout the area, and the positive cluster was distributed over the southeastern region (Figure 6b). The notable soil loss and erosion in this region was mainly affected by irresponsible land use and topographic conditions. The higher the slope, the greater the likelihood that soil erosion would occur, which would lead to higher ecological risk.
The correlation between vegetation coverage and ELER was relatively small, and the negative cluster of correlation coefficients was distributed in the cultivated land area across the midland and northeastern regions (Figure 6c). The correlation coefficients increased continuously to the periphery, with positive clusters on the northern and southern boundaries. In a typical farming area, the higher vegetation coverage indicated a wider distribution of crops and other vegetation, which had a positive effect on the improvement of the regional ecological environment and ecological security. Thus, a negative correlation between vegetation coverage and ELER was formed.

3.4.2. Urbanization Indicators

The proportion of residential areas could reflect the pressure of population and construction land in the ecological landscape. The results showed that the proportion of rural residential areas and the ELER were normally negatively correlated in a cultivated land concentration area (Figure 6d)—that is to say, the higher the proportion of residential areas, the lower the ELER degree represented. Rapid urbanization in China has been typically characterized by population growth and urban expansion, along with the improvement of agricultural production technology, especially in a typical farming area in northeast. Population growth in the study area has led to the increase of residential land. Due to the rural settlements possessing spatial aggregation features, rural residential areas tended to be aggregated and regular while expanding. In addition, relevant beneficial practices in China, such as prime farmland protection, land reclamation, and ecological restoration, have maintained the cultivated land quantity and improved the cultivated land quality effectively in recent years. The above factors could contribute to the agglomeration and regularization of populated and cultivated land, and promote regional landscape pattern optimization and landscape ecological risk reduction. The positive cluster of the rural residential area proportion was widely distributed in the southern and western regions, where construction land in the south and grassland in the west were the main types of land use. Intensive land use and complex land conversions have directly broken the balance of nature, and the influence was much higher on ecological land than on cultivated land, due to the strict cultivated land protection policies in China.
Negative correlation coefficients between per capita construction land area and ELER were more often found in the main urban area and the surrounding peri-urban areas (Figure 6e). Construction land was the most widespread land use category in urban areas, and ecological land was much smaller and more dispersed. In the process of economic development, small and fragmentary ecological land was usually encroached by construction land; however, this improved the integrity of the landscape structure and reduced the landscape ecological risk. The positive clusters were mainly in the forestland of the eastern region. Due to the strong interference of human activities in this region, the increase in construction land area per capita directly affected the quantity and landscape structure of ecological land involving forest land, and put landscape ecological security at a high risk level.

3.4.3. Grain Production Conditions

The ratio of cultivated land area to residential area is a specific metric representing the regional agricultural production level to a certain extent (Figure 6f). The regression coefficients of variables were positively correlated with the ELER in most regions. The negative clusters were distributed in the ecologically vulnerable region in the west and parts of the typical farming area in the midlands, and the regression coefficients increased gradually towards the southern and northern edges, until two high clusters were formed in the south and northeast. The negative clusters were located in the western and central regions of the study area, where the spatial expansion of cultivated land and rural residential areas may have occupied originally fragmented patches of ecological land, thus weakening the fragmentation degree of the ecological land and reducing the ecological risk. In conclusion, the security level of ecological land can be improved by adjusting the cropping structure and improving cultivated land utilization efficiency.

4. Discussion

Agriculture in northeast China plays a very important role in social development, which depends on vast cultivated land resources and fertile soil. The relatively small amounts of ecological land contribute much to maintaining regional ecological security. Over the past decades, land use patterns have experienced dramatic changes. Within this period, peri-urban areas and natural landscapes were pushed outward piece by piece. In addition, patches of ecological land were scattered and fragmented, which apparently gave no benefit to the protection of regional ecological security [23]. The changes clearly reflect typical land use issues during ecological civilization reform, and indicate the importance of ecological land structure and quantity optimization for natural resource protection. The expansion of impervious surfaces in urban areas is generally considered to be the leading factor for the decline of both quantity and quality of ecological land. However, strict cultivated land protection policies probably offer an alternative explanation for the changes. In conclusion, it is unworkable to consume ecological land in order to achieve the balance of development occupation and cultivated land compensation, while paying no attention to ecological supplementation and restoration.
Gradually, stakeholders and policy makers have noticed this problem and set up nature reserves to conserve natural landscapes and biodiversity. The government in China formulated the “Grain for Green” policy in 1999 and achieved noticeable effects, especially in the agro-pastoral and agro-forestry ecotones [57,58]. The results have corresponded with the decrease in ELER to the east of the study area. In addition, the development of multi-functional, peri-urban agriculture was conducive to providing ecosystem services and building ecological corridors between urban and rural areas, which relieved the pressure on regional ecological land use. Moreover, the characteristics of a single land use category were not only decided by the external anthropogenic factors or environmental conditions, but also changed with the surrounding land use types, on account of the limited land surface. Therefore, rehabilitation measures on ecological land and regional land optimization could be useful to comprehensively improve the security level in the black soil area.
The non-stationarity of geographic elements has been verified through many empirical studies [59,60]. For regression analysis, the global estimate and average estimate in ordinary linear regression models could ignore the non-stationarity; however, the GWR model embeds spatial information into the regression model to detect the spatial differentiation of correlation among variables, and further provides references for policy making. Natural elements data and socio-economic data of the explanatory variables normally could not be expressed in a unified unit, considering the diversity in size and type. In this study, spatial analysis was used to achieve the unified expression of multiple factors in a geographical space.
The dramatic land changes in this region, such as land development, cultivated land reclamation, and grassland degradation, all influenced the ecological risk to varying degrees. As the most important land use type in a black soil area, cultivated land has been proven to be crucial, not only to the landscape ecological risk of ecological land, but also to the corresponding ecological security of cultivated land. Therefore, the introduction of cultivated land resources conditions, to a certain extent, is highly conducive to achieving synergy between ecological land and cultivated land in promoting ecological security. Natural elements, urbanization indicators, and grain production conditions in this study all played important roles in affecting the regional landscape ecological security through complex mechanisms. The impact of basic natural elements on ecological risk showed significant spatial heterogeneity. High intensity land use within the region can reduce landscape integrity and risk tolerance, thus leading to increased sensitivity to changes in natural factors. Grain production conditions were considerable factors affecting the ELER, and the quantity and structural changes in cultivated land in a farmland-dominated area were distinctly able to disrupt the landscape structure of ecological land. Overall, the regression results could be better explained when considering landscape structure changes caused by other land use types. However, thus far, a complete evaluation system for landscape ecological risk has not been established, and the selection of indicators and data spatialization methods needs to be discussed further.
Advice to reduce the landscape ecological risk of ecological land in a typical black soil area could be suggested according to the distribution of ELER and its associated driving factors. In detail, it is important to strengthen the landscape integrity in the eastern forest areas, especially in the high-slope and high-altitude areas, by reducing sporadic and fragmented utilization of land patches. Additionally, optimizing the distribution of rural residential areas could be an effective method to improve cultivated land utilization and quality. We also suggest developing ecological land by building shelter forest belts, reclaiming abandoned land, and implementing other measures to promote regional ecological security. Soil remediation should be carried out in desertification and salinization areas. Wetland parks or natural reserves could be built on ecological land types with high ecological values and low utility values, so as to renovate the overall ecological space of the region. Rational planning for urban green landscapes, such as parks and green belts, should be established to improve the layout of ecological land. The strategy of ecological red lines needs to be further improved, in order to better integrate it with land use planning and to strictly control the boundaries of urban development. Natural barriers, including reservoirs and rivers, could be helpful for preventing urban sprawl, and could also constitute ecological corridors to connect different regions, as well as guaranteeing the movement of materials and the flow of energy across ecosystems over the urban-rural gradient.

5. Conclusions

Ecological land health and security are crucial premises for ecological civilization construction and sustainable development. Assessing ecological land risks and comprehending the underlying inducement thereof can be of great significance to land use optimization and natural resource conservation. The rapid urbanization and strict agricultural protection policies in China are the two primary elements that change ecological land structure and raise ecological risks, especially in an agriculturally strategic region, such as this one in northeastern China. Therefore, this paper proposes a method for evaluating the variations in landscape ecological risks of ecological land, as well as evaluating the possible impacting factors by quantitatively analyzing the basic natural elements, urbanization indicators, and grain production conditions.
The results indicate that the landscape ecological risk of ecological land has experienced remarkable changes over the past decades in northeast China, due to intense human interference and natural succession. Rapid urbanization and land use changes have significantly affected the global environment and generated ecological risks, which is in good agreement with empirical studies in other regions [11,16]. There was an evident loss of ecological land with considerable ecological value, while the process of land degradation and soil salinization led to an increase of other ecological land. Forest areas maintained a high risk level during the study period, and the concentrated farming areas showed a drastic tendency to increase. By the end of the study period, the implementation of declared policies, such as “Grain for Green” and land consolidation, alleviated the severe situation of ecological land. Cultivated land reclamation and urban expansion are two dominant ways in which ecological land resources were lost in this study. It is interesting to note that ecological land loss may further lead to the decline of cultivated land quality. This consumption of ecological land is undoubtedly not conducive to sustainable development; furthermore, the existing preferential policies might create additional obstacles for ecological resource protection.

Author Contributions

Conceptualization, S.L., D.W. and G.L.; data curation, D.W. and H.L.; formal analysis, S.L. and W.L.; investigation, H.L.; methodology, S.L.; resources, D.W.; software, W.L.; supervision, G.L.; writing —original draft, S.L.; writing—review and editing, S.L. and G.L.

Funding

This research was funded by the Fundamental Research Funds for the Central University (grant number N181403004), the Philosophy and Social Science Project of Shenyang, China (grant number 18052Q), and the National Natural Science Foundation of China (grant number 41671520).

Conflicts of Interest

The authors declare no conflict of interest.

References

  1. Foley, J.A.; DeFries, R.; Asner, G.P.; Barford, C.; Bonan, G.; Carpenter, S.R.; Chapin, F.S.; Coe, M.T.; Daily, G.C.; Gibbs, H.K.; et al. Global consequences of land use. Science 2005, 309, 570–574. [Google Scholar] [CrossRef] [PubMed]
  2. He, C.Y.; Liu, Z.F.; Tian, J.; Ma, Q. Urban expansion dynamics and natural habitat loss in China: A multiscale landscape perspective. Glob. Chang. Biol. 2014, 20, 2886–2902. [Google Scholar] [CrossRef] [PubMed]
  3. García-Nieto, A.P.; Geijzendorffer, I.R.; Baró, F.; Roche, P.K.; Bondeau, A.; Cramera, W. Impacts of urbanization around Mediterranean cities: Changes in ecosystem service supply. Ecol. Indic. 2018, 91, 589–606. [Google Scholar] [CrossRef] [Green Version]
  4. Lambin, E.F.; Meyfroidt, P. Global land use change, economic globalization, and the looming land scarcity. Proc. Natl. Acad. Sci. USA 2011, 108, 3465–3472. [Google Scholar] [CrossRef] [PubMed] [Green Version]
  5. Pirages, D. Ecological Security: Micro-Threats to Human Well-Being; Palgrave Macmillan: London, UK, 1999. [Google Scholar]
  6. Jogo, W.; Hassan, R. Balancing the use of wetlands for economic well-being and ecological security: The case of the limpopo wetland in Southern Africa. Ecol. Econ. 2010, 69, 1569–1579. [Google Scholar] [CrossRef]
  7. Reidsma, P.; Tekelenburg, T.; Berg, M.V.D.; Alkemade, R. Impacts of land-use change on biodiversity: An assessment of agricultural biodiversity in the European Union. Agric. Ecosyst. Environ. 2006, 114, 86–102. [Google Scholar] [CrossRef]
  8. Sakai, R.K.; Fitzjarrald, D.R.; Moraes, O.L.L.; Staebler, R.M.; Acevedo, O.; Czikowsky, M.J.; Silva, R.D.; Brait, E.; Miranda, V. Land-use change effects on local energy, water, and carbon balances in an Amazonian agricultural field. Glob. Chang. Biol. 2010, 10, 895–907. [Google Scholar] [CrossRef]
  9. Moore, N.; Alagarswamy, G.; Pijanowski, B.; Thornton, P.; Lofgren, B.; Olson, J.; Jeffrey Andresen, J.; Yanda, P.; Qi, J.G. East African food security as influenced by future climate change and land use change at local to regional scales. Clim. Chang. 2012, 110, 823–844. [Google Scholar] [CrossRef]
  10. Ren, G.P.; Liu, L.M.; Zhuo, D. Analysis of spatial differentiation of landscape ecological quality and its affecting factors in metropolitan suburbs. Trans. Chin. Soc. Agric. Eng. 2016, 32, 252–263. (In Chinese) [Google Scholar]
  11. Islam, M.S.; Ahmed, M.K.; Habibullah-Al-Mamun, M.; Masunaga, S. Potential ecological risk of hazardous elements in different land-use urban soils of Bangladesh. Sci. Total Environ. 2014, 512, 94–102. [Google Scholar] [CrossRef]
  12. Hobday, A.J.; Smith, A.D.M.; Stobutzki, I.C.; Bulman, C.; Daley, R.; Dambacher, J.M.; Deng, R.A.; Dowdney, J.; Fuller, M.; Furlani, D.; et al. Ecological risk assessment for the effects of fishing. Fish. Res. 2011, 108, 372–384. [Google Scholar] [CrossRef]
  13. Graham, R.L.; Hunsaker, C.T.; O’Neill, R.V.; Jackson, B.L. Ecological risk assessment at the regional scale. Ecol. Appl. 1991, 1, 196–206. [Google Scholar] [CrossRef] [PubMed]
  14. Cui, L.; Zhao, Y.H.; Liu, J.C.; Han, L.; Ao, Y.; Yin, S. Landscape ecological risk assessment in Qinling Mountain. Geol. J. 2018, 53, 342–351. [Google Scholar] [CrossRef]
  15. Abdullah, A.Y.M.; Masrur, A.; Adnan, M.S.G.; Baky, M.A.A.; Hassan, Q.K.; Dewan, A. Spatio-Temporal Patterns of Land Use/Land Cover Change in the Heterogeneous Coastal Region of Bangladesh between 1990 and 2017. Remote Sens. 2019, 11, 790. [Google Scholar] [CrossRef]
  16. Jackson, L.E.; Bird, S.L.; Matheny, R.W.; O’Neill, R.V.; White, D.; Boesch, K.C.; Koviach, J.L. A Regional Approach to Projecting Land-Use Change and Resulting Ecological Vulnerability. Environ. Monit. Assess. 2004, 94, 231–248. [Google Scholar] [CrossRef]
  17. Mattson, K.M.; Angermeier, P.L. Integrating Human Impacts and Ecological Integrity into a Risk-Based Protocol for Conservation Planning. Environ. Manag. 2007, 39, 125–138. [Google Scholar] [CrossRef]
  18. Jiang, B.; Bai, Y.; Wong, C.P.; Xu, X.B.; Alatalo, J.M. China’s ecological civilization program-Implementing ecological redline policy. Land Use Policy 2019, 81, 111–114. [Google Scholar] [CrossRef]
  19. Hu, M.M.; Xia, B.C. A significant increase in the normalized difference vegetation index (NDVI) during the rapid economic development in the Pearl River Delta of China. Land Degrad. Dev. 2018, 30, 359–370. [Google Scholar]
  20. Yan, J.M.; Chen, H.; Xia, F.Z. Cognition, direction and path of future spatial planning based on the background of multiple planning integration. China Land Sci. 2017, 31, 21–27. (In Chinese) [Google Scholar]
  21. Forman, R.T.T. The urban region: Natural systems in our place, our nourishment, our home range, our future. Landsc. Ecol. 2008, 23, 251–253. [Google Scholar] [CrossRef]
  22. Fu, B.J.; Zhang, L.W. Land-use change and ecosystem services: Concepts, methods and progress. Prog. Geogr. 2014, 33, 441–446. [Google Scholar]
  23. Liu, S.H.; Wang, D.Y.; Li, H.; Li, W.B.; Wang, Q. Ecological land fragmentation evaluation and dynamic change of a typical black soil farming area in northeast China. Sustainability 2017, 9, 300. [Google Scholar] [CrossRef]
  24. Liu, T.; Liu, H.; Qi, Y.J. Construction land expansion and cultivated land protection in urbanizing China: Insights from national land surveys, 1996–2006. Habitat Int. 2015, 46, 13–22. [Google Scholar] [CrossRef]
  25. Pino, J.; Marull, J. Ecological networks: Are they enough for connectivity conservation? A case study in the Barcelona Metropolitan Region (NE Spain). Land Use Policy 2012, 29, 684–690. [Google Scholar] [CrossRef]
  26. Deng, H.B.; Chen, C.D.; Liu, X.; Wu, G. Conception and function classification of regional ecological land. Acta Ecol. Sin. 2009, 29, 1519–1524. (In Chinese) [Google Scholar]
  27. Dong, Y.W.; Zhou, W.; Zhou, L.; Zhou, H. Study on ecological protection in urbanization areas–Case study of Nanjing city, Jiangsu Province. Mod. Urban Res. 1999, 2, 6–8. [Google Scholar]
  28. Meng, J.J.; Wang, X.D.; You, N.S.; Zhu, L.K. Dynamic changes of landscape connectivity for ecological lands and distance thresholds in the middle reaches of the Heihe River, Northwest China. J. Appl. Ecol. 2016, 27, 1715–1726. (In Chinese) [Google Scholar] [CrossRef]
  29. Guo, X.D.; Chang, Q.; Liu, X.; Bao, H.M.; Zhang, Y.P.; Tu, X.Y.; Zhu, C.X.; Lv, C.Y.; Zhang, Y.Y. Multi-dimensional eco-land classification and management for implementing the ecological redline policy in China. Land Use Policy 2018, 74, 15–31. [Google Scholar] [CrossRef]
  30. Norton, B.A.; Coutts, A.M.; Livesley, S.J.; Harris, R.J.; Hunter, A.M.; Williams, N.S.G. Planning for cooler cities: A framework to prioritise green infrastructure to mitigate high temperatures in urban landscapes. Landsc. Urban Plan. 2015, 134, 127–138. [Google Scholar] [CrossRef]
  31. Keith, S.J.; Larson, L.R.; Shafer, C.S.; Hallo, J.C.; Fernandez, M. Greenway use and preferences in diverse urban communities: Implications for trail design and management. Landsc. Urban Plan. 2018, 172, 47–59. [Google Scholar] [CrossRef]
  32. Jongman, R.H.G.; Bouwma, I.M.; Griffioen, A.; Jones-Walters, L.; Doorn, A.M.V. The Pan European Ecological Network: PEEN. Landsc. Ecol. 2011, 26, 311–326. [Google Scholar] [CrossRef]
  33. Brown, S.S.; Reinert, K.H. A conceptual framework for ecological risk assessment. Environ. Toxicol. Chem. 1992, 11, 143–144. [Google Scholar] [CrossRef]
  34. Fernandes, H.M. Heavy metal distribution in sediments and ecological risk assessment: The role of diagenetic processes in reducing metal toxicity in bottom sediments. Environ. Pollut. 1997, 97, 317–325. [Google Scholar] [CrossRef]
  35. Liu, Y.X.; Peng, J.; Zhang, T.; Zhao, M.Y. Assessing landscape eco-risk associated with hilly construction land exploitation in the southwest of China: Trade-off and adaptation. Ecol. Indic. 2016, 62, 289–297. [Google Scholar] [CrossRef]
  36. Peng, J.; Dang, W.X.; Liu, Y.X.; Zong, M.L.; Hu, X.X. Review on landscape ecological risk assessment. Acta Geogr. Sin. 2015, 70, 664–677. (In Chinese) [Google Scholar]
  37. Brunsdon, C.; Fotheringham, A.S.; Charlton, M.E. Geographically weighted regression: A method for exploring spatial nonstationarity. Geogr. Anal. 2010, 28, 281–298. [Google Scholar] [CrossRef]
  38. Fotheringham, A.S.; Brunsdon, C.; Charlton, M.E. Geographically Weighted Regression: The Analysis of Spatially Varying Relationships; John Wiley & Sons: Hoboken, NJ, USA, 2002. [Google Scholar]
  39. Freitas, M.W.D.D.; Santos, J.R.D.; Alves, D.S. Land-use and land-cover change processes in the Upper Uruguay Basin: Linking environmental and socioeconomic variables. Landsc. Ecol. 2013, 28, 311–327. [Google Scholar] [CrossRef]
  40. Buyantuyev, A.; Wu, J.G. Urban heat islands and landscape heterogeneity: Linking spatiotemporal variations in surface temperatures to land-cover and socioeconomic patterns. Landsc. Ecol. 2010, 25, 17–33. [Google Scholar] [CrossRef]
  41. Tu, J.; Xia, Z.G. Examining spatially varying relationships between land use and water quality using geographically weighted regression I: Model design and evaluation. Sci. Total Environ. 2008, 407, 358–378. [Google Scholar] [CrossRef]
  42. Sui, X.Y.; Wu, W.; Zhou, S.L.; Wang, J.; Li, Z. Drive pattern on the spatial heterogeneity of residential land price in urban district: A comparison of spatial expansion method and GWR model. Sci. Geogr. Sin. 2015, 35, 683–689. (In Chinese) [Google Scholar]
  43. Li, W.B.; Wang, D.Y.; Liu, S.H.; Zhu, Y.L. Measuring urbanization-occupation and internal conversion of peri-urban cultivated land to determine changes in the peri-urban agriculture of the black soil region. Ecol. Indic. 2019, 102, 328–337. [Google Scholar] [CrossRef]
  44. Zhang, X.; Wang, Y.; Qi, Y.; Wu, J.; Liao, W.J.; Shui, W.; Zhang, Y.Z.; Deng, S.H.; Peng, H.; Yu, X.Y.; et al. Evaluating the trends of China’s ecological civilization construction using a novel indicator system. J. Clean. Prod. 2016, 133, 910–923. [Google Scholar] [CrossRef]
  45. Chen, J.; Shi, P.J. Discussion on functional land use classification system. J. Beijing Norm. Univ. (Nat. Sci.) 2005, 41, 536–540. (In Chinese) [Google Scholar]
  46. Current Land Use Classification (GB/T21010-2007); Standardization Administration of the People’s Republic of China (SAC): Beijing, China, 2007. (In Chinese)
  47. Current Land Use Classification (GB/T21010-2017); Standardization Administration of the People’s Republic of China (SAC): Beijing, China, 2017. (In Chinese)
  48. Zhou, H.; Lei, G.P.; Yang, X.X. Land Use Change Pattern and Its Spatial Differentiation in Typical Basin of Sanjiang Plain. Trans. Chin. Soc. Agric. Mach. 2017, 48, 142–151. (In Chinese) [Google Scholar]
  49. Pei, H.; Wei, Y.; Wang, X.; Qin, Z.; Hou, C. Method of cultivated land landscape ecological security evaluation and its application. Trans. Chin. Soc. Agric. Eng. 2014, 30, 212–219. (In Chinese) [Google Scholar]
  50. Inkoom, J.N.; Frank, S.; Greve, K.; Walz, U.; Fürst, C. Suitability of different landscape metrics for the assessments of patchy landscapes in West Africa. Ecol. Indic. 2018, 85, 117–127. [Google Scholar] [CrossRef]
  51. Walz, U. Indicators to monitor the structural diversity of landscapes. Ecol. Model. 2015, 295, 88–106. [Google Scholar] [CrossRef]
  52. Saaty, T.L. The Analytic Hierarchy Process; McGrawHill: New York, NY, USA, 1980. [Google Scholar]
  53. Ishizaka, A.; Labib, A. Review of the main developments in the analytic hierarchy process. Expert Syst. Appl. 2011, 38, 14336–14345. [Google Scholar] [CrossRef] [Green Version]
  54. Yu, X.; Wu, K.N.; Yun, W.J.; Wei, H.B.; Liu, L.; Song, Y.H.; Gao, X. Analysis on temporal and spatial variation of landscape ecological security in modern agricultural area. Trans. Chin. Soc. Agric. Eng. 2016, 32, 253–259. (In Chinese) [Google Scholar]
  55. Anselin, L. Spatial Econometrics: Methods and Models; Springer: Dordrecht, The Netherlands, 1988. [Google Scholar]
  56. Getis, A.; Ord, J.K. The Analysis of Spatial Association by Use of Distance Statistics. Geogr. Anal. 1992, 24, 189–206. [Google Scholar] [CrossRef]
  57. Deng, L.; Liu, G.B.; Shangguan, Z.P. Land-use conversion and changing soil carbon stocks in China’s ‘Grain-for-Green’ Program: A synthesis. Glob. Chang. Biol. 2015, 20, 3544–3556. [Google Scholar] [CrossRef] [PubMed]
  58. Cao, S.X.; Chen, L.; Yu, X.X. Impact of China’s Grain for Green Project on the landscape of vulnerable arid and semi-arid agricultural regions: A case study in northern Shaanxi Province. J. Appl. Ecol. 2009, 46, 536–543. (In Chinese) [Google Scholar] [CrossRef]
  59. Mockrin, H.M.; Locke, D.H.; Stewart, S.I.; Hammer, R.B.; Radeloff, V.C. Forests, houses, or both? Relationships between land cover, housing characteristics, and resident socioeconomic status across ecoregions. J. Environ. Manag. 2019, 234, 464–475. [Google Scholar] [CrossRef] [PubMed]
  60. Dadashpoor, H.; Azizi, P.; Moghadasi, M. Land use change, urbanization, and change in landscape pattern in a metropolitan area. Sci. Total Environ. 2019, 655, 707–719. [Google Scholar] [CrossRef] [PubMed]
Figure 1. Location of the study area.
Sustainability 11 06203 g001
Figure 2. Land use changes from 1996 to 2015.
Sustainability 11 06203 g002
Figure 3. Maps of land use transition probability matrices during the 1996–2009 and 2009–2015 periods.
Sustainability 11 06203 g003
Figure 4. Classification of landscape ecological risk levels of ecological land in the study area.
Sustainability 11 06203 g004
Figure 5. Variations in ELER (a, b) and hot spot analysis (c) in the study area.
Sustainability 11 06203 g005
Figure 6. Spatial distribution of ELER’s regression coefficients of (a) elevation, (b) slope, (c) vegetation coverage, (d) proportion of rural residential area, (e) per capita construction land area, and (f) ratio of cultivated land area to residential area.
Sustainability 11 06203 g006
Table 1. Land use reclassification based on the “Current Land Use Classification System”.
Land Use TypeAbbreviationSecondary-Class
Cultivated landCLPaddy land, rainfed land, and irrigated land
Forest landFLWoodland, shrubwood land, and other forest land
GrasslandGNatural meadow, artificial meadow, and other grassland
WaterWRiver, lake, reservoir, pond, and tidal flat
Other ecological landOELSaline–alkaline land, sandy land, bare land, and marshland
Urban and rural construction landURCLUrban built-up area, rural residential land, transportation land, industrial land, and mining land.
Table 2. Landscape metrics of fragmentation index and descriptions.
Landscape metricFormulaWeightDescription
PD
(Patch density)
P D = N / A 0.14where PD is the patch numbers per unit area, N is the total number of ecological land patches, and A is the total area of ecological land. The higher the value, the greater the fragmentation degree of the landscape.
ED
(Edge density)
E D = E / A 0.14where ED is the total boundary length per unit area, E is the total length of the ecological land patch boundary, and A is the total ecological land area. The higher the value, the greater the fragmentation degree of the landscape.
LSI
(Landscape shape index)
L S I = e min e 0.46where LSI is a metric used to measure the complexity of the ecological land patches. The variable e is the total landscape length of the ecological land. The higher the value, the greater the complexity of the landscape.
AI
(Aggregation index)
A I = [ g i i max g i i ] ( 100 ) 0.26where AI is the aggregation index and gii is the number of similar adjacent patches. The lower the value, the greater the complexity of the landscape.
Table 3. Description and statistical analysis of explanatory variables.
LayerVariableDescriptionStatistics
ToleranceVIF
Basic Natural ElementsElevation (X1)The distance from a point along the plumb line to the absolute base plane (m)0.3073.256
Slope (X2)The ratio of vertical height to horizontal distance of a slope0.2683.726
Water resource (X3)Water area within the grid cell/area of the grid cell0.3462.887
Vegetation coverage (X4)The percentage of vertical projected area of vegetation on the ground (%)0.2813.559
Urbanization IndicatorsPopulation density (X5)Population within the grid cell/area of the grid cell (person/km2)0.3073.255
Proportion of rural residential area (X6)Rural residential area within the grid cell/area of the grid cell0.2374.228
Density of road network (X7)Road area within the grid cell/area of the grid cell0.5631.778
Per capita construction land area (X8)Construction land area within the grid cell/total population within the grid cell (km2/person)0.3932.546
Grain Production ConditionsRatio of cultivated land area to residential area (X9)Residential area within the grid cell/cultivated land area within the grid cell0.5911.692
Per capita cultivated land area (X10)Cultivated land area within the grid cell/total number of population within the grid cell (km2/person)0.3173.157
Table 4. Statistical table for ELER assessment.
Level199620092015
NumberProportion (%)NumberProportion (%)NumberProportion (%)
Level I (<0.5)465.07454.96465.07
Level II (0.5–0.7)31434.5821323.4621423.57
Level III (0.7–0.9)38742.6246451.1046350.99
Level IV (>0.9)16117.7318620.4818520.37
Table 5. Regression coefficient statistics of explanatory variables.
VariableMin ValueLower QuartileMid ValueUpper QuartileMax Value
Elevation (X1)−0.5012−0.1082−0.04600.00920.1231
Slope (X2)−0.13830.05210.10310.18600.6827
Vegetation coverage (X4)−0.1806−0.0472−0.00780.01840.2352
Proportion of rural residential area (X6)−1.4075−0.1670−0.0745−0.02280.1819
Per capita construction land area (X8)−0.0802−0.00700.02930.06330.4038
Ratio of cultivated land area to residential area (X9)−0.1248−0.02340.00490.03910.5780

